US4942303A - Computer controlled fluorometer device and method of operating same - Google Patents
Computer controlled fluorometer device and method of operating same Download PDFInfo
- Publication number
- US4942303A US4942303A US07/304,273 US30427389A US4942303A US 4942303 A US4942303 A US 4942303A US 30427389 A US30427389 A US 30427389A US 4942303 A US4942303 A US 4942303A
- Authority
- US
- United States
- Prior art keywords
- flash
- probe
- pump
- flashes
- fluorescence
- Prior art date
- Legal status (The legal status is an assumption and is not a legal conclusion. Google has not performed a legal analysis and makes no representation as to the accuracy of the status listed.)
- Expired - Lifetime
Links
Images


Classifications
-
- G—PHYSICS
- G01—MEASURING; TESTING
- G01N—INVESTIGATING OR ANALYSING MATERIALS BY DETERMINING THEIR CHEMICAL OR PHYSICAL PROPERTIES
- G01N21/00—Investigating or analysing materials by the use of optical means, i.e. using sub-millimetre waves, infrared, visible or ultraviolet light
- G01N21/62—Systems in which the material investigated is excited whereby it emits light or causes a change in wavelength of the incident light
- G01N21/63—Systems in which the material investigated is excited whereby it emits light or causes a change in wavelength of the incident light optically excited
- G01N21/64—Fluorescence; Phosphorescence
- G01N21/645—Specially adapted constructive features of fluorimeters
-
- G—PHYSICS
- G01—MEASURING; TESTING
- G01N—INVESTIGATING OR ANALYSING MATERIALS BY DETERMINING THEIR CHEMICAL OR PHYSICAL PROPERTIES
- G01N21/00—Investigating or analysing materials by the use of optical means, i.e. using sub-millimetre waves, infrared, visible or ultraviolet light
- G01N21/62—Systems in which the material investigated is excited whereby it emits light or causes a change in wavelength of the incident light
- G01N21/63—Systems in which the material investigated is excited whereby it emits light or causes a change in wavelength of the incident light optically excited
- G01N21/64—Fluorescence; Phosphorescence
- G01N21/6486—Measuring fluorescence of biological material, e.g. DNA, RNA, cells
-
- G—PHYSICS
- G01—MEASURING; TESTING
- G01N—INVESTIGATING OR ANALYSING MATERIALS BY DETERMINING THEIR CHEMICAL OR PHYSICAL PROPERTIES
- G01N21/00—Investigating or analysing materials by the use of optical means, i.e. using sub-millimetre waves, infrared, visible or ultraviolet light
- G01N21/62—Systems in which the material investigated is excited whereby it emits light or causes a change in wavelength of the incident light
- G01N21/63—Systems in which the material investigated is excited whereby it emits light or causes a change in wavelength of the incident light optically excited
- G01N2021/635—Photosynthetic material analysis, e.g. chrorophyll
-
- G—PHYSICS
- G01—MEASURING; TESTING
- G01N—INVESTIGATING OR ANALYSING MATERIALS BY DETERMINING THEIR CHEMICAL OR PHYSICAL PROPERTIES
- G01N21/00—Investigating or analysing materials by the use of optical means, i.e. using sub-millimetre waves, infrared, visible or ultraviolet light
- G01N21/62—Systems in which the material investigated is excited whereby it emits light or causes a change in wavelength of the incident light
- G01N21/63—Systems in which the material investigated is excited whereby it emits light or causes a change in wavelength of the incident light optically excited
- G01N21/64—Fluorescence; Phosphorescence
- G01N21/6408—Fluorescence; Phosphorescence with measurement of decay time, time resolved fluorescence
- G01N2021/6415—Fluorescence; Phosphorescence with measurement of decay time, time resolved fluorescence with two excitations, e.g. strong pump/probe flash
-
- G—PHYSICS
- G01—MEASURING; TESTING
- G01N—INVESTIGATING OR ANALYSING MATERIALS BY DETERMINING THEIR CHEMICAL OR PHYSICAL PROPERTIES
- G01N2201/00—Features of devices classified in G01N21/00
- G01N2201/02—Mechanical
- G01N2201/021—Special mounting in general
- G01N2201/0218—Submersible, submarine
-
- G—PHYSICS
- G01—MEASURING; TESTING
- G01N—INVESTIGATING OR ANALYSING MATERIALS BY DETERMINING THEIR CHEMICAL OR PHYSICAL PROPERTIES
- G01N2201/00—Features of devices classified in G01N21/00
- G01N2201/06—Illumination; Optics
- G01N2201/069—Supply of sources
- G01N2201/0696—Pulsed
Definitions
- a primary object of the present invention is to provide a programmable, computer controlled fluorometer device that is operable to readily provide a number of different measurements of photosynthetic activity, by means of precisely following changes in fluorescence yield of relatively weak probe light, preceding and succeeding a stronger actinic pump flash of light.
- Another object of the invention is to provide a conveniently portable and submersible version of such a fluorometer device to enable the taking of such measurements from submerged plants and phytoplankton.
- Yet another object of the invention is to permit such an operable fluorometer device to use programmable commands, readily variable pump and probe flash intensities and increments, and readily variable delays in sequences of pump and probe flashes, in order to afford measurement of maximum fluorescence yields, optical absorption cross sections, and turnover times of photosynthetic samples under either darkness or ambient irradiance conditions.
- Still another object of the invention is to provide a fluorometer device that can independently measure cross sections and turnover times of photosynthetic organisms under their normal ambient conditions, such as in undersea environments.
- a further object of the invention is to enable measurement of such photosynthetic parameters of plants and phytoplankton as level of variable fluorescence, absorption cross-section of Photosystem II, turnover time of photosynthesis, and estimation of the energy transfer among the Photosystem II units. Additionally, the invention will enable measurement of the on-going photosynthetic production rates under ambient light conditions.
- Yet another object of the invention is to provide a submersible instrument that enables the same measurements to be done in situ, in the ocean. Additionally, application of the device should allow estimation of the relative growth rates of phytoplankton.
- the disclosed preferred embodiment of a fluorometer instrument comprises two sources of excitation light, four detector channels, a data acquisition module, and a single board computer.
- One of the excitation lights provides a short "pump” flash of an intensity that is controlled from zero to the level of saturation of Photosystem II.
- the second light source provides a "probe” flash of an intensity that is attenuated to 0.5% of the saturating pump flash.
- Detector channels are used to measure the fluorescence signal, intensity of the pump and probe flashes, and intensity of the ambient Photosynthetic Active Radiation (PAR) present in the sunlight irradiance.
- the data acquisition module is used for conditioning of the detector signals and converting them to a digital form.
- the submersible version of the disclosed fluorometer also accommodates signals from associated temperature and depth sensors.
- a single-board computer controls the operation of the fluorometer, stores the data in its internal memory, and performs desired data analysis. The device will be further described in reference to FIG. 1.
- the instrument of the invention because of the special design of the signal conditioning unit, allows measurement at chlorophyll concentration as low as 0.05 ⁇ g/l.
- the instrument of the invention because of using the cylindrical mirror around the sample chamber, allows significant (up to five times) reduction in the required energy of the pump and the probe flash.
- the instrument of the invention because of using the beam splitter in the optical design and the two chamber concept, allows simultaneous measurement of the phytoplankton photosynthetic parameters, both in the dark and when exposed to the light.
- the method of the invention allows measuring of the photosynthetic production rates of plants and phytoplankton in situ in the ocean. It allows an instant profiling of the production rates along the water column.
- the 14C method as an alternative to the disclosed method, requires about 6 hours of incubation and can be done only for discrete, bottled samples. Additionally, the bottled phytoplankton is cut off from the nutrient flux and experiences different intensity and spectral quality of the light.
- the other method using a passive fluorescence sensor (Biospherical), cannot account for the variability in the photosynthetic potential of the phytoplankton (variability of ⁇ sat in the range of 0.3 to 1.8), cannot account for quenching effects that can modify the fluorescence yield by as much as 300%, cannot account for the presence of the pheopigment, and requires the assumptions that the absorption cross section of photo system II (PSII) is constant along the water column, and the turnover time for photosynthesis does not change with irradiance. The two last assumptions are wrong.
- PSII photo system II
- the method of the invention described in section 3e allows measuring of the phytoplankton relative growth rate and monitoring the nutrient status of the phytoplankton.
- FIG. 1 is a schematic circuit diagram of a computer controlled fluorometer device constructed and arranged according to the invention.
- FIG. 2 is a schematic circuit diagram of the signal conditioning unit subcircuit shown in FIG. 1.
- FIG. 3 is a schematic circuit diagram that illustrates a windowed sample cavity for use in connection with the type of device illustrated in FIG. 1, and illustrated in relation to input beam means and output beam detectors.
- FIG. 4 is a schematic side elevation planview of a portion of an alternative embodiment of the inventive device shown in FIGS. 1 and 3, wherein a dual-windowed sample-cavitied configuration of the invention is depicted.
- FIG. 5 is a schematic top plan view of the dual-windowed and double-cavitied alternative embodiment of the invention illustrated in FIG. 4.
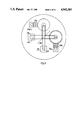
- FIG. 6 is a top plan view of the window and sample cavity shown in FIG. 3.
- FIGS. 7 and 8 are matching parts of a flow diagram chart of the operation of the fluorometer device of the invention.
- FIG. 9 illustrates an example of the relation between ⁇ sat and the growth rate for three species of marine phytoplankton, which are named in this Figure.
- FIG. 10 illustrates experimental data obtained with the subject invention, plotted for saturation curves of fluorescence yield.
- FIG. 11 illustrates example curves of the decay kinetics of fluorescence yield achieved with the preferred embodiment of the invention.
- FIG. 12 illustrates an example of the fluorescence estimation of production rates in the sea, in situ, as compared wit the 14C method.
- FIG. 13 is two charts that illustrate a comparison between relative growth rate of phytoplankton as estimated with the method of the subject invention, and the chlorophyll concentration as recorded in the Gulf of Maine.
- the energy of a pump flash is controlled by associated software.
- a microprocessor in the form of a single-board computer (SBC) 1 is controlled by program software, which is more fully described in sub-section A, Control Program, below.
- SBC 1 is operatively connected by a conventional multi-conductor cable 1a to a conventional computer operator's terminal 2, and by a second cable 1b to a host computer 3 that is operable to process and store measurement data. Further description of all of these computer related components of the disclosed device is given below, in sub-section 1.
- the digital signal representing the energy of the pump flash is sent from a suitable commercially available computer means including the microprocessor or single board computer (SBC) 1, which has a memory, via a data and address bus 4 to a digital/analog converter (D/A) 6.
- SBC microprocessor or single board computer
- D/A digital/analog converter
- An appropriate D/A converter for the applications of the preferred embodiment should feature a C-MOS technology for low power consumption and digital interface that allows a direct connection to be made to the processor bus 4.
- Such converters are commercially available, e.g. as either 7226 or 7528 type from either Analog Devices or Precision Monolithic Corporation.
- the analog representation of the pump flash energy is sent to a high voltage power supply 8 on a conductor wire 7.
- a suitable high voltage power supply for this use can be designed by one skilled in the art as a voltage controlled fly-back voltage converter, or may be purchased from such vendors as EG&G (model PS-350), or Del Electronics Corp. (model PMS 1--1).
- the high voltage converter 8 charges a storage capacitor 8a to a voltage V that is proportional to the analog signal present on wire 7.
- the capacitance of the storage capacitor should be in the range 1 to 2 ⁇ F, and have a voltage rating in the range 1.5 to 2 kV.
- a storage capacitor specially designed for the pulse discharge application of the preferred embodiment can be purchased from either High Energy Corp., CSI Capacitors, or DEL Electronics Corp.
- the storage capacitor 8a discharges through a xenon flashlamp 10, which results in a short, strong flash.
- the flashlamp with a suitable socket 11 can be purchased from EG ⁇ G (preferred model 12B1.5, socket FY-904), or from Hamamatsu (preferred model L2453, socket E2454).
- EG ⁇ G preferred model 12B1.5, socket FY-904
- Hamamatsu preferred model L2453, socket E2454
- At maximum flash energy corresponding to about 2 ⁇ 10 15 quanta cm -2 the half-peak duration of the pump flash is about 1.6 ⁇ sec.
- the timing of the pump flash is controlled by a timer (not shown) included in the SBC by sending a short, 2 ⁇ sec.
- the flashlamp triggering circuit 8b which can be designed by one skilled in the art using a thyristor as a switching device, or by using the triggering circuit in an EG&G PS-350 power supply.
- the preferred embodiment of the disclosed submersible fluorometer employs the first solution, in order to satisfy the smaller space requirements.
- the triggering pulse is sent to the flashlamp socket on wire 11a.
- the condenser 12 can be designed by one skilled in the art using a set of short focal length lenses. In the disclosed fluorometer the condenser is built from three short focal length lenses with a 45 mm outside diameter. The first lens is an aspheric one. The collimating lens is a double convex one. Lenses are commercially available from Edmund Scientific Co.
- the excitation filter 14 is a combination of the Corning 4-76 and 4-96 glass filter. The collimated blue-green light is bent 90 degrees by a flat first surface mirror 21, and then hits a sample chamber 16.
- the first surface mirror is available from Edmund Scientific Co.
- the sample chamber contains a glass cuvette (not shown).
- the sample chamber (16) is designed in the form of a cylindrical window 72 with a cavity 71 in the center (FIG. 3).
- the source 17 of the probe flash may be designed in essentially the same way as the pump flash, by using a high voltage power supplier, storage capacitor, and a xenon flashlamp (which are not individually shown, but are used in source 17).
- the probe flash may be provided by a set of blue light emitting diodes (type LDB5410 from Siemens), or by a solid-state laser diode emitting in the range of 900-1200 nm (nanometers) with frequency doubling.
- the condenser 18 and collimation lens 19 that are fed from the probe flash source 17 are the same types as those used with the pump beam.
- a set of probe beam excitation filters 20 is made from Corning 4-76 and Corning 4-96 filter elements, and from two sharp cut-off interference filters blocking light wavelengths above 550 nm.
- the interference filters can be purchased from Corion, type LS-550F.
- the probe beam is bent 90 degrees by a first surface mirror 22 and hits the sample chamber 16 on the side thereof opposite to the entrance for the pump beam.
- the intensities of the pump and probe flashes are monitored, by photodiodes 23 and 24, respectively, placed behind the mirrors 21 and 22, and are exposed to a fraction of the excitation beams through pinholes 21a and 22a, respectively, scratched on the surfaces of the mirrors.
- Suitable photodiodes can be purchased from Hamamatsu, EG&G, or United Detector Technology.
- the photodiode used in the disclosed fluorometer is Hamamatsu S2386-5K.
- the signals from the photodiodes 23 and 24 are delivered to the signal conditioning unit 25 using shielded cables 26b and 26a, as shown in FIG. 1.
- Fluorescence light that is emitted from a selected specimen or test sample (not shown) in the sample chamber 16 is collected by the condenser lens system 27, then passes through a system of emission filters 28, and strikes a fluorescence detector 29a.
- the condenser lens system 27 is built from a set of conventional aspheric and plano-convex lenses and can be easily assembled by one skilled in the art.
- the emission filters 28 consist of two 670 nm cut-off filters, type LG670 from Corion, arranged in series with two 685 nm bandpass interference filters from MicroCoatings, Inc.
- the detector used (29a) includes a photomultiplier (PMT) with a photocathode of the multi-alkali type, which has high quantum efficiency at 685 nm.
- PMT photomultiplier
- a Hamamatsu R2066 PMT was used.
- a miniature type Hamamatsu R1463 PMT was used.
- the high voltage for the photomultiplier is provided by a Hamamatsu C2456 subminiature modular power supply 29b (HV).
- HV Hamamatsu C2456 subminiature modular power supply 29b
- the gain of the photomultiplier is controlled by varying the high voltage from the HV power supply 29b in the range of 650-1100 volts, using the voltage control input in power supply 29b.
- the controlling voltage in the range 0 to 1.5V is provided by a digital to analog converter 30 (D/A) (Analog Devices AD7226).
- D/A digital to analog converter 30
- the signal from the photomultiplier 29a is delivered to the signal conditioning unit 25 by a shielded cable 29c. For good noise performance this cable should be as short as possible.
- the preferred embodiment of the fluorometer is equipped with a PAR sensor 36.
- the sensor can be designed by one skilled in the art and using a photodiode with a blue interference bandpass filter, or may be purchased from Biospherical, Inc.
- the signal from the PAR sensor is processed by a conventional current/voltage converter 37, based on an Analog Devices AD515 amplifier featuring 0.075 PA bias current.
- the output voltage signal from converter 37 is multiplexed by suitable multiplexer 38 (MUX) (Analog Devices AD7501), then amplified and sampled in the programmable gain amplifier 39 (PGA) based on Analog Devices AD365, and converted to the digital form by an A/D converter 40 (Analog Devices AD7572).
- MUX multiplexer 38
- PGA programmable gain amplifier
- the preferred embodiment of a submersible version of the fluorometer is also equipped with a commercially available submersible temperature sensor 41 and a depth sensor 43.
- the temperature sensor used is a Sea Bird model SB3-01/F.
- the signal from the temperature sensor is converted from frequency to voltage using Analog Devices ADVFC32 frequency to voltage converter 42, and is then processed in a way similar to that used to process the PAR signal (from 36).
- the depth sensor 43 used is a DS-500 model from Data Instruments.
- the current loop signal from the depth sensor is converted to voltage signal using converter amplifier 44 (OP 27 from Analog Devices or Precision Monolithic), and is then processed by a method similar to that used for processing the temperature signal.
- the operations of the PAR, temperature, and depth measurements are controlled by timing and gain control signals from the SBC 1 on line 45, connected as shown in FIG. 1.
- the disclosed fluorometer is equipped with a software programmable source of background irradiance.
- the digital representation of the background irradiance signal is transmitted from SBC 1 over line 4 and is converted to an analog form in the D/A converter 31 (type AD7226 from Analog Devices).
- the output signal from that D/A converter controls a current source 32, which drives a light emitting diode 33.
- the background irradiance emitted by the diode 33 [or a set (not further shown) of such light emitting diodes, in given embodiments] is directed into the top of the sample chamber 16, as is indicated by the wavy lines over chamber 16, in FIG. 1.
- the spectral quality of the background irradiance can be controlled by providing several sections of the current source 32 with suitable conventional diodes that emit light of different colors. Thus, a set of diodes (not shown) could be used (for 33).
- the current source can be designed by one skilled in the art, using a MOSFET, HEXSense type power transistor, the preferred type being IRCZ24 from International Rectifier.
- the disclosed fluorometer is also equipped with a circuit for controlling a peristaltic pump 34 which allows measurements in a flow-through system.
- the circuit uses a solid-state relay 35 of a type commercially available from Teledyne or National Control Corp.
- the solid-state relay is controlled by a digital signal from the SBC 1, which is transmitting to it on line 35a.
- the role of the signal conditioning unit 25 is to accommodate the signal from photodetectors 23, 24, and 29a, and to convert these signals to digital form.
- the operation of the signal conditioning unit is controlled by SBC 1 through control line 25a.
- a schematic block diagram of the unit 25 is shown in FIG. 2.
- two matched operational amplifiers, 51 and 52 (FIG. 2), are used.
- a type OP-17 amplifier, by Analog Devices or Precision Monolithic is used.
- the input of amplifier 51 is connected to the output of the photomultiplier (PMT) 29a at a terminal line 29c.
- the input of amplifier 52 is connected through a conventional resistor R and capacitor C, as shown, to ground, and the positive terminals of both amplifiers 51 and 52 are similarly grounded through suitable resistors as shown.
- a pair of analog switches 51a and 52a respectively, shunt through 10K ohm resistors (51c and 52c) the 1 Megaohm resistors 51b and 52b when a pump flash is present. This results in a low voltage/current gain by amplifier 51, which prevents its over-saturation during the pump flash.
- the type of analog switch used in the preferred embodiment is an ADG202A switch from Analog Devices.
- switches 51a and 52a are reopened 30 ⁇ s after the pump flash, thereby increasing the current/voltage gain to a level that allows detection of the fluorescence yield from a sample during a low intensity probe flash.
- the operation of switches 51a and 52a is controlled by a timing signal from SBC 1 on wire 50.
- a side effect of the opening of switches 51a and 52a is a charge insertion to the input of amplifiers 51 and 52, which results in a voltage transient at their outputs.
- These voltage transients because of their low bandwidth at switch-off condition, have a long decay time.
- Amplifier 52 will show only the presence of the transient signal.
- the transient signal on both amplifiers will be the same. This common signal is later cancelled in the amplifier 53 (which is an Analog Devices type OP-27) by subtracting the signal of amplifier 52 from the signal of amplifier 51.
- variable gain amplifier 54 in order to accommodate a wide dynamic range of the fluorescence signal.
- the type of variable gain amplifier 54 used in the preferred embodiment is AD526, from Analog Devices.
- the gain of the amplifier 54 (and that of PGA, 60) is controlled from SBC 1 over line 25a.
- the signal is attenuated by a resistive divider circuit 55, amplified by an amplifier 56 and converted to digital form by a flash A/D converter 57.
- the amplifier 56 should have a very large bandwidth and high output current in order to properly drive the flash A/D converter.
- the type used in the disclosed fluorometer is a CLC401 from Comlinear Corp.
- the choice of the flash A/D converter should satisfy the required conversion speed, resolution, and power consumption for a selected application.
- a CA3306C from RCA is used for the converter 57, which features a 15 MHz conversion rate, 6 bit resolution, and about 80 milliwatts/active of power consumption.
- the conversion rate is controlled by a conventional clock generator 65, which can be easily designed by one skilled in the art.
- the digital signal from converter 57 is supplied to the input A (in FIG. 2) of a Multiplier and Accumulator (MAC) 58.
- MAC 58 and a similar MAC 64 are type LMA1009 from Logic Devices, Inc. in the preferred embodiment.
- the signal from diodes 23 and 24 (which appear on lines 26b and 26a at the pump and probe energy monitoring terminals shown in FIG. 2) are processed through amplifier 59 in a way similar to that used to process the fluorescence signal, with the only difference being that the amplifier 59 does not require switched gain.
- the pump and probe monitoring signals are supplied through variable gain amplifier (PGA) 60, resistive divider 61, amplifier 62, and A/D converter 63 to the input B of the MAC 58; and to both inputs A and B of MAC 64.
- the two MAC's are programmed over control lines 25a. Depending on the desired system requirement, either of the two different modes of operation may be employed.
- the MAC's 64 and 58 output registers.
- the input signal is digitally integrated.
- the integration process assures that the energy, not just the amplitude, of the measured signals is recorded.
- the MAC's are programmed to store the cumulative product of signals on their inputs A and B. Accordingly, the operation of the MAC 58 is described as ##EQU1## and the operation of MAC 64 is described as ##EQU2## where signals f(i) and p(i) are, respectively, the digital representations of the fluorescence and excitation signals during the i-th conversion.
- the Kfp and Kpp signals are sent to the SBC 1 through a data bus 4, where the division of Kfp and Kpp yields a Kf signal, where ##EQU3##
- the Kf signal is then the result of the least squares fit of the fluorescence signal to the probe excitation signal, with the amplitude of the fluorescence signal as the sought parameter.
- the probe excitation signal on photodiode 24 (FIG. 1) is several orders of magnitude larger than the fluorescence signal, it is practically noise-free and can be used as a pattern for the fluorescence signal.
- the disclosed procedure enables a 5- to 10-fold increase in the signal to noise ratio in case of low chlorophyll concentration in the range of 0.05 to 0.5 ⁇ gram/liter.
- a simpler signal conditioning unit based on peak detection of the Photodiode and photomultiplier signals and direct analog/digital conversion, using a conventional A/D converter, can be easily designed by one skilled in the art.
- use of a charge-sensitive amplifier instead of the standard current conversion in the fluorescence channel is preferred.
- Charge-sensitive amplifiers feature low noise and fast recovery from over saturation (in the preferred embodiment, a model A-225 from Amptek may be used).
- Such a solution will suffer from lower signal to noise ratio, especially at low chlorophyll concentration, and it will suffer from inappropriate representation of the pump and probe flash energy.
- the chamber 16 has a cylindrical cavity 71 formed in a round window 72 that is made from a conventional translucent cast acrylic material.
- the window is fitted to a hole in the endcap 73 of a suitable conventional underwater housing 74 and is sealed by a set of two 0-rings 82.
- the probe beam 77 passing through filter 20 (also see FIG. 1), is bent 90 degrees by the first surface mirror 22 and enters the sample chamber 16 through the side of window 72.
- the pump beam 76 enters the sample chamber 16 through its bottom wall (being different in this respect from the arrangement shown in FIG.
- the fluorescence beam leaves the sample chamber from its left side. After being collimated by a set of two cylindrical lenses 78 (available from Melles Griot), the fluorescence beam is bent 90 degrees by a first surface mirror 79, then it passes the set of emission filters 28 and strikes the photomultiplier 29a. The location of the fluorescence exit port on the side of the sample chamber is essential for the proper measurement of the fluorescence yield signal under sunlight irradiance.
- the fluorometer operates in a vertical position, with its cavity 71 in the sample chamber facing upward, as shown in FIG. 3.
- a submersible embodiment of the disclosed fluorometer can be outfitted, if desired, with a second sample chamber (the chamber 16D) for conducting fluorescence measurements in the dark.
- the design of such a double-chamber fluorometer is partially depicted in FIG. 4.
- a dark sample chamber 16D is made similar in construction to the open chamber 16', except that its plastic window 72D is covered with an opaque cap 83 through which two pieces of pipe 84 and 85 are fastened by suitable conventional means.
- One end of both pipes extends into the cavity 71D of sample chamber 16D, as shown. Both pipes are bent 90 degrees so they are parallel to the surface of the endcap 83, and pipe 84 is bent 90 degrees to extend upward, while pipe 85 is bent 90 degrees to extend downward relative to chamber 16D.
- the optics for the double chamber configuration of the disclosed fluorometer is designed in such a way that both chambers 16' and 16D share the pump flash source and probe flash source, seen in FIG. 5, which can be analogous to the flash lamp 10, and the probe light source 17 in the embodiment illustrated in FIG. 1.
- Both the probe beam 77' and the pump beam 76' (FIG. 5) are bent 90 degrees from the direction parallel to the fluorometer housing cylindrical axis by the first surface mirrors 22' and 21', respectively.
- both beams strike a conventional beamsplitter 86.
- the beamsplitter reflects 50% of impinging incoming light and transmits the remaining 50% through its surface.
- the beams hitting the open chamber 16' and dark chamber 16D contain 50% of the original pump beam 76' and 50% of the original probe beam 77'.
- the fluorescence beams leave the sample chambers from the side, next they are collimated by sets of cylindrical lenses 78a and 78b, then are bent 90 degrees by set of the first surface mirrors 79a and 79b, and after filtering are detected by a pair of photomultipliers.
- the sample chamber 16 (or chambers, 16' and 16d) in the submersible embodiment of the disclosed fluorometer is surrounded by a cylindrical aluminum mirror 92, as shown in FIG. 6, with an opening formed therein to define an excitation port 91 and another opening therein to define an emission port 94.
- An excitation beam 90 after entering the excitation port 91, is directed toward the cavity 71 at the center of the sample chamber 16 due to a focusing effect of its cylindrical wall 72.
- a fraction of the photons in the excitation beam 90 is absorbed by the phytoplankton; however, most of them leave the sample chamber without inducing any photosynthetic effect.
- the fraction of absorbed photons can be as small as 1 ⁇ 10 -7 .
- the mirrored wall 92 directs the leaving photons (outward pointing arrows, in FIG. 6) back to the sample chamber, as shown by the inward pointing arrows, thus increasing the efficiency of light utilization in the excitation beam.
- This efficiency increasing feature of the invention enables lower power consumption in the submersible version of the disclosed fluorometer, and causes lower RF noise levels to be induced by the pump and probe flashes.
- this feature allows the employment of blue light emitting diodes as a source of the probe flash.
- the operation of the double flash fluorometer is supervised by the on-board microprocessor SBC (1) (See FIG. 1), and is completely controlled by the software run on the computer.
- the single-board computer (SBC) 1 is commercially available in STD bus standard, from such vendors as Prolog, Ziatech, Micromint, or WinSystem, or in G-64 (STE) bus standard from Gespac.
- the choice of a suitable processor, memory capacity, speed, and software tools required for a given desired application can be easily determined by those skilled in the art.
- the SBC (1) should feature a C-MOS technology for a low power consumption, DOS compatibility for easy programming, and small physical dimensions for easy packaging into a submersible enclosure (STD, or STE standard).
- the SBC should also contain a set of programmable timers, either as a separate chip (HD63B40, from Hitachi), or as an integral part of the processor chip (V-20 or V-50 from NEC). Also the SBC should contain an interrupt controller, and battery backup for C-MOS RAM memory.
- a submersible version of the disclosed device is equipped with the Winsystem MCM-SBC8, V-20 based single-board computer; whereas a non-submersible version of the disclosed instrument is equipped with a Micromint BCC52, 8052AH based single-board computer. Both feature serial ports for interfacing with an operator's terminal 2, and a host computer 3. The terminal is used for pre-programming a variety of desired series of experiments and the host computer is used for processing and storing the measurement data. In the submersible version the serial ports are accessed through an underwater connector in the submersible housing.
- the choice of the software tools for programming the SBC is determined by the type of SBC (1) used.
- the control program for the non-submersible version of the disclosed fluorometer has been written in Basic-52 (a firmware is contained in a 8052AH chip within the SBC); the program for the submersible version of the fluorometer has been written in a ROMable version of Aztec C.
- a printout of the program code in BASIC is disclosed in section C, followed by the claims.
- the source C code for controlling the submersible version of the fluorometer is structurally identical to the BASIC program. Both programs are menu-driven and allow easy pre-programming of the fluorometer by a person who need not have extensive programming skills.
- the disclosed double flash fluorometer operates in a way that enables it to measure the extent of changes of the fluorescence yield of photosystem II (PSII) in response to a pump flash.
- Application of the pump flash leads to a charge separation in a fraction of the reaction centers, and to transient reduction of the primary electron acceptor, called QA.
- the reduced OA is then oxidized at a rate corresponding to the speed of the electron transfer along the PSII and photo system I (PSI) electron transport chain. If another photon will be absorbed during the time period when QA stays reduced, then the excess of the excitation energy will be dissipated in the form of fluorescence, thereby increasing the apparent yield of the fluorescence.
- the difference in the fluorescence yield before and after the pump flash depends on the average state of the reaction centers before the pump flash, and on the energy of the pump flash.
- the average state of the reaction centers before the pump flash depends on the level of photosynthetic activity of PSII that is induced by the background irradiance. This in turn is a function of the intensity of the background light, and the efficiency of light collection by PSII.
- the pump light will activate an additional fraction of the reaction centers. The higher the energy of the actinic pump flash and the efficiency of light collection, the bigger is this fraction.
- Fs maximum value
- the fluorescence yield of PSII can be measured as the ratio of the fluorescence signal to the excitation signal under the condition that the excitation signal itself will not change the state of the reaction centers.
- Varying the intensity of the pump flash, the sequence of the probe and pump flash, and the time delay between the pump and probe flashes, a number of parameters describing the photosynthetic performance of the plants and phytoplankton can be measured with the disclosed device.
- a flow-chart of the fluorometer operation is described in FIGS. 7 and 8.
- the numbered lines at the bottom of FIG. 7 and at the top of FIG. 8 diagram the interconnections between these two parts of the flow chart.
- the steps and text of the flow chart are self explanatory.
- the fluorometer operation is pre-programmed as a sequence of experiments. Every experiment consists of a predetermined series of the probe/pump cycles of pre-programmed length. Every cycle may consist of any desired combination of the probe and pump flashes.
- the inventors have found that for many of their applications the most frequently used is a probe-pump-probe cycle. In such a case the cycle parameters are as follows:
- the increment factors are a convenient way of pre-programming the instrument operations in experiments, such as taking measurements of the decay kinetics of PSII, measurements of the absorption cross section of PSII or, in some kinetics experiments, requiring on-fly modification of the fluorometer parameters.
- the fluorometer operation pertaining to different types of experiments is described below in sections 3a through 3e.
- the range of the variability of the fluorescence yield, ⁇ sat is a measure of the photosynthetic potential of the plants and phytoplankton. It is defined as a relative difference of the fluorescence yield in a state when all reaction centers are closed (Fs), and in a state when all reaction centers are open (Fo): ##EQU4## This parameter depends on the nutrient status of photosynthetic organisms, and is also affected by such stress factors as herbicides and low/high temperature. The experiment is made on a dark adapted sample, and is pre-programmed in such a way that a sequence of three flashes is generated. First, there is a probe flash, during which the amplitude of the minimal fluorescence yield, Of is recorded.
- the pump flash at a saturating intensity is applied.
- the saturating pump flash closes all the reaction centers for the subsequent 50 to 70 ⁇ sec.
- another probe flash is being applied.
- the measured yield of fluorescence corresponds to its maximum level, Fs.
- the cycle of the probe-pump-probe flashes can be preprogrammed to repeat several times, with on-line calculation of data statistics.
- ⁇ sat For healthy, nutrient-replete phytoplankton cells the ⁇ sat reaches levels in the range 1.5 to 1.7, depending on the species. For nutrient-replete cells, the ⁇ sat decrease to 0.4 depending on the extent of the nutrient starvation. Also, the phytoplankton growth rate, p, expressed as a number of cell divisions per day, decrease with nutrient starvation.
- FIG. 9 An example of the relation between ⁇ sat and growth rate for three species of marine phytoplankton is presented in FIG. 9; the three species are named in FIG. 9.
- the efficiency of light collection for photosynthesis is characterized by absorption cross section of the photosystem II, ⁇ (PSII).
- the absorption cross section is a geometrical parameter describing the effective area of the reaction center as a target for the photon flux. This parameter is species dependent, and varies according to the light and nutrient adaptation of photosynthetic organisms. In plants, the ⁇ PSII also depends on the stage of development of the organism. From the molecular point of view the ⁇ (PSII) is determined by the molecular size and pigment composition of the light harvesting complex (LHCII) serving the reaction center.
- LHCII light harvesting complex
- the measurement of ⁇ PSII consists of a series of probe-pump-probe flash cycles.
- the delay between the pump flash and the second probe flash is kept fixed at 50 to 70 ⁇ sec.
- the intensity of the pump flash is gradually increased from cycle to cycle, starting from zero and ending at saturation level.
- the fluorescence yield after the pump flash rises from its minimum value, Fo, at zero pump energy, to F s at saturating pump energy.
- the shape of the saturation curve of the fluorescence yield follows, with some exceptions, Poisson statistics:
- I is the energy of the pump flash
- ⁇ (I) is the variable fluorescence yield induced by the pump flash of energy I.
- the ⁇ PSII can then be calculated by least squares fitting the experimental saturation curve to the above expression, with ⁇ PSII and ⁇ sat being the searched parameters.
- the ⁇ PSII experiment provides a better estimate of the ⁇ sat than does the procedure described in 3a above because it is based on all of the saturation curve of fluorescence yield, instead of on only a single data point.
- the theoretical function describing the saturation curve for the fluorescence yield can be modified by adding a parameter describing the probability of energy transfer among PSII units. Fitting the experimental saturation curve of fluorescence yield to such modified function yields a measure of the energy transfer probability.
- every cycle can be repeated several times for the same pump intensity, thereby improving the signal to noise ratio.
- the length of the series, the increment of the pump energy, and the number of repetitions for a given cycle are preprogrammed from the menu-driven program.
- all the data are stored in the internal RAM memory and may be transferred to the host computer.
- the fit operation can either be done in the fluorometer single-board computer (SBC) or, more effectively, in the host computer (3).
- the absorption cross section usually increases when plants or phytoplankton adapt to low irradiance levels or to depleted nutrient conditions. On the molecular level this corresponds to an increase in the size of the light harvesting complex and an increase in the abundance of the chlorophyll b or chlorophyll c, relative to chlorophyll a.
- the probability of the energy transfer between PSII units decreases with nutrient reductions. It also decrease with background irradiance, probably because of the increased level of phosphorylation of light harvesting complex.
- the experimental saturation curves of fluorescence yield are presented in FIG. 10, which illustrates high and low nutrient conditions.
- the decay kinetics of Photosystem II provide information on the rate of electron transport along PSII.
- the process of the electron transport consists of several redox reactions involving various electron carriers. This results in a multiphasic process of oxidation of QA. Accordingly, the decay kinetics of fluorescence yield following the pump flash can be interpreted in terms of three exponential components in the dark, and four exponential components under ambient light.
- the time constant of the exponential components correspond to the rates of reduction/oxidation of electron carriers in PSII.
- the relative amplitudes of the components provide information on the pools of the electron carriers. Analysis of the decay kinetics allows identification of the rate limiting step in photosynthesis, and estimation of the overall turnover time for the photosynthesis.
- the measurement of the decay kinetics of the fluorescence yield with the disclosed device is afforded by a series of the probe-pump-probe flash cycles.
- intensity of the pump flash is kept at the saturating level, and the delay between the pump and the second probe is gradually increased starting from 50 ⁇ sec.
- the fluorescence yield measured by the second probe flash decreases in proportion to the time delay between the pump and probe flash.
- the experimental data are then fit to a multiexponential function ##EQU5## where ⁇ i is the amplitude of the i-th component, t i is the time constant of the i-th componant, and t is the time delay between the pump and the second probe flash.
- every cycle can be repeated several times for the same delay between the pump flash and the second probe flash, thereby improving the signal to noise ratio.
- the length of the series, the increment of the time delay between the pump and the second probe flash, and the number of repetitions for a given cycle is preprogrammed, as desired for a given experiment, from the menu-driven program.
- all the data are stored in the internal RAM memory and may be transferred to the host computer.
- the fit operation can either be done in the fluorometer single board computer 1 or, more effectively, in the host computer 3.
- the decay kinetics of variable fluorescence in marine phytoplankton species measured in the dark shows three components.
- the shorter one, in the range 140-170 ⁇ sec corresponds to the oxidation of QA - in QA - QB complexes, where QA is the primary electron acceptor, and QB is the secondary electron acceptor.
- a medium component, in the range of 600 to 800 ⁇ sec corresponds to the process of QA - oxidation, requiring the prior association of QA - and QB.
- a long component in the range of 100 to 300 msec, corresponds to the rate of back reaction from QA - . Under ambient light the relative amplitude of the long component decrease drastically, and another component of time constant 1.6 to 4 msec appears. This component presumably corresponds to the rate of PQ pool reduction/oxidation.
- Example curves of the decay kinetics of fluorescence yield achieved with the disclosed device are Presented in FIG. 11.
- the photosynthesis rate Rphot is assumed to be proportional to the rate of charge separation Rc, yield of electron transport from the primary electron acceptor QA to the plastoquinone pool PQ, Yt, and yield of photochemistry Yp.
- the probability of the reaction center being open is estimated from the fluorescence signals:
- the range of variability of fluorescence yield, Fs -Of, is measured as described in 3a above.
- the signal Fs-Fp can be estimated from the same measurement made under the ambient light.
- the yield of electron transport Yt depends on the rate of the charge separation, Rc, and the turnover of the water splitting enzyme, t s ##EQU6##
- the turnover time of the water splitting enzyme t s determines the ratio of electrons on QA- forced to back-react with P680+ (oxidized form of the special pair of chlorophyll forming the reaction center) in the situation when the electron donor Z remains oxidized at high rates of charge separation, comparable to the rate of Z+ reduction.
- the yield of photochemistry Yp depends on the turnover time of photochemistry t p , and on the size of the plastoquinone pool N ##EQU7##
- the turnover time of photochemistry t p determines how fast electrons will be taken from the plastoquinone pool and used for photochemistry.
- the size of the plastoquinone pool N determines the maximum length of the electron queue waiting to be served.
- Eqn. 5 describes the fraction of electrons arriving at QA that can be served by photochemistry operating at limiting rate 1/t p . As long as the rate of charge separation is lower than photochemistry rate, the yield of photochemistry Yp is close to one.
- the absorption cross section ⁇ PSII is measured as described in 3b. The average turnover time of water splitting for various species is relatively constant, and can be assumed to be about 200 ⁇ s.
- the t p parameter may be estimated from the measurement of the decay kinetics of variable fluorescence as described in 3.c, or from relation between the measured ⁇ sat and I. ⁇ PSII.
- the irradiance level I is measured by the PAR sensor.
- the parameter a is a stoichiometric coefficient describing the required number of photons absorbed by PSII per atom of carbon fixed and it ranges from 10 to 12.
- N II is the concentration of reaction centers and can be estimated from the intensity of the fluorescience signals Fp or Fs.
- the parameter ⁇ sat is calculated from Fs, Fp, and Fo fluorescence yield recorded by the two- chamber submersible fluorometer, as described in 3.a. The ⁇ sat characterizes the photosynthetic capacity of measured species, and is strongly dependent on the nutrient regime, changing from 0.3 to 1.7.
- ⁇ sat is the actual measured parameter, as described in subsection 3a., which depending on the nutrient conditions varies from 0.3 to 1.7, and ⁇ max is the same parameter for species grown under nutrient-replete conditions, ranging from 1.5 to 1.7.
- the ⁇ / ⁇ max is the relative growth rate under the actual nutrient conditions ranging from 0 to 1.
- the parameter k is very little species specific, and averages 3.5.
- ⁇ sat The measurement of ⁇ sat is done using either the double-chamber version of the submersible fluorometer, or using the non-submersible fluorometer. In the latter case only the discrete depths will be characterized.
Abstract
Description
Δφ(I)/Δφ.sub.sat =1-exp(-I.σPSII),
Rphot=k·Rc·Yt·Yp. (1)
Rc=Hr·A=I·σPSII·A. (2)
A=(Fs-Fp)/Fs-Fo). (3)
k=a·N.sub.II ·Δφ.sub.sat (6)
Δφ.sub.sat =Δφ.sub.max ·[1-exp(-k·μ/μ.sub.max)],
Claims (14)
Priority Applications (1)
| Application Number | Priority Date | Filing Date | Title |
|---|---|---|---|
| US07/304,273 US4942303A (en) | 1989-01-31 | 1989-01-31 | Computer controlled fluorometer device and method of operating same |
Applications Claiming Priority (1)
| Application Number | Priority Date | Filing Date | Title |
|---|---|---|---|
| US07/304,273 US4942303A (en) | 1989-01-31 | 1989-01-31 | Computer controlled fluorometer device and method of operating same |
Publications (1)
| Publication Number | Publication Date |
|---|---|
| US4942303A true US4942303A (en) | 1990-07-17 |
Family
ID=23175801
Family Applications (1)
| Application Number | Title | Priority Date | Filing Date |
|---|---|---|---|
| US07/304,273 Expired - Lifetime US4942303A (en) | 1989-01-31 | 1989-01-31 | Computer controlled fluorometer device and method of operating same |
Country Status (1)
| Country | Link |
|---|---|
| US (1) | US4942303A (en) |
Cited By (29)
| Publication number | Priority date | Publication date | Assignee | Title |
|---|---|---|---|---|
| WO1993019568A1 (en) * | 1992-03-20 | 1993-09-30 | Unisyn | Flashing light system and method for enhancing algae photosynthesis |
| US5304492A (en) * | 1991-11-26 | 1994-04-19 | The State Of Oregon Acting By And Through The State Board Of Higher Education On Behalf Of Oregon State University | Spectrophotometer for chemical analyses of fluids |
| EP0654662A1 (en) * | 1993-10-08 | 1995-05-24 | Forschungszentrum Karlsruhe GmbH | Instrument for detecting photosystem II herbicides |
| US5589351A (en) * | 1994-12-06 | 1996-12-31 | Nps Pharmaceuticals, Inc. | Fluorescence detection apparatus |
| US5604582A (en) * | 1994-05-12 | 1997-02-18 | Science Application International Corporation | Methods and apparatus for taking spectroscopic measurements of sediment layers beneath a body of water |
| EP0840114A2 (en) * | 1996-10-31 | 1998-05-06 | Fuji Photo Film Co., Ltd. | Image Producing Apparatus |
| EP0876592A1 (en) * | 1996-01-23 | 1998-11-11 | John T. S. Lee | Device and method for detection/measurement of light |
| US5894347A (en) * | 1997-06-16 | 1999-04-13 | Johnson & Johnson Clinical Diagnostics, Inc. | Fluorimeter and detection method |
| US5929453A (en) * | 1997-06-03 | 1999-07-27 | The United States Of America As Represented By The Secretary Of The Navy | Underwater spectroscopic detector |
| US6100093A (en) * | 1996-04-15 | 2000-08-08 | Instituut Voor Agrotechnologisch Onderzoek (Ato-Dlo) | Method and system for determining the quality of a crop |
| US6121053A (en) * | 1997-12-10 | 2000-09-19 | Brookhaven Science Associates | Multiple protocol fluorometer and method |
| US6232608B1 (en) * | 1998-08-18 | 2001-05-15 | Molecular Devices Corporation | Optimization systems in a scanning fluorometer |
| WO2002066975A2 (en) * | 2001-01-31 | 2002-08-29 | Ut-Battelle, Llc | Tissue-based water quality biosensors for detecting chemical warfare agents |
| US6649417B2 (en) | 2000-08-21 | 2003-11-18 | Ut-Battelle, Llc | Tissue-based standoff biosensors for detecting chemical warfare agents |
| US20040012780A1 (en) * | 2000-09-27 | 2004-01-22 | Shiv Sharma | Measurement of fluorescence decay times |
| US20050084418A1 (en) * | 2003-10-20 | 2005-04-21 | Hill David E. | Freeze resistant buoy system |
| US20050084419A1 (en) * | 2003-10-20 | 2005-04-21 | Hill David E. | Enhanced monitor system for water protection |
| US7301158B1 (en) * | 2004-12-15 | 2007-11-27 | Turner Designs, Inc. | Method and apparatus for measuring active fluorescence |
| WO2008033057A2 (en) * | 2006-09-13 | 2008-03-20 | Limited Company 'gene And Cell Therapy' | Method for fluorometrically determining photosynthesis parameters of photoautotropic organisms, device for carrying out said method and a mesurment chamber |
| US7470917B1 (en) * | 2004-12-15 | 2008-12-30 | Turner Designs, Inc. | Submersible apparatus for measuring active fluorescence |
| US20100159496A1 (en) * | 2006-02-20 | 2010-06-24 | Hamamatsu Photonics K.K. | Evaluation method for photosynthesis sample, evaluation system for photosynthesis sample, and evaluation program for photosynthesis sample |
| NL1036677C2 (en) * | 2009-03-06 | 2010-09-07 | Praktijkonderzoek Plant & Omgeving B V | METHOD AND APPARATUS FOR MAKING IMAGES CONTAINING INFORMATION ON THE QUANTUM EFFICIENCY AND TIME RESPONSE OF THE PHOTOSYNTHESIS SYSTEM FOR OBJECTIVE OF DETERMINING THE QUALITY OF VEGETABLE MATERIAL AND METHOD AND MEASURING MATERIAL SIZE CLASSIFICATION. |
| WO2013181433A2 (en) | 2012-05-30 | 2013-12-05 | Board Of Trustees Of Michigan State University | Plant phenometrics systems and methods and devices related thereto |
| PT107052A (en) * | 2013-07-09 | 2015-01-09 | Univ Aveiro | SYSTEM AND METHOD OF MEASUREMENT OF THE RESPONSE OF CHLOROPHILA FLUORESCENCE TO A VARIATIONS IN THE INTENSITY OR QUALITY OF LIGHT |
| US8970841B2 (en) | 2009-12-04 | 2015-03-03 | The Trustees Of Columbia University In The City Of New York | Spectral and temporal laser fluorescence analysis such as for natural aquatic environments |
| GB2568307A (en) * | 2017-11-14 | 2019-05-15 | Stratec Biomedical Ag | Spectral excitation device |
| US10473592B2 (en) | 2015-04-29 | 2019-11-12 | Board Of Trustees Of Michigan State University | Methods for estimating photosynthetic characteristics in plant canopies and systems and apparatus related thereto |
| US10481064B2 (en) | 2015-08-28 | 2019-11-19 | Chelsea Technologies Group Ltd | Ballast water monitoring device |
| RU2775809C1 (en) * | 2021-08-13 | 2022-07-11 | Федеральное государственное бюджетное учреждение науки Федеральный исследовательский центр "Морской гидрофизический институт РАН" (ФГБУН ФИЦ МГИ) | Method for determining the concentration of phytoplankton photopigments, dissolved organic matter and the size composition of the suspension in seawater in situ |
Citations (11)
| Publication number | Priority date | Publication date | Assignee | Title |
|---|---|---|---|---|
| US3666945A (en) * | 1969-08-02 | 1972-05-30 | Impulsphysik Gmbh | Arrangement for measuring the concentration of fluorescent materials in air and water |
| US4178512A (en) * | 1978-07-21 | 1979-12-11 | Impulsphysik Gmbh | Deepwater in-situ fluorometer |
| US4293225A (en) * | 1978-06-30 | 1981-10-06 | Chelsea Instruments Limited | Underwater fluorometer measuring system |
| US4650336A (en) * | 1985-09-20 | 1987-03-17 | Advanced Genetic Sciences, Inc. | Measurement of variable fluorescence of plants |
| US4698308A (en) * | 1985-02-14 | 1987-10-06 | Fuji Photo Film Co., Ltd. | Device for measuring the number of bacteria in superpure water |
| US4730922A (en) * | 1985-05-08 | 1988-03-15 | E. I. Du Pont De Nemours And Company | Absorbance, turbidimetric, fluorescence and nephelometric photometer |
| US4786813A (en) * | 1984-10-22 | 1988-11-22 | Hightech Network Sci Ab | Fluorescence imaging system |
| US4802768A (en) * | 1986-04-11 | 1989-02-07 | Sclavo, Inc. | Two light source reference system for a fluorometer |
| US4804850A (en) * | 1986-03-14 | 1989-02-14 | Luminis Pty. Limited | Measurement of fluorescence |
| US4804849A (en) * | 1987-01-16 | 1989-02-14 | Biospherical Instruments Inc. | Method and apparatus for determining concentrations of chlorophyll and the rate of primary production in water |
| US4840485A (en) * | 1986-12-17 | 1989-06-20 | I.S.S. (U.S.A.) Inc. | Frequency domain cross-correlation fluorometry with phase-locked loop frequency synthesizers |
-
1989
- 1989-01-31 US US07/304,273 patent/US4942303A/en not_active Expired - Lifetime
Patent Citations (11)
| Publication number | Priority date | Publication date | Assignee | Title |
|---|---|---|---|---|
| US3666945A (en) * | 1969-08-02 | 1972-05-30 | Impulsphysik Gmbh | Arrangement for measuring the concentration of fluorescent materials in air and water |
| US4293225A (en) * | 1978-06-30 | 1981-10-06 | Chelsea Instruments Limited | Underwater fluorometer measuring system |
| US4178512A (en) * | 1978-07-21 | 1979-12-11 | Impulsphysik Gmbh | Deepwater in-situ fluorometer |
| US4786813A (en) * | 1984-10-22 | 1988-11-22 | Hightech Network Sci Ab | Fluorescence imaging system |
| US4698308A (en) * | 1985-02-14 | 1987-10-06 | Fuji Photo Film Co., Ltd. | Device for measuring the number of bacteria in superpure water |
| US4730922A (en) * | 1985-05-08 | 1988-03-15 | E. I. Du Pont De Nemours And Company | Absorbance, turbidimetric, fluorescence and nephelometric photometer |
| US4650336A (en) * | 1985-09-20 | 1987-03-17 | Advanced Genetic Sciences, Inc. | Measurement of variable fluorescence of plants |
| US4804850A (en) * | 1986-03-14 | 1989-02-14 | Luminis Pty. Limited | Measurement of fluorescence |
| US4802768A (en) * | 1986-04-11 | 1989-02-07 | Sclavo, Inc. | Two light source reference system for a fluorometer |
| US4840485A (en) * | 1986-12-17 | 1989-06-20 | I.S.S. (U.S.A.) Inc. | Frequency domain cross-correlation fluorometry with phase-locked loop frequency synthesizers |
| US4804849A (en) * | 1987-01-16 | 1989-02-14 | Biospherical Instruments Inc. | Method and apparatus for determining concentrations of chlorophyll and the rate of primary production in water |
Non-Patent Citations (4)
| Title |
|---|
| Falkowski, et al., "Relationship of Steady-State Photosynthesis to Fluorescence in Eucaryotic Algea", Biochimica et Biophysica Acta 849, (1986) pp. 183-192. |
| Falkowski, et al., Relationship of Steady State Photosynthesis to Fluorescence in Eucaryotic Algea , Biochimica et Biophysica Acta 849, (1986) pp. 183 192. * |
| Kolber, et al., "A `Pump and Probe` Fluorometer", Biowatt News, No. 9, Nov. 1987, pp. 4-5. |
| Kolber, et al., A Pump and Probe Fluorometer , Biowatt News, No. 9, Nov. 1987, pp. 4 5. * |
Cited By (47)
| Publication number | Priority date | Publication date | Assignee | Title |
|---|---|---|---|---|
| US5304492A (en) * | 1991-11-26 | 1994-04-19 | The State Of Oregon Acting By And Through The State Board Of Higher Education On Behalf Of Oregon State University | Spectrophotometer for chemical analyses of fluids |
| US5381075A (en) * | 1992-03-20 | 1995-01-10 | Unisyn | Method and apparatus for driving a flashing light systems using substantially square power pulses |
| WO1993019568A1 (en) * | 1992-03-20 | 1993-09-30 | Unisyn | Flashing light system and method for enhancing algae photosynthesis |
| EP0654662A1 (en) * | 1993-10-08 | 1995-05-24 | Forschungszentrum Karlsruhe GmbH | Instrument for detecting photosystem II herbicides |
| US5604582A (en) * | 1994-05-12 | 1997-02-18 | Science Application International Corporation | Methods and apparatus for taking spectroscopic measurements of sediment layers beneath a body of water |
| US5589351A (en) * | 1994-12-06 | 1996-12-31 | Nps Pharmaceuticals, Inc. | Fluorescence detection apparatus |
| EP0876592A1 (en) * | 1996-01-23 | 1998-11-11 | John T. S. Lee | Device and method for detection/measurement of light |
| EP0876592A4 (en) * | 1996-01-23 | 1998-12-23 | ||
| US6100093A (en) * | 1996-04-15 | 2000-08-08 | Instituut Voor Agrotechnologisch Onderzoek (Ato-Dlo) | Method and system for determining the quality of a crop |
| EP0840114A3 (en) * | 1996-10-31 | 2000-01-19 | Fuji Photo Film Co., Ltd. | Image Producing Apparatus |
| EP0840114A2 (en) * | 1996-10-31 | 1998-05-06 | Fuji Photo Film Co., Ltd. | Image Producing Apparatus |
| US5929453A (en) * | 1997-06-03 | 1999-07-27 | The United States Of America As Represented By The Secretary Of The Navy | Underwater spectroscopic detector |
| US5894347A (en) * | 1997-06-16 | 1999-04-13 | Johnson & Johnson Clinical Diagnostics, Inc. | Fluorimeter and detection method |
| US6121053A (en) * | 1997-12-10 | 2000-09-19 | Brookhaven Science Associates | Multiple protocol fluorometer and method |
| US6232608B1 (en) * | 1998-08-18 | 2001-05-15 | Molecular Devices Corporation | Optimization systems in a scanning fluorometer |
| US6964857B2 (en) | 2000-08-21 | 2005-11-15 | Ut-Battelle, Llc | Measuring indigenous photosynthetic organisms to detect chemical warefare agents in water |
| US6569384B2 (en) * | 2000-08-21 | 2003-05-27 | Ut-Battelle, Llc | Tissue-based water quality biosensors for detecting chemical warfare agents |
| US20030118984A1 (en) * | 2000-08-21 | 2003-06-26 | Elias Greenbaum | Tissue-based water quality biosensors for detecting chemical warfare agents |
| US6649417B2 (en) | 2000-08-21 | 2003-11-18 | Ut-Battelle, Llc | Tissue-based standoff biosensors for detecting chemical warfare agents |
| US20040012780A1 (en) * | 2000-09-27 | 2004-01-22 | Shiv Sharma | Measurement of fluorescence decay times |
| US6809816B2 (en) * | 2000-09-27 | 2004-10-26 | Amersham Biosciences Uk Limited | Measurement of fluorescence decay times |
| WO2002066975A2 (en) * | 2001-01-31 | 2002-08-29 | Ut-Battelle, Llc | Tissue-based water quality biosensors for detecting chemical warfare agents |
| WO2002066975A3 (en) * | 2001-01-31 | 2003-01-23 | Ut Battelle Llc | Tissue-based water quality biosensors for detecting chemical warfare agents |
| US20050084418A1 (en) * | 2003-10-20 | 2005-04-21 | Hill David E. | Freeze resistant buoy system |
| US7258836B2 (en) | 2003-10-20 | 2007-08-21 | Ut-Battelle, Llc | Freeze resistant buoy system |
| US7591979B2 (en) * | 2003-10-20 | 2009-09-22 | Ut-Battelle, Llc | Enhanced monitor system for water protection |
| US20050084419A1 (en) * | 2003-10-20 | 2005-04-21 | Hill David E. | Enhanced monitor system for water protection |
| US7301158B1 (en) * | 2004-12-15 | 2007-11-27 | Turner Designs, Inc. | Method and apparatus for measuring active fluorescence |
| US7470917B1 (en) * | 2004-12-15 | 2008-12-30 | Turner Designs, Inc. | Submersible apparatus for measuring active fluorescence |
| US7564046B1 (en) | 2004-12-15 | 2009-07-21 | Turner Designs, Inc. | Method and apparatus for measuring active fluorescence |
| EP2315006A1 (en) * | 2006-02-20 | 2011-04-27 | Hamamatsu Photonics K.K. | Evaluation method for photosynthesis sample, evaluation system for photosynthesis sample, and evaluation program for photosynthesis sample |
| US20100159496A1 (en) * | 2006-02-20 | 2010-06-24 | Hamamatsu Photonics K.K. | Evaluation method for photosynthesis sample, evaluation system for photosynthesis sample, and evaluation program for photosynthesis sample |
| US8798931B2 (en) | 2006-02-20 | 2014-08-05 | Hamamatsu Photonics Kk. | Evaluation method for evaluating a state of a photosynthesis sample |
| WO2008033057A2 (en) * | 2006-09-13 | 2008-03-20 | Limited Company 'gene And Cell Therapy' | Method for fluorometrically determining photosynthesis parameters of photoautotropic organisms, device for carrying out said method and a mesurment chamber |
| WO2008033057A3 (en) * | 2006-09-13 | 2008-05-08 | Ltd Company Gene And Cell Ther | Method for fluorometrically determining photosynthesis parameters of photoautotropic organisms, device for carrying out said method and a mesurment chamber |
| WO2010101460A1 (en) * | 2009-03-06 | 2010-09-10 | Stichting Dienst Landbouwkundig Onderzoek | Method and device for determining plant material quality using images containing information about the quantum efficiency and the time response of the photosynthtic system |
| NL1036677C2 (en) * | 2009-03-06 | 2010-09-07 | Praktijkonderzoek Plant & Omgeving B V | METHOD AND APPARATUS FOR MAKING IMAGES CONTAINING INFORMATION ON THE QUANTUM EFFICIENCY AND TIME RESPONSE OF THE PHOTOSYNTHESIS SYSTEM FOR OBJECTIVE OF DETERMINING THE QUALITY OF VEGETABLE MATERIAL AND METHOD AND MEASURING MATERIAL SIZE CLASSIFICATION. |
| US8970841B2 (en) | 2009-12-04 | 2015-03-03 | The Trustees Of Columbia University In The City Of New York | Spectral and temporal laser fluorescence analysis such as for natural aquatic environments |
| WO2013181433A2 (en) | 2012-05-30 | 2013-12-05 | Board Of Trustees Of Michigan State University | Plant phenometrics systems and methods and devices related thereto |
| EP2856118A4 (en) * | 2012-05-30 | 2015-12-23 | Univ Michigan State | Plant phenometrics systems and methods and devices related thereto |
| PT107052A (en) * | 2013-07-09 | 2015-01-09 | Univ Aveiro | SYSTEM AND METHOD OF MEASUREMENT OF THE RESPONSE OF CHLOROPHILA FLUORESCENCE TO A VARIATIONS IN THE INTENSITY OR QUALITY OF LIGHT |
| PT107052B (en) * | 2013-07-09 | 2015-10-05 | Univ Aveiro | SYSTEM AND METHOD OF MEASUREMENT OF THE RESPONSE OF CHLOROPHILA FLUORESCENCE TO A VARIATIONS IN THE INTENSITY OR QUALITY OF LIGHT |
| US10473592B2 (en) | 2015-04-29 | 2019-11-12 | Board Of Trustees Of Michigan State University | Methods for estimating photosynthetic characteristics in plant canopies and systems and apparatus related thereto |
| US10481064B2 (en) | 2015-08-28 | 2019-11-19 | Chelsea Technologies Group Ltd | Ballast water monitoring device |
| EP3341708B1 (en) * | 2015-08-28 | 2022-05-18 | Chelsea Technologies Ltd | Ballast water monitoring device, system comprising the device, and method |
| GB2568307A (en) * | 2017-11-14 | 2019-05-15 | Stratec Biomedical Ag | Spectral excitation device |
| RU2775809C1 (en) * | 2021-08-13 | 2022-07-11 | Федеральное государственное бюджетное учреждение науки Федеральный исследовательский центр "Морской гидрофизический институт РАН" (ФГБУН ФИЦ МГИ) | Method for determining the concentration of phytoplankton photopigments, dissolved organic matter and the size composition of the suspension in seawater in situ |
Similar Documents
| Publication | Publication Date | Title |
|---|---|---|
| US4942303A (en) | Computer controlled fluorometer device and method of operating same | |
| US6121053A (en) | Multiple protocol fluorometer and method | |
| US5426306A (en) | Fast repetition rate (FRR) fluorometer and method for measuring fluorescence and photosynthetic parameters | |
| US5602446A (en) | Fast repetition rate (FRR) flasher | |
| US7470917B1 (en) | Submersible apparatus for measuring active fluorescence | |
| RU2354958C2 (en) | Fluorometric method of determining parametres of photosynthesis of photoautotrophs, device to this end and measuring chamber | |
| US7564046B1 (en) | Method and apparatus for measuring active fluorescence | |
| CA1324501C (en) | Dual beam multichannel spectrophotometer | |
| CA2027561A1 (en) | Improvements in diagnosis by means of fluorescent light emission from tissue | |
| GB1262322A (en) | Apparatus for spectroscopic analysis | |
| Kramer et al. | A portable multi-flash kinetic fluorimeter for measurement of donor and acceptor reactions of Photosystem 2 in leaves of intact plants under field conditions | |
| EP2569614A2 (en) | High dynamic range scanning with reduced channel cross-talk | |
| Talmi et al. | Fluorescence spectrometry with optoelectronic image detectors | |
| GB2093990A (en) | Spectroanalytical system | |
| US5096293A (en) | Differential fluorescence lidar and associated detection method | |
| EP0241268A2 (en) | Improved pulse light system fluorometer | |
| US20060103846A1 (en) | Apparatus for measuring the optical absorbency of samples of liquids, method and reaction container for its implementation | |
| WO1988007670A3 (en) | Time-resolved fluorescence apparatus and immunoassay | |
| US4442349A (en) | Circuitry for the generation and synchronous detection of optical pulsed signals | |
| GB1482323A (en) | Energy-compensated spectrometer | |
| Szabó et al. | A CCD-OMA device for the measurement of complete chlorophyll fluorescence emission spectra of leaves during the fluorescence induction kinetics | |
| AU3552489A (en) | Apparatus for conducting a plurality of simultaneous measurements of electrochemiluminescent phenomena | |
| Stewart et al. | Laser-induced fluorescence imaging and spectroscopy of GFP transgenic plants | |
| RU2199730C2 (en) | System detecting fluorescence while establishing significant parameters of vegetation | |
| US4988196A (en) | Time domain Fraunhofer line discriminator |
Legal Events
| Date | Code | Title | Description |
|---|---|---|---|
| AS | Assignment |
Owner name: ASSOCIATED UNIVERSITIES, INC., Free format text: ASSIGNMENT OF ASSIGNORS INTEREST.;ASSIGNORS:KOLBER, ZBIGNIEW;FALKOWSKI, PAUL;REEL/FRAME:005037/0444 Effective date: 19890120 |
|
| STCF | Information on status: patent grant |
Free format text: PATENTED CASE |
|
| FPAY | Fee payment |
Year of fee payment: 4 |
|
| FPAY | Fee payment |
Year of fee payment: 8 |
|
| AS | Assignment |
Owner name: BROOKHAVEN SCIENCE ASSOCIATES, NEW YORK Free format text: ASSIGNMENT OF ASSIGNORS INTEREST;ASSIGNOR:BROOKHAVEN SCIENCE ASSOCIATES;REEL/FRAME:009089/0561 Effective date: 19980317 |
|
| FPAY | Fee payment |
Year of fee payment: 12 |
|
| REMI | Maintenance fee reminder mailed | ||
| AS | Assignment |
Owner name: BROOKHAVEN SCIENCE ASSOCIATES, NEW YORK Free format text: ASSIGNMENT OF ASSIGNORS INTEREST;ASSIGNOR:ASSOCIATED UNIVERSITIES, INC.;REEL/FRAME:012967/0670 Effective date: 19980317 |