The magnitude-6.6 quake struck near the northeastern edge of the Tibetan Plateau. An analysis shows that nearby sections are now closer to failure.
By Zhigang Peng, Ph.D., School of Earth and Atmospheric Sciences, Georgia Institute of Technology, Jing Liu-Zeng, Ph.D., Tianjin University, Yangfan Deng, Ph.D., CAS Center for Excellence in Deep Earth Science, Guangzhou, China, Shinji Toda, Ph.D., International Research Institute of Disaster Science, Tohoku University
Citation: Peng, Z., Liu-Zeng, J., Deng, Y., Toda, S., 2022, Strong earthquake increases seismic hazard in Qinghai, China, Temblor, http://doi.org/10.32858/temblor.230
This article is also available in Chinese.
A powerful magnitude-6.6 earthquake occurred in the Qinghai province in Western China on January 7, 2022 (Figure 1). The quake struck at 1:45 a.m. local time in a remote region of Menyuan county. It was the largest earthquake in China since the magnitude-7.3 Maduo earthquake in the same province in May 2021. The Menyuan earthquake was widely felt in surrounding regions and caused temporary halts of several high-speed rail lines. But the region is sparsely populated, and only minor injuries and property damage were reported.
Tectonic Environment
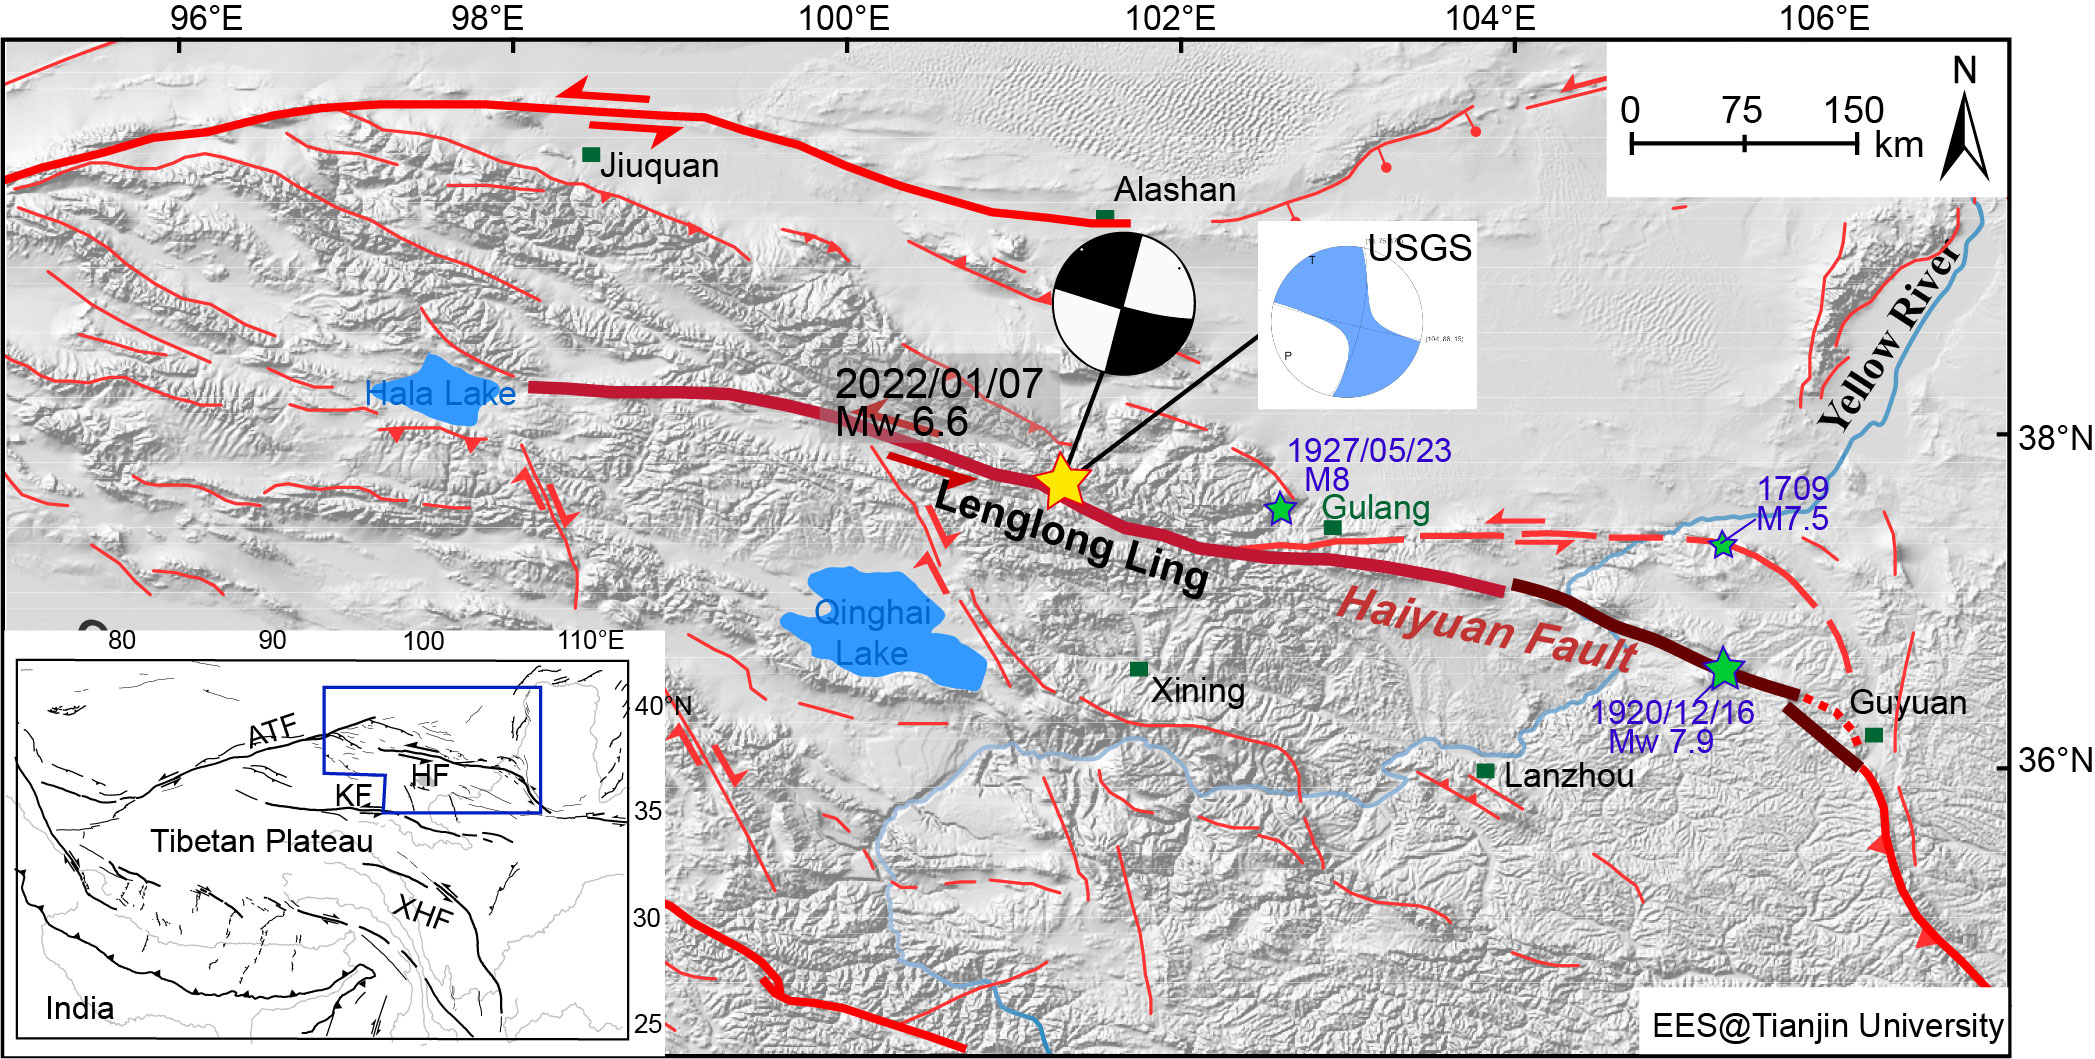
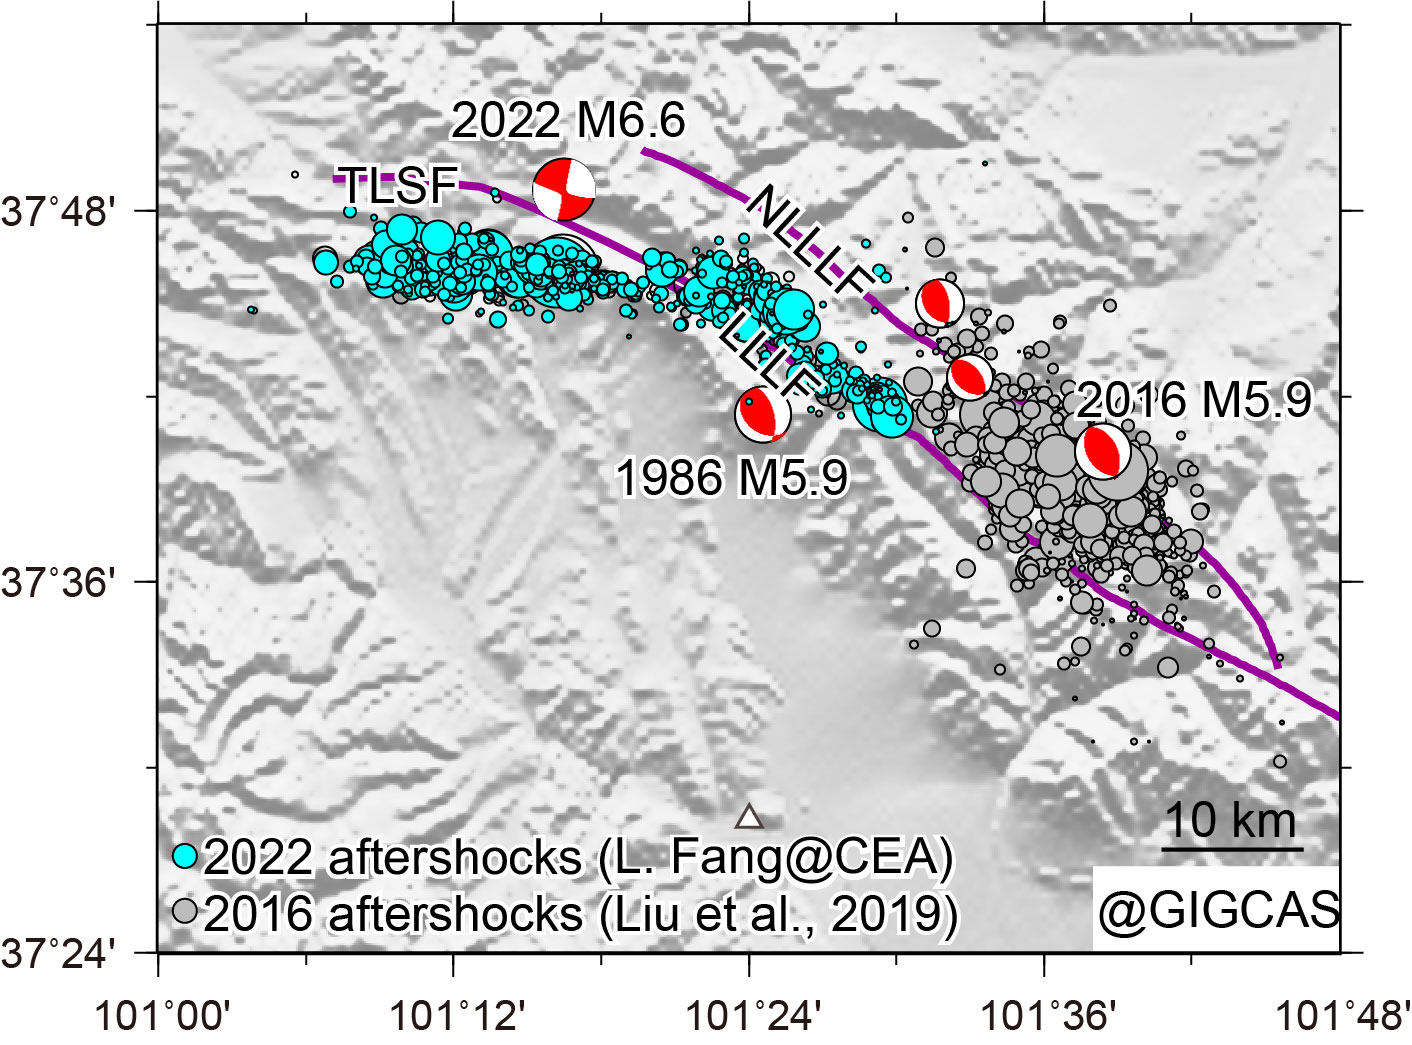
The earthquake occurred in the northeastern margin of the Tibetan Plateau, which was created by the collision between the Eurasian and Indian tectonic plates. Near the recent epicenter, tectonic movement is mostly accommodated by a combination of thrust faults and left-lateral strike-slip fault systems such as the Altyn Tagh, the Kunlun and Haiyuan faults (Figure 1). The most recent Menyuan earthquake occurred on the Lenglongling (meaning “Cold Dragon Ridge” in Chinese) Fault, which is the western branch of the Haiyuan fault. This region is seismically active. Moderate-sized earthquakes occurred in 1986 and 2016 within 40 kilometers to the east of the recent epicenter. Both preceding events involved thrust motion, and so were different from this strike-slip event. All three quakes occurred in a “restraining bend” of the Haiyuan fault, meaning that there is compression straddling the fault, leading to a combination of thrusting and strike-slip motion.
Compared with the 2016 event, the 2022 earthquake started in the same bend or jog, but the rupture appeared to propagate further to the west along the main strike-slip fault, producing roughly 22-kilometer surface ruptures on the ground. Further to the east, two roughly magnitude-8.0 earthquakes occurred in the past century (the 1920 Haiyuan and 1927 Gulang earthquakes), causing significant damage and casualties (Figure 2). The great 1920 Haiyuan earthquake also triggered numerous landslides in the terrain mantled by loess — windblown sand or dust, often derived from glacier deposits. Between these great earthquakes is a 260-kilometer-long segment of the Haiyuan Fault that has not ruptured in the past 1000 years (Liu-Zeng et al., 2007). The section is known as the “Tianzhu” seismic gap (Gaudemer et al. 1995) and could host large damaging earthquakes in the future.

Mainshock Slip Patterns and Intensities
The mainshock focal mechanism is primarily left-lateral, which is consistent with the tectonic movement of the nearby Lenglongling Fault. Rapid finite fault modeling based on long-period teleseismic waves has shown that the mainshock ruptured in both directions along the fault from its nucleation point, with more slip to the east (Figure 3). In contrast, back-projections of short-period teleseismic P waves suggest that the mainshock ruptured primarily to the northwest (Figure 4). This is perhaps not surprising because these approaches use different techniques and frequency bands, and hence they are mostly sensitive to different types of earthquake rupture. For example, long-period finite fault modeling results likely correspond to smooth ruptures that produce significant fault slip. In comparison, short-period back-projection results likely image seismic ruptures on a relatively rough patch that produce significant high-frequency shaking. This is qualitatively consistent with the near-field strong motion and intensity recordings (Figure 5), showing high peak accelerations primarily around the mainshock epicenter and to the northwest direction.


Aftershocks and Surface Ruptures
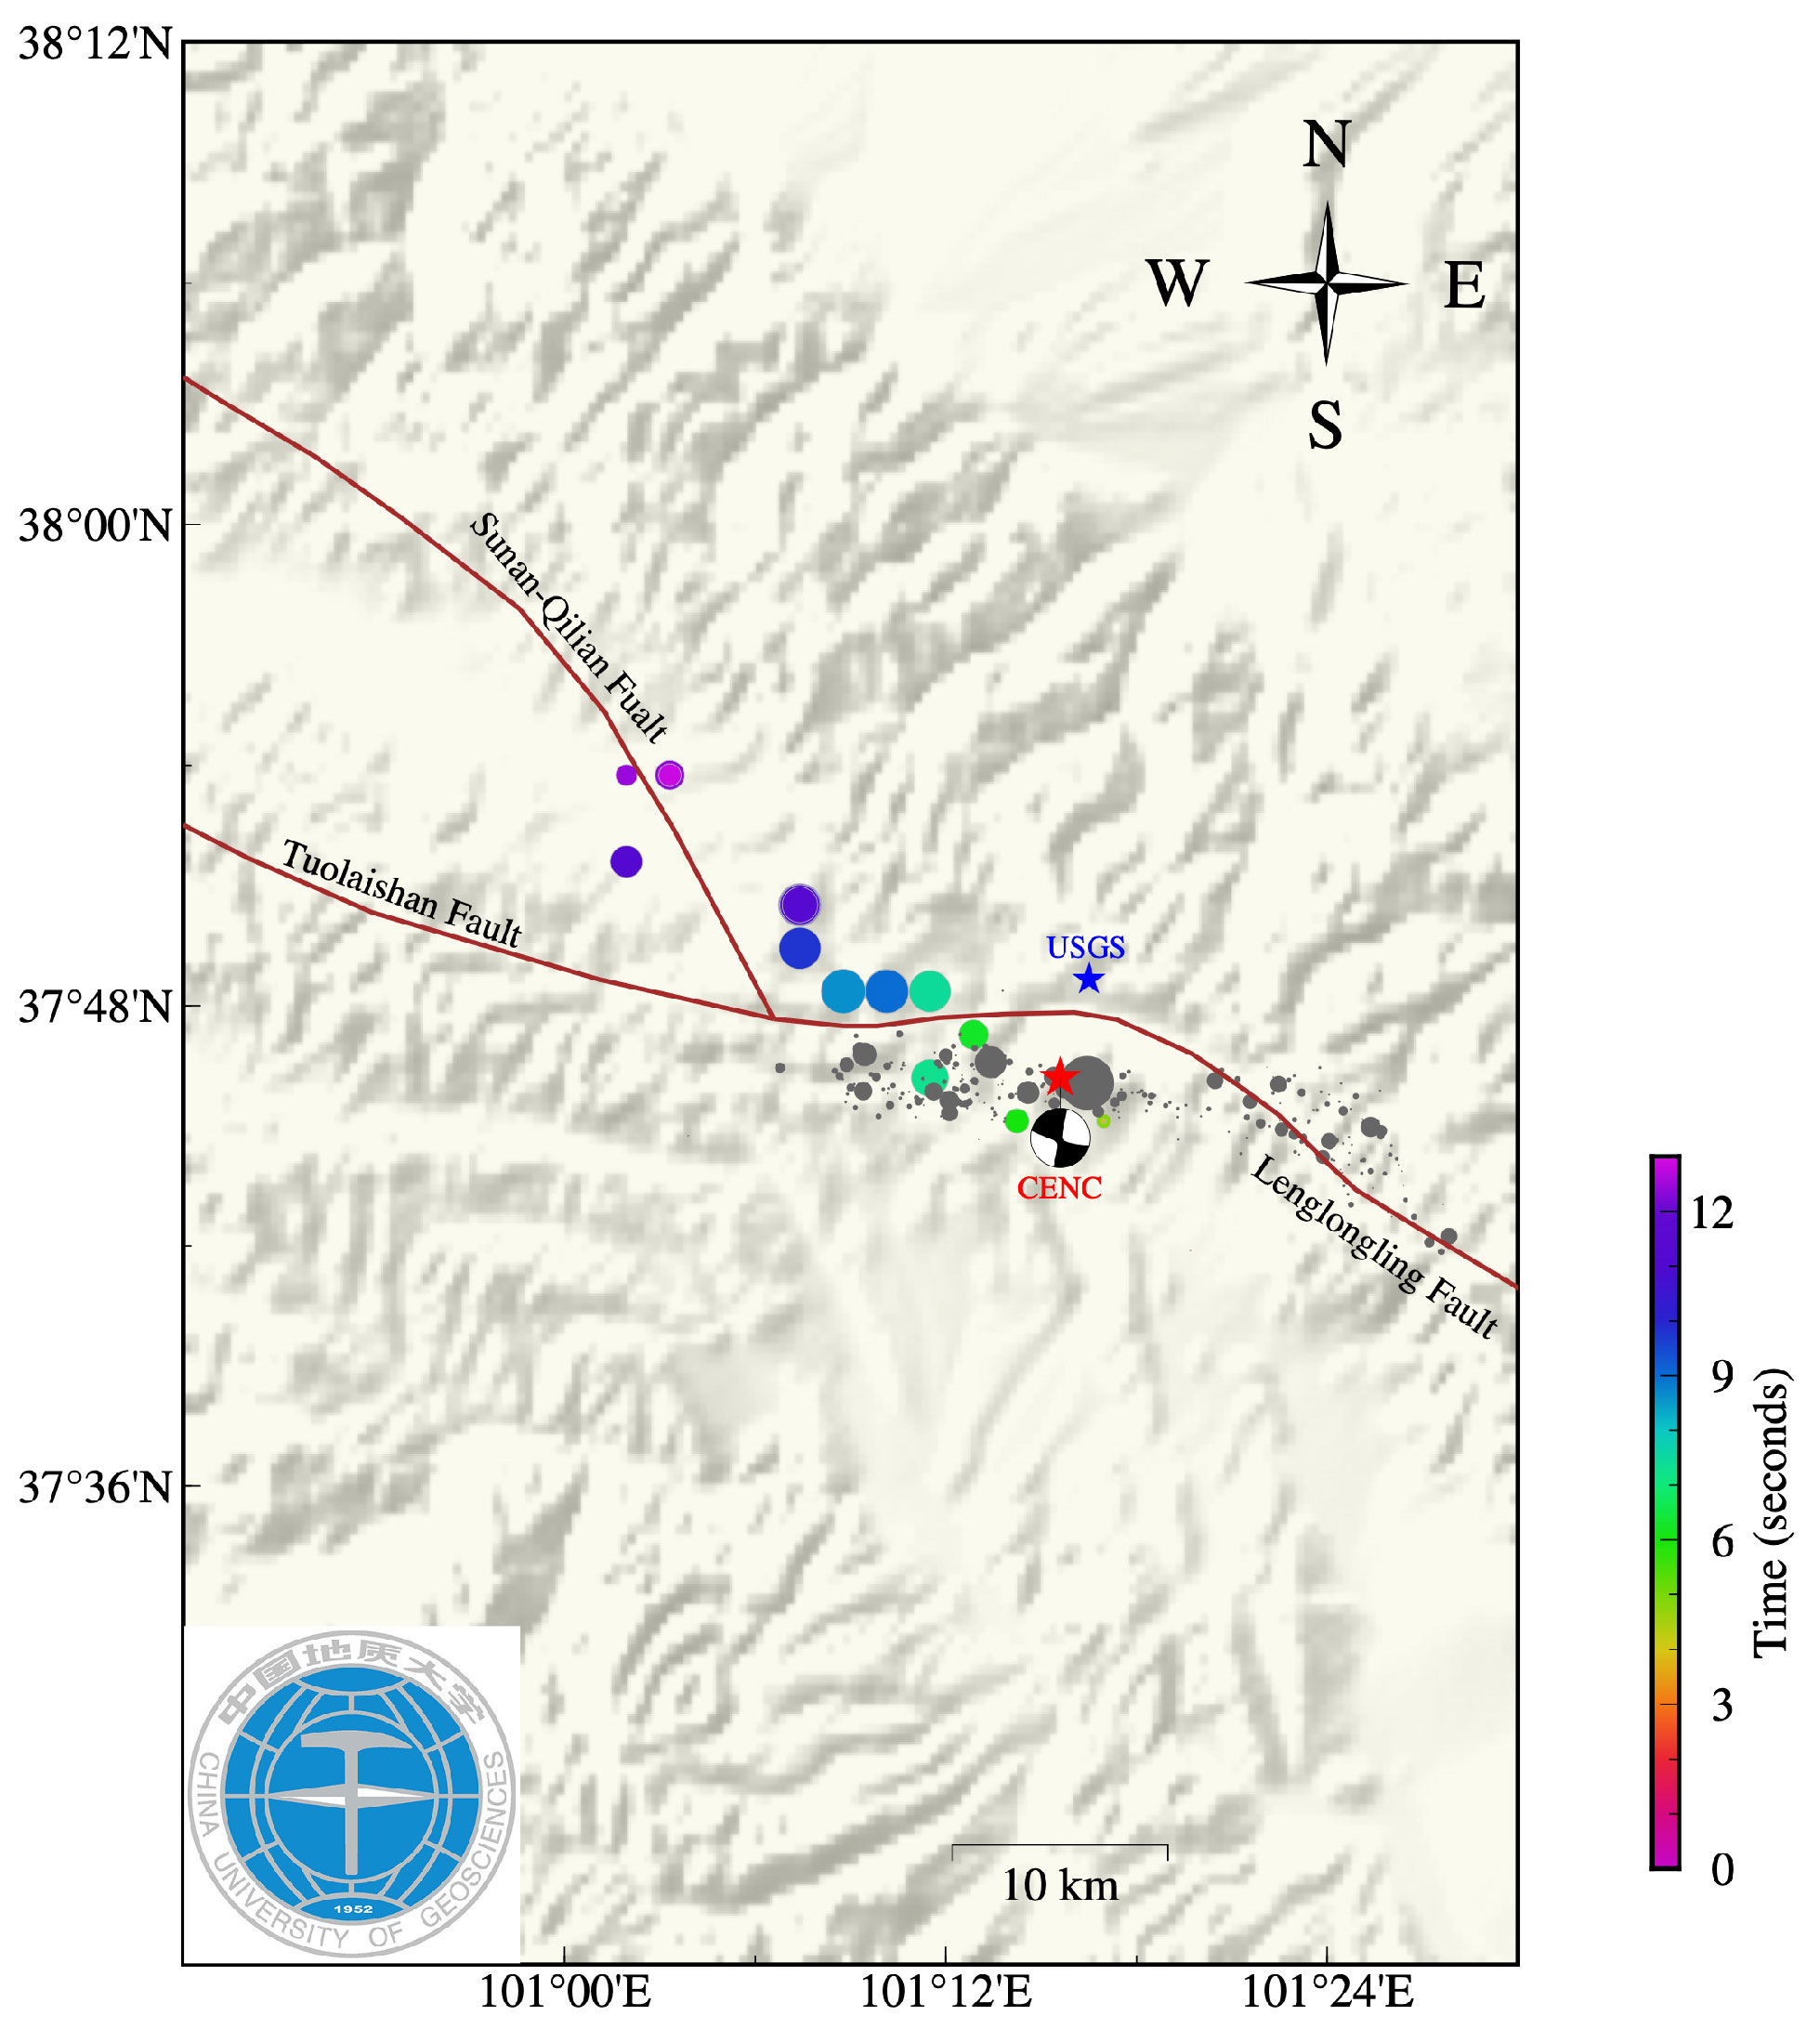
As of January 13, 2022, at 8 a.m. Beijing time, more than 5000 aftershocks have been identified (Figure 6). The largest aftershock has a moment magnitude of 5.3. Relocated aftershocks extended about 40 kilometers to both sides of the mainshock epicenter. To the west, the aftershocks illuminate a fault striking nearly east-west, which is consistent with a rupture on the similarly oriented Tuolaishan Fault (TLSF). To the east, aftershocks mostly follow the local strike of the Lenglongling fault (LLLF). There appears to be a few kilometers gap between the aftershocks of the 2022 magnitude-6.6 mainshock and those of the 2016 magnitude-5.9 mainshock. The 2016 event was a thrust event that likely ruptured the Northern Lenglongling Fault (NLLLF) (Liu et al., 2019), rather than the left-lateral Lenglongling Fault that ruptured in the most recent event.
Subsequent field surveys have found clear surface ruptures associated with the 2022 mainshock (Figure 7). The total length of the surface ruptures mapped so far is about 22 kilometers, and they follow locations of early aftershocks (Figure 8). Figure 7b shows deformed railroad tracks at a tunnel exit, which is ~500 meters north of where the rupture zone crosses the tunnel (Figure 7c). Additional damage inside the tunnel temporarily suspended the service that connects the Gansu, Qinghai and Xinjiang provinces. The tunnel provides a remarkable opportunity to quantify fault zone damages as well as distributed off-fault deformation and related damage. This information would be highly valuable for several on-going ambitious projects of high-speed railroads crossing many active faults in the Tibetan Plateau.


Coulomb Stress Transfers and Seismic Hazard
Due to their proximity and timing, we explore whether the 2016 magnitude-5.9 event promoted the 2022 magnitude-6.6 earthquake by static stress transfer. As shown in Figure 9, the 2016 magnitude-5.9 earthquake imparted up to 0.4 bar (0.04 MPa) of stress on the fault plane that ruptured during the 2022 earthquake. The calculation was done using the Coulomb 3.3 Software (Toda et al., 2011), with an effective coefficient of friction of 0.4. Similarly, we also compute the Coulomb stress changes on both left-lateral faults and northwest-trending thrust faults due to the combined effects of the 2016 and 2022 events (Figure 10). As expected, both events produced positive stress changes on nearby faults, suggesting an increased likelihood of future damaging earthquakes in these regions. In particular, the 2022 earthquake may have brought the unbroken sections to the west (i.e., the Tuolaishan Fault) and east (i.e., the Lenglongling Fault) of the 2022 surface ruptures several bars closer to failure. Indeed, so far, several roughly magnitude-5.0 aftershocks have occurred, suggesting seismic hazard in these sections is relatively high.


The recent earthquake struck in an area previously highlighted by the China Earthquake Administration as having a high probability of a magnitude-6.0 or greater earthquake (Xu et al., 2017). This earthquake provides a glimmer of hope for the scientists engaging in long- and short-term earthquake forecasting in China.
Acknowledgement
We thank Drs. Lihua Fang at Institute of Geophysics, China Earthquake Administration, Dun Wang at Chinese University of Geosciences, Wuhan, Weiming Wang at Institute of Tibetan Plateau Research, Chinese Academy of Sciences, Qiang Ma at Institute Engineering Mechanics, China Earthquake Administration, and Jie Gao at China Earthquake Disaster Prevention Center for providing their preliminary results and field photos that are included in this news report. We also thank Dr. Weqian Yao at Tianjing University for making Figure 1.
References
Deng, Y., Peng, Z., & Liu-Zeng, J. (2020), Systematic search for repeating earthquakes along the Haiyuan fault system in Northeastern Tibet, Journal of Geophysical Research: Solid Earth, 125(7), e2020JB019583, https://doi.org/10.1029/2020JB019583.
Gaudemer, Y., Tapponnier, P., Meyer, B., Peltzer, G., Shunmin, G., Zhitai, C., et al. (1995). Partitioning of crustal slip between linked, active faults in the eastern Qilian Shan, and evidence for a major seismic gap, the ‘Tianzhu gap’, on the western Haiyuan Fault, Gansu (China). Geophysical Journal International, 120(3), 599–645. https://doi.org/10.1111/j.1365-246X.1995.tb01842.x
Liu, M., Li, H., Peng, Z., Ouyang, L., Ma, Y., Ma, J., Liang, Z., & Huang, Y. (2019), Spatial-temporal distribution of early aftershocks following the 2016 Ms 6.4 Menyuan, Qinghai, China Earthquake, Tectonophysics, 766, 469-479, https://doi.org/10.1016/j.tecto.2019.06.022.
Liu-Zeng, J., Y. Klinger, X. Xu, C. Lasserre, G. Chen, W. Chen, P. Tapponnier, and B. Zhang, 2007. Millennial Recurrence of Large Earthquakes on the Haiyuan Fault near Songshan, Gansu Province, China, Bulletin of Seismological Society of America, 97 (1B): 14-34
Toda, S. R. S. Stein, V. Sevilgen, and J. Lin (2011) Coulomb 3.3 graphic-rich deformation and stress-change software for earthquake, tectonic, and volcano research and teaching —user guide: U.S. Geological Survey Open-File Report 2011–1060, 63 p., available at https://pubs.usgs.gov/of/2011/1060/.
Wells, D.L. and Coppersmith K.J. (1994), New Empirical Relationships among Magnitude, Rupture Length, Rupture width, Rupture Area, and Surface Displacement. Bulletin of the Seismological Society of America, 84, 974-1002.
Xu, Xiwei, X. Wu, G. Yu, X. Tan, and K. Li (2017), Seismo-geological signatures for identifying M≥7.0 earthquake risk areas and their preliminary application in mainland China, Seismology and Geology, 39(2), doi:10.3969/j.isn.0253-4967.2017.02.001 (in Chinese).