The Growth-Share Matrix is a tool used in strategic management to evaluate a company’s portfolio of products or business units. The matrix is also called product BCG-matrix, Boston Consulting Group matrix, portfolio matrix, Boston Box, Boston matrix, or portfolio diagram. It is a framework for analyzing a company’s market position and potential for growth. The matrix is named after the Boston Consulting Group, who first developed the technique in the 1970s.
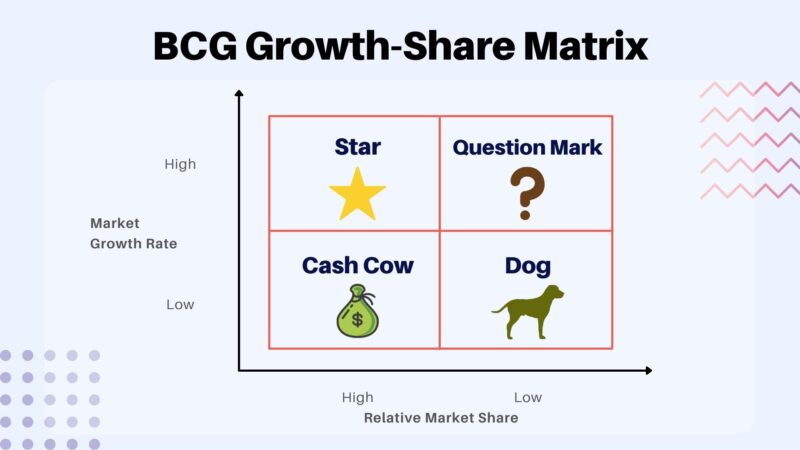
The BCG matrix is a simple yet powerful tool that helps companies assess their business units and products in terms of their relative market position and potential for growth. The matrix plots a company’s business units or products on a four-quadrant grid, with market growth rate on the x-axis and relative market share on the y-axis. The quadrants are labeled as follows:
- Stars: business units or products with high market growth rate and high relative market share. These are the “cash cows” of the company and are often the primary source of funding for other business units or products.
- Question marks: business units or products with high market growth rate but low relative market share. These are the “problem children” of the company and require significant investment to maintain their position in the market.
- Dogs: business units or products with low market growth rate and low relative market share. These are the “dogs” of the company and are often candidates for divestiture or closure.
- Cash cows: business units or products with low market growth rate but high relative market share. These are the “cash cows” of the company and provide a steady stream of income, but do not require significant investment to maintain their position in the market.
Text continues under image
Retrieved from Neostrom.in
The BCG matrix is a useful tool for university students studying strategic management because it provides a simple yet powerful framework for analyzing a company’s market position and potential for growth. It can be used to identify the company’s strengths and weaknesses, and to develop strategies for improving the company’s overall performance.
Criticism and limitations
One important thing to consider when using the BCG matrix is that it is based on the assumptions that market growth rate and relative market share are the key determinants of a business unit or product’s performance. While this may be true in some cases, it is important to remember that there are other factors that can affect a business unit or product’s performance, such as competition, regulation, and technology.
Conclusion
In conclusion, the BCG matrix is a powerful tool for analyzing a company’s market position and potential for growth. It helps companies identify their strengths and weaknesses and develop strategies for improving their overall performance. However, it’s important to remember that the matrix is based on assumptions and it’s important to consider other factors that could affect a business unit or product’s performance.