WO2016184857A1 - Dynamic line rating determination apparatus and associated method - Google Patents
Dynamic line rating determination apparatus and associated method Download PDFInfo
- Publication number
- WO2016184857A1 WO2016184857A1 PCT/EP2016/061026 EP2016061026W WO2016184857A1 WO 2016184857 A1 WO2016184857 A1 WO 2016184857A1 EP 2016061026 W EP2016061026 W EP 2016061026W WO 2016184857 A1 WO2016184857 A1 WO 2016184857A1
- Authority
- WO
- WIPO (PCT)
- Prior art keywords
- power line
- conductor
- current
- line conductor
- temperature
- Prior art date
Links
Classifications
-
- H—ELECTRICITY
- H02—GENERATION; CONVERSION OR DISTRIBUTION OF ELECTRIC POWER
- H02J—CIRCUIT ARRANGEMENTS OR SYSTEMS FOR SUPPLYING OR DISTRIBUTING ELECTRIC POWER; SYSTEMS FOR STORING ELECTRIC ENERGY
- H02J3/00—Circuit arrangements for ac mains or ac distribution networks
- H02J3/18—Arrangements for adjusting, eliminating or compensating reactive power in networks
- H02J3/22—Arrangements for adjusting, eliminating or compensating reactive power in networks in cables
-
- H—ELECTRICITY
- H02—GENERATION; CONVERSION OR DISTRIBUTION OF ELECTRIC POWER
- H02J—CIRCUIT ARRANGEMENTS OR SYSTEMS FOR SUPPLYING OR DISTRIBUTING ELECTRIC POWER; SYSTEMS FOR STORING ELECTRIC ENERGY
- H02J3/00—Circuit arrangements for ac mains or ac distribution networks
-
- H—ELECTRICITY
- H02—GENERATION; CONVERSION OR DISTRIBUTION OF ELECTRIC POWER
- H02J—CIRCUIT ARRANGEMENTS OR SYSTEMS FOR SUPPLYING OR DISTRIBUTING ELECTRIC POWER; SYSTEMS FOR STORING ELECTRIC ENERGY
- H02J3/00—Circuit arrangements for ac mains or ac distribution networks
- H02J3/18—Arrangements for adjusting, eliminating or compensating reactive power in networks
- H02J3/20—Arrangements for adjusting, eliminating or compensating reactive power in networks in long overhead lines
-
- H—ELECTRICITY
- H02—GENERATION; CONVERSION OR DISTRIBUTION OF ELECTRIC POWER
- H02J—CIRCUIT ARRANGEMENTS OR SYSTEMS FOR SUPPLYING OR DISTRIBUTING ELECTRIC POWER; SYSTEMS FOR STORING ELECTRIC ENERGY
- H02J2203/00—Indexing scheme relating to details of circuit arrangements for AC mains or AC distribution networks
- H02J2203/20—Simulating, e g planning, reliability check, modelling or computer assisted design [CAD]
-
- H—ELECTRICITY
- H02—GENERATION; CONVERSION OR DISTRIBUTION OF ELECTRIC POWER
- H02J—CIRCUIT ARRANGEMENTS OR SYSTEMS FOR SUPPLYING OR DISTRIBUTING ELECTRIC POWER; SYSTEMS FOR STORING ELECTRIC ENERGY
- H02J3/00—Circuit arrangements for ac mains or ac distribution networks
- H02J3/003—Load forecast, e.g. methods or systems for forecasting future load demand
-
- Y—GENERAL TAGGING OF NEW TECHNOLOGICAL DEVELOPMENTS; GENERAL TAGGING OF CROSS-SECTIONAL TECHNOLOGIES SPANNING OVER SEVERAL SECTIONS OF THE IPC; TECHNICAL SUBJECTS COVERED BY FORMER USPC CROSS-REFERENCE ART COLLECTIONS [XRACs] AND DIGESTS
- Y02—TECHNOLOGIES OR APPLICATIONS FOR MITIGATION OR ADAPTATION AGAINST CLIMATE CHANGE
- Y02E—REDUCTION OF GREENHOUSE GAS [GHG] EMISSIONS, RELATED TO ENERGY GENERATION, TRANSMISSION OR DISTRIBUTION
- Y02E60/00—Enabling technologies; Technologies with a potential or indirect contribution to GHG emissions mitigation
-
- Y—GENERAL TAGGING OF NEW TECHNOLOGICAL DEVELOPMENTS; GENERAL TAGGING OF CROSS-SECTIONAL TECHNOLOGIES SPANNING OVER SEVERAL SECTIONS OF THE IPC; TECHNICAL SUBJECTS COVERED BY FORMER USPC CROSS-REFERENCE ART COLLECTIONS [XRACs] AND DIGESTS
- Y04—INFORMATION OR COMMUNICATION TECHNOLOGIES HAVING AN IMPACT ON OTHER TECHNOLOGY AREAS
- Y04S—SYSTEMS INTEGRATING TECHNOLOGIES RELATED TO POWER NETWORK OPERATION, COMMUNICATION OR INFORMATION TECHNOLOGIES FOR IMPROVING THE ELECTRICAL POWER GENERATION, TRANSMISSION, DISTRIBUTION, MANAGEMENT OR USAGE, i.e. SMART GRIDS
- Y04S40/00—Systems for electrical power generation, transmission, distribution or end-user application management characterised by the use of communication or information technologies, or communication or information technology specific aspects supporting them
- Y04S40/20—Information technology specific aspects, e.g. CAD, simulation, modelling, system security
Definitions
- This invention relates to an apparatus configured to determine a dynamic line rating comprising a dynamic maximum current that can be applied to a power line conductor.
- the invention also relates to an associated method and an electricity distribution and/or transmission grid including said apparatus.
- a dynamic line rating determination apparatus configured to provide for the control of the current applied to a power line conductor by determination of a dynamic maximum current rating for said power line conductor, the apparatus configured to;
- the voltage and current phase vectors comprising;
- the apparatus does not require measurement of ambient weather or environmental conditions or the measurement of the power line conductor temperature. Instead, through the use of the predetermined power line model and thermal model a surprisingly accurate and effective dynamic maximum current rating can be obtained.
- the apparatus only requires the measurement of voltage and current phasors for each phase at two disparate ends of the power line conductor, with then the real time conductor temperature, steady state conductor temperature and dynamic maximum current rating all being calculated based on said measured phasors.
- a set of positive sequence components, derived by a method of symmetrical components, of the voltage and current phase vectors is applied to the predetermined power line model, the set of positive sequence components comprising;
- the set of positive sequence components are determined based on the following equation;
- U Ra+ URb and VR ⁇ are the voltage phase vectors for each phase a, b, c at the second end; IRa, IRb and IRS are the current phase vectors for each phase a, b, c at the second end; a is an operator of the transformation where; and j is the imaginary unit. It will be appreciated that although this example equation shows the determination of the positive sequence components for a three phase power system, the principle can be applied to any number of phases.
- the apparatus is configured to;
- d e termine the estimate of the real time conductor temperature based on the predetermined power line model represented in the equation below; For example, if an equivalent PI section model is used as the power line model, then the parameters A(Tc), B(Tc), C(Tc) and D(Tc) can be expressed as below:
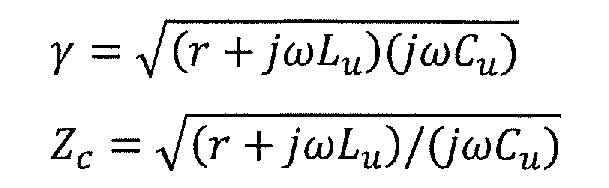
- y and Z ⁇ may alternatively be determined by the following equations:
- y is the propagation constant of the power line conductor
- l is a length of the power line conductor
- r is series resistance per unit length of the power line conductor
- Z ⁇ is a characteristic impedance of the power line conductor
- T REE is a reference conductor temperature and r(TREF) is the resistance per unit length of the power line conductor at the temperature of TREE;
- ⁇ is a predetermined elongation parameter of the power line conductor
- Lu is the (series) inductance per unit length of the power line conductor
- Cu is the (shunt) capacitance per unit length of the power line conductor.
- the apparatus is configured to determine the elongation parameter by any one of the following methods;
- F is the mechanical force that is being applied on the conductor, measured in Newtons (for e xample, F can be regarded as the gravitational force due to weight of the conductor b etween two pylons, which is calculated approximately by dividing the total gravitational force on the cable due to its total weight by the number of sections);
- A is the cross-sectional area in mm2 of the power line conductor
- E is the elasticity modulus in Nmm ⁇ 2 of the power line conductor
- the estimate of the real time conductor temperature T ⁇ is derived using anon-linear least squares method such as the Newton's method.
- T he power line conductor current may be an average power line conductor current.
- the apparatus is configured to determine the power line conductor current, I, as an average power line conductor current, by the following equation;
- V S and IS are the positive sequence voltage and current of the first end
- V R and IR are the positive sequence voltage and current of the second end
- y and Z ⁇ may alternatively be determined by the following equations: _ ( j ) )
- y is the propagation constant of the power line conductor
- Z ⁇ is a characteristic impedance of the power line conductor
- r is series resistance per unit length of the power line conductor
- Cu is the (shunt) capacitance per unit length of the power line conductor.
- Tc has already been obtained by the previous step.
- the apparatus is configured to apply said estimate of the real time conductor t emperature to the predetermined thermal model to determine a prediction of a steady state temperature that the power line conductor will reach over time comprises;
- TSB is the time interval between the T ⁇ (k-1)th and T ⁇ (k)th value, comprising a predetermined primary execution time interval (for example, TS, may be selected as 5s);
- T ⁇ (k) is the conductor temperature at kth time interval (present time);
- T ⁇ (k-1) is the conductor temperature at time interval (previous time); and is the derivative of T ⁇ (k).
- C alculating the time constant a may comprise any one of the following methods; i) Using the equation;
- Ts2 is a predetermined secondary execution time interval.
- Ts2 may be selected as 10s;
- T ⁇ ,(k) is the mean average real time conductor temperature
- the apparatus is configured to determine the steady state conductor temperature TES by the following process;
- OTC is the difference between two successively calculated real time conductor temperature values, T ⁇ ,
- E is a predetermined threshold value representative of a limit in the change of conductor temperature for there to be deemed a steady state condition has been reached;
- T ⁇ (k) is a time derivative of the predicted real time conductor temperature at time k. It will be appreciated that the k and k-1 make reference to the associated values at the present and a previous time, which in this instance is based on the secondary execution time interval.
- the apparatus may be configured to verify the acceptability of the predicted steady state conductor temperature T ⁇ S(k), comprising;
- w here is a predetermined threshold range of TOSS•
- the apparatus is configured to calculate the dynamic maximum current rating based on one or more of the following;
- the apparatus is configured to calculate the dynamic maximum current rating, Imax(k), based on one or more of the following equations; I
- Tmax is a predetermined maximum allowable conductor temperature (the limitation value)
- T ⁇ SS(k) is the calculated steady state conductor temperature at (k)th time interval
- Teo is the initial steady state conductor temperature when there is no current flowing in the power line
- Ik is an average conductor current at a kt" time interval, Ik_, is an average conductor current at a subsequent (k-1)th time interval.
- Ts3 may be selected as 20s.
- the apparatus is configured to calculate the dynamic maximum current rating, A max, based on;
- DI is a difference between two successively determined average conductor currents, where k-1 represents a first determined value and k a subsequent determined value;
- ⁇ ⁇ T ⁇ SS is a difference between two successively determined steady state conductor temperatures where k-1 represents a first determined value and k a subsequent determined value;
- Teo is an initial steady state conductor temperature when there is no current flowing in the power line; • OT ⁇ o is the difference between two successive initial steady state conductor temperature,
- E1, E2, ⁇ 3 and ⁇ 4 are all predetermined threshold values that control the determination of Imax.
- the dynamic maximum current rating Imax is calculated by one or more of the following equations
- Tmax is the maximum allowable conductor temperature
- T ⁇ SS(k) is the calculated steady state conductor temperature at (k)th time interval
- Ik is the average conductor temperature at (k)t" time interval
- T ⁇ o(k) If J ⁇ I ⁇ >_ E1 and ⁇ Tcss ⁇ >_ E2 the maximum current rating ImaxCk) is calculated using the following equation: The value of T ⁇ o(k) may be also updated using the equation below:
- the apparatus is configured to check that the calculated dynamic maximum current rating ImaxCk) value lies within predetermined bounds prior to the apparatus providing it for control of current applied to the power line conductor.
- a method of providing for the control of the current applied to a power line conductor by determination of a dynamic maximum current rating for said power line conductor comprising;
- the voltage and currenfi phase vectors comprising;
- a computer readable medium or computer program comprising computer code configured to, when executed by a processor having memory, perform the method of the second aspect.
- an electricity distribution grid or an electricity transmission grid including at least one power line conductor for carrying electrical power around said grid, the grid including the apparatus of the first aspect for controlling the power applied to said at least one power line conductor.
- Figure 1 shows an example dynamic line rating determination apparatus
- Figure 2 shows a power line conductor between a first end and a second end
- Figure 3 shows a more detailed schematic view of the dynamic line rating determination apparatus of Figure 1
- F igure 4 shows a more detailed schematic view of the first stage shown in Figure 3
- Figure 5 shows a positive sequence equivalent PI circuit diagram of a three phase power line
- Figure 6 shows a typical thermal model for any power line
- Figure 7 shows a more detailed schematic view of the second stage shown in Figure 3
- Figure 8 shows a linear relationship between the squared conductor current (12) and a steady state conductor temperature (TOSS).
- TOSS steady state conductor temperature
- Figure 2 shows a power line conductor comprising a length of an electrical conductor.
- the power line may be an overhead line and/or an underground cable.
- the maximum current that may be passed along the power line is termed the maximum current rating of the power line and it is limited by the maximum conductor temperature which is allowed on the power line.
- the temperature of the power line affects it strength and the amount it may sag from pylons, for example, which must be controlled to ensure the power line remains within safe operating limits. Exceeding the maximum conductor temperature may result in annealing of conductor material thereby causing permanent damage to the power line.
- the maximum conductor temperature may comprise a predetermined value based on the physical dimensions and material of the power line and how it is supported.
- the conductor temperature is a function of at least the current flowing through the power line and environmental conditions, such as the ambient temperature, wind speed, wind direction and incident solar radiation.
- the conventional maximum current rating may be determined based on "worst case” environmental conditions where the environment contributes a substantial amount to the conductor temperature therefore resulting in a relatively low maximum current rating to ensure the maximum conductor temperature is not exceeded.
- the maximum current rating calculated by this method is termed the static line rating.
- the environmental conditions may be rarely close to the "worst case” situation and therefore the maximum current rating determined by the static line rating method may be overly conservative for much of the time. Thus, the capacity of the power line may be under used.
- the maximum current rating may increase if the environmental conditions contribute less to the conductor temperature and decrease if the environmental conditions contribute more to the conductor temperature.
- the maximum current rating determined by this method is termed the dynamic line rating. Actively monitoring the conductor temperature to determine if the maximum current rating can be increased or should be decreased typically requires many measurement units situated along the power line to collect environmental information and/or the temperature of the conductor. The use of many measurement units increases the capital cost and the maintenance cost of dynamic line rating installations.
- Figure 1 shows a dynamic line rating apparatus 1 configured to provide a dynamic maximum current rating 2 for a power line section 20 (shown in Figure 2) having a first end 21 and a second end 22.
- the power line section 20 may comprise a length of electrical conductor and may form part of an electricity distribution grid or an electricity transmission grid.
- the power line section may be supported along its length by support structures, such as pylons 23.
- the maximum current rating 2 is based on measurements 3 of voltage and current flow at the first end 21 of the power line section 20 and measurements 4 of voltage and current flow at the second end 22 of the power line section 20. A method of determining the dynamic maximum current rating based only on the measurements 3, 4 and predetermined modelling of the power line conductor will be described below.
- the apparatus is configured to provide other variables such as an estimated real time conductor temperature 5 and a predicted steady state conductor temperature 6.
- the estimated real time conductor temperature 5 and the predicted steady state conductor temperature 6 are calculated based on the measurements 3, 4 and predetermined modelling of power lines. Thus, environmental condition measurement sensors are not required, nor are power line temperature sensors.
- the steady state conductor temperature comprises the temperature the power line conductor will ultimately reach after a change in current flow through said power line.
- the change in conductor temperature in response to a step change in current flow may not occur instantaneously but may reach a substantially constant "steady state conductor temperature" after a period of time in the future.
- the steady state conductor temperature comprises a prediction of the temperature the conductor will reach assuming steady state current/power flow and environmental conditions.
- Figure 3 shows a schematic diagram of the dynamic line rating apparatus 1 comprising three stages 31, 32, 33.
- the first stage 31 comprises determination of the real time conductor temperature, Tc, of the power line section 20 and the average current flowing, I, flowing through the power line section 20.
- the first stage 31 comprises the real time conductor temperature determination stage.
- either end 21, 22 can be defined as the sending end and, accordingly, the other end is the receiving end.
- the first end 21 will be referred to as the sending end and the second end 22 will be referred to as the receiving end, although it will be appreciated that in other examples this could be reversed.
- the first stage 31 is configured to receive: a set of voltage phasors (phase vectors) 34 for each phase measured at the sending end 21; a set of current phasors 35 for each phase measured at the sending end 21; a set of voltage phasors (phase vectors) 36 for each phase measured at the receiving end 22; and a set of current phasors 37 for each phase measured at the receiving end 22.
- vsa ⁇ Usb and VSO represent three phase voltage phasors of the sending end 21 of a three phase (phase a, phase b and phase c) system. It will be appreciated that the apparatus 1 may be applied to systems that utilize greater or fewer than three phases.
- Isar Isb and ISM represent three phase current phasors as measured at the sending end 21.
- VRa, VRb and VR ⁇ represent three phase voltage phasors as measured at the receiving end 22.
- IRa, IRb and IRS represent three phase current phasors as measured at the receiving end 22.
- Tsamp e, which may be every 20 ms, although other sampling periods may be used.
- the determination of the real time conductor temperature Tc is provided every TS, seconds where TS, is greater than the voltage and current phasor sampling period (20 ms in this example).
- the first stage 31 provides Tc as output 38 and I as output 39.
- the second stage 32 comprises a steady state conductor temperature determination stage.
- the second stage 32 is configured to determine the steady state conductor temperature, TCSSi based on only the average current I and the estimated real time conductor temperature Tc.
- the determination of Tcss is provided every Ts2 seconds where T52 is greater than TS,.
- the second stage 32 provides Tcss as output 40 and relays I from the first stage as output 41.
- the third stage 33 comprises a dynamic maximum current rating determination stage.
- the third stage 33 is configured to determine the dynamic maximum current rating, (max, based on the steady state conductor temperature, Tcss, determined by the second stage 32 and the average current, I, determined by the first stage 31.
- the only actively measured variables used by the apparatus comprise the voltage and current phasors obtained in the first stage 31.
- the third stage 33 provides ImaX as output 42.
- the third stage is shown as only providing ImaX.
- ImaX may be provided for control of power flow across the power line section 20.
- the apparatus 1 may additionally provide the real time conductor temperature T ⁇ and/or the steady state conductor temperature TOSS as output.
- the real time conductor temperature is evaluated based on the measured voltages and currents from both ends of the power line by solving a power line model equation using the voltage and current phasors as input.
- the power line model equation may comprise a transmission equation of a power line using these voltage and current phasors as input.
- the voltage and current transmitting from one end to another are relative to the line parameters, which are functions of the line temperature, for example.
- Series impedance and shunt admittance of the line may be functions of the conductor temperature. Therefore, the conductor temperature can be obtained by directly solving the transmission equation of a line, in which the voltage and currents are known quantities and the temperature is unknown variable.
- a Newton's method may be utilized to derive the real time conductor temperature T ⁇ from the transmission line equation.
- the average conductor current I may be derived based on positive sequence components Is and IR for each phase or, in other examples, is received from a different apparatus.
- the steady state conductor temperature is determined based on the real time conductor temperature derived from the first stage by using a predetermined power line thermal model.
- the maximum current rating is determined based on the steady state conductor temperature derived from the second stage and the average conductor current, as described in more detail below.
- the first stage 31 Figure 4 shows a more detailed conceptual view of the first stage 31.
- the first stage 31 comprises a symmetrical components determination element 43 and a power line model determination element 44.
- the symmetrical components determination element 43 is configured to determine a positive sequence component from the twelve voltage and current phase phasor values 34, 35, 36, 37 measured at the sending and receiving ends 21, 22.
- the symmetrical components determination element 43 is configured to determine a positive sequence voltage term for the first (sending) and second (receiving) ends 20, 21 and a positive sequence current term for the first (sending) and second (receiving) ends 20, 21.
- four positive sequence components 45, 46, 47, 48 are determined.
- the power line model element 44 is configured to receive the positive sequence components 45, 46, 47, 48 from element 43 and solve an equation of a predetermined power line model, as described below, to determine an estimate of the real time conductor temperature 38.
- the power line model element 44 or a further calculation block may be configured to determine the average conductor current, I, shown output at 39.
- the positive-sequence components VS, IS, VR and IR are derived in element 43 using the following equation;
- VS and IS are the positive sequence voltage and current of the sending end
- VR and IR are the positive sequence voltage and current of the receiving end
- Vsa, Vsb and VSO are the voltage phase vectors for each phase a, b, c at the first end;
- Isar Isb ⁇ and ISM are the current phase vectors for each phase a, b, c at the first end;
- URa+ URb and VR ⁇ are the voltage phase vectors for each phase a, b, c at the second end; IRa, IRb and IRS are the current phase vectors for each phase a, b, c at the second end; a is operator of the transformation; and
- Equation 1 the determination of the estimated real time conductor temperature is determined by the element 44 based on a power line model represented in equation 1 below, which is derived based on Figure 5.
- y and Z ⁇ may alternatively be determined by the following equations:
- y is the propagation constant
- l is the length of the power line section 20
- r is series resistance per unit length of the power line section 20;
- Z ⁇ is the characteristic impedance of the power line section 20
- T REE is the reference conductor temperature.
- TREE may be selected at 20°C and r(TREF) is the resistance per unit length at the temperature of TREE;
- c ⁇ is the angular frequency of the voltage/current.
- Lu is the inductance per unit length of the power line conductor.
- Cu is the capacitance per unit length of the power line conductor.
- the elongation may be determined by;
- ⁇ can also be evaluated approximately according to the material of the conductor and may thus comprise a predetermined quantity.
- F is the mechanical force that is being applied on the conductor, measured in Newtons (for example, F can be regarded as the gravitational force due to weight of the conductor between two pylons, which is calculated approximately by dividing the total gravitational force on the cable due to its total weight by the number of sections);
- A is the cross-sectional area in mm2 of the power line conductor
- E is the elasticity modulus in Nmm ⁇ 2 of the power line conductor
- Equation 1 is the linear thermal expansion coefficient in K-' of the power line conductor; and i ⁇ 2 is the square thermal expansion coefficient in K-2 of the power line conductor.
- the conductor temperature T ⁇ can be derived using a Newton's method. It will be appreciated that other methods applicable to solving non-linear least squares problems may be used. Firstly, the power line model (Equation 1) is rewritten into real number equations.
- Figure 5 shows the positive sequence equivalent PI circuit diagram of a three phase power line with the sending and receiving ends 21, 22 labelled.
- Z' and Y' are the equivalent impedance and admittance of the equivalent PI circuit, as will be understood by those skilled in the art.
- I the average conductor current
- y and Z ⁇ may alternatively be determined by the following equations:
- y is the propagation constant of the power line conductor
- Z ⁇ is a characteristic impedance of the power line conductor
- r is series resistance per unit length of the power line conductor
- Lu is the (series) inductance per unit length of the power line conductor
- C u is the (shunt) capacitance per unit length of the power line conductor.
- Tc has already been obtained by the previous step.
- the estimated real time conductor temperature Tc and average current I are passed at 38, 39 to the second stage 32 or steady state conductor temperature determination stage.
- the Second Stage 32
- T he second stage comprises the determination of the steady state conductor temperature TOSS from the estimated real time conductor temperature T ⁇ .
- Figure 6 shows a typical thermal model for any power line. When the current on a power line has a step change, the conductor temperature 60 on the power line will react to the change of current and change from one steady state to a new steady state exponentially. There is mathematical relationship between the real time conductor temperature T ⁇ and the steady state conductor temperature that will be reached over time. Therefore, the real time conductor temperature calculated in the first stage 31 can be used to predict the steady state conductor temperature.
- Figure 7 shows a schematic diagram representative of the steps 72 and 73 performed by the second stage 32. Step 72 comprises determining the derivative of the real time conductor temperature using the following formulas;
- TS is the primary execution time interval of the first stage 31 (for example, TS, can be selected as 5s) i.e. TSB is the time interval between the T ⁇ (k-1)th and T ⁇ (k)th value; T ⁇ (k-1) is the conductor temperature at (k-1)th time interval; and
- T ⁇ (k) is the conductor temperature at (k)t" time interval (present time).
- T ⁇ (k) is the derivative of T
- step 72 comprises calculating the exponentially decaying time constant a.
- a can be calculated using several methods.
- a first method comprises using the following equation;
- a second method comprises using the following equation;
- TS 2 is the secondary execution time interval of the second stage 32.
- TS2 can be selected as 10s.
- the k is the present time sample and k-1 is the previous time sample, within the time interval TS2.
- a is calculated, it may be checked against a predetermined condition to determine it reasonability. The following "judgment algorithm" may be applied to determine the reasonability of a. It will be appreciated that the k and k- 1 values below are based on the secondary execution time interval. • If a(k) E Lamin ⁇ amax ⁇ then the calculation result of a(k) is accepted.
- Step 73 comprises the determination of the steady state conductor temperature TOSS by the following process;
- ⁇ T ⁇ is the difference between two successively calculated real time conductor temperature values, T ⁇ , E is a predetermined threshold value, which may be a small value, and represents a limit in the change of conductor temperature for there to be deemed a steady state condition has been reached.
- ⁇ is set as 0.02 °C in the present apparatus 1.
- a further "judgement algorithm" may be applied to determine the reasonability of T ⁇ S(k).
- Tcss_min is set as 0 and T ⁇ SS_maX is set as 2*TmaX where TmaX is a predetermined maximum conductor temperature on the power line.
- TmaX is a predetermined maximum conductor temperature on the power line.
- the average current value, I may be forwarded to the third stage 33.
- the third stage 33
- T he third stage 33 comprises the determination of the maximum allowable conductor current based on the steady state conductor temperature TOSS and the average current I.
- Figure 8 shows the relationship 80 between the squared conductor current (12) and the steady state conductor temperature (TES). This relationship may be utilized in the equations below.
- the maximum current rating ImaX is then determined by the third stage 33. The maximum current rating may be determined based on one or more of the following;
- the third stage 33 may be configured to determine one or more of the following variables for use as judgment conditions in three different cases for the calculation of Imax.
- the time interval of samples at the kth and (k-1)th time is TS3, are based on the tertiary execution time interval of stage 33 unless previously stated otherwise.
- Ts3 can be selected as 20s.
- • 0I is the difference between two successively determined average conductor currents, where k-1 represents a first determined value and k a subsequent determined value;
- ⁇ OT ⁇ SS is the difference between two successively determined steady state conductor temperatures where k-1 represents a first determined value and k a subsequent determined value;
- Teo is the initial steady state conductor temperature when there is no current flowing in the power line.
- ⁇ 1, ⁇ 2, 85 and ⁇ 4 are all predetermined threshold values that control the determination of Imax based on the values determined by the first stage 31 and second stage 32.
- E1 is set as 0.1 kA
- ⁇ 2 is set as 0.1 °C
- E3 is set as 0.1 °C
- ⁇ 4 is set as 5 °C.
- the third stage 33 is configured to calculate Imp in different ways depending on one or more conditions.
- three different ways to determine ImaX are provided and are described in the following three cases.
- Tmax is the maximum allowable conductor temperature.
- T ⁇ SS(k) is the calculated steady state conductor temperature at (k)th time interval.
- Ik is the average conductor temperature at (k)th time interval.
- T ⁇ o(k) is updated using the following equation; However, this updated value of Teo (k) may be checked for reasonability against at least one predetermined condition. In particular, • If Tip (k ⁇ E [Tco min,Tco_max,J and ⁇ OTcO ⁇ ⁇ _ ⁇ 4, then the calculated Teo (k) is acceptable. [Tc0 min,Tco_max, ⁇ ⁇ s a predetermined operating range of Teo. For e xample, in one example, Tc0_min is set at 0 °C and T ⁇ o_maX is set at 30 °C.
- T ⁇ o(k) maintains the historical value.
- Im ⁇ (k) can be calculated and then provided for control of the power/current applied to the power line section 20.
- the calculated Imp may be multiplied by a coefficient before providing control of the power/current to the power line.
- This coefficient can be termed as the reliability coefficient as it insures the reliability of the dynamic line rating method.
- the reliability coefficient should be in the range of 0 to 1. For example, it can be selected as 0.9.
- the ImaXCk) value calculated above may be subject to a reasonability check prior to being provided for control of the power/current applied to the power line section 20.
- the calculated ImaXCk) value may be checked that it lies within predetermined bounds.
- An example maximum current rating judgment algorithm that may be used to determine the reasonability of the calculated is as follows;
- ImaxCk is the operating range Of I max Ck).
- Imax min is set as 0 kA
- ImaX max is set as 5 kA.
- SCADA supervisory control and data acquisition
- the apparatus 1 is shown conceptually comprising three stages in the above description. However, it will be appreciated that any number of calculation/determination stages may be provided to perform the above steps and the steps/stages may be combined rather than following a stepwise determination of the real time conductor temperature, steady state conductor temperature and maximum current rating.
- the above description comprises an implementation on a power line transmitting Alternating Current (AC). This invention can be applied to a power line transmitting Direct Current (DC) as well.
- AC Alternating Current
- DC Direct Current
Abstract
Description


Claims


Priority Applications (5)
| Application Number | Priority Date | Filing Date | Title |
|---|---|---|---|
| US15/574,854 US10447041B2 (en) | 2015-05-18 | 2016-05-17 | Dynamic line rating determination apparatus and associated method |
| MX2017014783A MX369602B (en) | 2015-05-18 | 2016-05-17 | Dynamic line rating determination apparatus and associated method. |
| JP2017558402A JP6929229B2 (en) | 2015-05-18 | 2016-05-17 | Dynamic power transmission rating determination device and related methods |
| CN201680028829.XA CN107636926B (en) | 2015-05-18 | 2016-05-17 | Dynamic line rating determination apparatus and associated method |
| CA2985553A CA2985553C (en) | 2015-05-18 | 2016-05-17 | Dynamic line rating determination apparatus and associated method |
Applications Claiming Priority (2)
| Application Number | Priority Date | Filing Date | Title |
|---|---|---|---|
| EP15275139.2A EP3096428B1 (en) | 2015-05-18 | 2015-05-18 | Dynamic line rating determination apparatus and associated method |
| EP15275139.2 | 2015-05-18 |
Publications (1)
| Publication Number | Publication Date |
|---|---|
| WO2016184857A1 true WO2016184857A1 (en) | 2016-11-24 |
Family
ID=53267275
Family Applications (1)
| Application Number | Title | Priority Date | Filing Date |
|---|---|---|---|
| PCT/EP2016/061026 WO2016184857A1 (en) | 2015-05-18 | 2016-05-17 | Dynamic line rating determination apparatus and associated method |
Country Status (7)
| Country | Link |
|---|---|
| US (1) | US10447041B2 (en) |
| EP (1) | EP3096428B1 (en) |
| JP (1) | JP6929229B2 (en) |
| CN (1) | CN107636926B (en) |
| CA (1) | CA2985553C (en) |
| MX (1) | MX369602B (en) |
| WO (1) | WO2016184857A1 (en) |
Families Citing this family (6)
| Publication number | Priority date | Publication date | Assignee | Title |
|---|---|---|---|---|
| US10491005B2 (en) * | 2017-02-24 | 2019-11-26 | Hall Labs Llc | Intelligent current limiting to enable chaining of AC appliances |
| US10855107B2 (en) | 2017-04-28 | 2020-12-01 | Lindsey Manufacturing Co. | System and method for generating a transmission line reliability rating |
| US10718129B2 (en) * | 2017-07-03 | 2020-07-21 | Hall Labs Llc | Housing for digital assistant |
| US11373085B2 (en) * | 2020-02-11 | 2022-06-28 | International Business Machines Corporation | IoT based fire prediction |
| CN112434874A (en) * | 2020-12-02 | 2021-03-02 | 华北电力大学 | Line capacity optimization method and system for renewable energy consumption |
| CN115036923B (en) * | 2022-08-12 | 2022-10-25 | 南京邮电大学 | Electricity-gas comprehensive energy system state estimation method considering multi-energy flow time sequence |
Citations (3)
| Publication number | Priority date | Publication date | Assignee | Title |
|---|---|---|---|---|
| US5933355A (en) * | 1995-05-04 | 1999-08-03 | Deb; Anjan Kumar | Object oriented expert power line ampacity system |
| US20050222808A1 (en) * | 2001-12-21 | 2005-10-06 | Abb Schweiz Ag | Determining an operational limit of a power transmision line |
| US20130066600A1 (en) * | 2011-09-01 | 2013-03-14 | Utility Risk Management Corporation, Llc | Method and apparatus for real-time line rating of a transmission line |
Family Cites Families (27)
| Publication number | Priority date | Publication date | Assignee | Title |
|---|---|---|---|---|
| SE433777B (en) * | 1980-03-26 | 1984-06-12 | Elfi Innovationer | SET UP AND DEVICE TO MONITOR THE WINDING TEMPERATURE OF AN ASYNCHRONIC MOTOR FOR MONITORING |
| US5181026A (en) * | 1990-01-12 | 1993-01-19 | Granville Group, Inc., The | Power transmission line monitoring system |
| US6694270B2 (en) * | 1994-12-30 | 2004-02-17 | Power Measurement Ltd. | Phasor transducer apparatus and system for protection, control, and management of electricity distribution systems |
| US20030212512A1 (en) * | 1997-02-12 | 2003-11-13 | Power Measurement Ltd. | Apparatus and system for protection, control, and management of electricity distribution systems over a network |
| US5995911A (en) * | 1997-02-12 | 1999-11-30 | Power Measurement Ltd. | Digital sensor apparatus and system for protection, control, and management of electricity distribution systems |
| US6313752B1 (en) * | 1998-05-21 | 2001-11-06 | Steven P. Corrigan | System for displaying dynamic on-line operating conditions of an interconnected power transmission network |
| US6611922B2 (en) * | 1999-08-09 | 2003-08-26 | Power Measurement, Ltd. | Power system time synchronization device and method for sequence of event recording |
| US6546353B1 (en) * | 1999-09-13 | 2003-04-08 | University Corporation For Atmospheric Research | Hot plate precipitation measuring system |
| US6618684B1 (en) * | 2000-01-26 | 2003-09-09 | Elster Electricity, Llc | System and method for digitally compensating frequency and temperature induced errors in amplitude and phase shift in current sensing of electronic energy meters |
| ES2320310T3 (en) * | 2000-03-10 | 2009-05-21 | Abb Schweiz Ag | METHOD AND DEVICE FOR EVALUATING THE STABILITY OF AN ELECTRICAL TRANSMISSION NETWORK. |
| US20040010350A1 (en) * | 2000-05-31 | 2004-01-15 | Per-Anders Lof | Distributed power generation system protection scheme |
| SE517714C2 (en) * | 2000-05-31 | 2002-07-09 | Abb Ab | Mains protection system for protecting the integrity of a total electrical power system against slightly damped power fluctuations, electric power system including a network protection, system protection system procedure, system protection terminal, computer program product and computer readable medium |
| US6545482B1 (en) * | 2000-09-22 | 2003-04-08 | Nxtphase Technology Srl | Monitoring wide area dynamic swing recordings on an electrical power system |
| US6598003B1 (en) * | 2000-10-31 | 2003-07-22 | Rx Monitoring Services, Llc | Power and environmental condition monitoring system and method |
| US6611773B2 (en) * | 2000-11-28 | 2003-08-26 | Power Measurement Ltd. | Apparatus and method for measuring and reporting the reliability of a power distribution system with improved accuracy |
| US6662124B2 (en) * | 2002-04-17 | 2003-12-09 | Schweitzer Engineering Laboratories, Inc. | Protective relay with synchronized phasor measurement capability for use in electric power systems |
| US6940702B2 (en) * | 2002-07-12 | 2005-09-06 | Mcgraw-Edison Company | Electrical protection system |
| US7180717B2 (en) * | 2002-07-12 | 2007-02-20 | Cooper Technologies Company | Electrical network protection system |
| BRPI0314881B1 (en) * | 2002-10-25 | 2019-01-08 | S & C Electric Co | system and method for controlling distribution of electricity through a grid |
| WO2004061462A1 (en) * | 2002-12-23 | 2004-07-22 | Power Measurement Ltd. | Power monitoring integrated circuit with communication interface |
| US20050083206A1 (en) * | 2003-09-05 | 2005-04-21 | Couch Philip R. | Remote electrical power monitoring systems and methods |
| US7593747B1 (en) * | 2005-07-01 | 2009-09-22 | Cisco Technology, Inc. | Techniques for controlling delivery of power to a remotely powerable device based on temperature |
| US7620517B2 (en) * | 2007-02-05 | 2009-11-17 | Abb Research Ltd. | Real-time power-line sag monitoring using time-synchronized power system measurements |
| US7641387B2 (en) * | 2007-05-08 | 2010-01-05 | Underground Systems, Inc. | Power line temperature and sag monitor system |
| US9634516B2 (en) * | 2009-04-14 | 2017-04-25 | Ford Global Technologies, Llc | Method and system for monitoring temperature of a power distribution circuit |
| US9519014B2 (en) * | 2012-12-06 | 2016-12-13 | Dynamic Engineers, Inc. | Systems and methods for calculating power transmission line capacity |
| CN104092217B (en) * | 2014-07-01 | 2016-04-13 | 国家电网公司 | The control method of feeder load is cut in power circuit or power transformer overload combination choosing |
-
2015
- 2015-05-18 EP EP15275139.2A patent/EP3096428B1/en active Active
-
2016
- 2016-05-17 MX MX2017014783A patent/MX369602B/en active IP Right Grant
- 2016-05-17 US US15/574,854 patent/US10447041B2/en active Active
- 2016-05-17 CN CN201680028829.XA patent/CN107636926B/en active Active
- 2016-05-17 WO PCT/EP2016/061026 patent/WO2016184857A1/en active Application Filing
- 2016-05-17 CA CA2985553A patent/CA2985553C/en active Active
- 2016-05-17 JP JP2017558402A patent/JP6929229B2/en active Active
Patent Citations (3)
| Publication number | Priority date | Publication date | Assignee | Title |
|---|---|---|---|---|
| US5933355A (en) * | 1995-05-04 | 1999-08-03 | Deb; Anjan Kumar | Object oriented expert power line ampacity system |
| US20050222808A1 (en) * | 2001-12-21 | 2005-10-06 | Abb Schweiz Ag | Determining an operational limit of a power transmision line |
| US20130066600A1 (en) * | 2011-09-01 | 2013-03-14 | Utility Risk Management Corporation, Llc | Method and apparatus for real-time line rating of a transmission line |
Also Published As
| Publication number | Publication date |
|---|---|
| MX2017014783A (en) | 2018-03-23 |
| CN107636926A (en) | 2018-01-26 |
| EP3096428A1 (en) | 2016-11-23 |
| CN107636926B (en) | 2021-02-05 |
| EP3096428B1 (en) | 2018-08-08 |
| CA2985553C (en) | 2023-09-26 |
| US10447041B2 (en) | 2019-10-15 |
| JP6929229B2 (en) | 2021-09-01 |
| MX369602B (en) | 2019-11-13 |
| US20180131189A1 (en) | 2018-05-10 |
| CA2985553A1 (en) | 2016-11-24 |
| JP2018518134A (en) | 2018-07-05 |
Similar Documents
| Publication | Publication Date | Title |
|---|---|---|
| WO2016184857A1 (en) | Dynamic line rating determination apparatus and associated method | |
| CN107005052B (en) | Method and system for determining current carrying capacity of power line | |
| CN101507074A (en) | Parameter estimation of a thermal model of a power line | |
| Catmull et al. | Cyclic load profiles for offshore wind farm cable rating | |
| CN111542980B (en) | Apparatus and method for identifying fault location in electric power transmission line | |
| CN104242267A (en) | Distance protection method for wind power generation transmission line | |
| Sidea et al. | Weather-based assessment of the overhead line conductors thermal state | |
| US20110043045A1 (en) | Systems and methods for asynchronous sampling data conversion | |
| Lewin et al. | Method for rating power cables buried in surface troughs | |
| Fernandez et al. | Dynamic line rating systems for wind power integration | |
| Alvarez et al. | Validation of a thermal model for overhead transmission lines at high conductor temperature | |
| Sollerkvist et al. | Evaluation, verification and operational supervision of corona losses in Sweden | |
| Yip et al. | Field experiences with dynamic line rating protection | |
| Mutule et al. | Methodology for transmission line capacity assessement based on PMU data | |
| Colin et al. | Offshore cable optimization by probabilistic thermal risk estimation | |
| Zafran et al. | A case study on alleviating electric transmission congestion using dynamic thermal rating methodology | |
| Hering et al. | On-line ampacity monitoring from phasor measurements | |
| Fernandez et al. | Power line monitoring for the analysis of overhead line rating forecasting methods | |
| Rácz et al. | Integration of Monte Carlo methods into ice prevention model | |
| Hajeforosh et al. | Transmission line overloading analysis using probabilistic dynamic line rating | |
| Murphy et al. | Real-time monitoring of transmission line thermal parameters: A literature review | |
| Yuan et al. | An improved temperature model for thermal ratings calculation of transmission line | |
| Abdaelbaset et al. | Impact of rain on transmission lines’ Ampacity: Scotland as a case study | |
| Bahadoorsingh et al. | Improving overhead transmission line usage efficiency on a caribbean island power system | |
| Vucic | Possibilities For Increasing The Transmission Capacity Of Overhead Lines In Real Meteorological Conditions |
Legal Events
| Date | Code | Title | Description |
|---|---|---|---|
| 121 | Ep: the epo has been informed by wipo that ep was designated in this application |
Ref document number: 16725428 Country of ref document: EP Kind code of ref document: A1 |
|
| ENP | Entry into the national phase |
Ref document number: 2017558402 Country of ref document: JP Kind code of ref document: A |
|
| ENP | Entry into the national phase |
Ref document number: 2985553 Country of ref document: CA |
|
| WWE | Wipo information: entry into national phase |
Ref document number: 15574854 Country of ref document: US Ref document number: MX/A/2017/014783 Country of ref document: MX |
|
| NENP | Non-entry into the national phase |
Ref country code: DE |
|
| REG | Reference to national code |
Ref country code: BR Ref legal event code: B01A Ref document number: 112017024664 Country of ref document: BR |
|
| 122 | Ep: pct application non-entry in european phase |
Ref document number: 16725428 Country of ref document: EP Kind code of ref document: A1 |
|
| ENP | Entry into the national phase |
Ref document number: 112017024664 Country of ref document: BR Kind code of ref document: A2 Effective date: 20171117 |