WO2010123596A1 - Method for predicting fluid flow - Google Patents

Method for predicting fluid flow Download PDF

Info

Publication number
WO2010123596A1
WO2010123596A1 PCT/US2010/021641 US2010021641W WO2010123596A1 WO 2010123596 A1 WO2010123596 A1 WO 2010123596A1 US 2010021641 W US2010021641 W US 2010021641W WO 2010123596 A1 WO2010123596 A1 WO 2010123596A1
Authority
WO
WIPO (PCT)
Prior art keywords
cells
bed
cell
bed topography
topography
Prior art date
Application number
PCT/US2010/021641
Other languages
French (fr)
Inventor
Tao Sun
Dachang Li
Original Assignee
Exxonmobil Upstream Research Company
Priority date (The priority date is an assumption and is not a legal conclusion. Google has not performed a legal analysis and makes no representation as to the accuracy of the date listed.)
Filing date
Publication date
Application filed by Exxonmobil Upstream Research Company filed Critical Exxonmobil Upstream Research Company
Priority to ES10767455T priority Critical patent/ES2792357T3/en
Priority to EP10767455.8A priority patent/EP2422222B1/en
Priority to CA2754736A priority patent/CA2754736C/en
Priority to US13/201,395 priority patent/US9128212B2/en
Priority to AU2010239716A priority patent/AU2010239716B2/en
Publication of WO2010123596A1 publication Critical patent/WO2010123596A1/en
Priority to US14/692,474 priority patent/US10162080B2/en

Links

Classifications

    • GPHYSICS
    • G01MEASURING; TESTING
    • G01VGEOPHYSICS; GRAVITATIONAL MEASUREMENTS; DETECTING MASSES OR OBJECTS; TAGS
    • G01V99/00Subject matter not provided for in other groups of this subclass
    • G01V20/00
    • GPHYSICS
    • G06COMPUTING; CALCULATING OR COUNTING
    • G06FELECTRIC DIGITAL DATA PROCESSING
    • G06F17/00Digital computing or data processing equipment or methods, specially adapted for specific functions
    • G06F17/10Complex mathematical operations
    • GPHYSICS
    • G06COMPUTING; CALCULATING OR COUNTING
    • G06FELECTRIC DIGITAL DATA PROCESSING
    • G06F30/00Computer-aided design [CAD]
    • G06F30/20Design optimisation, verification or simulation

Definitions

  • Numerical simulation is widely used in industrial fields as a method of simulating a physical system by using a computer. In most cases, there is a desire to model the transport processes occurring in the physical system. What is being transported is typically mass, energy, momentum, or some combination thereof. By using numerical simulation, it is possible to model and observe a physical phenomenon and to determine design parameters, without actual laboratory experiments and field tests.
  • the principle of numerical simulation is to numerically solve equations describing a physical phenomenon by a computer, such as fluid flow.
  • Such equations are generally ordinary differential equations and partial differential equations. These equations are typically solved by linearizing the equations and using numerical methods such as the finite element method, the finite difference method, the finite volume method, and the like.
  • the physical system to be modeled is divided into smaller gridcells or blocks (a set of which is called a grid or mesh), and the state variables continuously changing in each gridcell are represented by sets of values for each gridcell.
  • an original differential equation is replaced by a set of algebraic equations to express the fundamental principles of conservation of mass, energy, and/or momentum within each gridcell and transfer of mass, energy, and/or momentum transfer between gridcells. These equations can number in the millions.
  • Such replacement of continuously changing values by a finite number of values for each gridcell is called “discretization.”
  • timesteps In order to analyze a phenomenon changing in time, it is necessary to calculate physical quantities at discrete intervals of time called timesteps, irrespective of the continuously changing conditions as a function of time. Time-dependent modeling of the transport processes proceeds in a sequence of timesteps.
  • Many numerical schemes have been used for solving the partial differential equation, including for example the well known Godunov scheme.
  • Godunov's scheme is a conservative numerical scheme, suggested by S. K. Godunov in 1959, for solving partial differential equations.
  • the conservative variables are considered as piecewise constant over the mesh cells at each time step and the time evolution is determined by the exact solution of the Riemann problem (shock tube) at the inter-cell boundaries (Hirsch, C. (1990), Numerical Computation of Internal and External Flows, vol 2, Wiley.).
  • Step 2 Obtain the solution for the local Riemann problem at the cell interfaces. This is the only physical step of the whole procedure. The discontinuities at the interfaces are resolved in a superposition of waves satisfying locally the conservation equations.
  • the original Godunov method is based upon the exact solution of the Riemann problems. However, approximate solutions can be applied as an alternative.
  • Step 3 Average the state variables after a time interval At.
  • the state variables obtained after Step 2 are averaged over each cell defining a new piecewise constant approximation resulting from the wave propagation during the time interval At.
  • the time interval At should be limited such that the waves emanating from an interface do not interact with waves created at the adjacent interfaces. Otherwise the situation inside a cell would be influenced by interacting Riemann problems. This leads to the CFL condition
  • ⁇ a max ⁇ is the maximum wave speed obtained from the cell eigenvalue(s) of the local Jacobian matrix.
  • the first and third steps are solely of a numerical nature and can be considered as a projection stage, independent of the second, physical step, the evolution stage. Therefore, they can be modified without influencing the physical input, for instance by replacing the piecewise constant approximation by a piecewise linear variation inside each cell, leading to the definition of second-order space-accurate schemes, such as the MUSCL scheme.”
  • geologic modeling a digital representation of the detailed internal geometry and rock properties of a subsurface earth volume, such as a petroleum reservoir or a sediment-filled basin is built.
  • geologic models provide geologic input to reservoir performance simulations which are used to select locations for new wells, estimate hydrocarbon reserves, plan reservoir-development strategies, and/or perform other hydrocarbon extraction activities.
  • the spatial distribution of permeability is a key parameter in characterizing reservoir performance, and, together with other rock and fluid properties, determines the producibility of the reservoir.
  • the spatial distribution of permeability is a function of the grain-size distribution of sands which compose the reservoir, the compartmentalization of those sands by barriers of finer grained material, and the mineralogy and burial history of the reservoir.
  • model blocks To which geologic and/or geophysical properties such as lithology, porosity, acoustic impedance, permeability, and water saturation are assigned (such properties will be referred to collectively herein as "rock properties").
  • the entire set of model blocks represents the subsurface earth volume of interest.
  • the goal of the geologic-modeling process is to assign rock properties to each model block in the geologic model.
  • the geologic modeling process can use many different data types, including but not limited to rock-property data obtained from cores, well logs, seismic data, well test and production data, and structural and stratigraphic surfaces that define distinct zones within the model.
  • Other data types may include surface topographical data and aerial and satellite images that may be used to infer or predict subsurface geologic formations by observing and/or predicting similar geologic activities (erosion, deposition, fluid flow, sediment flow, etc.) on the earth's surface.
  • the resolution or spatial coverage of the available data is not adequate to uniquely determine the rock properties in every geologic model cell. Other assumptions about the variability in these properties are made in order to populate all model cells with reasonable property values.
  • Geocellular techniques, object-based modeling, and process modeling are three main ways to populate the discretized geologic volume with properties. [0009] In the geocellular approach, the relationship between properties in nearby cells is specified statistically. Geostatistical estimation methods (which may be either deterministic or probabilistic) are used to compute rock property values within cells. These methods take into account distance, direction, and spatial continuity of the rock property being modeled. Deterministic estimation methods commonly calculate a minimum-variance estimate of the rock property at each block. Probabilistic estimation methods develop distributions of the rock-property values and produce a suite of geologic model realizations for the rock property being modeled, with each realization theoretically being equally probable.
  • the spatial continuity of a rock property may be captured by a variogram, a well-known technique for quantifying the variability of a rock property as a function of separation distance and direction.
  • U.S. Pat. Nos. 5,838,634, 6,381,543 and 6,480,790 discuss geocellular modeling methods embodied in processing flows which include repetitive optimization steps to drive the geologic model toward conformance with geologic and geophysical data types such as wells, seismic surveys and subsurface fluid production and pressure data.
  • Most commercial modeling software packages, including PETREL, GOCAD and STRATAMODEL contain a wide spectrum of geostatistical tools designed to fulfill the requirements of reservoir geologists and engineers.
  • physics-based, process-based models are based on basic physics of fluid flow and sediment transport, and build the subsurface stratigraphy by explicitly modeling the fluid flow, sediment transport, erosion and deposition that occurred during the formation of the reservoir. Compared with other types of geologic models, these physics-based process-based models can better preserve the spatial continuities of sedimentary body geometries as well as flow baffles and barriers such as shale and mud deposits.
  • a component in the physics based process-based model is to solve the fluid flow and sediment transport equations. Often this involves solving shallow water or depth- averaged turbidity current equations.
  • a problem in solving shallow-water and depth-averaged turbidity current equations using Godunov-type schemes is the imbalance between flux gradients and bed slope source terms due to the discretized representations of flow and the underlying topography.
  • an ideal variable reconstruction and flux integration scheme should produce a sum of normal components of flux terms evaluated at the edges of a computational cell that exactly balances bed slope source terms evaluated at the center of the cell, and should produce zero changes in flow momentums in the cell.
  • these two terms generally do not balance each other in most of the low resolution schemes, as well as in many high resolution schemes.
  • the error introduced by the imbalance is often cumulative, and can significantly degrade the accuracies of the schemes, especially in locations where there are significant topographic variations and controls.
  • An improved method of predicting fluid flow, thereby to improve production management of hydrocarbon resources, is desirable.
  • a method of enhancing a geologic model of a subsurface region includes obtaining an initial bed topography of the subsurface region.
  • the bed topography is defined by a plurality of cells. Each of the plurality of cells has an elevation associated with its cell center.
  • the initial bed topography is represented as a cell-centered piecewise constant representation based on the elevations associated with the plurality of cells.
  • the bed topography is reconstructed to produce a spatially continuous surface. Flux and gravitational force-related source terms are calculated based on the reconstructed bed topography. Fluxes are calculated between at least two of the cells taking into account variations of the bed topography across an interface between the at least two of the cells.
  • Fluid flow, deposition of sediments onto the bed, and/or erosion of sediments from the bed are predicted using the fluxes and gravitational force-related source terms.
  • the predicted fluid flow, deposition and/or erosion are inputted into the geologic model of the subsurface region.
  • the geologic model is used to predict characteristics of the subsurface region.
  • the predicted characteristics of the subsurface region are outputted.
  • the fluxes may be calculated to at least a first order of accuracy.
  • Reconstructing the bed topography may comprise defining triangles by pairs of two consecutive cell vertices and an effective cell center.
  • a fluid surface elevation may be reconstructed, and flux and gravitational force-related source terms may be calculated based on the reconstructed bed topography and the reconstructed fluid surface elevation.
  • the fluid surface elevation may be reconstructed using a piecewise constant scheme or a piecewise linear scheme.
  • Hydrocarbons may be extracted based on the outputted characteristics of the subsurface region. Outputting the predicted characteristics of the subsurface region may include displaying the predicted characteristics.
  • Reconstructing the bed topography may conserve mass below and above the spatially continuous surface.
  • Calculating fluxes between at least two of the cells may be performed according to the following equation: wherein F * (I) represents a flux per unit width between two cells at the location that is a distance / from a cell face middle line between the at least two of the cells, n represents a unit vector perpendicular to a boundary between the at least two of the cells on an unstructured grid, I 0 represents half of the length of the boundary between the at least two of the cells, / *(0) represents a first expansion coefficient corresponding to a zeroth order flux per unit width at the center of the edge between the at least two of the cells, J ⁇ represents a second expansion coefficient, A L 2 represents the square of a dimensionless maximum fluid depth change in a first of the at least two of the cells, Jl represents a third expansion coefficient, A R 2 represents the square of a dimensionless maximum fluid depth change in a second of the at least two of the cells, / 5 * represents a fourth expansion coefficient, ⁇ z represents a dimensionless maximum fluid depth change in the first of the
  • Piecewise constant cell elevations may be updated using the predicted fluid flow, deposition of sediments, and/or erosion of sediments, and the steps of obtaining, reconstructing, calculating flux and source terms, calculating fluxes, and predicting may be repeated to improve accuracy of fluid flow predictions.
  • the predicted characteristics of the subsurface region may include at least one of sediment grain size distribution, porosity, and permeability.
  • the plurality of elevations may represent conservative variables, which may be updated based on the calculated source terms.
  • a computer program product having computer executable logic recorded on a tangible, machine-readable medium
  • the computer program product includes: code for obtaining a bed topography of a subsurface region, the bed topography defined by a plurality of cells, each of the plurality of cells having an elevation associated with its cell center; code for representing the bed topography as a cell-centered piecewise constant representation based on the elevations associated with the plurality of cells; code for reconstructing the bed topography to produce a spatially continuous surface; code for calculating flux and gravitational force-related source terms based on the reconstructed bed topography; code for calculating fluxes between at least two of the cells, taking into account variations of the bed topography across a face between the at least two of the cells; and code for predicting at least one of fluid flow, deposition of sediments onto the bed, and erosion of sediments from the bed using the fluxes and gravitational force-related source terms.
  • the fluxes may be calculated to at least a first order of accuracy.
  • Code for reconstructing the bed topography may include code for defining triangles by pairs of two consecutive cell vertices and an effective cell center.
  • Code may be provided for reconstructing a fluid surface elevation above the bed topography, and calculating flux and gravitational force-related source terms based on the reconstructed bed topography and the reconstructed fluid surface elevation.
  • Code may be provided for managing production of hydrocarbon resources based on the prediction of the fluid flow. Code may be provided for outputting the predicted fluid flow, the deposition of sediments, or the erosion of sediments.
  • a method of extracting hydrocarbons from a subsurface region is provided.
  • a bed topography of the subsurface region is obtained.
  • the bed topography is defined by a plurality of cells, each of the plurality of cells having an elevation associated with its cell center.
  • the bed topography is represented as a cell-centered piecewise constant representation based on the plurality of elevations.
  • the bed topography is reconstructed to produce a spatially continuous surface.
  • Flux and gravitational force-related source terms are calculated based on the reconstructed bed topography. Fluxes between at least two of the cells are calculated taking into account variations of the bed topography across a face between the at least two of the cells. At least one of fluid flow, deposition of sediments onto the bed, and erosion of sediments from the bed are predicted using the fluxes and gravitational force-related source terms. The presence of hydrocarbons in the subsurface region is predicted based at least in part on the predicted fluid flow, deposition of sediments, or erosion of sediments. Hydrocarbons are extracted from the subsurface region.
  • Fig. 1 is a diagram of a bed topography, a fluid surface elevation and an unstructured grid
  • Fig. 2 is a diagram of reconstructed cells in a bed topography
  • Fig. 3 is a diagram of reconstructed cells in a bed topography and a corresponding fluid surface elevation
  • Fig. 4 is a diagram that is useful in explaining calculation of flux between a left cell and a right cell
  • Fig. 5 is a process flow diagram showing a method according to aspects disclosed herein
  • Fig. 6 is a process flow diagram showing a method according to aspects disclosed herein;
  • Fig. 7 is a process flow diagram showing a method according to aspects disclosed herein;
  • Fig. 8 is a simplified block diagram of a computer environment
  • Fig. 9 is a block diagram showing a tangible, machine-readable medium that stores code to perform methods according to aspects disclosed herein.
  • Embodiments disclosed herein also relate to an apparatus for performing the operations herein.
  • This apparatus may be specially constructed for the required purposes, or it may comprise a general-purpose computer selectively activated or reconfigured by a computer program or code stored in the computer.
  • Such a computer program or code may be stored or encoded in a computer readable medium or implemented over some type of transmission medium.
  • a computer-readable medium includes any medium or mechanism for storing or transmitting information in a form readable by a machine, such as a computer ('machine' and 'computer' are used synonymously herein).
  • a computer-readable medium may include a computer-readable storage medium (e.g., read only memory (“ROM”), random access memory (“RAM”), magnetic disk storage media, optical storage media, flash memory devices, etc.).
  • a transmission medium may be twisted wire pairs, coaxial cable, optical fiber, or some other suitable transmission medium, for transmitting signals such as electrical, optical, acoustical or other form of propagated signals (e.g., carrier waves, infrared signals, digital signals, etc.)).
  • modules, features, attributes, methodologies, and other aspects can be implemented as software, hardware, firmware or any combination thereof.
  • a component implemented as software can be implemented as a standalone program, as part of a larger program, as a plurality of separate programs, as a statically or dynamically linked library, as a kernel loadable module, as a device driver, and/or in every and any other way known now or in the future to those of skill in the art of computer programming. Additionally, the invention is not limited to implementation in any specific operating system or environment.
  • Various terms as used herein are defined below. To the extent a term used in a claim is not defined below, it should be given the broadest possible definition persons in the pertinent art have given that term as reflected in at least one printed publication or issued patent.
  • celerity refers to the velocity of propagation of a wave through a fluid or liquid, relative to the rate of movement of the fluid or liquid through which the wave is propagated.
  • CFL condition refers to the Courant-Friedrichs-Lewy condition, which is a condition for convergence while solving certain partial differential equations (usually hyperbolic partial differential equations) numerically. It arises when explicit time- marching schemes are used for the numerical solution. As a consequence, the timestep must be less than a certain time in many explicit time-marching computer simulations, otherwise the simulation will produce wildly incorrect results.
  • displaying includes a direct act that causes displaying, as well as any indirect act that facilitates displaying.
  • Indirect acts include providing software to an end user, maintaining a website through which a user is enabled to affect a display, hyperlinking to such a website, or cooperating or partnering with an entity who performs such direct or indirect acts.
  • a first party may operate alone or in cooperation with a third party vendor to enable the reference signal to be generated on a display device.
  • the display device may include any device suitable for displaying the reference image, such as without limitation a cathode ray tube (CRT) monitor, a liquid crystal display (LCD) monitor, a plasma device, a flat panel device, an organic light-emitting diode (OLED) device or printer.
  • the display device may include a device which has been calibrated through the use of any conventional software intended to be used in evaluating, correcting, and/or improving display results (e.g., a color monitor that has been adjusted using monitor calibration software).
  • a method may include providing a reference image to a subject.
  • Providing a reference image may include creating or distributing the reference image to the subject by physical, telephonic, or electronic delivery, providing access over a network to the reference, or creating or distributing software to the subject configured to run on the subject's workstation or computer including the reference image.
  • the providing of the reference image could involve enabling the subject to obtain the reference image in hard copy form via a printer.
  • information, software, and/or instructions could be transmitted (e.g., electronically or physically via a data storage device or hard copy) and/or otherwise made available (e.g., via a network) in order to facilitate the subject using a printer to print a hard copy form of reference image.
  • the printer may be a printer which has been calibrated through the use of any conventional software intended to be used in evaluating, correcting, and/or improving printing results (e.g., a color printer that has been adjusted using color correction software).
  • the "Exner equation” is a statement of conservation of mass that applies to sediment in a fluvial system such as a river or subsurface hydrocarbon flow. Specifically, it states that bed elevation increases in proportion to the amount of sediment that drops out of transport, and decreases in proportion to the amount of sediment that becomes entrained by the flow.
  • extracting hydrocarbons refers to activities such as determining the general geologic structure of a subsurface region, locating potential hydrocarbon reservoirs, guiding the production of a previously discovered hydrocarbon reservoir, planning the location and timing of new wells, managing production from existing wells, predicting production lifetimes of wells or hydrocarbon reservoirs at various extraction rates, and/or other activities central or peripheral to removing hydrocarbons from a hydrocarbon reservoir.
  • hydrocarbon includes oil (often referred to as petroleum), natural gas, gas condensate, tar, and bitumen.
  • hydrocarbon reservoirs include reservoirs containing any hydrocarbon.
  • machine -readable medium refers to a medium that participates in directly or indirectly providing signals, instructions and/or data.
  • a machine-readable medium may take forms, including, but not limited to, non-volatile media (e.g. ROM, disk) and volatile media (RAM).
  • Machine-readable medium include, but are not limited to, a floppy disk, a flexible disk, a hard disk, a magnetic tape, other magnetic media a CD-ROM, other optical media, punch cards, paper tape, other physical media with patterns of holes, a RAM, a ROM, an EPROM, a FLASH-EPROM, or other types of memory chips or cards, a memory stick, and other media from which a computer, a processor or other electronic device can read.
  • MUSCL Monotone Upstream-centered Schemes for Conservation Laws, which are finite volume methods s that can provide highly accurate numerical solutions for a given system, even in cases where the solutions exhibit shocks, discontinuities, or large gradients.
  • MUSCL Monotone Upstream-centered Schemes for Conservation Laws, which are finite volume methods s that can provide highly accurate numerical solutions for a given system, even in cases where the solutions exhibit shocks, discontinuities, or large gradients.
  • MUSCL Monotone Upstream-centered Schemes for Conservation Laws, which are finite volume methods s that can provide highly accurate numerical solutions for a given system, even in cases where the solutions exhibit shocks, discontinuities, or large gradients.
  • solving water flow and sediment transport equations is useful in constructing physics process-based models for simulations of formation and evolutions of sedimentary basins and oil and gas reservoirs, and the subsequent building of the geologic models. Such models may be useful in predicting fluid flow parameters such as erosion or deposition, and in other activities related to hydrocarbon extraction.
  • geologic modeling a digital representation of the detailed internal geometry and rock properties of a subsurface earth volume, such as a petroleum reservoir or a sediment- filled basin is built.
  • geologic models provide geologic input to reservoir performance simulations which are used to select locations for new wells, estimate hydrocarbon reserves, plan reservoir-development strategies, and/or perform other hydrocarbon extraction activities.
  • the spatial distribution of permeability may assist in characterizing reservoir performance, and, together with other rock and fluid properties, may determines the producibility of the reservoir.
  • the spatial distribution of permeability is a function of the grain-size distribution of sands which compose the reservoir, the compartmentalization of those sands by barriers of finer grained material, and the mineralogy and burial history of the reservoir.
  • Most geologic models built for petroleum applications are in the form of a three- dimensional array of model blocks (cells), to which geologic and/or geophysical properties such as lithology, porosity, acoustic impedance, permeability, and water saturation are assigned (such properties are referred to collectively herein as "rock properties").
  • the entire set of model blocks represents the subsurface earth volume of interest.
  • the goal of the geologic-modeling process is to assign rock properties to each model block in the geologic model.
  • a bed topography reconstruction scheme and a flux integration scheme balances flux gradients and corresponding bed slope source terms to second orders of accuracy over arbitrary bed topographies.
  • the combination of the bed topography reconstruction scheme and the flux integration scheme leads to more accurate results when compared to known methods, with only a minor increase in computational effort.
  • the method may be used with cell-centered discretization schemes where both flow variables as well as bed topographic information are represented in the center of cells.
  • a cell-centered discretization scheme in one aspect may be the simplest one that attempts to ensure the conservation of mass for both solids below the top bed surface and the liquid above. Such a constraint may provide improved results when the flow and transport equations are coupled with sediment erosion, deposition and the sediment mass conservation equations on the bed, such as the Exner equation, to solve bed evolutions in both shallow and deep water environments.
  • the amount of erosion, deposition and cell elevation change are all calculated using the flow and sediment information associated with the center of the cell, without any need of extrapolation among neighboring cells.
  • Fig. 1 is a diagram of a bed topography, a fluid surface elevation and an unstructured grid that is useful in explaining the operation of an embodiment.
  • the diagram which is generally referred to by reference number 100, includes a bed topography 102, a fluid surface elevation 104 and an unstructured grid 106.
  • the unstructured grid 106 includes a plurality of two-dimensional cells.
  • a first cell 108 is a polygon that is bounded by line segments ABCDE.
  • a second cell 110 is a polygon that is bounded by line segments AGHB.
  • a third cell 112 is a polygon that is bounded by line segments BHIJC.
  • a fourth cell 114 comprises a polygon that is bounded by line segments CKLD.
  • a fifth cell 116 is a polygon that is bounded by line segments DMNOE.
  • a sixth cell 118 is a polygon that is bounded by line segments AEF.
  • An embodiment relates to a cell-based discretization scheme in which values of variables are associated with cell centers rather than at their vertices. Spatial variability of each variable within each cell is not stored and may only be reconstructed using different reconstruction schemes.
  • the simplest of such schemes is the piecewise constant reconstruction scheme. In this scheme, the value for each variable remains constant within each cell and equals the value that is stored in the cell.
  • Fig. 1 the results of the piecewise constant reconstruction of the bed topography 102 and the fluid surface elevation 104 are shown together with the unstructured grid 106.
  • One prominent feature to note is the discontinuities of the reconstructed values across cell edges.
  • the elevations across the cell edge BC on the underlying grid 106 which correspond to the edges marked BlCl and B3C3 in the bed topography 102, for the first cell 108 and the third cell 112 respectively, are discontinuous.
  • the edges BlCl and B3C3 are located at different positions in the z-direction relative to the underlying grid 106.
  • the fluid surface elevation 104 shows that the corresponding areas labeled as lines B1*C1* and B3*C3* are also discontinuous in the z-direction.
  • An embodiment produces continuous bed surfaces, eliminates the discontinuities as described above, and in the process, conserves the mass in volumes bounded by corresponding areas of the bed topography 102 and the fluid surface elevation 104, as well as volumes bounded by corresponding areas of the bed topography 102 and the unstructured grid 106. In other words, for each cell, the amount of mass that is enclosed between any arbitrary surface below or above the bed topography 102 remains the same before and after the reconstruction of the bed surface in that cell.
  • Fig. 2 is a diagram of reconstructed cells in a bed topography.
  • the diagram which is generally referred to by reference number 200, includes a bed topography 202 and an unstructured grid 206.
  • the unstructured grid 206 is a plurality of cells.
  • a first cell 208 is a polygon that is bounded by line segments ABCDE.
  • a second cell 210 is a polygon that is bounded by line segments AGHB.
  • a third cell 212 is a polygon that is bounded by line segments BHIJC.
  • a fourth cell 214 is a polygon that is bounded by line segments CKLD.
  • a fifth cell 216 is a polygon that is bounded by line segments DMNOE.
  • a sixth cell 218 is a polygon that is bounded by line segments AEF.
  • the bed topography 202 includes two cells that have been reconstructed.
  • the bed topography 202 shows a reconstructed first cell 208', which corresponds to the first cell 208 of the unstructured grid 206, and a reconstructed third cell 212', which corresponds to the third cell 212 of the unstructured grid 206.
  • the surfaces defined by triangles ⁇ ieAmBm, ⁇ le BmCm, ⁇ i e CmDm, ⁇ i e DmEm, and ⁇ ieEmAm are the reconstructed surfaces for the first reconstructed cell 208'.
  • the surfaces defined by triangles ⁇ 3e CmBm, ⁇ 3e BmHm, ⁇ 3e Hmlm, ⁇ 3e ImJm and ⁇ 3e JmCm are the reconstructed surfaces for the third reconstructed cell 212'.
  • the points Am, Bm, Cm, Dm, Em, Hm, Im, and Jm represent the effective elevations at the vertices A, B, C, D, E, H, I, and J respectively.
  • the points ⁇ 1e and ⁇ 3e are the effective cell center elevations for the first reconstructed cell 208' and the third reconstructed cell 212' respectively.
  • the points ⁇ 1b and ⁇ i represent the projections of the point ⁇ le on the original piecewise constant cell bed surface AIBICIDIEI and the gridding surface ABCDEF.
  • the points ⁇ 3b and ⁇ 3 are the projections of the point ⁇ 3 e on the original piecewise constant cell bed surface C3B3H3I3 J3 and the gridding surface CBHIJ.
  • the volume of regions between the bed topography 202 and the unstructured grid 206 is conserved.
  • the volume enclosed by the surface ABCDE and piecewise constant bed surface AIBICIDIEI are the same as the volume enclosed by the surface ABCDE and the reconstructed bed surface, which includes five triangles ⁇ i e AmBm, ⁇ le BmCm, ⁇ i e CmDm, ⁇ i e DmEm, and ⁇ i e EmAm.
  • the volume of the fluid above the bed surface in the cell is also conserved before and after the reconstruction of the bed.
  • Reconstruction of a bed topography includes three steps: calculating the cell center, calculating the effective elevation at each cell vertex and calculating the effective elevation for the cell center. Each of these steps is described in detail below.
  • the second step of reconstructing a bed topography is to calculate the effective elevation for the cell center.
  • d j the distance from a vertex to the center of the j th cell that shares the vertex.
  • the third step of reconstructing a bed topography is to calculate the effective elevation for the cell center.
  • the effective cell center elevation may be given by equation (4):
  • An example is triangle AmBm ⁇ i e . Its projected area is the area of the triangle AB ⁇ i.
  • XJ ( ⁇ and 7 c ( ⁇ ) are the x and y coordinates of the center of that triangle, respectively, and the values of a[' ⁇ , a ⁇ , b[' ⁇ , b ⁇ , c w , d[' ⁇ , d 2 (l) may be given by equation (A6) and equations (A8-A13) in Appendix A.
  • equation (5) the elevation of any point in a cell with coordinates (x, y) on the reconstructed bed surface may be given by equation (5): with(x, j) ⁇ ⁇ , .
  • equation a (l) , b (l) , c (l) , and d (l) are given by equations (A4-A7), respectively, in Appendix A.
  • the reconstructed bed surface elevation z can be obtained in another way.
  • Fig. 3 is a diagram of reconstructed cells in a bed topography and a corresponding fluid surface elevation.
  • the diagram which is referred to generally by reference number 300, includes a bed topography 302 and a fluid surface elevation 304.
  • the bed topography 302 comprises the reconstructed cells described above with reference to Fig. 2.
  • the surfaces A1*B1*C1*D1*E1*, A2*G2*H2*B2*, B3*H3*I3*J3*C3*, D4*C4*K4*L4*, 05 *E5*D5 *M5*N5*, and F6*A6*E6* of the fluid surface elevation 304 are the piecewise constant representation of a fluid surface.
  • the surface Ae*Be*Ce*De*Ee* is the piecewise linear representation of the fluid surface.
  • the fluid surface may be represented by a number of different schemes. The two simplest schemes are the piecewise constant scheme and the piecewise linear scheme.
  • a piecewise constant scheme may assume that the fluid surface elevation ⁇ xj) ⁇ & constant everywhere in a cell.
  • Such a piecewise linear scheme may take many different forms. For example, one form is set forth in the equations (9), (10), (11), and (12):
  • U , F , G and S may vary from different formulations for shallow and deep water flows. One embodiment may, however, be applied with respect to all of the forms.
  • U x and u are the x - and y - components of the depth averaged flow velocity respectively
  • h is the depth of the turbid flow
  • z is the bottom elevation
  • C k is the volumetric concentration of the sediments in the k th grain size bin
  • equation (18) represents the total sediment concentration.
  • g represents the gravitational constant
  • i? is the submerged specific weight for the sediments. i? may be represented by
  • Equation (19) p s and p w are the sediment and water density respectively.
  • K is the turbulent kinetic energy .
  • R w in equations (15) and (16) may be given by
  • the ambient fluid is air, which has a density much smaller than the water density, where p a « p w . Therefore R w can be represented by for the shallow water environment.
  • fluxes may be calculated across cell faces.
  • An example of a cell face is the surface BmCmCe*Be* shown in Fig. 3. The calculation of flux across a cell face is described in detail below with reference to Fig. 4.
  • Fig. 4 is a diagram that is useful in explaining calculation of flux between a left cell and a right cell.
  • the diagram is referred to generally by reference number 400.
  • the diagram 400 comprises bed topography 402 and a fluid surface elevation 404.
  • the bed topography 402 represents a subset of the bed topography 302 shown in Fig. 3.
  • the representation of the bed topography 402 corresponds to the reconstructed cells of the bed topography 302.
  • the fluid surface elevation 404 represents a subset of the fluid surface elevation 304 shown in Fig. 3. Without losing generality, a first cell 406 of the fluid surface elevation is denoted as a left cell.
  • a second cell 408 of the fluid surface elevation 404 is denoted as a right side cell. Calculating the fluxes of fluid flowing between the left cell and the right cell is described in detail below.
  • the reconstructed bed surfaces of the topography bed 402 which may be obtained using a reconstruction scheme disclosed herein, are continuous across the cell faces.
  • the fluid surfaces of the fluid surface elevation 404 are, however, often discontinuous, as shown in Fig. 4. Therefore the water depths at the cell face in two cells are often different from each other. Also, the degree of the discontinuities may be different at the different locations on the cell face.
  • I 0 is the half cell edge length for cell /or / + 1 .
  • HLL solver is the dimensionless distance from the cell face middle line, is the dimensionless maximum fluid depth change in the left cell at the cell face, and ⁇ 1 R ) is the dimensionless maximum fluid depth change in the right cell at the cell face.
  • HLL solver obtains an approximate solution for the inter-cell numerical flux directly by assuming a particular wave configuration for the solution and calculating the wave speed (Harten, A., Lax, P., and van Leer, A., "On upstream differencing and Godunov-type scheme for hyperbolic conservation laws", Soc.
  • a L representing a dimensionless maximum fluid depth change in the first of the at least two of the cells
  • a R representing a dimensionless maximum fluid depth change in the second of the at least two of the cells.
  • u xL and u yL are the x and y components of the flow velocity in the left cell, respectively.
  • u xR and u yR are respectively the x and y components of the flow velocity in the right cell.
  • equations (34) and (35), 8) and ⁇ ) [0074] Because the fluid depths in both left and right cells vary with the distance / from the center of the cell face, and the differences of the fluid depths across the cell face also varies with / , the value of flux F * ⁇ ⁇ in equation (33) varies with / . The calculation of the total flux across the cell face requires the evaluation the integral F ⁇ I) - ndl . To avoid
  • equation (33) is first Taylor expanded to the order of o( ⁇ ) , o( ⁇ ) or o(A L A R ) and then the result is integrated over / analytically. Detailed derivation is given in Appendix B. The final result is where the expressions for evaluating / (0) , Jl , j A and // are given in equations (B48) to
  • Fig. 5 is a process flow diagram showing a method 500 according to disclosed techniques and methodologies.
  • an initial bed topography of a subsurface region is obtained.
  • the bed topography is defined by a plurality of cells.
  • Each of the plurality of cells has an elevation associated with its cell center. This elevation may be a fluid height elevation, bed elevation, or both.
  • Other conservative variables, such as sediment volumes, may be stored in the center of one or more cells.
  • the values may be stored in a memory (as discussed further herein) associated with each cell center.
  • a two- dimensional unstructured grid of cells may form and be represented as a piecewise constant bed topography (and/or a piecewise constant fluid surface topography) that may be expressed or displayed as a three-dimensional model of cells showing bed and/or fluid elevations.
  • the piecewise constant bed topography is reconstructed to produce a spatially continuous surface for flux and source term calculations.
  • a piecewise constant fluid topography may be reconstructed based on the spatially continuous surface.
  • flux between cells is calculated using the reconstructed bed topography. As an example, the flux calculation may be performed as described above with reference to Fig.
  • the 4 may include calculating flux terms based on the reconstructed bed topography. For example, the flux calculation may take into account variations of the bed topography across a face between the cells.
  • gravitational force-related source constants may be calculated based on the reconstructed bed topography.
  • the reconstructed fluid topography may additionally be used in calculating the gravitational force-related source constants.
  • other source terms for the cells may be calculated, if needed.
  • the conservative variables stored at block 502 may be updated and primary variables computed, as shown at block 514. Based on the updated variables, fluid flow parameters such as erosion and deposition may be predicted, as shown at block 516.
  • the piecewise constant cell elevations may additionally be updated. As shown in Fig.
  • Figure 6 shows a method 600 that uses predictions of fluid flow, erosion and/or deposition as an input to a geologic model.
  • the method receives such predictions as are made at block 516 of Figure 5.
  • the predictions are input into a geologic model.
  • the geologic model may be one as is described previously herein.
  • the geologic model is used to predict geologic characteristics (such as sediment grain size distribution, porosity, permeability, connectivity, and the like) of a subsurface region.
  • values for the predicted characteristics are outputted.
  • Figure 7 shows a method 700 that uses predictions of fluid flow, erosion and/or deposition, and/or geologic characteristics to extract hydrocarbons from a subsurface region, which may include a hydrocarbon reservoir or field.
  • the method receives the predictions made at block 516 and/or block 608.
  • the presence of hydrocarbons in a subsurface region is predicted based at least in part on the predictions made at block 516.
  • hydrocarbons are extracted from the subsurface region.
  • the activities defined by the term "extracting hydrocarbons" may be broadly interpreted as set forth herein.
  • Figure 8 depicts a block diagram of a computing environment 800 that may implement one or more of the disclosed methods.
  • Computing environment 800 includes a system computer 802, which may be implemented as any conventional personal computer or workstation, such as a UNIX-based workstation or any other computing clusters or supercomputers.
  • the system computer 802 is in communication with disk storage devices 804, 806, and 808, each of which may be any known type of computer-readable storage media such as external hard disk storage devices that are either directly connected to the system computer or accessed using a local area network or by remote access.
  • disk storage devices 804, 806, and 808 are illustrated as separate devices, a single disk storage device may be used to store any and all of the program instructions, measurement data, and results as desired.
  • the input data are stored in disk storage device 806.
  • the system computer 802 may retrieve the appropriate data from the disk storage device 806 to perform program instructions corresponding to the methods described herein.
  • the program instructions may be written in a computer programming language, such as C++, C#, Java and the like.
  • the program instructions may be stored in a computer-readable memory, such as program disk storage device 808.
  • System computer 802 presents output primarily onto a text/graphics display 810, or alternatively to a printer 812.
  • the system computer 802 may store the predictions or other results of the methods described herein on disk storage 804, for later use and further analysis.
  • a keyboard 814 and a pointing device (e.g., a mouse, trackball, or the like) 816 may be provided with the system computer 802 to enable interactive operation.
  • the system computer 802 may be located at a data center remote from the reservoir. Additionally, while the description above is in the context of computer-executable instructions that may run on one or more computers, those skilled in the art will recognize that the subject matter as claimed also can be implemented in combination with other program modules and/or as a combination of hardware and software.
  • Fig. 9 is a block diagram showing a tangible, machine-readable medium that stores code adapted to perform method disclosed herein.
  • the tangible, machine-readable medium is generally referred to by the reference number 900.
  • the tangible, machine-readable medium 900 may comprise one or more hard disk drives, a DVD, a CD or the like, and may correspond to disk storage device 806 in Figure 8.
  • the tangible, machine-readable medium 900 stores computer-readable code 902 for obtaining a bed topography of a subsurface region, where the bed topography is defined by a plurality of cells. Each of the plurality of cells has an elevation associated with its cell center, and the bed topography and elevations may be stored in a memory location in disk storage devices 804, 806, and/or 808.
  • Code 904 represents the bed topography as a cell-centered piecewise constant representation based on the cell center elevations.
  • Code 906 reconstructs the bed topology as a spatially continuous surface.
  • Code 908 calculates flux and gravitational force-related source terms based on the reconstructed bed topography.
  • the tangible, machine -readable medium 900 also stores code 910, which calculates fluxes between at least two of the cells taking into account variations of the bed topography across a face between the at least two of the cells.
  • Code 912 predicts fluid flow, deposition of sediments onto the bed, and/or erosion of sediments from the bed using the fluxes and the gravitational force-related source terms.
  • the tangible, machine-readable medium 900 may contain or store code relating to one or more of: inputting predictions into a geologic model of the subsurface region, using the geologic model to predict characteristics of the subsurface region, outputting the predicted characteristics of the subsurface region, predicting the presence of hydrocarbons in the subsurface region, extracting hydrocarbons from the subsurface region, and any other actions or steps disclosed herein.
  • the invention may have broad applications in the oil and gas industry, as well as many other areas such as environmental protection and management, flood and hurricane control, and flood and hurricane forecasting.
  • the HLL flux function shown in the right side of equation (33) is first Taylor expanded to the second order of o(A 2 R ) or o(A L A R ) .
  • V n is the fluid volume on top of the triangle ⁇ ; . It can be calculated as

Abstract

A method of enhancing a geologic model of a subsurface region is provided. A bed topography of the subsurface region is obtained. The bed topography is defined by a plurality of cells with an elevation associated with each cell center. The bed topography is represented as a cell-centered piecewise constant representation based on the elevations associated with the cells. The bed topography is reconstructed to produce a spatially continuous surface. Flux and gravitational force-related source terms are calculated based on the reconstructed bed topography. Fluxes are calculated between at least two of the cells. Fluid flow, deposition of sediments onto the bed, and/or erosion of sediments from the bed are predicted using the fluxes and gravitational force-related source terms. The predictions are inputted into the geologic model to predict characteristics of the subsurface region, and the predicted characteristics are outputted.

Description

METHOD FOR PREDICTING FLUID FLOW
CROSS-REFERENCE TO RELATED APPLICATION
[0001] This application claims the benefit of U.S. Provisional Patent Application 61/170,896 filed 20 April 2009 entitled METHOD FOR PREDICTING FLUID FLOW, the entirety of which is incorporated by reference herein.
TECHNICAL FIELD
[0002] Aspects of methodologies and techniques disclosed herein relate to methods for efficiently and accurately solving water flow and sediment transport equations numerically, which may be used to predict fluid flow and optimize production of hydrocarbon resources from geologic formations based on such predictions.
BACKGROUND OF THE DISCLOSURE
[0003] Numerical simulation is widely used in industrial fields as a method of simulating a physical system by using a computer. In most cases, there is a desire to model the transport processes occurring in the physical system. What is being transported is typically mass, energy, momentum, or some combination thereof. By using numerical simulation, it is possible to model and observe a physical phenomenon and to determine design parameters, without actual laboratory experiments and field tests.
[0004] The principle of numerical simulation is to numerically solve equations describing a physical phenomenon by a computer, such as fluid flow. Such equations are generally ordinary differential equations and partial differential equations. These equations are typically solved by linearizing the equations and using numerical methods such as the finite element method, the finite difference method, the finite volume method, and the like. In each of these methods, the physical system to be modeled is divided into smaller gridcells or blocks (a set of which is called a grid or mesh), and the state variables continuously changing in each gridcell are represented by sets of values for each gridcell. In the finite difference method, an original differential equation is replaced by a set of algebraic equations to express the fundamental principles of conservation of mass, energy, and/or momentum within each gridcell and transfer of mass, energy, and/or momentum transfer between gridcells. These equations can number in the millions. Such replacement of continuously changing values by a finite number of values for each gridcell is called "discretization." In order to analyze a phenomenon changing in time, it is necessary to calculate physical quantities at discrete intervals of time called timesteps, irrespective of the continuously changing conditions as a function of time. Time-dependent modeling of the transport processes proceeds in a sequence of timesteps. Many numerical schemes have been used for solving the partial differential equation, including for example the well known Godunov scheme. In the Godunov scheme, conservative variables are considered as piecewise constant over the mesh cells at each time step and the time evolution is determined by the exact solution of what is known as the Riemann problem. To reduce computation time, the changes in the model parameter values defined for individual grid cells are typically piecewise-constant within the cells rather than continuously varying. [0005] The Wikipedia article "Godunov's Scheme" as accessed on April 9, 2009 (http://en.wikipedia.org/wiki/Godunov%27s_scheme) describes Godunov's scheme as follows:
"In numerical analysis and computational fluid dynamics, Godunov's scheme is a conservative numerical scheme, suggested by S. K. Godunov in 1959, for solving partial differential equations. In this method, the conservative variables are considered as piecewise constant over the mesh cells at each time step and the time evolution is determined by the exact solution of the Riemann problem (shock tube) at the inter-cell boundaries (Hirsch, C. (1990), Numerical Computation of Internal and External Flows, vol 2, Wiley.).
Following Hirsch, the scheme involves three distinct steps to obtain the solution at t =
(n+l) At from the known solution at t = n At , as follows:
Step 1 Define piecewise constant approximation of the solution at t = (n+l) At. Since the piecewise constant approximation is an average of the solution over the cell of size Δx , the spatial error is of order Δx , and hence the resulting scheme will be first-order accurate in space. Note that this approximation corresponds to a finite volume method representation whereby the discrete values represent averages of the state variables over the cells. Exact relations for the averaged cell values can be obtained from the integral conservation laws.
Step 2 Obtain the solution for the local Riemann problem at the cell interfaces. This is the only physical step of the whole procedure. The discontinuities at the interfaces are resolved in a superposition of waves satisfying locally the conservation equations. The original Godunov method is based upon the exact solution of the Riemann problems. However, approximate solutions can be applied as an alternative.
Step 3 Average the state variables after a time interval At. The state variables obtained after Step 2 are averaged over each cell defining a new piecewise constant approximation resulting from the wave propagation during the time interval At. To be consistent, the time interval At should be limited such that the waves emanating from an interface do not interact with waves created at the adjacent interfaces. Otherwise the situation inside a cell would be influenced by interacting Riemann problems. This leads to the CFL condition
\amax\ At < Ax /2 where \amax\ is the maximum wave speed obtained from the cell eigenvalue(s) of the local Jacobian matrix.
The first and third steps are solely of a numerical nature and can be considered as a projection stage, independent of the second, physical step, the evolution stage. Therefore, they can be modified without influencing the physical input, for instance by replacing the piecewise constant approximation by a piecewise linear variation inside each cell, leading to the definition of second-order space-accurate schemes, such as the MUSCL scheme."
[0006] In geologic modeling, a digital representation of the detailed internal geometry and rock properties of a subsurface earth volume, such as a petroleum reservoir or a sediment-filled basin is built. In the oil and gas industry, geologic models provide geologic input to reservoir performance simulations which are used to select locations for new wells, estimate hydrocarbon reserves, plan reservoir-development strategies, and/or perform other hydrocarbon extraction activities. The spatial distribution of permeability is a key parameter in characterizing reservoir performance, and, together with other rock and fluid properties, determines the producibility of the reservoir. For sandstone reservoirs, the spatial distribution of permeability is a function of the grain-size distribution of sands which compose the reservoir, the compartmentalization of those sands by barriers of finer grained material, and the mineralogy and burial history of the reservoir.
[0007] Most geologic models built for petroleum applications are in the form of a three- dimensional array of model blocks (cells), to which geologic and/or geophysical properties such as lithology, porosity, acoustic impedance, permeability, and water saturation are assigned (such properties will be referred to collectively herein as "rock properties"). The entire set of model blocks represents the subsurface earth volume of interest. The goal of the geologic-modeling process is to assign rock properties to each model block in the geologic model.
[0008] The geologic modeling process can use many different data types, including but not limited to rock-property data obtained from cores, well logs, seismic data, well test and production data, and structural and stratigraphic surfaces that define distinct zones within the model. Other data types may include surface topographical data and aerial and satellite images that may be used to infer or predict subsurface geologic formations by observing and/or predicting similar geologic activities (erosion, deposition, fluid flow, sediment flow, etc.) on the earth's surface. In general, the resolution or spatial coverage of the available data is not adequate to uniquely determine the rock properties in every geologic model cell. Other assumptions about the variability in these properties are made in order to populate all model cells with reasonable property values. Geocellular techniques, object-based modeling, and process modeling are three main ways to populate the discretized geologic volume with properties. [0009] In the geocellular approach, the relationship between properties in nearby cells is specified statistically. Geostatistical estimation methods (which may be either deterministic or probabilistic) are used to compute rock property values within cells. These methods take into account distance, direction, and spatial continuity of the rock property being modeled. Deterministic estimation methods commonly calculate a minimum-variance estimate of the rock property at each block. Probabilistic estimation methods develop distributions of the rock-property values and produce a suite of geologic model realizations for the rock property being modeled, with each realization theoretically being equally probable. The spatial continuity of a rock property may be captured by a variogram, a well-known technique for quantifying the variability of a rock property as a function of separation distance and direction. U.S. Pat. Nos. 5,838,634, 6,381,543 and 6,480,790 discuss geocellular modeling methods embodied in processing flows which include repetitive optimization steps to drive the geologic model toward conformance with geologic and geophysical data types such as wells, seismic surveys and subsurface fluid production and pressure data. Most commercial modeling software packages, including PETREL, GOCAD and STRATAMODEL, contain a wide spectrum of geostatistical tools designed to fulfill the requirements of reservoir geologists and engineers. While these methods can readily accommodate data control points such as wells and geophysical constraints such as seismic data, they generally do not closely replicate the geologic structures observed in natural systems. [0010] In the object-based approach, subsurface reservoir volumes are treated as assemblages of geologic objects with pre-defined forms such as channels and depositional lobes. U.S. Pat. No. 6,044,328 discloses one object-based modeling scheme that allows geologists and reservoir engineers to select geologic objects from an analog library to best match the reservoir being modeled. The appropriateness of the analog is judged by the operator of the process based on their geologic experience. Most commercial software packages including PETREL, IRAP-RMS and GOCAD implement objects as volumetric elements that mimic channels and lobes using simplified elements based on user deformable shapes such as half pipes and ellipses. Other examples of object-based models are the model depositional objects, such as a river belt and the braided stream network, are placed sequentially on top of each other according to some algorithms. While these models try to mimic the real depositional structures, they do not attempt to capture the physics of water flow and sediment transport that, over geologic time, determined the rock properties at a particular subsurface location. [0011] Process-based models attempt to reproduce subsurface stratigraphy by building sedimentary deposits in chronological order relying to varying degrees on a model or approximation of the physical processes shaping the geology. Although process models are rarely used in current industrial practice, U.S. Pat. Nos. 5,844,799, 6,205,402 and 6,246,963 describe three such methods. These methods employ diffusion or rule-based process models to create basin-scale models with limited spatial detail inadequate for reservoir performance simulation. Another type of model is hydrodynamics-based gridding, which in one aspect may generate grid surfaces conforming to time surfaces during the process of sedimentation. Hydrodynamics-based gridding is the subject of U.S. Patent Application No. 11/629,822, "Method for Geologic Modeling Through Hydrodynamics-Based Gridding (Hydro-Grids)", having inventors Li et al. and filed December 15, 2006.
[0012] Other types of process-based models that could potentially provide the most accurate representation of geologic structures are physics-based, process-based models. These models are based on basic physics of fluid flow and sediment transport, and build the subsurface stratigraphy by explicitly modeling the fluid flow, sediment transport, erosion and deposition that occurred during the formation of the reservoir. Compared with other types of geologic models, these physics-based process-based models can better preserve the spatial continuities of sedimentary body geometries as well as flow baffles and barriers such as shale and mud deposits. [0013] A component in the physics based process-based model is to solve the fluid flow and sediment transport equations. Often this involves solving shallow water or depth- averaged turbidity current equations. A problem in solving shallow-water and depth-averaged turbidity current equations using Godunov-type schemes is the imbalance between flux gradients and bed slope source terms due to the discretized representations of flow and the underlying topography. For stationary flow problems, an ideal variable reconstruction and flux integration scheme should produce a sum of normal components of flux terms evaluated at the edges of a computational cell that exactly balances bed slope source terms evaluated at the center of the cell, and should produce zero changes in flow momentums in the cell. In practice however, these two terms generally do not balance each other in most of the low resolution schemes, as well as in many high resolution schemes. The error introduced by the imbalance is often cumulative, and can significantly degrade the accuracies of the schemes, especially in locations where there are significant topographic variations and controls. An improved method of predicting fluid flow, thereby to improve production management of hydrocarbon resources, is desirable.
SUMMARY
[0014] A method of enhancing a geologic model of a subsurface region is provided. The method includes obtaining an initial bed topography of the subsurface region. The bed topography is defined by a plurality of cells. Each of the plurality of cells has an elevation associated with its cell center. The initial bed topography is represented as a cell-centered piecewise constant representation based on the elevations associated with the plurality of cells. The bed topography is reconstructed to produce a spatially continuous surface. Flux and gravitational force-related source terms are calculated based on the reconstructed bed topography. Fluxes are calculated between at least two of the cells taking into account variations of the bed topography across an interface between the at least two of the cells. Fluid flow, deposition of sediments onto the bed, and/or erosion of sediments from the bed are predicted using the fluxes and gravitational force-related source terms. The predicted fluid flow, deposition and/or erosion are inputted into the geologic model of the subsurface region. The geologic model is used to predict characteristics of the subsurface region. The predicted characteristics of the subsurface region are outputted.
[0015] The fluxes may be calculated to at least a first order of accuracy. Reconstructing the bed topography may comprise defining triangles by pairs of two consecutive cell vertices and an effective cell center. A fluid surface elevation may be reconstructed, and flux and gravitational force-related source terms may be calculated based on the reconstructed bed topography and the reconstructed fluid surface elevation. The fluid surface elevation may be reconstructed using a piecewise constant scheme or a piecewise linear scheme. Hydrocarbons may be extracted based on the outputted characteristics of the subsurface region. Outputting the predicted characteristics of the subsurface region may include displaying the predicted characteristics. Reconstructing the bed topography may conserve mass below and above the spatially continuous surface. Calculating fluxes between at least two of the cells may be performed according to the following equation:
Figure imgf000009_0001
wherein F* (I) represents a flux per unit width between two cells at the location that is a distance / from a cell face middle line between the at least two of the cells, n represents a unit vector perpendicular to a boundary between the at least two of the cells on an unstructured grid, I0 represents half of the length of the boundary between the at least two of the cells, /*(0) represents a first expansion coefficient corresponding to a zeroth order flux per unit width at the center of the edge between the at least two of the cells, J^ represents a second expansion coefficient, AL 2 represents the square of a dimensionless maximum fluid depth change in a first of the at least two of the cells, Jl represents a third expansion coefficient, AR 2 represents the square of a dimensionless maximum fluid depth change in a second of the at least two of the cells, /5 * represents a fourth expansion coefficient, Δz represents a dimensionless maximum fluid depth change in the first of the at least two of the cells, and AR represents a dimensionless maximum fluid depth change in the second of the at least two of the cells. Piecewise constant cell elevations may be updated using the predicted fluid flow, deposition of sediments, and/or erosion of sediments, and the steps of obtaining, reconstructing, calculating flux and source terms, calculating fluxes, and predicting may be repeated to improve accuracy of fluid flow predictions. The predicted characteristics of the subsurface region may include at least one of sediment grain size distribution, porosity, and permeability. The plurality of elevations may represent conservative variables, which may be updated based on the calculated source terms. [0016] In another aspect, a computer program product having computer executable logic recorded on a tangible, machine-readable medium is provided, The computer program product includes: code for obtaining a bed topography of a subsurface region, the bed topography defined by a plurality of cells, each of the plurality of cells having an elevation associated with its cell center; code for representing the bed topography as a cell-centered piecewise constant representation based on the elevations associated with the plurality of cells; code for reconstructing the bed topography to produce a spatially continuous surface; code for calculating flux and gravitational force-related source terms based on the reconstructed bed topography; code for calculating fluxes between at least two of the cells, taking into account variations of the bed topography across a face between the at least two of the cells; and code for predicting at least one of fluid flow, deposition of sediments onto the bed, and erosion of sediments from the bed using the fluxes and gravitational force-related source terms.
[0017] The fluxes may be calculated to at least a first order of accuracy. Code for reconstructing the bed topography may include code for defining triangles by pairs of two consecutive cell vertices and an effective cell center. Code may be provided for reconstructing a fluid surface elevation above the bed topography, and calculating flux and gravitational force-related source terms based on the reconstructed bed topography and the reconstructed fluid surface elevation. Code may be provided for managing production of hydrocarbon resources based on the prediction of the fluid flow. Code may be provided for outputting the predicted fluid flow, the deposition of sediments, or the erosion of sediments. Code may be provided for: inputting the predicted fluid flow, deposition and/or erosion into a geologic model of the subsurface region; predicting characteristics of the subsurface region using the geologic model; and outputting the predicted characteristics of the subsurface region. [0018] In another aspect, a method of extracting hydrocarbons from a subsurface region is provided. According to the method, a bed topography of the subsurface region is obtained. The bed topography is defined by a plurality of cells, each of the plurality of cells having an elevation associated with its cell center. The bed topography is represented as a cell-centered piecewise constant representation based on the plurality of elevations. The bed topography is reconstructed to produce a spatially continuous surface. Flux and gravitational force-related source terms are calculated based on the reconstructed bed topography. Fluxes between at least two of the cells are calculated taking into account variations of the bed topography across a face between the at least two of the cells. At least one of fluid flow, deposition of sediments onto the bed, and erosion of sediments from the bed are predicted using the fluxes and gravitational force-related source terms. The presence of hydrocarbons in the subsurface region is predicted based at least in part on the predicted fluid flow, deposition of sediments, or erosion of sediments. Hydrocarbons are extracted from the subsurface region.
BRIEF DESCRIPTION OF THE DRAWINGS
[0019] Advantages will be better understood by referring to the following detailed description and the attached drawings, in which:
Fig. 1 is a diagram of a bed topography, a fluid surface elevation and an unstructured grid;
Fig. 2 is a diagram of reconstructed cells in a bed topography; Fig. 3 is a diagram of reconstructed cells in a bed topography and a corresponding fluid surface elevation;
Fig. 4 is a diagram that is useful in explaining calculation of flux between a left cell and a right cell;
Fig. 5 is a process flow diagram showing a method according to aspects disclosed herein; Fig. 6 is a process flow diagram showing a method according to aspects disclosed herein;
Fig. 7 is a process flow diagram showing a method according to aspects disclosed herein;
Fig. 8 is a simplified block diagram of a computer environment; and
Fig. 9 is a block diagram showing a tangible, machine-readable medium that stores code to perform methods according to aspects disclosed herein.
DETAILED DESCRIPTION
[0020] Some portions of the detailed description which follows are presented in terms of procedures, steps, logic blocks, processing and other symbolic representations of operations on data bits within a memory in a computing system or a computing device. These descriptions and representations are the means used by those skilled in the data processing arts to most effectively convey the substance of their work to others skilled in the art. In this detailed description, a procedure, step, logic block, process, or the like, is conceived to be a self-consistent sequence of steps or instructions leading to a desired result. The steps are those requiring physical manipulations of physical quantities. Usually, although not necessarily, these quantities take the form of electrical, magnetic, or optical signals capable of being stored, transferred, combined, compared, and otherwise manipulated. It has proven convenient at times, principally for reasons of common usage, to refer to these signals as bits, values, elements, symbols, characters, terms, numbers, or the like. [0021] Unless specifically stated otherwise as apparent from the following discussions, terms such as "obtaining", "defining", "representing", "reconstructing", "calculating", "producing", "taking into account", "predicting", "inputting", "using", "modeling", "outputting", "displaying", "conserving", "performing", "updating", "repeating", "extracting", or the like, may refer to the action and processes of a computer system, or other electronic device, that transforms data represented as physical (electronic, magnetic, or optical) quantities within some electrical device's storage into other data similarly represented as physical quantities within the storage, or in transmission or display devices. These and similar terms are to be associated with the appropriate physical quantities and are merely convenient labels applied to these quantities.
[0022] Embodiments disclosed herein also relate to an apparatus for performing the operations herein. This apparatus may be specially constructed for the required purposes, or it may comprise a general-purpose computer selectively activated or reconfigured by a computer program or code stored in the computer. Such a computer program or code may be stored or encoded in a computer readable medium or implemented over some type of transmission medium. A computer-readable medium includes any medium or mechanism for storing or transmitting information in a form readable by a machine, such as a computer ('machine' and 'computer' are used synonymously herein). As a non-limiting example, a computer-readable medium may include a computer-readable storage medium (e.g., read only memory ("ROM"), random access memory ("RAM"), magnetic disk storage media, optical storage media, flash memory devices, etc.). A transmission medium may be twisted wire pairs, coaxial cable, optical fiber, or some other suitable transmission medium, for transmitting signals such as electrical, optical, acoustical or other form of propagated signals (e.g., carrier waves, infrared signals, digital signals, etc.)).
[0023] Furthermore, modules, features, attributes, methodologies, and other aspects can be implemented as software, hardware, firmware or any combination thereof. A component implemented as software can be implemented as a standalone program, as part of a larger program, as a plurality of separate programs, as a statically or dynamically linked library, as a kernel loadable module, as a device driver, and/or in every and any other way known now or in the future to those of skill in the art of computer programming. Additionally, the invention is not limited to implementation in any specific operating system or environment. [0024] Various terms as used herein are defined below. To the extent a term used in a claim is not defined below, it should be given the broadest possible definition persons in the pertinent art have given that term as reflected in at least one printed publication or issued patent.
[0025] As used herein, "and/or" placed between a first entity and a second entity means one of (1) the first entity, (2) the second entity, and (3) the first entity and the second entity. Multiple elements listed with "and/or" should be construed in the same fashion, i.e., "one or more" of the elements so conjoined.
[0026] As used herein, "celerity" refers to the velocity of propagation of a wave through a fluid or liquid, relative to the rate of movement of the fluid or liquid through which the wave is propagated.
[0027] As used herein, "CFL condition" refers to the Courant-Friedrichs-Lewy condition, which is a condition for convergence while solving certain partial differential equations (usually hyperbolic partial differential equations) numerically. It arises when explicit time- marching schemes are used for the numerical solution. As a consequence, the timestep must be less than a certain time in many explicit time-marching computer simulations, otherwise the simulation will produce wildly incorrect results.
[0028] As used herein, "displaying" includes a direct act that causes displaying, as well as any indirect act that facilitates displaying. Indirect acts include providing software to an end user, maintaining a website through which a user is enabled to affect a display, hyperlinking to such a website, or cooperating or partnering with an entity who performs such direct or indirect acts. Thus, a first party may operate alone or in cooperation with a third party vendor to enable the reference signal to be generated on a display device. The display device may include any device suitable for displaying the reference image, such as without limitation a cathode ray tube (CRT) monitor, a liquid crystal display (LCD) monitor, a plasma device, a flat panel device, an organic light-emitting diode (OLED) device or printer. The display device may include a device which has been calibrated through the use of any conventional software intended to be used in evaluating, correcting, and/or improving display results (e.g., a color monitor that has been adjusted using monitor calibration software). Rather than (or in addition to) displaying the reference image on a display device, a method, consistent with the invention, may include providing a reference image to a subject. "Providing a reference image" may include creating or distributing the reference image to the subject by physical, telephonic, or electronic delivery, providing access over a network to the reference, or creating or distributing software to the subject configured to run on the subject's workstation or computer including the reference image. In one example, the providing of the reference image could involve enabling the subject to obtain the reference image in hard copy form via a printer. For example, information, software, and/or instructions could be transmitted (e.g., electronically or physically via a data storage device or hard copy) and/or otherwise made available (e.g., via a network) in order to facilitate the subject using a printer to print a hard copy form of reference image. In such an example, the printer may be a printer which has been calibrated through the use of any conventional software intended to be used in evaluating, correcting, and/or improving printing results (e.g., a color printer that has been adjusted using color correction software).
[0029] As used herein, the "Exner equation" is a statement of conservation of mass that applies to sediment in a fluvial system such as a river or subsurface hydrocarbon flow. Specifically, it states that bed elevation increases in proportion to the amount of sediment that drops out of transport, and decreases in proportion to the amount of sediment that becomes entrained by the flow.
[0030] As used herein, "extracting hydrocarbons" refers to activities such as determining the general geologic structure of a subsurface region, locating potential hydrocarbon reservoirs, guiding the production of a previously discovered hydrocarbon reservoir, planning the location and timing of new wells, managing production from existing wells, predicting production lifetimes of wells or hydrocarbon reservoirs at various extraction rates, and/or other activities central or peripheral to removing hydrocarbons from a hydrocarbon reservoir.
[0031] As used herein, "hydrocarbon" includes oil (often referred to as petroleum), natural gas, gas condensate, tar, and bitumen.
[0032] As used herein, "hydrocarbon reservoirs" include reservoirs containing any hydrocarbon.
[0033] As used herein, "machine -readable medium" refers to a medium that participates in directly or indirectly providing signals, instructions and/or data. A machine-readable medium may take forms, including, but not limited to, non-volatile media (e.g. ROM, disk) and volatile media (RAM). Common forms of a machine-readable medium include, but are not limited to, a floppy disk, a flexible disk, a hard disk, a magnetic tape, other magnetic media a CD-ROM, other optical media, punch cards, paper tape, other physical media with patterns of holes, a RAM, a ROM, an EPROM, a FLASH-EPROM, or other types of memory chips or cards, a memory stick, and other media from which a computer, a processor or other electronic device can read.
[0034] As used herein, "MUSCL" refers to Monotone Upstream-centered Schemes for Conservation Laws, which are finite volume methods s that can provide highly accurate numerical solutions for a given system, even in cases where the solutions exhibit shocks, discontinuities, or large gradients. [0035] In the oil and gas industry, solving water flow and sediment transport equations is useful in constructing physics process-based models for simulations of formation and evolutions of sedimentary basins and oil and gas reservoirs, and the subsequent building of the geologic models. Such models may be useful in predicting fluid flow parameters such as erosion or deposition, and in other activities related to hydrocarbon extraction. In geologic modeling, a digital representation of the detailed internal geometry and rock properties of a subsurface earth volume, such as a petroleum reservoir or a sediment- filled basin is built. In the oil and gas industry, geologic models provide geologic input to reservoir performance simulations which are used to select locations for new wells, estimate hydrocarbon reserves, plan reservoir-development strategies, and/or perform other hydrocarbon extraction activities. The spatial distribution of permeability may assist in characterizing reservoir performance, and, together with other rock and fluid properties, may determines the producibility of the reservoir. For sandstone reservoirs, the spatial distribution of permeability is a function of the grain-size distribution of sands which compose the reservoir, the compartmentalization of those sands by barriers of finer grained material, and the mineralogy and burial history of the reservoir. [0036] Most geologic models built for petroleum applications are in the form of a three- dimensional array of model blocks (cells), to which geologic and/or geophysical properties such as lithology, porosity, acoustic impedance, permeability, and water saturation are assigned (such properties are referred to collectively herein as "rock properties"). The entire set of model blocks represents the subsurface earth volume of interest. The goal of the geologic-modeling process is to assign rock properties to each model block in the geologic model.
[0037] In one aspect, a bed topography reconstruction scheme and a flux integration scheme balances flux gradients and corresponding bed slope source terms to second orders of accuracy over arbitrary bed topographies. The combination of the bed topography reconstruction scheme and the flux integration scheme leads to more accurate results when compared to known methods, with only a minor increase in computational effort. The method may be used with cell-centered discretization schemes where both flow variables as well as bed topographic information are represented in the center of cells.
[0038] Relative to most of the known discretization schemes in which the bed topography is represented in cell vertices, a cell-centered discretization scheme in one aspect may be the simplest one that attempts to ensure the conservation of mass for both solids below the top bed surface and the liquid above. Such a constraint may provide improved results when the flow and transport equations are coupled with sediment erosion, deposition and the sediment mass conservation equations on the bed, such as the Exner equation, to solve bed evolutions in both shallow and deep water environments. In a cell-centered discretization scheme, the amount of erosion, deposition and cell elevation change are all calculated using the flow and sediment information associated with the center of the cell, without any need of extrapolation among neighboring cells.
[0039] For known discretization schemes in which bed topography is represented in cell vertices, some extrapolation and averaging of either flow variables, or sediment erosion or deposition rate are typically useful in the calculation of elevation changes on cell vertices, which could cause numerical diffusion for the bed topography. Therefore, a cell-centered discretization scheme in accordance with the present techniques provides an advantage over known schemes that employ data along cell vertices, in that the numerical diffusion of cell elevations due to the averaging and extrapolation among neighboring cells is reduced or eliminated when the equations related to sediment transport, erosion and deposition processes are added to flow equations. [0040] Fig. 1 is a diagram of a bed topography, a fluid surface elevation and an unstructured grid that is useful in explaining the operation of an embodiment. The diagram, which is generally referred to by reference number 100, includes a bed topography 102, a fluid surface elevation 104 and an unstructured grid 106. The unstructured grid 106 includes a plurality of two-dimensional cells. A first cell 108 is a polygon that is bounded by line segments ABCDE. A second cell 110 is a polygon that is bounded by line segments AGHB. A third cell 112 is a polygon that is bounded by line segments BHIJC. A fourth cell 114 comprises a polygon that is bounded by line segments CKLD. A fifth cell 116 is a polygon that is bounded by line segments DMNOE. A sixth cell 118 is a polygon that is bounded by line segments AEF. [0041] An embodiment relates to a cell-based discretization scheme in which values of variables are associated with cell centers rather than at their vertices. Spatial variability of each variable within each cell is not stored and may only be reconstructed using different reconstruction schemes. The simplest of such schemes is the piecewise constant reconstruction scheme. In this scheme, the value for each variable remains constant within each cell and equals the value that is stored in the cell. In Fig. 1, the results of the piecewise constant reconstruction of the bed topography 102 and the fluid surface elevation 104 are shown together with the unstructured grid 106. One prominent feature to note is the discontinuities of the reconstructed values across cell edges. For example, the elevations across the cell edge BC on the underlying grid 106, which correspond to the edges marked BlCl and B3C3 in the bed topography 102, for the first cell 108 and the third cell 112 respectively, are discontinuous. Moreover, the edges BlCl and B3C3 are located at different positions in the z-direction relative to the underlying grid 106. Similarly, the fluid surface elevation 104 shows that the corresponding areas labeled as lines B1*C1* and B3*C3* are also discontinuous in the z-direction.
[0042] An embodiment produces continuous bed surfaces, eliminates the discontinuities as described above, and in the process, conserves the mass in volumes bounded by corresponding areas of the bed topography 102 and the fluid surface elevation 104, as well as volumes bounded by corresponding areas of the bed topography 102 and the unstructured grid 106. In other words, for each cell, the amount of mass that is enclosed between any arbitrary surface below or above the bed topography 102 remains the same before and after the reconstruction of the bed surface in that cell.
[0043] Fig. 2 is a diagram of reconstructed cells in a bed topography. The diagram, which is generally referred to by reference number 200, includes a bed topography 202 and an unstructured grid 206. The unstructured grid 206 is a plurality of cells. A first cell 208 is a polygon that is bounded by line segments ABCDE. A second cell 210 is a polygon that is bounded by line segments AGHB. A third cell 212 is a polygon that is bounded by line segments BHIJC. A fourth cell 214 is a polygon that is bounded by line segments CKLD. A fifth cell 216 is a polygon that is bounded by line segments DMNOE. A sixth cell 218 is a polygon that is bounded by line segments AEF.
[0044] The bed topography 202 includes two cells that have been reconstructed. In particular, the bed topography 202 shows a reconstructed first cell 208', which corresponds to the first cell 208 of the unstructured grid 206, and a reconstructed third cell 212', which corresponds to the third cell 212 of the unstructured grid 206. [0045] The surfaces defined by triangles χieAmBm, χle BmCm, χieCmDm, χieDmEm, and χieEmAm are the reconstructed surfaces for the first reconstructed cell 208'. The surfaces defined by triangles χ3eCmBm, χ3eBmHm, χ3eHmlm, χ3eImJm and χ3eJmCm are the reconstructed surfaces for the third reconstructed cell 212'. In Fig. 2, the points Am, Bm, Cm, Dm, Em, Hm, Im, and Jm represent the effective elevations at the vertices A, B, C, D, E, H, I, and J respectively. The points χ1e and χ3e are the effective cell center elevations for the first reconstructed cell 208' and the third reconstructed cell 212' respectively. [0046] The points χ1b and χi represent the projections of the point χle on the original piecewise constant cell bed surface AIBICIDIEI and the gridding surface ABCDEF. The points χ3b and χ3 are the projections of the point χ3e on the original piecewise constant cell bed surface C3B3H3I3 J3 and the gridding surface CBHIJ.
[0047] As set forth above the volume of regions between the bed topography 202 and the unstructured grid 206 is conserved. For example, as shown in Fig. 2, the volume enclosed by the surface ABCDE and piecewise constant bed surface AIBICIDIEI are the same as the volume enclosed by the surface ABCDE and the reconstructed bed surface, which includes five triangles χieAmBm, χle BmCm, χieCmDm, χieDmEm, and χieEmAm. Similarly, the volume of the fluid above the bed surface in the cell is also conserved before and after the reconstruction of the bed. [0048] Reconstruction of a bed topography includes three steps: calculating the cell center, calculating the effective elevation at each cell vertex and calculating the effective elevation for the cell center. Each of these steps is described in detail below. [0049] The first step of reconstructing a bed topography is to calculate the cell center. For any cell, if there are n vertices with xy-coordinates X1 and yt for i = 1,2,3,.../? , the xy- coordinate of the cell center xc and ycmay be given by equations (1) and (2):
Figure imgf000018_0001
[0050] The second step of reconstructing a bed topography is to calculate the effective elevation for the cell center. Each of the vertices of a given cell is shared among a number of cells. If a vertex is shared by m cells, and each cell j , where j = 1,2,3,... m , has an averaged elevation of z} , the effective elevation at each of the cell vertices may be calculated using the following equation (3):
Figure imgf000019_0001
where
dj =
Figure imgf000019_0002
the distance from a vertex to the center of the j th cell that shares the vertex.
[0051] The third step of reconstructing a bed topography is to calculate the effective elevation for the cell center. As is shown in Appendix A hereto, the effective cell center elevation may be given by equation (4):
Figure imgf000019_0003
[0052] In equation (4), A(l) is the area projected to the xy plane by the /th triangle Ω; in the cell defined by any of the two consecutive vertices i , i + l (or vertex 1 if i = n ), and the cell center. An example is triangle AmBmχie. Its projected area is the area of the triangle ABχi. In the same equation, XJ( } and 7c (ϊ) are the x and y coordinates of the center of that triangle, respectively, and the values of a['} , a^ , b['} , b^ , cw , d['} , d2 (l) may be given by equation (A6) and equations (A8-A13) in Appendix A.
[0053] Once zc is found, the elevation of any point in a cell with coordinates (x, y) on the reconstructed bed surface may be given by equation (5):
Figure imgf000019_0004
with(x, j) ε θ, . In above equation, a(l) , b(l) , c(l) , and d(l) are given by equations (A4-A7), respectively, in Appendix A.
[0054] The reconstructed bed surface elevation z can be obtained in another way. For
each triangle Ω; , its surface gradient may be given by equations (6)
Figure imgf000019_0005
and (7):
Figure imgf000020_0002
[0055] Therefore, z = zc + s£{x - xc) + S ∞(y - yc) (8) It can be shown that equations (5) and (8) are equivalent.
[0056] Fig. 3 is a diagram of reconstructed cells in a bed topography and a corresponding fluid surface elevation. The diagram, which is referred to generally by reference number 300, includes a bed topography 302 and a fluid surface elevation 304. The bed topography 302 comprises the reconstructed cells described above with reference to Fig. 2. [0057] In the diagram 300, the surfaces A1*B1*C1*D1*E1*, A2*G2*H2*B2*, B3*H3*I3*J3*C3*, D4*C4*K4*L4*, 05 *E5*D5 *M5*N5*, and F6*A6*E6* of the fluid surface elevation 304 are the piecewise constant representation of a fluid surface. The surface Ae*Be*Ce*De*Ee* is the piecewise linear representation of the fluid surface. The fluid surface may be represented by a number of different schemes. The two simplest schemes are the piecewise constant scheme and the piecewise linear scheme.
[0058] A piecewise constant scheme may assume that the fluid surface elevation ξ{xj) \& constant everywhere in a cell. Such a piecewise linear scheme may take many different forms. For example, one form is set forth in the equations (9), (10), (11), and (12):
Figure imgf000020_0001
for any values of S^ and S^ . Accordingly, mass conservation is strictly preserved in this scheme. [0059] Another aspect is that calculations of the inter-cell fluxes correspond to the reconstruction scheme described above. The general form of the governing equations for both shallow and deep water turbidity current can be written as equation (13):
Figure imgf000021_0002
where U is the vector of conservative variables, F and G are the vectors that are related to the conservative form of the fluxes in x and y directions respectively, S is the vector of the source terms related to the gravitational forces, and Sf is the vector of the source terms originated from other than gravitational forces. Only the first three terms may need to be calculated using inventive methods disclosed herein. The calculation for the last term may use existing methods and can be readily determined.
[0060] The specific form of U , F , G and S may vary from different formulations for shallow and deep water flows. One embodiment may, however, be applied with respect to all of the forms.
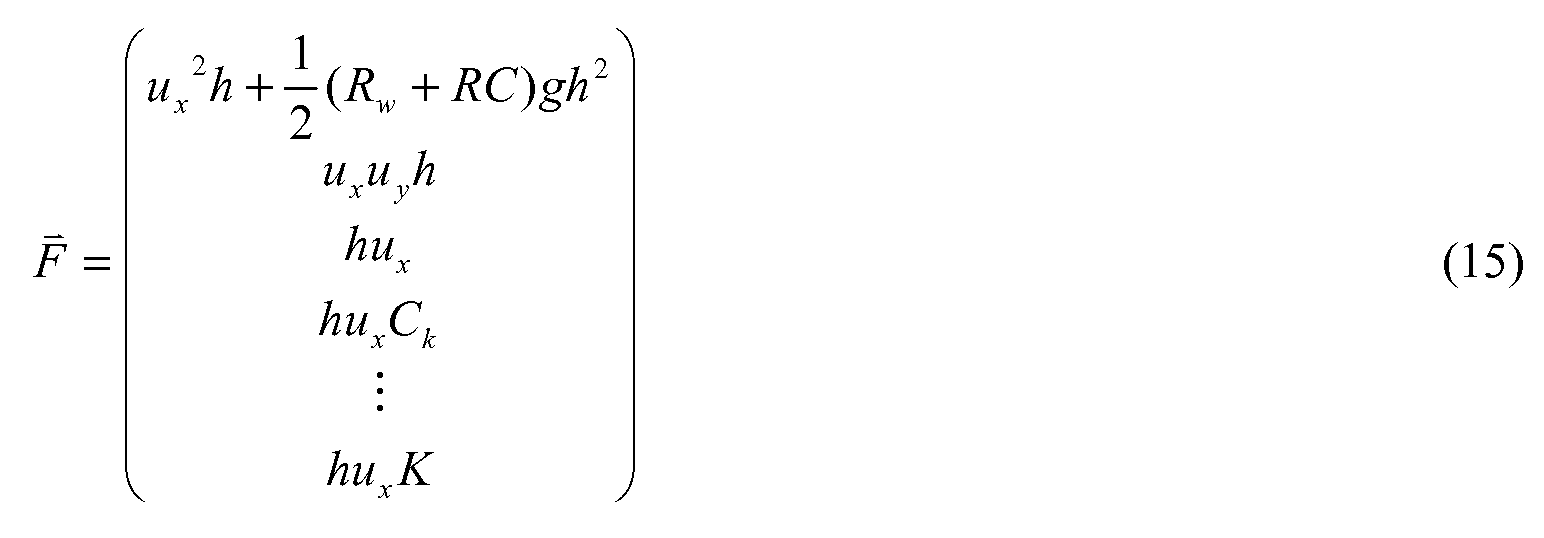
[0061] Apart from the source term Sf , the general form for the governing equations for both shallow water flows and the turbidity currents in deep water environment can be written in a unified fashion as shown below in equations (14) (15), (16) and (17), where
Figure imgf000021_0001
Figure imgf000021_0003
Figure imgf000022_0001
and
Figure imgf000022_0002
[0062] In the above equations, Ux and u are the x - and y - components of the depth averaged flow velocity respectively, h is the depth of the turbid flow, z is the bottom elevation, Ck is the volumetric concentration of the sediments in the k th grain size bin and equation (18)
Figure imgf000022_0003
represents the total sediment concentration. In equations (15) and (16), g represents the gravitational constant, andi? is the submerged specific weight for the sediments. i? may be represented by
Figure imgf000022_0005
In equation (19), ps and pw are the sediment and water density respectively. In equations (14)-(16), K is the turbulent kinetic energy . The definition of Rw in equations (15) and (16) may be given by
Figure imgf000022_0004
where pa is the density of the ambient fluid. In a deep water environment, the ambient fluid is the same as the flowing fluid, therefore Rw can be represented by
Figure imgf000023_0001
On the other hand, in a shallow water environment, the ambient fluid is air, which has a density much smaller than the water density, where pa « pw . Therefore Rw can be represented by
Figure imgf000023_0002
for the shallow water environment.
[0063] Without the loss of generality, the flow properties Ux , u , Ck , for k = 1,2,.../? , and K are all treated as piecewise constant in the cell in the descriptions of the method given below. However, the method described below can be easily applied without treating the flow properties Ux, uy , Ck , for k = \,2,...n , and K as piecewise constant in the cell. In those situations, any well-known extrapolation schemes for ux, u , Ck , for k = 1,2,.../? , and K can be used with the disclosed aspects. [0064] In one aspect, fluxes may be calculated across cell faces. An example of a cell face is the surface BmCmCe*Be* shown in Fig. 3. The calculation of flux across a cell face is described in detail below with reference to Fig. 4.
[0065] Fig. 4 is a diagram that is useful in explaining calculation of flux between a left cell and a right cell. The diagram is referred to generally by reference number 400. The diagram 400 comprises bed topography 402 and a fluid surface elevation 404. The bed topography 402 represents a subset of the bed topography 302 shown in Fig. 3. In particular, the representation of the bed topography 402 corresponds to the reconstructed cells of the bed topography 302. The fluid surface elevation 404 represents a subset of the fluid surface elevation 304 shown in Fig. 3. Without losing generality, a first cell 406 of the fluid surface elevation is denoted as a left cell. A second cell 408 of the fluid surface elevation 404 is denoted as a right side cell. Calculating the fluxes of fluid flowing between the left cell and the right cell is described in detail below.
[0066] The reconstructed bed surfaces of the topography bed 402, which may be obtained using a reconstruction scheme disclosed herein, are continuous across the cell faces. The fluid surfaces of the fluid surface elevation 404 are, however, often discontinuous, as shown in Fig. 4. Therefore the water depths at the cell face in two cells are often different from each other. Also, the degree of the discontinuities may be different at the different locations on the cell face. The expression hL = hL(l) may be used to denote the water depth at the cell face in the left cell, and at the location / distance away from the center line 410 of cell face as shown in Fig. 4. Similarly, hR = hR(l) denotes the corresponding water depth in the right cell. It can be shown that hL(l) = hf + AL (23)
Figure imgf000024_0001
(24)
Figure imgf000024_0002
where
Figure imgf000024_0006
Figure imgf000024_0003
Figure imgf000024_0004
Figure imgf000024_0007
[0067] In the above equations, I0 is the half cell edge length for cell /or / + 1 ,
Figure imgf000024_0008
is the dimensionless distance from the cell face middle line,
Figure imgf000024_0005
is the dimensionless maximum fluid depth change in the left cell at the cell face, and
Figure imgf000024_0009
1R ) is the dimensionless maximum fluid depth change in the right cell at the cell face. [0068] The fluxes across the cell face can be evaluated using many different solvers. Here a solver known an HLL solver ('HLL' being an acronym for Harten, Lax, and van Leer) is used as an example. The HLL solver obtains an approximate solution for the inter-cell numerical flux directly by assuming a particular wave configuration for the solution and calculating the wave speed (Harten, A., Lax, P., and van Leer, A., "On upstream differencing and Godunov-type scheme for hyperbolic conservation laws", Soc. Indus. Appl. Math. Rev., 25(1), 35-61, 1987.). The HLL solver has proven stable even when running long enough to generate highly complicated stratigraphy. [0069] Assuming
Figure imgf000025_0001
the flux across the cell face may be given by equation
Figure imgf000025_0002
R L where the celerities of the waves at the cell face aresz andsR , F* (I) represents the flux per unit width between two cells at the location that is a distance / from a cell face middle line between the at least two of the cells, and ή represents the unit vector that is perpendicular to a boundary between the at least two of the cells on an unstructured grid. F* (J) is the same as
F* with its variable / shown. [0070] Other variables helpful in understanding disclosed aspects include the following: I0 , representing half of the length of the boundary between the at least two of the cells; /*(0) , representing a first expansion coefficient corresponding to a zeroth order flux per unit width at the center of the edge between the at least two of the cells, the first expansion coefficient being computed according to equation (B48) in Appendix B; f* , representing a second expansion coefficient that is computed according to equation B51 in Appendix B; AL 2 , representing the square of a dimensionless maximum fluid depth change in a first of the at least two of the cells; Jl , representing a third expansion coefficient that is computed according to equation (B52) in Appendix B; AR 2 , representing the square of a dimensionless maximum fluid depth change in a second of the at least two of the cells; J^ , representing a fourth expansion coefficient that is computed according to equation (B53) in Appendix B;
AL , representing a dimensionless maximum fluid depth change in the first of the at least two of the cells; and AR , representing a dimensionless maximum fluid depth change in the second of the at least two of the cells.
[0071] Separating constant states in the solution of the local Riemann problem can be calculated using Toro's two expansion approach as set forth in E. F. Toro, "Riemann Problems and the WAF Method for Solving Two-Dimensional Shallow Water Equations", Phil. Trans. Roy. Soc. London, A338: 43-68, (1992), and E. F. Toro, "The Weighted Average Flux Method Applied to the Time-Dependent Euler Equations", Phil. Trans. Roy. Soc. London, A341 : 499-530 (1992). Toro's two expansion approach states that for wet cells,
Figure imgf000026_0003
where )
Figure imgf000026_0004
and
Figure imgf000026_0001
[0072] In the above equations, uxL and uyL are the x and y components of the flow velocity in the left cell, respectively. Similarly, uxR and uyR are respectively the x and y components of the flow velocity in the right cell. [0073] In equations (34) and (35), 8)
Figure imgf000026_0005
and ^ )
Figure imgf000026_0006
[0074] Because the fluid depths in both left and right cells vary with the distance / from the center of the cell face, and the differences of the fluid depths across the cell face also varies with / , the value of flux F* ■ ή in equation (33) varies with / . The calculation of the total flux across the cell face requires the evaluation the integral F {I) - ndl . To avoid
computing the integral numerically, which may add significant amount of computational overhead to the scheme, equation (33) is first Taylor expanded to the order of o(Δ^) , o(Δ^) or o(ALAR) and then the result is integrated over / analytically. Detailed derivation is given in Appendix B. The final result is
Figure imgf000026_0002
where the expressions for evaluating / (0) , Jl , jA and // are given in equations (B48) to
(B53) in Appendix B.
[0075] The current reconstruction scheme subdivides a cell into a number of triangles. Therefore the integration of the source term in equation (13) is also subdivided into the corresponding number of parts before each parts are summed together to yield the final results. The detailed steps of the calculation are shown in Appendix C. The result is
Figure imgf000027_0001
(41) [0076] Fig. 5 is a process flow diagram showing a method 500 according to disclosed techniques and methodologies. At block 502 an initial bed topography of a subsurface region is obtained. The bed topography is defined by a plurality of cells. Each of the plurality of cells has an elevation associated with its cell center. This elevation may be a fluid height elevation, bed elevation, or both. Other conservative variables, such as sediment volumes, may be stored in the center of one or more cells. The values may be stored in a memory (as discussed further herein) associated with each cell center. As shown in the figures, a two- dimensional unstructured grid of cells, with elevations associated with the cell centers, may form and be represented as a piecewise constant bed topography (and/or a piecewise constant fluid surface topography) that may be expressed or displayed as a three-dimensional model of cells showing bed and/or fluid elevations. [0077] Using the elevations stored at block 502, at block 504 the piecewise constant bed topography is reconstructed to produce a spatially continuous surface for flux and source term calculations. At block 506, a piecewise constant fluid topography may be reconstructed based on the spatially continuous surface. At block 508 flux between cells is calculated using the reconstructed bed topography. As an example, the flux calculation may be performed as described above with reference to Fig. 4 and may include calculating flux terms based on the reconstructed bed topography. For example, the flux calculation may take into account variations of the bed topography across a face between the cells. At block 510, gravitational force-related source constants may be calculated based on the reconstructed bed topography. The reconstructed fluid topography may additionally be used in calculating the gravitational force-related source constants. At block 512, other source terms for the cells may be calculated, if needed. [0078] The conservative variables stored at block 502 may be updated and primary variables computed, as shown at block 514. Based on the updated variables, fluid flow parameters such as erosion and deposition may be predicted, as shown at block 516. The piecewise constant cell elevations may additionally be updated. As shown in Fig. 5, the method may return repeatedly to block 502 to improve accuracy of fluid flow predictions. [0079] Figure 6 shows a method 600 that uses predictions of fluid flow, erosion and/or deposition as an input to a geologic model. At block 602 the method receives such predictions as are made at block 516 of Figure 5. At block 604 the predictions are input into a geologic model. The geologic model may be one as is described previously herein. At block 606 the geologic model is used to predict geologic characteristics (such as sediment grain size distribution, porosity, permeability, connectivity, and the like) of a subsurface region. At block 608 values for the predicted characteristics are outputted.
[0080] Figure 7 shows a method 700 that uses predictions of fluid flow, erosion and/or deposition, and/or geologic characteristics to extract hydrocarbons from a subsurface region, which may include a hydrocarbon reservoir or field. At block 702 the method receives the predictions made at block 516 and/or block 608. At block 704 the presence of hydrocarbons in a subsurface region is predicted based at least in part on the predictions made at block 516. At block 706 hydrocarbons are extracted from the subsurface region. The activities defined by the term "extracting hydrocarbons" may be broadly interpreted as set forth herein. [0081] Figure 8 depicts a block diagram of a computing environment 800 that may implement one or more of the disclosed methods. Computing environment 800 includes a system computer 802, which may be implemented as any conventional personal computer or workstation, such as a UNIX-based workstation or any other computing clusters or supercomputers. The system computer 802 is in communication with disk storage devices 804, 806, and 808, each of which may be any known type of computer-readable storage media such as external hard disk storage devices that are either directly connected to the system computer or accessed using a local area network or by remote access. Although disk storage devices 804, 806, and 808 are illustrated as separate devices, a single disk storage device may be used to store any and all of the program instructions, measurement data, and results as desired. [0082] In one aspect, the input data are stored in disk storage device 806. The system computer 802 may retrieve the appropriate data from the disk storage device 806 to perform program instructions corresponding to the methods described herein. The program instructions may be written in a computer programming language, such as C++, C#, Java and the like. The program instructions may be stored in a computer-readable memory, such as program disk storage device 808. System computer 802 presents output primarily onto a text/graphics display 810, or alternatively to a printer 812. The system computer 802 may store the predictions or other results of the methods described herein on disk storage 804, for later use and further analysis. A keyboard 814 and a pointing device (e.g., a mouse, trackball, or the like) 816 may be provided with the system computer 802 to enable interactive operation. The system computer 802 may be located at a data center remote from the reservoir. Additionally, while the description above is in the context of computer-executable instructions that may run on one or more computers, those skilled in the art will recognize that the subject matter as claimed also can be implemented in combination with other program modules and/or as a combination of hardware and software.
[0083] Fig. 9 is a block diagram showing a tangible, machine-readable medium that stores code adapted to perform method disclosed herein. The tangible, machine-readable medium is generally referred to by the reference number 900. The tangible, machine- readable medium 900 may comprise one or more hard disk drives, a DVD, a CD or the like, and may correspond to disk storage device 806 in Figure 8. The tangible, machine-readable medium 900 stores computer-readable code 902 for obtaining a bed topography of a subsurface region, where the bed topography is defined by a plurality of cells. Each of the plurality of cells has an elevation associated with its cell center, and the bed topography and elevations may be stored in a memory location in disk storage devices 804, 806, and/or 808. Code 904 represents the bed topography as a cell-centered piecewise constant representation based on the cell center elevations. Code 906 reconstructs the bed topology as a spatially continuous surface. Code 908 calculates flux and gravitational force-related source terms based on the reconstructed bed topography. The tangible, machine -readable medium 900 also stores code 910, which calculates fluxes between at least two of the cells taking into account variations of the bed topography across a face between the at least two of the cells. Code 912 predicts fluid flow, deposition of sediments onto the bed, and/or erosion of sediments from the bed using the fluxes and the gravitational force-related source terms. Furthermore, the tangible, machine-readable medium 900 may contain or store code relating to one or more of: inputting predictions into a geologic model of the subsurface region, using the geologic model to predict characteristics of the subsurface region, outputting the predicted characteristics of the subsurface region, predicting the presence of hydrocarbons in the subsurface region, extracting hydrocarbons from the subsurface region, and any other actions or steps disclosed herein.
[0084] The invention may have broad applications in the oil and gas industry, as well as many other areas such as environmental protection and management, flood and hurricane control, and flood and hurricane forecasting.
[0085] The disclosed embodiments and methodologies may be susceptible to various modifications and alternative forms and have been shown only by way of example. For example, the formulas and expressions disclosed herein, and the variables contained in those formulas and expressions, may be modified or expressed in alternative forms. The disclosed embodiments and methodologies are not intended to be limited to the particular embodiments disclosed herein, but include all alternatives, modifications, and equivalents falling within the spirit and scope of the appended claims.
APPENDIX A
[0086] Cell center effective elevation calculation.
[0087] Consider a cell with n vertices arranged counter clockwise from i = 1,2,3,... to n . Each vertex /has a coordinate of (X1 , yt) . The coordinate of the center of the cell (xc, yc) is then given by equation (1) and (2). The triangle defined by any two consecutive vertices / , / + 1 (or vertex 1 if / = n ), and the cell center is refered to as Ω; .
[0088] Denote the effective elevation of each vertex / as Z1 and of the cell center as zc .
Use z to denote the piecewise constant representation of the cell elevation. The problem is to find the value for zc , such that the cell averaged elevation over the surfaces defined by Ω; for
/ = 1,2,3,.../? equals z . In other words, solve zc so that )
Figure imgf000031_0002
' Ω, • where z = z(x, y) is the reconstructed cell elevation at location (x, y) . [0089] In triangle Ω; , z should satisfy the following equation
Figure imgf000031_0001
In equation (A2) and throughout Appendix A, we define / + 1 = 1 , if / = n . [0090] From above equation, it may be shown that
Figure imgf000031_0003
where
Figure imgf000031_0004
and ) )
Figure imgf000031_0005
Figure imgf000032_0001
[0091] Substitute equation (A3) for equation (Al), using the following properties where
Figure imgf000032_0002
and
Figure imgf000032_0003
the effective cell center elevation is given by
Figure imgf000032_0004
APPENDIX B
[0092] Calculation of HLL fluxes.
[0093] To enable an analytical integration of the equation (33) with regard to the variable
/ , the HLL flux function shown in the right side of equation (33) is first Taylor expanded to the second order of
Figure imgf000033_0001
o(A2 R) or o(ALAR) .
[0094] Substituting equations (23) and (24) into equations (14) to (17) and expanding the results to the second order, we obtain
Figure imgf000033_0003
where
Figure imgf000033_0002
Figure imgf000034_0001
Figure imgf000034_0002
Figure imgf000034_0003
Figure imgf000035_0001
Figure imgf000035_0002
Figure imgf000035_0003
Figure imgf000035_0004
[0095] Write sL and sR as
Figure imgf000035_0005
The expressions for the expansion coefficients in above equations are shown below. [0096] Substituting equations (23) and (24) in equations (38) and (39) results in
Figure imgf000036_0001
17)
Figure imgf000036_0002
(B18)
[0097] The next step is to use the results in the above equations and compare values of the following expressions
Figure imgf000036_0003
(B 19) and
Figure imgf000036_0004
(B20) at / = 0. If the value of the expression shown in equation (B 19) at / = 0 is less than the value of the expression shown in equation (B20) at / = 0 , then sL will be evaluated using that equation and the expansion coefficients for sL are
Figure imgf000036_0005
Figure imgf000037_0001
with
Figure imgf000037_0002
[0098] Otherwise
Figure imgf000037_0003
with
Figure imgf000037_0006
[0099] Similarly for 5Λ , the following expressions
Figure imgf000037_0004
and
Figure imgf000037_0005
(B34) are first evaluated. If the value of the expression shown in equation (B33) is less than the value of the expression shown in equation (B34), then sR will be evaluated using that equation and the expansion coefficients for sR are
Figure imgf000038_0001
[0100] Otherwise
Figure imgf000038_0003
with
Figure imgf000038_0002
[0101] Substituting equations (B1)-(B4) and equations (B15) and (B16) into equation (33), and retaining only terms of order o(l) , o(Δz) , o(AR) , o(A2 L) , o(A2 R) , o(ALAR) , we obtain
Figure imgf000039_0003
where the coefficients are given by following equations
Figure imgf000039_0001
[0102] In the above equations, the coefficients as0, asl, as2, as3, as4, as5 and the coefficients e0, eγ, e2, e3, e4, e5 are given by equations
Figure imgf000039_0002
Figure imgf000040_0001
Figure imgf000040_0002
where
Figure imgf000040_0003
APPENDIX C
[0103] Calculations of the source term related to the gravitational forces.
[0104] The integration of the first term in the right-hand side of equation (13) can be written as
Figure imgf000041_0002
Figure imgf000041_0001
where Vn is the fluid volume on top of the triangle Ω; . It can be calculated as
Figure imgf000042_0001
[0105] Substituting VΩ in equation (Cl) with equation (C2), the final results of the integration can be obtained.

Claims

ClaimsWhat is claimed is:
1. A method of enhancing a geologic model of a subsurface region, comprising:
5 (a) obtaining a bed topography of the subsurface region, the bed topography defined by a plurality of cells, each of the plurality of cells having an elevation associated with its cell center,
(b) representing the bed topography as a cell-centered piecewise constant representation based on the elevations associated with the plurality of cells;
10 (c) reconstructing the bed topography to produce a spatially continuous surface;
(c) calculating flux and gravitational force-related source terms based on the reconstructed bed topography;
(d) calculating fluxes between at least two of the cells, taking into account variations of the bed topography across a face between the at least two of the cells;
15 (e) predicting at least one of fluid flow, deposition of sediments onto the bed, and erosion of sediments from the bed using the fluxes and gravitational force-related source terms;
(f) inputting the predicted at least one of fluid flow, deposition and erosion into the geologic model of the subsurface region;
20 (g) using the geologic model to predict characteristics of the subsurface region; and
(h) outputting the predicted characteristics of the subsurface region.
2. The method recited in claim 1, wherein the fluxes are calculated to at least a first order of accuracy.
25
3. The method recited in claim 1, wherein reconstructing the bed topography comprises defining triangles by pairs of two consecutive cell vertices and an effective cell center.
4. The method recited in claim 1, further comprising: 30 reconstructing a fluid surface elevation; and calculating flux and gravitational force-related source terms based on the reconstructed bed topography and the reconstructed fluid surface elevation.
5. The method recited in claim 4, wherein the fluid surface elevation is reconstructed using a piecewise constant scheme.
6. The method recited in claim 4, wherein the fluid surface elevation is reconstructed using a piecewise linear scheme.
7. The method recited in claim 1, comprising extracting hydrocarbons based on the outputted predicted characteristics of the subsurface region.
8. The method recited in claim 1 , wherein outputting the predicted characteristics of the subsurface region comprises displaying the predicted characteristics.
9. The method recited in claim 1 , wherein reconstructing the bed topography conserves mass below and above the spatially continuous surface.
10. The method recited in claim 1 wherein calculating fluxes between at least two of the cells is performed according to the following equation:
Figure imgf000044_0001
wherein F* (/) represents a flux per unit width between two cells at the location that is a distance / from a cell face middle line between the at least two of the cells, ή represents a unit vector perpendicular to a boundary between the at least two of the cells on an unstructured grid, I0 represents half of the length of the boundary between the at least two of the cells, /*(0) represents a first expansion coefficient corresponding to a zeroth order flux per unit width at the center of the edge between the at least two of the cells, J^ represents a second expansion coefficient, AL 2 represents the square of a dimensionless maximum fluid depth change in a first of the at least two of the cells, /4 * represents a third expansion coefficient, AR 2 represents the square of a dimensionless maximum fluid depth change in a second of the at least two of the cells, J^ represents a fourth expansion coefficient, Δz represents a dimensionless maximum fluid depth change in the first of the at least two of the cells, and AR represents a dimensionless maximum fluid depth change in the second of the at least two of the cells.
11. The method recited in claim 1 , further comprising: updating piecewise constant cell elevations using the predicted one of fluid flow, deposition of sediments and erosion of sediments; and repeating steps (a) through (e) to improve accuracy of fluid flow predictions.
12. The method recited in claim 1, wherein the predicted characteristics of the subsurface region include at least one of sediment grain size distribution, porosity and permeability.
13. The method recited in claim 1 , wherein the plurality of elevations represent conservative variables, and further comprising updating the conservative variables based on the calculated source terms.
14. A computer program product having computer executable logic recorded on a tangible, machine-readable medium, the computer program product comprising: code for obtaining a bed topography of a subsurface region, the bed topography defined by a plurality of cells, each of the plurality of cells having an elevation associated with its cell center; code for representing the bed topography as a cell-centered piecewise constant representation based on the elevations associated with the plurality of cells; code for reconstructing the bed topography to produce a spatially continuous surface; code for calculating flux and gravitational force-related source terms based on the reconstructed bed topography; code for calculating fluxes between at least two of the cells, taking into account variations of the bed topography across a face between the at least two of the cells; and code for predicting at least one of fluid flow, deposition of sediments onto the bed, and erosion of sediments from the bed using the fluxes and gravitational force-related source terms.
15. The computer program product recited in claim 14, wherein the fluxes are calculated to at least a first order of accuracy.
16. The computer program product recited in claim 14, wherein the code for reconstructing the bed topography comprises code for defining triangles by pairs of two consecutive cell vertices and an effective cell center.
17. The computer program product recited in claim 14, further comprising: code for reconstructing a fluid surface elevation above the bed topography; and code for calculating flux and gravitational force-related source terms based on the reconstructed bed topography and the reconstructed fluid surface elevation.
18. The computer program product recited in claim 14, comprising code for managing production of hydrocarbon resources based on the prediction of the fluid flow.
19. The computer program product recited in claim 14, further comprising outputting the predicted fluid flow, the deposition of sediments, or the erosion of sediments.
20. The computer program product recited in claim 14, further comprising: code for inputting the predicted at least one of fluid flow, deposition and erosion into a geologic model of the subsurface region; code for predicting characteristics of the subsurface region using the geologic model; and code for outputting the predicted characteristics of the subsurface region.
21. A method of extracting hydrocarbons from a subsurface region, the method comprising: obtaining a bed topography of the subsurface region, the bed topography defined by a plurality of cells, each of the plurality of cells having an elevation associated with its cell center; representing the bed topography as a cell-centered piecewise constant representation based on the plurality of elevations to reconstructing the bed topography to produce a spatially continuous surface; calculating flux and gravitational force-related source terms based on the reconstructed bed topography; calculating fluxes between at least two of the cells taking into account variations of the bed topography across a face between the at least two of the cells; predicting at least one of fluid flow, deposition of sediments onto the bed, and erosion of sediments from the bed using the fluxes and gravitational force-related source terms; predicting hydrocarbon presence in the subsurface region based at least in part on the predicted fluid flow, deposition of sediments, or erosion of sediments; and extracting hydrocarbons from the subsurface region.
PCT/US2010/021641 2009-04-20 2010-01-21 Method for predicting fluid flow WO2010123596A1 (en)

Priority Applications (6)

Application Number Priority Date Filing Date Title
ES10767455T ES2792357T3 (en) 2009-04-20 2010-01-21 Procedure for predicting fluid flow
EP10767455.8A EP2422222B1 (en) 2009-04-20 2010-01-21 Method for predicting fluid flow
CA2754736A CA2754736C (en) 2009-04-20 2010-01-21 Method for predicting fluid flow
US13/201,395 US9128212B2 (en) 2009-04-20 2010-01-21 Method for predicting fluid flow
AU2010239716A AU2010239716B2 (en) 2009-04-20 2010-01-21 Method for predicting fluid flow
US14/692,474 US10162080B2 (en) 2009-04-20 2015-04-21 Method for predicting fluid flow

Applications Claiming Priority (2)

Application Number Priority Date Filing Date Title
US17089609P 2009-04-20 2009-04-20
US61/170,896 2009-04-20

Related Child Applications (2)

Application Number Title Priority Date Filing Date
US13/201,395 A-371-Of-International US9128212B2 (en) 2009-04-20 2010-01-21 Method for predicting fluid flow
US14/692,474 Continuation US10162080B2 (en) 2009-04-20 2015-04-21 Method for predicting fluid flow

Publications (1)

Publication Number Publication Date
WO2010123596A1 true WO2010123596A1 (en) 2010-10-28

Family

ID=43011397

Family Applications (1)

Application Number Title Priority Date Filing Date
PCT/US2010/021641 WO2010123596A1 (en) 2009-04-20 2010-01-21 Method for predicting fluid flow

Country Status (6)

Country Link
US (2) US9128212B2 (en)
EP (1) EP2422222B1 (en)
AU (1) AU2010239716B2 (en)
CA (1) CA2754736C (en)
ES (1) ES2792357T3 (en)
WO (1) WO2010123596A1 (en)

Cited By (1)

* Cited by examiner, † Cited by third party
Publication number Priority date Publication date Assignee Title
WO2013016041A3 (en) * 2011-07-28 2013-08-08 Saudi Arabian Oil Company Cluster 3d petrophysical uncertainty modeling

Families Citing this family (20)

* Cited by examiner, † Cited by third party
Publication number Priority date Publication date Assignee Title
FR2918776B1 (en) * 2007-07-09 2009-09-25 Total Sa METHOD, PROGRAM AND COMPUTER SYSTEM FOR SCALING HYDROCARBON RESERVOIR MODEL DATA.
FR2918777B1 (en) 2007-07-09 2009-09-25 Total Sa METHOD, PROGRAM, AND COMPUTER SYSTEM FOR THE CONSILIATION OF HYDROCARBON RESERVOIR MODEL DATA.
AU2009341850A1 (en) * 2009-03-13 2011-09-29 Exxonmobil Upstream Research Company Method for predicting fluid flow
ES2792357T3 (en) * 2009-04-20 2020-11-11 Exxonmobil Upstream Res Co Procedure for predicting fluid flow
EP2491516B1 (en) 2009-10-23 2018-09-12 Exxonmobil Upstream Research Company Method for optimization with gradient information
CA2803066A1 (en) 2010-07-29 2012-02-02 Exxonmobil Upstream Research Company Methods and systems for machine-learning based simulation of flow
WO2012015517A1 (en) 2010-07-29 2012-02-02 Exxonmobil Upstream Research Company Methods and systems for machine-learning based simulation of flow
WO2012071090A1 (en) 2010-11-23 2012-05-31 Exxonmobil Upstream Research Company Variable discretization method for flow simulation on complex geological models
US10133831B2 (en) 2012-05-14 2018-11-20 Landmark Graphics Corporation Method and system of predicting future hydrocarbon production
US20150331145A1 (en) * 2012-12-25 2015-11-19 Obschestvo S Ogranichennoy Otvetstvennostiu "Introvision Reserch And Development" Method for producing a three-dimensional characteristic model of a porous material sample for analysis of permeability characteristics
WO2014172787A1 (en) * 2013-04-24 2014-10-30 The University Of British Columbia A penalty method for pde-constrained optimization
US9267369B2 (en) * 2013-08-13 2016-02-23 Halliburton Energy Services, Inc. Modeling intersecting flow paths in a well system environment
US10221659B2 (en) * 2014-10-08 2019-03-05 Chevron U.S.A. Inc. Automated well placement for reservoir evaluation
FR3034529B1 (en) * 2015-04-03 2017-05-05 Ifp Energies Now METHOD FOR OPERATING HYDROCARBONS FROM A SEDIMENT BASIN USING A BASIN SIMULATION
US10287858B2 (en) 2015-10-20 2019-05-14 Chevron U.S.A. Inc. System and method for modeling coupled systems of hydrodynamics and sediment transport
AU2018203428A1 (en) * 2017-03-09 2018-09-27 Shell Internationale Research Maatschappij B.V. Constructing stratigraphic images of sediment distribution in a subsurface of the earth
CA3108902A1 (en) 2018-08-31 2020-03-05 The Climate Corporation Subfield moisture model improvement using overland flow modeling with shallow water computations
US11754746B2 (en) * 2020-02-21 2023-09-12 Saudi Arabian Oil Company Systems and methods for creating 4D guided history matched models
CN111368410B (en) * 2020-02-27 2024-04-02 水利部交通运输部国家能源局南京水利科学研究院 Prediction method based on river network water and sand two-dimensional limited control volume
CN116757004B (en) * 2023-08-21 2023-10-20 长江空间信息技术工程有限公司(武汉) EFDC three-dimensional water quality data multi-mode deduction method based on digital twin technology

Citations (4)

* Cited by examiner, † Cited by third party
Publication number Priority date Publication date Assignee Title
US20040220789A1 (en) * 2002-08-26 2004-11-04 Total Sa Process for calculating meshed realizations of a reservoir
US20050049802A1 (en) * 2003-08-27 2005-03-03 Minton Joseph Grayson Method for flow analysis utilizing cell elevation topology
US20070219724A1 (en) * 2004-07-01 2007-09-20 Dachang Li Method for Geologic Modeling Through Hydrodynamics-Based Gridding (Hydro-Grids)
US20070219725A1 (en) * 2004-09-10 2007-09-20 Tao Sun Method For Evaluating Sedimentary Basin Properties By Numerical Modeling Of Sedimentation Processes

Family Cites Families (60)

* Cited by examiner, † Cited by third party
Publication number Priority date Publication date Assignee Title
US4357660A (en) 1973-05-01 1982-11-02 Schlumberger Technology Corporation Formation dip and azimuth processing technique
AU625347B2 (en) 1989-05-08 1992-07-09 Australian Institute Of Marine Science Measurement of sediment level
FR2744224B1 (en) 1996-01-26 1998-04-17 Inst Francais Du Petrole METHOD FOR SIMULATING THE FILLING OF A SEDIMENTARY BASIN
US5838634A (en) 1996-04-04 1998-11-17 Exxon Production Research Company Method of generating 3-D geologic models incorporating geologic and geophysical constraints
US5995906A (en) 1997-10-03 1999-11-30 Western Atlas International, Inc. Method for reconciling data at seismic and well-log scales in 3-D earth modeling
US6044328A (en) 1997-12-01 2000-03-28 Schlumberger Technology Corporation Method for creating, testing, and modifying geological subsurface models
US6070125A (en) 1997-12-01 2000-05-30 Schlumberger Technology Corporation Apparatus for creating, testing, and modifying geological subsurface models
FR2776393B1 (en) 1998-03-20 2001-09-07 Inst Francais Du Petrole METHOD FOR AUTOMATICALLY FORMING A MODEL SIMULATING THE STRATIGRAPHIC STRUCTURE OF AN UNDERGROUND AREA
US6246963B1 (en) 1999-01-29 2001-06-12 Timothy A. Cross Method for predicting stratigraphy
US6754588B2 (en) 1999-01-29 2004-06-22 Platte River Associates, Inc. Method of predicting three-dimensional stratigraphy using inverse optimization techniques
FR2798197B1 (en) 1999-09-02 2001-10-05 Inst Francais Du Petrole METHOD FOR FORMING A MODEL OF A GEOLOGICAL FORMATION, CONSTRAINED BY DYNAMIC AND STATIC DATA
US6480790B1 (en) 1999-10-29 2002-11-12 Exxonmobil Upstream Research Company Process for constructing three-dimensional geologic models having adjustable geologic interfaces
US6249746B1 (en) 1999-11-04 2001-06-19 Phillips Petroleum Company Automated seismic isochron analysis
US6980940B1 (en) 2000-02-22 2005-12-27 Schlumberger Technology Corp. Intergrated reservoir optimization
US7369973B2 (en) 2000-06-29 2008-05-06 Object Reservoir, Inc. Method and system for representing reservoir systems
JP2004502999A (en) 2000-06-29 2004-01-29 オブジェクト レザビア, インコーポレイテッド Method and system for solving finite element models using polyphase physics
US7177764B2 (en) 2000-07-14 2007-02-13 Schlumberger Technology Corp. Simulation method and apparatus for determining subsidence in a reservoir
US6549853B2 (en) 2001-03-22 2003-04-15 Council Of Scientific & Industrial Research Method for determining seafloor roughness using multibeam echosounder
FR2833384B1 (en) 2001-12-10 2004-04-02 Tsurf METHOD, DEVICE AND PROGRAM PRODUCT FOR THREE-DIMENSIONAL MODELING OF A GEOLOGICAL VOLUME
US7340385B2 (en) 2002-06-14 2008-03-04 Schlumberger Technology Corporation Method and program storage device for generating grids representing the architecture of fluvial reservoirs
FR2849211B1 (en) 2002-12-20 2005-03-11 Inst Francais Du Petrole METHOD OF MODELING TO CONSTITUTE A MODEL SIMULATING THE MULTILITHOLOGICAL FILLING OF A SEDIMENT BASIN
US7277387B2 (en) 2003-01-30 2007-10-02 Wind River Systems, Inc. Package manager
US7433785B2 (en) 2003-03-13 2008-10-07 Exxon Mobil Upstream Research Company Method for predicting grain size distribution from reservoir thickness
EP1609005A4 (en) 2003-03-31 2011-04-06 Exxonmobil Upstream Res Co Method to determine properties of a sedimentary body from thickness and grain size distribution at a point within the body
US6885941B2 (en) 2003-04-30 2005-04-26 Exxonmobil Upstream Research Company Method for predicting properties of a sedimentary deposit from a thickness contour of the deposit
CA2524777A1 (en) 2003-05-23 2004-12-09 Exxonmobil Upstream Research Company Method for predicting grain size distribution from the shape of a sedimentary body
US7331385B2 (en) 2003-06-24 2008-02-19 Exxonmobil Upstream Research Company Methods of treating a subterranean formation to convert organic matter into producible hydrocarbons
US7631691B2 (en) 2003-06-24 2009-12-15 Exxonmobil Upstream Research Company Methods of treating a subterranean formation to convert organic matter into producible hydrocarbons
WO2005008333A2 (en) 2003-07-18 2005-01-27 Uclt Ltd. Method for correcting critical dimension variations in photomasks
FR2860076B1 (en) 2003-09-24 2005-10-28 Inst Francais Du Petrole METHOD FOR SIMULATING THE DEPOSITION OF A SEDIMENT SEQUENCE IN A BASIN
EP1733329A4 (en) 2004-03-31 2015-07-29 Exxonmobil Upstream Res Co Method for simulating and estimating sandstone properties
FR2872584B1 (en) 2004-06-30 2006-08-11 Inst Francais Du Petrole METHOD FOR SIMULATING THE SEDIMENT DEPOSITION IN A BASIN RESPECTING THE SEDIMENT SEQUENCE THICKNESS
US7516055B2 (en) 2004-08-20 2009-04-07 Chevron U.S.A. Inc Multiple-point statistics (MPS) simulation with enhanced computational efficiency
US7079953B2 (en) 2004-08-20 2006-07-18 Chevron U.S.A. Inc. Method for creating facies probability cubes based upon geologic interpretation
US20060041409A1 (en) 2004-08-20 2006-02-23 Chevron U.S.A. Inc. Method for making a reservoir facies model utilizing a training image and a geologically interpreted facies probability cube
AU2005309398B2 (en) 2004-11-29 2012-01-12 Chevron U.S.A. Inc. Method, system and program storage device for simulating fluid flow in a physical system using a dynamic composition based extensible object-oriented architecture
US7630517B2 (en) 2005-07-13 2009-12-08 Schlumberger Technology Corporation Computer-based generation and validation of training images for multipoint geostatistical analysis
FR2898990B1 (en) 2006-03-24 2008-05-16 Inst Francais Du Petrole USE OF THE STATIONARY STATE OF ENERGY-EXCHANGING CELLULAR AUTOMATORS FOR MODELING SEDIMENT ARCHITECTURES
US7363158B2 (en) 2006-04-07 2008-04-22 Chevron U.S.A. Inc. Method for creating a stratigraphic model using pseudocores created from borehole images
US20070276604A1 (en) 2006-05-25 2007-11-29 Williams Ralph A Method of locating oil and gas exploration prospects by data visualization and organization
US8065088B2 (en) 2006-06-21 2011-11-22 Terraspark Geosciences, Llc Extraction of depositional systems
JO2982B1 (en) 2006-10-13 2016-03-15 Exxonmobil Upstream Res Co Optimized well spacing for in situ shale oil development
FR2909185B1 (en) 2006-11-27 2009-01-09 Inst Francais Du Petrole METHOD OF STRATIGRAPHIC INTERPRETATION OF SEISMIC IMAGES
US8109405B2 (en) 2007-06-22 2012-02-07 Stolle Machinery Company, Llc Can end and rivet base scoreline therefor
US8612194B2 (en) 2007-08-08 2013-12-17 Westerngeco L.L.C. Updating a subterranean model using at least electromagnetic data
ATE533075T1 (en) 2007-12-21 2011-11-15 Prad Res & Dev Ltd MULTIPOINT GEOSTATISTICS METHOD USING BRANCH RUNNING LENGTH COMPRESSION AND LOCAL Raster TRANSFORMATION
US8271244B2 (en) 2008-01-28 2012-09-18 Landmark Graphics Corporation Hybrid stratigraphic layering using pseudo-wheeler space
WO2009138290A2 (en) 2008-05-16 2009-11-19 Ephesia Consult Sa Multi-point reservoir modelling
US8355898B2 (en) 2008-06-17 2013-01-15 Chevron U.S.A. Inc. System and method for modeling flow events responsible for the formation of a geological reservoir
WO2010071722A1 (en) 2008-12-18 2010-06-24 Exxonmobil Upstream Reseach Company Overlapped multiple layer depth averaged flow model of a turbidity current
ES2847600T3 (en) 2008-12-18 2021-08-03 Exxonmobil Upstream Res Co Sediment transport by fully developed turbulent flows
EP2406750B1 (en) 2009-03-11 2020-04-01 Exxonmobil Upstream Research Company Adjoint-based conditioning of process-based geologic models
EP2406710B1 (en) 2009-03-11 2020-03-11 Exxonmobil Upstream Research Company Gradient-based workflows for conditioning of process-based geologic models
US9134457B2 (en) 2009-04-08 2015-09-15 Schlumberger Technology Corporation Multiscale digital rock modeling for reservoir simulation
ES2792357T3 (en) * 2009-04-20 2020-11-11 Exxonmobil Upstream Res Co Procedure for predicting fluid flow
EP2491516B1 (en) 2009-10-23 2018-09-12 Exxonmobil Upstream Research Company Method for optimization with gradient information
PL400383A1 (en) 2009-12-15 2013-01-21 Schlumberger Technology B.V. Modeling method of reservoir pool
US8452580B2 (en) 2010-02-26 2013-05-28 Chevron U.S.A. Inc. Method and system for using multiple-point statistics simulation to model reservoir property trends
US20120239361A1 (en) 2011-03-16 2012-09-20 Vargas-Guzman J A Subsurface Directional Equalization Analysis of Rock Bodies
US9341729B2 (en) 2011-04-06 2016-05-17 Schlumberger Technology Corporation Amplitude contrast seismic attribute

Patent Citations (4)

* Cited by examiner, † Cited by third party
Publication number Priority date Publication date Assignee Title
US20040220789A1 (en) * 2002-08-26 2004-11-04 Total Sa Process for calculating meshed realizations of a reservoir
US20050049802A1 (en) * 2003-08-27 2005-03-03 Minton Joseph Grayson Method for flow analysis utilizing cell elevation topology
US20070219724A1 (en) * 2004-07-01 2007-09-20 Dachang Li Method for Geologic Modeling Through Hydrodynamics-Based Gridding (Hydro-Grids)
US20070219725A1 (en) * 2004-09-10 2007-09-20 Tao Sun Method For Evaluating Sedimentary Basin Properties By Numerical Modeling Of Sedimentation Processes

Non-Patent Citations (6)

* Cited by examiner, † Cited by third party
Title
"RECLAMATION Managing Water in the West Theory and User Manual for SRH-W Version 1.1 Sedimentation and River Hydraulic ? Watershed", U.S. DEPARTMENT OF THE INTERIOR BUREAU OF RECLAMATION, November 2006 (2006-11-01), XP008168687, Retrieved from the Internet <URL:http://www.usbr.gov/pmts/sedimenUmodeUsrh2d/Downloads/SRHW%20v1.1%20User%20Manual°/a20June2007.pdf> [retrieved on 20100225] *
"Standards for Digital Elevation Models, National Mapping Program Technical Instructions, Part 2 Specifications", U.S. DEPARTMENT OF THE INTERIOR U.S. GEOLOGICAL SURVEY, NATIONAL MAPPING DIVISION, October 1995 (1995-10-01), XP055110118, Retrieved from the Internet <URL:http://rmmcweb.cr.usgs.gov/nmpstds/acrodocs/dem/2DEM0198.PDF> [retrieved on 20100225] *
BEGNUDELLI ET AL.: "Adaptive Godunov-Based Model for Flood Simulation, Universit?", DEGLL STUDI DI FERRARA, vol. 134, no. 6, June 2008 (2008-06-01), pages 714 - 725, XP055110128, Retrieved from the Internet <URL:http://sanders.eng.uci.edulsandersa34.pdf> [retrieved on 20100225] *
GUO ET AL.: "User's Guide to SEAWAT:A Computer Program For Simulation of Three- Dimensional Variable-Density Ground-Water Flow", U.S. GEOLOGICAL SURVEY TECHNIQUES OF WATER-RESOURCES INVESTIGATIONS, 2002, XP055108287, Retrieved from the Internet <URL:http://fl.water.usgs.gov/PDF_filesRwri_6_A7uo_langevin.pdf> [retrieved on 20100225] *
SYSTEMS MANUAL OF BASEMENT MANUAL, December 2008 (2008-12-01), XP008168689, Retrieved from the Internet <URL:http://vuww.basement.ethz.ch/docsBASEMEMv1.5_Reference.pdb> [retrieved on 20100225] *
VALIANI ET AL.: "FINITE VOLUME SCHEME FOR 2D SHALLOW-WATER EQUATIONS APPLICATION TO A FLOOD EVENT IN THE TOCE RIVER", 14 December 2007 (2007-12-14), XP008168665, Retrieved from the Internet <URL:http://web.archive.org/web/20071214081537/http://uvww.hrwallingford.co.uk/projects/CADAM/CADAMlZaragoza215.pdf> [retrieved on 20100225] *

Cited By (4)

* Cited by examiner, † Cited by third party
Publication number Priority date Publication date Assignee Title
WO2013016041A3 (en) * 2011-07-28 2013-08-08 Saudi Arabian Oil Company Cluster 3d petrophysical uncertainty modeling
US8731891B2 (en) 2011-07-28 2014-05-20 Saudi Arabian Oil Company Cluster 3D petrophysical uncertainty modeling
CN103827698A (en) * 2011-07-28 2014-05-28 沙特阿拉伯石油公司 Cluster 3d petrophysical uncertainty modeling
JP2014526044A (en) * 2011-07-28 2014-10-02 サウジ アラビアン オイル カンパニー Cluster 3D petrophysical uncertainty modeling

Also Published As

Publication number Publication date
EP2422222A4 (en) 2017-11-29
CA2754736C (en) 2016-11-01
AU2010239716B2 (en) 2014-11-20
ES2792357T3 (en) 2020-11-11
US9128212B2 (en) 2015-09-08
US20110290478A1 (en) 2011-12-01
US20150227655A1 (en) 2015-08-13
US10162080B2 (en) 2018-12-25
EP2422222B1 (en) 2020-04-01
CA2754736A1 (en) 2010-10-28
AU2010239716A1 (en) 2011-10-27
EP2422222A1 (en) 2012-02-29

Similar Documents

Publication Publication Date Title
US10162080B2 (en) Method for predicting fluid flow
USRE49507E1 (en) Faulted geological structures having unconformities
EP2629123B1 (en) Simulation model optimization
US20140222403A1 (en) Geologic model via implicit function
US10519766B2 (en) Reservoir modelling with multiple point statistics from a non-stationary training image
US9068448B2 (en) System and method for predicting fluid flow characteristics within fractured subsurface reservoirs
US11175434B2 (en) Geologic stratigraphy via implicit and jump functions
US11042676B2 (en) Representing structural uncertainty in a mesh representing a geological environment
EP1865343A1 (en) Method for estimating and/or reducing uncertainty in reservoir models of potential petroleum reservoirs
US11280935B2 (en) Multiphase flow in porous media
US20180217283A1 (en) Assignment of Systems Tracts
US11249208B2 (en) Geologic structural model generation
Jo et al. Machine learning assisted history matching for a deepwater lobe system
Lee et al. BasinVis 1.0: A MATLAB®-based program for sedimentary basin subsidence analysis and visualization
Orellana et al. Influence of variograms in 3D reservoir-modeling outcomes: An example
WO2016187238A1 (en) Auto-validating earth interpretation and modeling system
Yu et al. Geological surface uncertain modeling based on chance-constrained programming
Gerritsen et al. Modeling Spatial and Structural Uncertainty in the Subsurface
Yang Quantifying and Visualizing Uncertainty of 3d Geological Structures with Implicit Methods
MacDonald et al. Introduction to reservoir uncertainty modeling

Legal Events

Date Code Title Description
121 Ep: the epo has been informed by wipo that ep was designated in this application

Ref document number: 10767455

Country of ref document: EP

Kind code of ref document: A1

WWE Wipo information: entry into national phase

Ref document number: 13201395

Country of ref document: US

WWE Wipo information: entry into national phase

Ref document number: 2754736

Country of ref document: CA

NENP Non-entry into the national phase

Ref country code: DE

ENP Entry into the national phase

Ref document number: 2010239716

Country of ref document: AU

Date of ref document: 20100121

Kind code of ref document: A

WWE Wipo information: entry into national phase

Ref document number: 2010767455

Country of ref document: EP