WO2010100595A2 - Isolated polynucleotides and polypeptides, and methods of using same for increasing plant yield and/or agricultural characteristics - Google Patents
Isolated polynucleotides and polypeptides, and methods of using same for increasing plant yield and/or agricultural characteristics Download PDFInfo
- Publication number
- WO2010100595A2 WO2010100595A2 PCT/IB2010/050871 IB2010050871W WO2010100595A2 WO 2010100595 A2 WO2010100595 A2 WO 2010100595A2 IB 2010050871 W IB2010050871 W IB 2010050871W WO 2010100595 A2 WO2010100595 A2 WO 2010100595A2
- Authority
- WO
- WIPO (PCT)
- Prior art keywords
- plant
- seq
- yield
- plants
- acid sequence
- Prior art date
Links
Classifications
-
- C—CHEMISTRY; METALLURGY
- C12—BIOCHEMISTRY; BEER; SPIRITS; WINE; VINEGAR; MICROBIOLOGY; ENZYMOLOGY; MUTATION OR GENETIC ENGINEERING
- C12N—MICROORGANISMS OR ENZYMES; COMPOSITIONS THEREOF; PROPAGATING, PRESERVING, OR MAINTAINING MICROORGANISMS; MUTATION OR GENETIC ENGINEERING; CULTURE MEDIA
- C12N15/00—Mutation or genetic engineering; DNA or RNA concerning genetic engineering, vectors, e.g. plasmids, or their isolation, preparation or purification; Use of hosts therefor
- C12N15/09—Recombinant DNA-technology
- C12N15/63—Introduction of foreign genetic material using vectors; Vectors; Use of hosts therefor; Regulation of expression
- C12N15/79—Vectors or expression systems specially adapted for eukaryotic hosts
- C12N15/82—Vectors or expression systems specially adapted for eukaryotic hosts for plant cells, e.g. plant artificial chromosomes (PACs)
- C12N15/8241—Phenotypically and genetically modified plants via recombinant DNA technology
- C12N15/8261—Phenotypically and genetically modified plants via recombinant DNA technology with agronomic (input) traits, e.g. crop yield
-
- C—CHEMISTRY; METALLURGY
- C07—ORGANIC CHEMISTRY
- C07K—PEPTIDES
- C07K14/00—Peptides having more than 20 amino acids; Gastrins; Somatostatins; Melanotropins; Derivatives thereof
- C07K14/415—Peptides having more than 20 amino acids; Gastrins; Somatostatins; Melanotropins; Derivatives thereof from plants
-
- C—CHEMISTRY; METALLURGY
- C12—BIOCHEMISTRY; BEER; SPIRITS; WINE; VINEGAR; MICROBIOLOGY; ENZYMOLOGY; MUTATION OR GENETIC ENGINEERING
- C12N—MICROORGANISMS OR ENZYMES; COMPOSITIONS THEREOF; PROPAGATING, PRESERVING, OR MAINTAINING MICROORGANISMS; MUTATION OR GENETIC ENGINEERING; CULTURE MEDIA
- C12N15/00—Mutation or genetic engineering; DNA or RNA concerning genetic engineering, vectors, e.g. plasmids, or their isolation, preparation or purification; Use of hosts therefor
- C12N15/09—Recombinant DNA-technology
- C12N15/63—Introduction of foreign genetic material using vectors; Vectors; Use of hosts therefor; Regulation of expression
- C12N15/79—Vectors or expression systems specially adapted for eukaryotic hosts
- C12N15/82—Vectors or expression systems specially adapted for eukaryotic hosts for plant cells, e.g. plant artificial chromosomes (PACs)
- C12N15/8241—Phenotypically and genetically modified plants via recombinant DNA technology
- C12N15/8242—Phenotypically and genetically modified plants via recombinant DNA technology with non-agronomic quality (output) traits, e.g. for industrial processing; Value added, non-agronomic traits
- C12N15/8243—Phenotypically and genetically modified plants via recombinant DNA technology with non-agronomic quality (output) traits, e.g. for industrial processing; Value added, non-agronomic traits involving biosynthetic or metabolic pathways, i.e. metabolic engineering, e.g. nicotine, caffeine
- C12N15/8247—Phenotypically and genetically modified plants via recombinant DNA technology with non-agronomic quality (output) traits, e.g. for industrial processing; Value added, non-agronomic traits involving biosynthetic or metabolic pathways, i.e. metabolic engineering, e.g. nicotine, caffeine involving modified lipid metabolism, e.g. seed oil composition
-
- Y—GENERAL TAGGING OF NEW TECHNOLOGICAL DEVELOPMENTS; GENERAL TAGGING OF CROSS-SECTIONAL TECHNOLOGIES SPANNING OVER SEVERAL SECTIONS OF THE IPC; TECHNICAL SUBJECTS COVERED BY FORMER USPC CROSS-REFERENCE ART COLLECTIONS [XRACs] AND DIGESTS
- Y02—TECHNOLOGIES OR APPLICATIONS FOR MITIGATION OR ADAPTATION AGAINST CLIMATE CHANGE
- Y02A—TECHNOLOGIES FOR ADAPTATION TO CLIMATE CHANGE
- Y02A40/00—Adaptation technologies in agriculture, forestry, livestock or agroalimentary production
- Y02A40/10—Adaptation technologies in agriculture, forestry, livestock or agroalimentary production in agriculture
- Y02A40/146—Genetically Modified [GMO] plants, e.g. transgenic plants
Definitions
- the present invention in some embodiments thereof, relates to isolated polynucleotides and polypeptides which can increase the yield (e.g., biomass, grain quantity and/or quality), growth rate, vigor, abiotic stress tolerance (ABST), water use efficiency (WUE), nitrogen use efficiency (NUE) and/or fertilizer use efficiency (FUE) of a plant.
- yield e.g., biomass, grain quantity and/or quality
- ABSST abiotic stress tolerance
- WUE water use efficiency
- NUE nitrogen use efficiency
- FUE fertilizer use efficiency
- ABS abiotic stress
- Drought is a gradual phenomenon, which involves periods of abnormally dry weather that persists long enough to produce serious hydrologic imbalances such as crop damage, water supply shortage and increased susceptibility to various diseases.
- Salinity high salt levels, affects one in five hectares of irrigated land. None of the top five food crops, i.e., wheat, corn, rice, potatoes, and soybean, can tolerate excessive salt. Detrimental effects of salt on plants result from both water deficit, which leads to osmotic stress (similar to drought stress), and the effect of excess sodium ions on critical biochemical processes. As with freezing and drought, high salt causes water deficit; and the presence of high salt makes it difficult for plant roots to extract water from their environment. Thus, salination of soils that are used for agricultural production is a significant and increasing problem in regions that rely heavily on agriculture, and is worsen by over-utilization, over-fertilization and water shortage, typically caused by climatic change and the demands of increasing population.
- Suboptimal temperatures affect plant growth and development through the whole plant life cycle. Thus, low temperatures reduce germination rate and high temperatures result in leaf necrosis.
- Heat shock may arise in various organs, including leaves and particularly fruit, when transpiration is insufficient to overcome heat stress. Heat also damages cellular structures, including organelles and cytoskeleton, and impairs membrane function. Heat shock may produce a decrease in overall protein synthesis, accompanied by expression of heat shock proteins, e.g., chaperones, which are involved in refolding proteins denatured by heat.
- Heat shock proteins e.g., chaperones
- Excessive chilling conditions e.g., low, but above freezing, temperatures affect crops of tropical origins, such as soybean, rice, maize, and cotton.
- Typical chilling damage includes wilting, necrosis, chlorosis or leakage of ions from cell membranes.
- Excessive light conditions which occur under clear atmospheric conditions subsequent to cold late summer/autumn night's, can lead to photoinhibition of photosynthesis (disruption of photosynthesis). In addition, chilling may lead to yield losses and lower product quality through the delayed ripening of maize.
- Suboptimal nutrient affect plant growth and development through the whole plant life cycle.
- One of the essential macronutrients for the plant is Nitrogen.
- Nitrogen is responsible for biosynthesis of amino acids and nucleic acids, prosthetic groups, plant hormones, plant chemical defenses, and the like.
- Nitrogen is often the rate-limiting element in plant growth and all field crops have a fundamental dependence on inorganic nitrogenous fertilizer. Since fertilizer is rapidly depleted from most soil types, it must be supplied to growing crops two or three times during the growing season.
- Additional important macronutrients are Phosphorous (P) and Potassium (K), which have a direct correlation to yield and general plant tolerance.
- Yield is affected by various factors, such as, the number and size of the plant organs, plant architecture (for example, the number of branches), grains set length, number of filled grains, vigor (e.g. seedling), growth rate, root development, utilization of water, nutrients (e.g., nitrogen) and fertilizers, and stress tolerance.
- Crops such as, corn, rice, wheat, canola and soybean account for over half of total human caloric intake, whether through direct consumption of the seeds themselves or through consumption of meat products raised on processed seeds or forage. Seeds are also a source of sugars, oils and metabolites used in industrial processes.
- WO publication No. 2008/122980 discloses genes constructs and methods for increasing oil content, growth rate and biomass of plants.
- WO publication No. 2008/075364 discloses polynucleotides involved in plant fiber development and methods of using same.
- WO publication No. 2007/049275 discloses isolated polypeptides, polynucleotides encoding same, transgenic plants expressing same and methods of using same for increasing plant abiotic stress tolerance and biomass.
- WO publication No. 2004/104162 discloses methods of increasing abiotic stress tolerance and/or biomass in plants and plants generated thereby.
- WO publication No. 2005/121364 discloses polynucleotides and polypeptides involved in plant fiber development and methods of using same for improving fiber quality, yield and/or biomass of a fiber producing plant.
- WO publication No. 2007/020638 discloses methods of increasing abiotic stress tolerance and/or biomass in plants and plants generated thereby.
- a method of increasing yield, biomass, growth rate, vigor, oil content, fiber yield, fiber quality, abiotic stress tolerance, and/or nitrogen use efficiency of a plant comprising expressing within the plant an exogenous polynucleotide comprising a nucleic acid sequence at least 80 % identical to SEQ ID NO: 3487, 1-239, 467-1973, 3481-3486, 3488-3674, 3738 or 3739, thereby increasing the yield, biomass, growth rate, vigor, oil content, fiber yield, fiber quality, abiotic stress tolerance, and/or nitrogen use efficiency of the plant.
- a method of increasing yield, biomass, growth rate, vigor, oil content, fiber yield, fiber quality, abiotic stress tolerance, and/or nitrogen use efficiency of a plant comprising expressing within the plant an exogenous polynucleotide comprising the nucleic acid sequence selected from the group consisting of SEQ ID NOs: 3487, 1-239, 467-1973, 3481-3486, 3488-3674, and 3738-3739, thereby increasing the yield, biomass, growth rate, vigor, oil content, fiber yield, fiber quality, abiotic stress tolerance, and/or nitrogen use efficiency of the plant.
- a method of increasing yield, biomass, growth rate, vigor, oil content, fiber yield, fiber quality, abiotic stress tolerance, and/or nitrogen use efficiency of a plant comprising expressing within the plant an exogenous polynucleotide comprising a nucleic acid sequence encoding a polypeptide at least 80 % identical to SEQ ID NO: 246, 240-245, 247-465, 1974-3480, 3675-3736 or 3737, thereby increasing the yield, biomass, growth rate, vigor, oil content, fiber yield, fiber quality, abiotic stress tolerance, and/or nitrogen use efficiency of the plant.
- a method of increasing yield, biomass, growth rate, vigor, oil content, fiber yield, fiber quality, abiotic stress tolerance, and/or nitrogen use efficiency of a plant comprising expressing within the plant an exogenous polynucleotide comprising a nucleic acid sequence encoding a polypeptide selected from the group consisting of SEQ ID NOs: 246, 240-245, 247-465, 1974-3480, and 3675-3737, thereby increasing the yield, biomass, growth rate, vigor, oil content, fiber yield, fiber quality, abiotic stress tolerance, and/or nitrogen use efficiency of the plant.
- an isolated polynucleotide comprising a nucleic acid sequence at least 80 % identical to SEQ ID NO: 3487, 1-239, 467-1973, 3481-3486, 3488-3674, 3738 or 3739, wherein said nucleic acid sequence is capable of increasing yield, biomass, growth rate, vigor, oil content, fiber yield, fiber quality, abiotic stress tolerance, and/or nitrogen use efficiency of a plant.
- an isolated polynucleotide comprising the nucleic acid sequence selected from the group consisting of SEQ ID NOs: 3487, 1-239, 467-1973, 3481-3486, 3488-3674, and 3738-3739.
- an isolated polynucleotide comprising a nucleic acid sequence encoding a polypeptide which comprises an amino acid sequence at least 80 % homologous to the amino acid sequence set forth in SEQ ID NO: 246, 240-245, 247-465, 1974-3480, 3675- 3736 or 3737, wherein said nucleic acid sequence is capable of increasing yield, biomass, growth rate, vigor, oil content, fiber yield, fiber quality, abiotic stress tolerance, and/or nitrogen use efficiency of a plant.
- an isolated polynucleotide comprising a nucleic acid sequence encoding a polypeptide which comprises the amino acid sequence selected from the group consisting of SEQ ID NOs: 246, 240-245, 247-465, 1974-3480, and 3675-3737.
- a nucleic acid construct comprising the isolated polynucleotide of claim 5, 6, 7 or 8, and a promoter for directing transcription of said nucleic acid sequence in a host cell.
- an isolated polypeptide comprising an amino acid sequence at least 80 % homologous to SEQ ID NO: 246, 240-245, 247-465, 1974-3480, 3675-3736 or 3737, wherein said amino acid sequence is capable of increasing yield, biomass, growth rate, vigor, oil content, fiber yield, fiber quality, abiotic stress tolerance, and/or nitrogen use efficiency of a plant.
- an isolated polypeptide comprising the amino acid sequence selected from the group consisting of SEQ ID NOs: 246, 240-245, 247-465, 1974-3480, and 3675-3737.
- the nucleic acid sequence is as set forth in SEQ ID NO: 3487, 1-239, 467-1973, 3481-3486, 3488-3674, 3738 or 3739.
- the polynucleotide consists of the nucleic acid sequence selected from the group consisting of SEQ ID NOs: 3487, 1- 239, 467-1973, 3481-3486, 3488-3674, and 3738-3739.
- the nucleic acid sequence encodes an amino acid sequence at least 80 % homologous to SEQ ID NO: 246, 240- 245, 247-465, 1974-3480, 3675-3736 or 3737.
- the nucleic acid sequence encodes the amino acid sequence selected from the group consisting of SEQ ID NOs: 246, 240-245, 247-465, 1974-3480, and 3675-3737.
- the plant cell forms a part of a plant.
- the abiotic stress is selected from the group consisting of salinity, drought, water deprivation, low temperature, high temperature, heavy metal toxicity, anaerobiosis, nutrient deficiency, nutrient excess, atmospheric pollution and UV irradiation.
- the method further comprising growing the plant under the abiotic stress. According to some embodiments of the invention, the method, further comprising growing the plant under nitrogen-limiting conditions.
- FIG. 1 is a schematic illustration of the modified pGI binary plasmid containing the new At6669 promoter (SEQ ID NO:4198) and the GUSintron (pQYN_6669) used for expressing the isolated polynucleotide sequences of the invention.
- FIG. 2 is a schematic illustration of the modified pGI binary plasmid containing the new At6669 promoter (SEQ ID NO:4198) (pQFN) used for expressing the isolated polynucleotide sequences of the invention.
- RB T-DNA right border
- LB T-DNA left border
- MCS Multiple cloning site
- RE any restriction enzyme
- NOS pro nopaline synthase promoter
- NPT-II neomycin phosphotransferase gene
- NOS ter nopaline synthase terminator
- PoIy-A signal polyadenylation signal
- GUSintron the GUS reporter gene (coding sequence and intron).
- the isolated polynucleotide sequences of the invention were cloned into the MCS of the vector.
- FIGs. 3A-F are images depicting visualization of root development of transgenic plants exogenously expressing the polynucleotide of some embodiments of the invention when grown in transparent agar plates under normal (FIGs. 3A-B), osmotic stress (15 % PEG; FIGs. 3C-D) or nitrogen-limiting (FIGs. 3E-F) conditions.
- the different transgenes were grown in transparent agar plates for 17 days (7 days nursery and 10 days after transplanting). The plates were photographed every 3-4 days starting at day 1 after transplanting.
- FIG. 3 A An image of a photograph of plants taken following 10 after transplanting days on agar plates when grown under normal (standard) conditions.
- FIG. 3B An image of root analysis of the plants shown in FIG.
- FIG. 3A in which the lengths of the roots measured are represented by arrows.
- FIG. 3C An image of a photograph of plants taken following 10 days after transplanting on agar plates, grown under high osmotic (PEG 15 %) conditions.
- FIG. 3D An image of root analysis of the plants shown in FIG. 3C in which the lengths of the roots measured are represented by arrows.
- FIG. 3E An image of a photograph of plants taken following 10 days after transplanting on agar plates, grown under low nitrogen conditions.
- FIG. 3F An image of root analysis of the plants shown in FIG. 3E in which the lengths of the roots measured are represented by arrows.
- the present invention in some embodiments thereof, relates to isolated polynucleotides and polypeptides which can increase yield, biomass, growth rate, vigor, oil content, fiber yield, fiber quality abiotic stress tolerance, and/or fertilizer use efficiency (e.g., nitrogen use efficiency) of a plant.
- fertilizer use efficiency e.g., nitrogen use efficiency
- the present inventors have identified novel polynucleotides and polypeptides which can be used in increasing yield, biomass, growth rate, vigor, oil content, fiber yield, fiber quality abiotic stress tolerance, and/or fertilizer use efficiency (e.g., nitrogen use efficiency) of a plant.
- the present inventors have employed a bioinformatic approach which combines clustering and assembly of sequences from databases of arabidopsis, rice, poplar, brachypodium, soybean, grape, castobean, sorghum and maize and other publicly available plant genomes, expressed sequence tags (ESTs), mRNA sequences, properitary ESTs sequences (Barley, Sorghum), protein and pathway databases, quantitative trait loci (QTL), single nucleotide polymorphism (SNPs) information with a digital expression profile ("electronic Northern Blot”) and identified polynucleotides and polypeptides which can increase yield, growth rate, biomass, vigor, tolerance to abiotic stress, nitrogen use efficiency, water use efficiency and fertilizer use efficiency (SEQ ID NOs: 1-239 for polynucleotides; SEQ ID NOs:240-465 for polypeptides; Table 1, Example 1).
- Transgenic plants over-expressing the identified polynucleotides were found to exhibit increased seed yield, oil yield, dry weight, fresh weight, root coverage, root length, harvest index, growth rate, rosette area, biomass, oil percentage in seed and weight of 1000 seeds (Examples 10-11; Tables 29-36), and increased tolerance to abiotic stress conditions such as limiting nitrogen conditions (Example 11, Tables 37-38).
- abiotic stress conditions such as limiting nitrogen conditions
- the identified polynucleotides and polypeptides of the invention can be used to increase plant's yield, biomass (e.g., of grain or any harvestable plant part with economical value), vigor, growth rate, oil content, fiber yield, fiber quality, tolerance to abiotic stress, nitrogen use efficiency, water use efficiency and/or fertilizer use efficiency.
- a method of increasing a yield, biomass, growth rate, vigor, oil content, fiber yield, fiber quality, water use efficiency, nitrogen use efficiency, fertilizer use efficiency and/or abiotic stress tolerance of a plant there is provided a method of increasing a yield, biomass, growth rate, vigor, oil content, fiber yield, fiber quality, water use efficiency, nitrogen use efficiency, fertilizer use efficiency and/or abiotic stress tolerance of a plant.
- the method is effected by expressing within the plant an exogenous polynucleotide comprising a nucleic acid sequence at least 80 % identical to SEQ ID NO: 3487, 1-239, 467-1973, 3481-3486, 3488-3674, 3738 or 3739, thereby increasing the yield, biomass, growth rate, vigor, oil content, fiber yield, fiber quality, water use efficiency, nitrogen use efficiency, fertilizer use efficiency and/or abiotic stress tolerance of the plant.
- plant yield refers to the amount (e.g., as determined by weight or size) or quantity (numbers) of tissues or organs produced per plant or per growing season. Hence increased yield could affect the economic benefit one can obtain from the plant in a certain growing area and/or growing time.
- a plant yield can be affected by various parameters including, but not limited to, plant biomass; plant vigor; growth rate; seed yield; seed or grain quantity; seed or grain quality; oil yield; content of oil, starch and/or protein in harvested organs (e.g., seeds or vegetative parts of the plant); number of flowers (florets) per panicle (expressed as a ratio of number of filled seeds over number of primary panicles); harvest index; number of plants grown per area; number and size of harvested organs per plant and per area; number of plants per growing area (density); number of harvested organs in field; total leaf area; carbon assimilation and carbon partitioning (the distribution/allocation of carbon within the plant); resistance to shade; number of harvestable organs (e.g. seeds), seeds per pod, weight per seed; and modified architecture [such as increase stalk diameter, thickness or improvement of physical properties (e.g. elasticity)] .
- seed yield refers to the number or weight of the seeds per plant, seeds per pod, or per growing area or to the weight of a single seed, or to the oil extracted per seed.
- seed yield can be affected by seed dimensions (e.g., length, width, perimeter, area and/or volume), number of (filled) seeds and seed filling rate and by seed oil content.
- increase seed yield per plant could affect the economic benefit one can obtain from the plant in a certain growing area and/or growing time; and increase seed yield per growing area could be achieved by increasing seed yield per plant, and/or by increasing number of plants grown on the same given area.
- seed also referred to as “grain” or “kernel” as used herein refers to a small embryonic plant enclosed in a covering called the seed coat (usually with some stored food), the product of the ripened ovule of gymnosperm and angiosperm plants which occurs after fertilization and some growth within the mother plant.
- oil content refers to the amount of lipids in a given plant organ, either the seeds (seed oil content) or the vegetative portion of the plant (vegetative oil content) and is typically expressed as percentage of dry weight (10 % humidity of seeds) or wet weight (for vegetative portion).
- oil content is affected by intrinsic oil production of a tissue (e.g., seed, vegetative portion), as well as the mass or size of the oil-producing tissue per plant or per growth period.
- increase in oil content of the plant can be achieved by increasing the size/mass of a plant's tissue(s) which comprise oil per growth period.
- increased oil content of a plant can be achieved by increasing the yield, growth rate, biomass and vigor of the plant.
- plant biomass refers to the amount (e.g., measured in grams of air-dry tissue) of a tissue produced from the plant in a growing season, which could also determine or affect the plant yield or the yield per growing area.
- An increase in plant biomass can be in the whole plant or in parts thereof such as aboveground (harvestable) parts, vegetative biomass, roots and seeds.
- growth rate refers to the increase in plant organ/tissue size per time (can be measured in cm 2 per day).
- plant vigor refers to the amount (measured by weight) of tissue produced by the plant in a given time. Hence increased vigor could determine or affect the plant yield or the yield per growing time or growing area. In addition, early vigor (seed and/or seedling) results in improved field stand.
- a plant yield can be determined under stress (e.g., abiotic stress, nitrogen-limiting conditions) and/or non-stress (normal) conditions.
- stress conditions refers to the growth conditions (e.g., water, temperature, light-dark cycles, humidity, salt concentration, fertilizer concentration in soil, nutrient supply such as nitrogen, phosphorous and/or potassium), that do not significantly go beyond the everyday climatic and other abiotic conditions that plants may encounter, and which allow optimal growth, metabolism, reproduction and/or viability of a plant at any stage in its life cycle (e.g., in a crop plant from seed to a mature plant and back to seed again).
- non-stress conditions may include some mild variations from the optimal conditions (which vary from one type/species of a plant to another), such variations do not cause the plant to cease growing without the capacity to resume growth.
- abiotic stress refers to any adverse effect on metabolism, growth, reproduction and/or viability of a plant. Accordingly, abiotic stress can be induced by suboptimal environmental growth conditions such as, for example, salinity, water deprivation, flooding, freezing, low or high temperature, heavy metal toxicity, anaerobiosis, nutrient deficiency, atmospheric pollution or UV irradiation.
- suboptimal environmental growth conditions such as, for example, salinity, water deprivation, flooding, freezing, low or high temperature, heavy metal toxicity, anaerobiosis, nutrient deficiency, atmospheric pollution or UV irradiation.
- abiotic stress tolerance refers to the ability of a plant to endure an abiotic stress without suffering a substantial alteration in metabolism, growth, productivity and/or viability.
- water use efficiency refers to the level of organic matter produced per unit of water consumed by the plant, i.e., the dry weight of a plant in relation to the plant's water use, e.g., the biomass produced per unit transpiration.
- fertilizer use efficiency refers to the metabolic process(es) which lead to an increase in the plant's yield, biomass, vigor, and growth rate per fertilizer unit applied.
- the metabolic process can be the uptake, spread, absorbent, accumulation, relocation (within the plant) and use of one or more of the minerals and organic moieties absorbed by the plant, such as nitrogen, phosphates and/or potassium.
- fertilizer-limiting conditions refers to growth conditions which include a level (e.g., concentration) of a fertilizer applied which is below the level needed for normal plant metabolism, growth, reproduction and/or viability.
- nitrogen use efficiency refers to the metabolic process(es) which lead to an increase in the plant's yield, biomass, vigor, and growth rate per nitrogen unit applied.
- the metabolic process can be the uptake, spread, absorbent, accumulation, relocation (within the plant) and use of nitrogen absorbed by the plant.
- nitrogen-limiting conditions refers to growth conditions which include a level (e.g., concentration) of nitrogen (e.g., ammonium or nitrate) applied which is below the level needed for normal plant metabolism, growth, reproduction and/or viability.
- Improved plant NUE and FUE is translated in the field into either harvesting similar quantities of yield, while implementing less fertilizers, or increased yields gained by implementing the same levels of fertilizers.
- improved NUE or FUE has a direct effect on plant yield in the field.
- the polynucleotides and polypeptides of some embodiments of the invention positively affect plant yield, seed yield, and plant biomass.
- the benefit of improved plant NUE will certainly improve crop quality and biochemical constituents of the seed such as protein yield and oil yield.
- ABST will confer plants with improved vigor also under non-stress conditions, resulting in crops having improved biomass and/or yield e.g., elongated fibers for the cotton industry, higher oil content.
- fiber is usually inclusive of thick-walled conducting cells such as vessels and tracheids and to fibrillar aggregates of many individual fiber cells.
- fiber refers to (a) thick-walled conducting and non-conducting cells of the xylem; (b) fibers of extraxylary origin, including those from phloem, bark, ground tissue, and epidermis; and (c) fibers from stems, leaves, roots, seeds, and flowers or inflorescences (such as those of Sorghum vulgare used in the manufacture of brushes and brooms).
- fiber producing plant refers to plants that share the common feature of having an elongated shape and abundant cellulose in thick cell walls, typically termed as secondary walls. Such walls may or may not be lignif ⁇ ed, and the protoplast of such cells may or may be viable at maturity.
- Such fibers have many industrial uses, for example in lumber and manufactured wood products, paper, textiles, sacking and boxing material, cordage, brushes and brooms, filling and stuffing, caulking, reinforcement of other materials, and manufacture of cellulose derivatives.
- Example of fiber producing plants include, but are not limited to, agricultural crops such as cotton, silk cotton tree (Kapok, Ceiba pentandra), desert willow, creosote bush, winterfat, balsa, kenaf, roselle, jute, sisal abaca, flax, corn, sugar cane, hemp, ramie, kapok, coir, bamboo, Spanish moss and Agave spp. (e.g. sisal).
- the fiber producing plant is cotton.
- fiber quality refers to at least one fiber parameter which is agriculturally desired, or required in the fiber industry (further described hereinbelow).
- fiber parameters include but are not limited to, fiber length, fiber strength, fiber fitness, fiber weight per unit length, maturity ratio and uniformity.
- Cotton fiber (lint) quality is typically measured according to fiber length, strength and fineness. Accordingly, the lint quality is considered higher when the fiber is longer, stronger and finer.
- fiber yield refers to the amount or quantity of fibers produced from the fiber producing plant.
- increasing refers to at least about 2 %, at least about 3
- % at least about 4 %, at least about 5 %, at least about 10 %, at least about 15 %, at least about 20 %, at least about 30 %, at least about 40 %, at least about 50 %, at least about 60 %, at least about 70 %, at least about 80 % or greater increase in plant yield, biomass, growth rate, vigor, oil content, fiber yield, fiber quality, water use efficiency, nitrogen use efficiency, fertilizer use efficiency and/or abiotic stress tolerance as compared to a native plant [i.e., a plant not modified with the biomolecules
- polynucleotide or polypeptides of the invention, e.g., a non-transformed plant of the same species which is grown under the same growth conditions as the transformed plant].
- phrases "expressing within the plant an exogenous polynucleotide” as used herein refers to upregulating the expression level of an exogenous polynucleotide within the plant by introducing the exogenous polynucleotide into a plant cell or plant and expressing by recombinant means, as further described herein below.
- exogenous polynucleotide refers to a heterologous nucleic acid sequence which may not be naturally expressed within the plant or which overexpression in the plant is desired.
- the exogenous polynucleotide may be introduced into the plant in a stable or transient manner, so as to produce a ribonucleic acid (RNA) molecule and/or a polypeptide molecule.
- RNA ribonucleic acid
- exogenous polynucleotide may comprise a nucleic acid sequence which is identical or partially homologous to an endogenous nucleic acid sequence of the plant.
- the exogenous polynucleotide comprises a nucleic acid which is at least about 80 %, at least about 81 %, at least about 82 %, at least about 83 %, at least about 84 %, at least about 85 %, at least about 86 %, at least about 87 %, at least about 88 %, at least about 89 %, at least about 90 %, at least about 91 %, at least about 92 %, at least about 93 %, at least about 93 %, at least about 94 %, at least about 95 %, at least about 96 %, at least about 97 %, at least about 98 %, at least about 99 %, e.g., 100 % identical to the nucleic acid sequence selected from
- Identity e.g., percent homology
- NCBI National Center of Biotechnology Information
- the exogenous polynucleotide is at least about 80 %, at least about 81 %, at least about 82 %, at least about 83 %, at least about 84 %, at least about 85 %, at least about 86 %, at least about 87 %, at least about 88 %, at least about 89 %, at least about 90 %, at least about 91 %, at least about 92 %, at least about 93 %, at least about 93 %, at least about 94 %, at least about 95 %, at least about 96 %, at least about 97 %, at least about 98 %, at least about 99 %, e.g., 100 % identical to the polynucleotide selected from the group consisting of SEQ ID
- the exogenous polynucleotide consists of the nucleic acid sequence set forth in SEQ ID NO: 3487, 1-239, 467-1973, 3481-3486, 3488-3674, 3738 or 3739.
- polynucleotide refers to a single or double stranded nucleic acid sequence which is isolated and provided in the form of an RNA sequence, a complementary polynucleotide sequence (cDNA), a genomic polynucleotide sequence and/or a composite polynucleotide sequences (e.g., a combination of the above).
- isolated refers to at least partially separated from the natural environment e.g., from a plant cell.
- complementary polynucleotide sequence refers to a sequence, which results from reverse transcription of messenger RNA using a reverse transcriptase or any other RNA dependent DNA polymerase. Such a sequence can be subsequently amplified in vivo or in vitro using a DNA dependent DNA polymerase.
- genomic polynucleotide sequence refers to a sequence derived (isolated) from a chromosome and thus it represents a contiguous portion of a chromosome.
- composite polynucleotide sequence refers to a sequence, which is at least partially complementary and at least partially genomic.
- a composite sequence can include some exonal sequences required to encode the polypeptide of the present invention, as well as some intronic sequences interposing therebetween.
- the intronic sequences can be of any source, including of other genes, and typically will include conserved splicing signal sequences. Such intronic sequences may further include cis acting expression regulatory elements.
- the exogenous polynucleotide of the invention encodes a polypeptide which comprises an amino acid sequence at least about 80 %, at least about 81 %, at least about 82 %, at least about 83 %, at least about 84 %, at least about 85 %, at least about 86 %, at least about 87 %, at least about 88 %, at least about 89 %, at least about 90 %, at least about 91 %, at least about 92 %, at least about 93 %, at least about 94 %, at least about 95 %, at least about 96 %, at least about 97 %, at least about 98 %, at least about 99 %, or more say 100 % homologous to the amino acid sequence selected from the group consisting of SEQ ID NOs: 246, 240-245,
- Homology can be determined using any homology comparison software, including for example, the BlastP or TBLASTN software of the National Center of Biotechnology Information (NCBI) such as by using default parameters, when starting from a polypeptide sequence; or the tBLASTX algorithm (available via the NCBI) such as by using default parameters, which compares the six- frame conceptual translation products of a nucleotide query sequence (both strands) against a protein sequence database.
- Homologous sequences include both orthologous and paralogous sequences.
- paralogous relates to gene-duplications within the genome of a species leading to paralogous genes.
- orthologous relates to homologous genes in different organisms due to ancestral relationship.
- One option to identify orthologues in plant species is by performing a reciprocal blast search. This may be done by a first blast involving blasting the sequence-of-interest against any sequence database, such as the publicly available NCBI database which may be found at: Hypertext Transfer Protocol ://World Wide Web (dot) ncbi (dot) nlm (dot) nih (dot) gov. If orthologues in rice were sought, the sequence-of-interest would be blasted against, for example, the 28,469 full-length cDNA clones from Oryza sativa Nipponbare available at NCBI. The blast results may be filtered.
- the ClustalW program may be used [Hypertext Transfer Protocol ://World Wide Web (dot) ebi (dot) ac (dot) uk/Tools/clustalw2/index (dot) html], followed by a neighbor-joining tree (Hypertext Transfer Protocol://en (dot) wikipedia (dot) org/wiki/Neighbor-joining) which helps visualizing the clustering.
- the exogenous polynucleotide encodes a polypeptide consisting of the amino acid sequence set forth by SEQ ID NO: 246, 240-245, 247-465, 1974-3480, 3675-3736 or 3737.
- Nucleic acid sequences encoding the polypeptides of the present invention may be optimized for expression. Examples of such sequence modifications include, but are not limited to, an altered G/C content to more closely approach that typically found in the plant species of interest, and the removal of codons atypically found in the plant species commonly referred to as codon optimization.
- an optimized gene or nucleic acid sequence refers to a gene in which the nucleotide sequence of a native or naturally occurring gene has been modified in order to utilize statistically-preferred or statistically-favored codons within the plant.
- the nucleotide sequence typically is examined at the DNA level and the coding region optimized for expression in the plant species determined using any suitable procedure, for example as described in Sardana et al. (1996, Plant Cell Reports 15:677-681).
- the standard deviation of codon usage a measure of codon usage bias
- the standard deviation of codon usage may be calculated by first finding the squared proportional deviation of usage of each codon of the native gene relative to that of highly expressed plant genes, followed by a calculation of the average squared deviation.
- the formula used is:
- Xn refers to the frequency of usage of codon n in highly expressed plant genes
- Yn to the frequency of usage of codon n in the gene of interest
- N refers to the total number of codons in the gene of interest.
- One method of optimizing the nucleic acid sequence in accordance with the preferred codon usage for a particular plant cell type is based on the direct use, without performing any extra statistical calculations, of codon optimization Tables such as those provided on-line at the Codon Usage Database through the NIAS (National Institute of Agrobiological Sciences) DNA bank in Japan (Hypertext Transfer Protocol ://World
- the Codon Usage Database contains codon usage tables for a number of different species, with each codon usage Table having been statistically determined based on the data present in Genbank.
- codon usage tables for a particular species (for example, rice)
- a naturally- occurring nucleotide sequence encoding a protein of interest can be codon optimized for that particular plant species. This is effected by replacing codons that may have a low statistical incidence in the particular species genome with corresponding codons, in regard to an amino acid, that are statistically more favored.
- one or more less- favored codons may be selected to delete existing restriction sites, to create new ones at potentially useful junctions (5' and 3' ends to add signal peptide or termination cassettes, internal sites that might be used to cut and splice segments together to produce a correct full-length sequence), or to eliminate nucleotide sequences that may negatively effect mRNA stability or expression.
- codon optimization of the native nucleotide sequence may comprise determining which codons, within the native nucleotide sequence, are not statistically-favored with regards to a particular plant, and modifying these codons in accordance with a codon usage table of the particular plant to produce a codon optimized derivative.
- a modified nucleotide sequence may be fully or partially optimized for plant codon usage provided that the protein encoded by the modified nucleotide sequence is produced at a level higher than the protein encoded by the corresponding naturally occurring or native gene. Construction of synthetic genes by altering the codon usage is described in for example PCT Patent Application 93/07278.
- the exogenous polynucleotide is a non-coding RNA.
- a non-coding RNA refers to an RNA molecule which does not encode an amino acid sequence (a polypeptide). Examples of such non-coding RNA molecules include, but are not limited to, an antisense RNA, a pre-miRNA
- RNA precursor of a microRNA
- piRNA Piwi-interacting RNA
- Non-limiting examples of non-coding RNA polynucleotides are provided in SEQ ID NOs:37 and 43.
- the invention encompasses nucleic acid sequences described hereinabove; fragments thereof, sequences hybridizable therewith, sequences homologous thereto, sequences encoding similar polypeptides with different codon usage, altered sequences characterized by mutations, such as deletion, insertion or substitution of one or more nucleotides, either naturally occurring or man induced, either randomly or in a targeted fashion.
- the invention provides an isolated polynucleotide comprising a nucleic acid sequence which is at least about 80 %, at least about 81 %, at least about 82 %, at least about 83 %, at least about 84 %, at least about 85 %, at least about 86 %, at least about 87 %, at least about 88 %, at least about 89 %, at least about 90 %, at least about 91 %, at least about 92 %, at least about 93 %, at least about 93 %, at least about 94 %, at least about 95 %, at least about 96 %, at least about 97 %, at least about 98 %, at least about 99 %, e.g., 100 % identical to the polynucleotide selected from the group consisting of SEQ ID NOs: 3487, 1-239, 467-1973, 3481-3486, 3488-3674, and 3738-3739.
- the nucleic acid sequence is capable of increasing yield, biomass, growth rate, vigor, oil content, fiber yield, fiber quality, water use efficiency, nitrogen use efficiency, fertilizer use efficiency and/or abiotic stress tolerance of a plant.
- the isolated polynucleotide consists of a nucleic acid sequence which is at least about 80 %, at least about 81 %, at least about 82 %, at least about 83 %, at least about 84 %, at least about 85 %, at least about 86 %, at least about 87 %, at least about 88 %, at least about 89 %, at least about 90 %, at least about 91 %, at least about 92 %, at least about 93 %, at least about 93 %, at least about 94 %, at least about 95 %, at least about 96 %, at least about 97 %, at least about 98 %, at least about 99 %, e.g., 100 % identical to the polynucleotide selected from the group consisting of SEQ ID NOs: 3487, 1-239, 467-1973, 3481-3486, 3488- 3674, and 3738-3739.
- the isolated polynucleotide comprising the nucleic acid sequence selected from the group consisting of SEQ ID NOs: 3487, 1-239, 467-1973, 3481-3486, 3488-3674, and 3738-3739.
- the isolated polynucleotide is set forth by SEQ ID NO: 3487, 1-239, 467-1973, 3481-3486, 3488-3674, 3738 or 3739.
- the isolated polynucleotide consists of a nucleic acid sequence selected from the group of SEQ ID NOs: 3487, 1- 239, 467-1973, 3481-3486, 3488-3674, and 3738-3739.
- the invention provides an isolated polynucleotide comprising a nucleic acid sequence encoding a polypeptide which comprises an amino acid sequence at least about 80 %, at least about 81 %, at least about 82 %, at least about 83 %, at least about
- the amino acid sequence is capable of increasing yield, biomass, growth rate, vigor, oil content, fiber yield, fiber quality, water use efficiency, nitrogen use efficiency, fertilizer use efficiency and/or abiotic stress tolerance of a plant.
- the invention provides an isolated polynucleotide comprising a nucleic acid sequence encoding a polypeptide which comprises the amino acid sequence selected from the group consisting of SEQ ID NOs: 246, 240-245, 247-465, 1974-3480, and 3675-3737.
- the invention provides an isolated polypeptide having an amino acid sequence at least about 80 %, at least about 81 %, at least about 82 %, at least about 83 %, at least about 84 %, at least about 85 %, at least about 86 %, at least about 87 %, at least about 88 %, at least about 89 %, at least about 90 %, at least about 91 %, at least about 92 %, at least about 93 %, at least about 93 %, at least about 94 %, at least about 95 %, at least about 96 %, at least about 97 %, at least about 98 %, at least about 99 %, or more say 100 % homologous to an amino acid sequence selected from the group consisting of
- the isolated polypeptide is selected from the group consisting of SEQ ID NOs: 246, 240-245, 247-465, 1974-3480, and 3675-3737.
- the invention also encompasses fragments of the above described polypeptides and polypeptides having mutations, such as deletions, insertions or substitutions of one or more amino acids, either naturally occurring or man induced, either randomly or in a targeted fashion.
- the term '"plant” as used herein encompasses whole plants, ancestors and progeny of the plants and plant parts, including seeds, shoots, stems, roots (including tubers), and plant cells, tissues and organs.
- the plant may be in any form including suspension cultures, embryos, meristematic regions, callus tissue, leaves, gametophytes, sporophytes, pollen, and microspores.
- Plants that are particularly useful in the methods of the invention include all plants which belong to the superfamily Viridiplantae, in particular monocotyledonous and dicotyledonous plants including a fodder or forage legume, ornamental plant, food crop, tree, or shrub selected from the list comprising Acacia spp., Acer spp., Actinidia spp., Aesculus spp., Agathis australis, Albizia amara, Alsophila tricolor, Andropogon spp., Arachis spp, Areca catechu, Astelia fragrans, Astragalus cicer, Baikiaea plurijuga, Betula spp., Brassica spp., Bruguiera gymnorrhiza, Burkea africana, Butea frondosa, Cadaba farinosa, Calliandra spp, Camellia sinensis, Canna indica, Capsicum spp., Cassia spp., Centroe
- the plant used by the method of the invention is a crop plant such as rice, maize, wheat, barley, peanut, potato, sesame, olive tree, palm oil, banana, soybean, sunflower, canola, sugarcane, alfalfa, millet, leguminosae (bean, pea), flax, lupinus, rapeseed, tobacco, poplar, cotton and sorghum.
- a crop plant such as rice, maize, wheat, barley, peanut, potato, sesame, olive tree, palm oil, banana, soybean, sunflower, canola, sugarcane, alfalfa, millet, leguminosae (bean, pea), flax, lupinus, rapeseed, tobacco, poplar, cotton and sorghum.
- a plant cell exogenously expressing the polynucleotide of some embodiments of the invention, the nucleic acid construct of some embodiments of the invention and/or the polypeptide of some embodiments of the invention is effected by transforming one or more cells of the plant with the exogenous polynucleotide, followed by generating a mature plant from the transformed cells and cultivating the mature plant under conditions suitable for expressing the exogenous polynucleotide within the mature plant.
- the transformation is effected by introducing to the plant cell a nucleic acid construct which includes the exogenous polynucleotide of some embodiments of the invention and at least one promoter capable of directing transcription of the exogenous polynucleotide in the plant cell. Further details of suitable transformation approaches are provided herein below.
- nucleic acid construct comprising the isolated polynucleotide of the invention, and a promoter for directing transcription of the nucleic acid sequence of the isolated polynucleotide in a host cell.
- the isolated polynucleotide is operably linked to the promoter sequence.
- a coding nucleic acid sequence is "operably linked" to a regulatory sequence (e.g., promoter) if the regulatory sequence is capable of exerting a regulatory effect on the coding sequence linked thereto.
- a regulatory sequence e.g., promoter
- promoter refers to a region of DNA which lies upstream of the transcriptional initiation site of a gene to which RNA polymerase binds to initiate transcription of RNA. The promoter controls where (e.g., which portion of a plant) and/or when (e.g., at which stage or condition in the lifetime of an organism) the gene is expressed. Any suitable promoter sequence can be used by the nucleic acid construct of the present invention. According to some embodiments of the invention, the promoter is a constitutive promoter, a tissue-specific, or an abiotic stress-inducible promoter.
- Suitable constitutive promoters include, for example, CaMV 35S promoter (SEQ ID NO:4196; Odell et al, Nature 313:810-812, 1985); Arabidopsis At6669 promoter (SEQ ID NO:4195; see PCT Publication No. WO04081173A2); Arabidopsis new At6669 promoter (SEQ ID NO:4198); maize Ubi 1 (Christensen et al., Plant Sol. Biol. 18:675-689, 1992); rice actin (McElroy et al., Plant Cell 2:163-171, 1990); pEMU (Last et al, Theor. Appl. Genet.
- CaMV 35S promoter SEQ ID NO:4196; Odell et al, Nature 313:810-812, 1985
- Arabidopsis At6669 promoter SEQ ID NO:4195; see PCT Publication No. WO04081173A2
- tissue-specific promoters include, but not limited to, leaf-specific promoters [such as described, for example, by Yamamoto et al., Plant J. 12:255-265, 1997; Kwon et al., Plant Physiol. 105:357-67, 1994; Yamamoto et al., Plant Cell Physiol. 35:773-778, 1994; Gotor et al., Plant J. 3:509-18, 1993; Orozco et al., Plant MoI. Biol. 23:1129-1138, 1993; and Matsuoka et al., Proc. Natl. Acad. Sci.
- seed-preferred promoters e.g., from seed specific genes (Simon, et al., Plant MoI. Biol. 5. 191, 1985; Scofield, et al., J. Biol. Chem. 262: 12202, 1987; Baszczynski, et al., Plant MoI. Biol. 14: 633, 1990), Brazil Nut albumin (Pearson' et al., Plant MoI. Biol. 18: 235- 245, 1992), legumin (Ellis, et al. Plant MoI. Biol. 10: 203-214, 1988), Glutelin (rice) (Takaiwa, et al., MoI. Gen. Genet.
- endosperm specific promoters e.g., wheat LMW and HMW, glutenin-1 (MoI Gen Genet 216:81-90, 1989; NAR 17:461-2), wheat a, b and g gliadins (EMBO3: 1409-15, 1984), Barley ltrl promoter, barley Bl, C, D hordein (Theor Appl Gen 98:1253-62, 1999; Plant J 4:343-55, 1993; MoI Gen Genet 250:750- 60, 1996), Barley DOF (Mena et al., The Plant Journal, 116(1): 53- 62, 1998), Biz2 (EP99106056.7), Synthetic promoter (Vicente-Carbajosa et al., Plant J.
- Suitable abiotic stress-inducible promoters include, but not limited to, salt- inducible promoters such as RD29A (Yamaguchi-Shinozalei et al., MoI. Gen. Genet. 236:331-340, 1993); drought-inducible promoters such as maize rabl7 gene promoter (PIa et al., Plant MoI. Biol. 21 :259-266, 1993), maize rab28 gene promoter (Busk et al., Plant J. 11 :1285-1295, 1997) and maize Ivr2 gene promoter (Pelleschi et al., Plant MoI. Biol. 39:373-380, 1999); heat-inducible promoters such as heat tomato hsp80-promoter from tomato (U.S. Pat. No. 5,187,267).
- salt- inducible promoters such as RD29A (Yamaguchi-Shinozalei et al., MoI.
- the nucleic acid construct of some embodiments of the invention can further include an appropriate selectable marker and/or an origin of replication.
- the nucleic acid construct utilized is a shuttle vector, which can propagate both in E. coli (wherein the construct comprises an appropriate selectable marker and origin of replication) and be compatible with propagation in cells.
- the construct according to some embodiments of the invention can be, for example, a plasmid, a bacmid, a phagemid, a cosmid, a phage, a virus or an artificial chromosome.
- the nucleic acid construct of some embodiments of the invention can be utilized to stably or transiently transform plant cells.
- stable transformation the exogenous polynucleotide is integrated into the plant genome and as such it represents a stable and inherited trait.
- transient transformation the exogenous polynucleotide is expressed by the cell transformed but it is not integrated into the genome and as such it represents a transient trait.
- Agrobacterium-mediated gene transfer e.g., T-DNA using
- Agrobacterium tumefaciens or Agrobacterium rhizogenes see for example, Klee et al. (1987) Annu. Rev. Plant Physiol. 38:467-486; Klee and Rogers in Cell Culture and Somatic Cell Genetics of Plants, Vol. 6, Molecular Biology of Plant Nuclear Genes, eds. Schell, J., and Vasil, L. K., Academic Publishers, San Diego, Calif. (1989) p. 2- 25; Gatenby, in Plant Biotechnology, eds. Kung, S, and Arntzen, C. J., Butterworth Publishers, Boston, Mass. (1989) p. 93-112.
- the Agrobacterium system includes the use of plasmid vectors that contain defined DNA segments that integrate into the plant genomic DNA. Methods of inoculation of the plant tissue vary depending upon the plant species and the Agrobacterium delivery system. A widely used approach is the leaf disc procedure which can be performed with any tissue explant that provides a good source for initiation of whole plant differentiation. See, e.g., Horsch et al. in Plant Molecular Biology Manual A5, Kluwer Academic Publishers, Dordrecht (1988) p. 1-9. A supplementary approach employs the Agrobacterium delivery system in combination with vacuum infiltration. The Agrobacterium system is especially viable in the creation of transgenic dicotyledonous plants.
- DNA transfer into plant cells There are various methods of direct DNA transfer into plant cells.
- electroporation the protoplasts are briefly exposed to a strong electric field.
- microinjection the DNA is mechanically injected directly into the cells using very small micropipettes.
- microparticle bombardment the DNA is adsorbed on microprojectiles such as magnesium sulfate crystals or tungsten particles, and the microprojectiles are physically accelerated into cells or plant tissues.
- Micropropagation is a process of growing new generation plants from a single piece of tissue that has been excised from a selected parent plant or cultivar. This process permits the mass reproduction of plants having the preferred tissue expressing the fusion protein.
- the new generation plants which are produced are genetically identical to, and have all of the characteristics of, the original plant.
- Micropropagation allows mass production of quality plant material in a short period of time and offers a rapid multiplication of selected cultivars in the preservation of the characteristics of the original transgenic or transformed plant.
- the advantages of cloning plants are the speed of plant multiplication and the quality and uniformity of plants produced.
- Micropropagation is a multi-stage procedure that requires alteration of culture medium or growth conditions between stages.
- the micropropagation process involves four basic stages: Stage one, initial tissue culturing; stage two, tissue culture multiplication; stage three, differentiation and plant formation; and stage four, greenhouse culturing and hardening.
- stage one initial tissue culturing
- stage two tissue culture multiplication
- stage three differentiation and plant formation
- stage four greenhouse culturing and hardening.
- stage one initial tissue culturing
- the tissue culture is established and certified contaminant- free.
- stage two the initial tissue culture is multiplied until a sufficient number of tissue samples are produced to meet production goals.
- stage three the tissue samples grown in stage two are divided and grown into individual plantlets.
- the transformed plantlets are transferred to a greenhouse for hardening where the plants' tolerance to light is gradually increased so that it can be grown in the natural environment.
- the transgenic plants are generated by transient transformation of leaf cells, meristematic cells or the whole plant.
- Transient transformation can be effected by any of the direct DNA transfer methods described above or by viral infection using modified plant viruses.
- Viruses that have been shown to be useful for the transformation of plant hosts include CaMV, Tobacco mosaic virus (TMV), brome mosaic virus (BMV) and Bean Common Mosaic Virus (BV or BCMV). Transformation of plants using plant viruses is described in U.S. Pat. No. 4,855,237 (bean golden mosaic virus; BGV), EP-A 67,553 (TMV), Japanese Published Application No. 63-14693 (TMV), EPA 194,809 (BV), EPA 278,667 (BV); and Gluzman, Y. et al., Communications in Molecular Biology: Viral Vectors, Cold Spring Harbor Laboratory, New York, pp. 172-189 (1988).
- TMV Tobacco mosaic virus
- BMV brome mosaic virus
- BV or BCMV Bean Common Mosaic Virus Transformation of plants using plant viruses is described in U.S. Pat. No. 4,855,237 (bean golden mosaic virus; BGV), EP-A 67,553 (TMV), Japanese Published Application No. 63-
- the virus used for transient transformations is avirulent and thus is incapable of causing severe symptoms such as reduced growth rate, mosaic, ring spots, leaf roll, yellowing, streaking, pox formation, tumor formation and pitting.
- a suitable avirulent virus may be a naturally occurring avirulent virus or an artificially attenuated virus.
- Virus attenuation may be effected by using methods well known in the art including, but not limited to, sub-lethal heating, chemical treatment or by directed mutagenesis techniques such as described, for example, by Kurihara and Watanabe (Molecular Plant Pathology 4:259-269, 2003), Galon et al. (1992), Atreya et al. (1992) and Huet et al. (1994).
- Suitable virus strains can be obtained from available sources such as, for example, the American Type culture Collection (ATCC) or by isolation from infected plants. Isolation of viruses from infected plant tissues can be effected by techniques well known in the art such as described, for example by Foster and Tatlor, Eds. "Plant Virology Protocols: From Virus Isolation to Transgenic Resistance (Methods in Molecular Biology (Humana Pr), VoI 81)", Humana Press, 1998. Briefly, tissues of an infected plant believed to contain a high concentration of a suitable virus, preferably young leaves and flower petals, are ground in a buffer solution (e.g., phosphate buffer solution) to produce a virus infected sap which can be used in subsequent inoculations.
- a buffer solution e.g., phosphate buffer solution
- the virus When the virus is a DNA virus, suitable modifications can be made to the virus itself. Alternatively, the virus can first be cloned into a bacterial plasmid for ease of constructing the desired viral vector with the foreign DNA. The virus can then be excised from the plasmid. If the virus is a DNA virus, a bacterial origin of replication can be attached to the viral DNA, which is then replicated by the bacteria. Transcription and translation of this DNA will produce the coat protein which will encapsidate the viral DNA. If the virus is an RNA virus, the virus is generally cloned as a cDNA and inserted into a plasmid. The plasmid is then used to make all of the constructions. The RNA virus is then produced by transcribing the viral sequence of the plasmid and translation of the viral genes to produce the coat protein(s) which encapsidate the viral RNA.
- a plant viral polynucleotide in which the native coat protein coding sequence has been deleted from a viral polynucleotide, a non-native plant viral coat protein coding sequence and a non-native promoter, preferably the subgenomic promoter of the non-native coat protein coding sequence, capable of expression in the plant host, packaging of the recombinant plant viral polynucleotide, and ensuring a systemic infection of the host by the recombinant plant viral polynucleotide, has been inserted.
- the coat protein gene may be inactivated by insertion of the non-native polynucleotide sequence within it, such that a protein is produced.
- the recombinant plant viral polynucleotide may contain one or more additional non-native subgenomic promoters.
- Each non-native subgenomic promoter is capable of transcribing or expressing adjacent genes or polynucleotide sequences in the plant host and incapable of recombination with each other and with native subgenomic promoters.
- Non-native (foreign) polynucleotide sequences may be inserted adjacent the native plant viral subgenomic promoter or the native and a non- native plant viral subgenomic promoters if more than one polynucleotide sequence is included.
- the non-native polynucleotide sequences are transcribed or expressed in the host plant under control of the subgenomic promoter to produce the desired products.
- a recombinant plant viral polynucleotide is provided as in the first embodiment except that the native coat protein coding sequence is placed adjacent one of the non-native coat protein subgenomic promoters instead of a non- native coat protein coding sequence.
- a recombinant plant viral polynucleotide in which the native coat protein gene is adjacent its subgenomic promoter and one or more non-native subgenomic promoters have been inserted into the viral polynucleotide.
- the inserted non-native subgenomic promoters are capable of transcribing or expressing adjacent genes in a plant host and are incapable of recombination with each other and with native subgenomic promoters.
- Non-native polynucleotide sequences may be inserted adjacent the non-native subgenomic plant viral promoters such that the sequences are transcribed or expressed in the host plant under control of the subgenomic promoters to produce the desired product.
- a recombinant plant viral polynucleotide is provided as in the third embodiment except that the native coat protein coding sequence is replaced by a non-native coat protein coding sequence.
- the viral vectors are encapsidated by the coat proteins encoded by the recombinant plant viral polynucleotide to produce a recombinant plant virus.
- the recombinant plant viral polynucleotide or recombinant plant virus is used to infect appropriate host plants.
- the recombinant plant viral polynucleotide is capable of replication in the host, systemic spread in the host, and transcription or expression of foreign gene(s) (exogenous polynucleotide) in the host to produce the desired protein.
- the polynucleotide of the present invention can also be introduced into a chloroplast genome thereby enabling chloroplast expression.
- a technique for introducing exogenous polynucleotide sequences to the genome of the chloroplasts involves the following procedures. First, plant cells are chemically treated so as to reduce the number of chloroplasts per cell to about one. Then, the exogenous polynucleotide is introduced via particle bombardment into the cells with the aim of introducing at least one exogenous polynucleotide molecule into the chloroplasts. The exogenous polynucleotide is selected such that it is integratable into the chloroplast's genome via homologous recombination which is readily effected by enzymes inherent to the chloroplast.
- the exogenous polynucleotide includes, in addition to a gene of interest, at least one polynucleotide stretch which is derived from the chloroplast's genome.
- the exogenous polynucleotide includes a selectable marker, which serves by sequential selection procedures to ascertain that all or substantially all of the copies of the chloroplast genomes following such selection will include the exogenous polynucleotide. Further details relating to this technique are found in U.S. Pat. Nos. 4,945,050; and 5,693,507 which are incorporated herein by reference.
- a polypeptide can thus be produced by the protein expression system of the chloroplast and become integrated into the chloroplast's inner membrane.
- fiber yield and/or quality, water use efficiency, fertilizer use efficiency, nitrogen use efficiency and/or abiotic stress tolerance in plants can involve multiple genes acting additively or in synergy (see, for example, in Quesda et al., Plant Physiol. 130:951-063, 2002), the invention also envisages expressing a plurality of exogenous polynucleotides in a single host plant to thereby achieve superior effect on yield, fiber yield and/or quality, water use efficiency, fertilizer use efficiency, nitrogen use efficiency and/or abiotic stress tolerance.
- Expressing a plurality of exogenous polynucleotides in a single host plant can be effected by co-introducing multiple nucleic acid constructs, each including a different exogenous polynucleotide, into a single plant cell.
- the transformed cell can then be regenerated into a mature plant using the methods described hereinabove.
- expressing a plurality of exogenous polynucleotides in a single host plant can be effected by co-introducing into a single plant-cell a single nucleic-acid construct including a plurality of different exogenous polynucleotides.
- Such a construct can be designed with a single promoter sequence which can transcribe a polycistronic messenger RNA including all the different exogenous polynucleotide sequences.
- the polynucleotide sequences can be inter-linked via an internal ribosome entry site (IRES) sequence which facilitates translation of polynucleotide sequences positioned downstream of the IRES sequence.
- IRES internal ribosome entry site
- a transcribed polycistronic RNA molecule encoding the different polypeptides described above will be translated from both the capped 5' end and the two internal IRES sequences of the polycistronic RNA molecule to thereby produce in the cell all different polypeptides.
- the construct can include several promoter sequences each linked to a different exogenous polynucleotide sequence.
- the plant cell transformed with the construct including a plurality of different exogenous polynucleotides can be regenerated into a mature plant, using the methods described hereinabove.
- expressing a plurality of exogenous polynucleotides can be effected by introducing different nucleic acid constructs, including different exogenous polynucleotides, into a plurality of plants.
- the regenerated transformed plants can then be cross-bred and resultant progeny selected for superior yield (e.g., growth rate, biomass, vigor, oil content), fiber yield and/or quality, water use efficiency, fertilizer use efficiency, nitrogen use efficiency and/or abiotic stress tolerance traits, using conventional plant breeding techniques.
- the plant expressing the exogenous polynucleotide(s) is grown under non-stress or normal conditions (e.g., biotic conditions and/or conditions with sufficient water, nutrients such as nitrogen and fertilizer).
- non-stress or normal conditions e.g., biotic conditions and/or conditions with sufficient water, nutrients such as nitrogen and fertilizer.
- the method further comprising growing the plant expressing the exogenous polynucleotide under the abiotic stress.
- abiotic stress conditions include, salinity, drought, water deprivation, excess of water (e.g., flood, waterlogging), etiolation, low temperature, high temperature, heavy metal toxicity, anaerobiosis, nutrient deficiency, nutrient excess, atmospheric pollution and UV irradiation.
- the invention encompasses plants exogenously expressing the polynucleotide(s), the nucleic acid constructs and/or polypeptide(s) of the invention.
- the level of the polypeptide encoded by the exogenous polynucleotide can be determined by methods well known in the art such as, activity assays, Western blots using antibodies capable of specifically binding the polypeptide, Enzyme-Linked Immuno Sorbent Assay (ELISA), radio- immuno-assays (RIA), immunohistochemistry, immunocytochemistry, immunofluorescence and the like.
- RNA-m situ hybridization Methods of determining the level in the plant of the RNA transcribed from the exogenous polynucleotide are well known in the art and include, for example, Northern blot analysis, reverse transcription polymerase chain reaction (RT-PCR) analysis (including quantitative, semi-quantitative or real-time RT-PCR) and RNA-m situ hybridization.
- RT-PCR reverse transcription polymerase chain reaction
- sub-sequence data of those polynucleotides described above can be used as markers for marker assisted selection (MAS), in which a marker is used for indirect selection of a genetic determinant or determinants of a trait of interest (e.g., biomass, growth rate, oil content, fiber yield and/or quality, yield, abiotic stress tolerance, water use efficiency, nitrogen use efficiency and/or fertilizer use efficiency).
- MAS marker assisted selection
- Nucleic acid data of the present teachings may contain or be linked to polymorphic sites or genetic markers on the genome such as restriction fragment length polymorphism (RFLP), microsatellites and single nucleotide polymorphism (SNP), DNA fingerprinting (DFP), amplified fragment length polymorphism (AFLP), expression level polymorphism, polymorphism of the encoded polypeptide and any other polymorphism at the DNA or
- RFLP restriction fragment length polymorphism
- SNP single nucleotide polymorphism
- DFP DNA fingerprinting
- AFLP amplified fragment length polymorphism
- expression level polymorphism polymorphism of the encoded polypeptide and any other polymorphism at the DNA or
- marker assisted selections include, but are not limited to, selection for a morphological trait (e.g., a gene that affects form, coloration, male sterility or resistance such as the presence or absence of awn, leaf sheath coloration, height, grain color, aroma of rice); selection for a biochemical trait (e.g., a gene that encodes a protein that can be extracted and observed; for example, isozymes and storage proteins); selection for a biological trait (e.g., pathogen races or insect biotypes based on host pathogen or host parasite interaction can be used as a marker since the genetic constitution of an organism can affect its susceptibility to pathogens or parasites).
- a morphological trait e.g., a gene that affects form, coloration, male sterility or resistance such as the presence or absence of awn, leaf sheath coloration, height, grain color, aroma of rice
- selection for a biochemical trait e.g., a gene that encodes a protein that
- polynucleotides and polypeptides described hereinabove can be used in a wide range of economical plants, in a safe and cost effective manner.
- Plant lines exogenously expressing the polynucleotide or the polypeptide of the invention can be screened to identify those that show the greatest increase of the desired plant trait.
- transgene the exogenous polynucleotide encoding the polypeptide
- abiotic stress tolerance can be determined using known methods such as detailed below and in the Examples section which follows.
- Plant's growth rate, biomass, yield and/or vigor - Plant vigor can be calculated by the increase in growth parameters such as leaf area, fiber length, rosette diameter, plant fresh weight and the like per time.
- the growth rate can be measured using digital analysis of growing plants. For example, images of plants growing in greenhouse on plot basis can be captured every 3 days and the rosette area can be calculated by digital analysis. Rosette area growth is calculated using the difference of rosette area between days of sampling divided by the difference in days between samples.
- Evaluation of growth rate can be also done by measuring plant biomass produced, rosette area, leaf size or root length per time (can be measured in cm 2 per day of leaf area). Relative growth area can be calculated using Formula II.
- Relative growth rate area Regression coefficient of area along time course
- the relative growth area rate is in units of I/day and length growth rate is in units of I/day.
- Seed yield - Evaluation of the seed yield per plant can be done by measuring the amount (weight or size) or quantity ⁇ i.e., number) of dry seeds produced and harvested from 8-16 plants and divided by the number of plants.
- the total seeds from 8-16 plants can be collected, weighted using e.g., an analytical balance and the total weight can be divided by the number of plants.
- Seed yield per growing area can be calculated in the same manner while taking into account the growing area given to a single plant. Increase seed yield per growing area could be achieved by increasing seed yield per plant, and/or by increasing number of plants capable of growing in a given area.
- Seed yield can be expressed as thousand kernel weight (1000-weight), which is extrapolated from the number of filled seeds counted and their total weight.
- 1000-weight may result from an increased seed size and/or seed weight (e.g., increase in embryo size and/or endosperm size).
- the weight of 1000 seeds can be determined as follows: seeds are scattered on a glass tray and a picture is taken. Each sample is weighted and then using the digital analysis, the number of seeds in each sample is calculated.
- the 1000 seeds weight can be calculated using formula III: Formula III:
- Seed Weight number of seed in sample/ sample weight X 1000
- the Harvest Index can be calculated using Formula IV
- Harvest Index Average seed yield per plant/ Average dry weight Since the transgenic plants of the invention have increased yield, it is likely that these plants exhibit an increased growth rate (during at least part of their life cycle), relative to the growth rate of corresponding wild type plants at a corresponding stage in their life cycle.
- the increased growth rate may be specific to one or more parts of a plant (including seeds), or may be throughout substantially the whole plant.
- a plant having an increased growth rate may also exhibit early flowering. Increased growth rate during the early stages in the life cycle of a plant may reflect enhanced vigor. The increase in growth rate may alter the harvest cycle (early maturing) of a plant allowing plants to be sown later and/or harvested sooner than would otherwise be possible.
- the growth rate is sufficiently increased, it may allow for the sowing of further seeds of the same plant species (for example sowing and harvesting of rice plants followed by sowing and harvesting of further rice plants all within one conventional growing period). Similarly, if the growth rate is sufficiently increased, it may allow for the sowing of further seeds of different plants species (for example the sowing and harvesting of rice plants followed by, for example, the sowing and optional harvesting of soybean, potato or any other suitable plant). Harvesting additional times from the same rootstock in the case of some plants may also be possible. Altering the harvest cycle of a plant may lead to an increase in annual biomass production per area (due to an increase in the number of times (say in a year) that any particular plant may be grown and harvested).
- An increase in growth rate may also allow for the cultivation of transgenic plants in a wider geographical area than their wild-type counterparts, since the territorial limitations for growing a crop are often determined by adverse environmental conditions either at the time of planting (early season) or at the time of harvesting (late season). Such adverse conditions may be avoided if the harvest cycle is shortened.
- the growth rate may be determined by deriving various parameters from growth curves, such parameters may be: T-Mid (the time taken for plants to reach 50% of their maximal size) and T-90 (time taken for plants to reach 90% of their maximal size).
- increased yield of corn may be manifested as one or more of the following: increase in the number of plants per growing area, increase in the number of ears per plant, increase in the number of rows per ear, number of kernels per ear row, kernel weight, thousand kernel weight (1000- weight), ear length/diameter, increase oil content per kernel and increase starch content per kernel.
- increased yield of rice can be manifested by an increase in one or more of the following: number of plants per growing area, number of panicles per plant, number of spikelets per panicle, number of flowers per panicle, increase in the seed filling rate, increase in thousand kernel weight (1000-weight), increase oil content per seed, increase starch content per seed, among others.
- An increase in yield may also result in modified architecture, or may occur because of modified architecture.
- increased yield of soybean may be manifested by an increase in one or more of the following: number of plants per growing area, number of pods per plant, number of seeds per pod, increase in the seed filling rate, increase in thousand seed weight (1000-weight), reduce pod shattering, increase oil content per seed, increase protein content per seed, among others.
- An increase in yield may also result in modified architecture, or may occur because of modified architecture.
- Increased yield of canola may be manifested by an increase in one or more of the following: number of plants per growing area, number of pods per plant, number of seeds per pod, increase in the seed filling rate, increase in thousand seed weight (1000- weight), reduce pod shattering, increase oil content per seed, among others.
- An increase in yield may also result in modified architecture, or may occur because of modified architecture.
- Increased yield of cotton may be manifested by an increase in one or more of the following: number of plants per growing area, number of bolls per plant, number of seeds per boll, increase in the seed filling rate, increase in thousand seed weight (1000- weight), increase oil content per seed, improve fiber length, fiber strength, among others.
- An increase in yield may also result in modified architecture, or may occur because of modified architecture.
- Oil content The oil content of a plant can be determined by extraction of the oil from the seed or the vegetative portion of the plant. Briefly, lipids (oil) can be removed from the plant (e.g., seed) by grinding the plant tissue in the presence of specific solvents (e.g., hexane or petroleum ether) and extracting the oil in a continuous extractor. Indirect oil content analysis can be carried out using various known methods such as Nuclear Magnetic Resonance (NMR) Spectroscopy, which measures the resonance energy absorbed by hydrogen atoms in the liquid state of the sample [See for example, Conway TF.
- NMR Nuclear Magnetic Resonance
- Fiber length can be measured using fibrograph.
- the fibrograph system was used to compute length in terms of "Upper Half Mean” length.
- the upper half mean (UHM) is the average length of longer half of the fiber distribution.
- the fibrograph measures length in span lengths at a given percentage point (Hypertext Transfer Protocol ://World
- Abiotic stress tolerance - Transformed ⁇ i.e., expressing the transgene) and non- transformed (wild type) plants are exposed to an abiotic stress condition, such as water deprivation, suboptimal temperature (low temperature, high temperature), nutrient deficiency, nutrient excess, a salt stress condition, osmotic stress, high or low light conditions, heavy metal toxicity, anaerobiosis, atmospheric pollution and UV irradiation.
- an abiotic stress condition such as water deprivation, suboptimal temperature (low temperature, high temperature), nutrient deficiency, nutrient excess, a salt stress condition, osmotic stress, high or low light conditions, heavy metal toxicity, anaerobiosis, atmospheric pollution and UV irradiation.
- Salinity tolerance assay - Transgenic plants with tolerance to high salt concentrations are expected to exhibit better germination, seedling vigor or growth in high salt.
- Salt stress can be effected in many ways such as, for example, by irrigating the plants with a hyperosmotic solution, by cultivating the plants hydroponically in a hyperosmotic growth solution (e.g., Hoagland solution with added salt), or by culturing the plants in a hyperosmotic growth medium [e.g., 50 % Murashige-Skoog medium (MS medium) with added salt].
- a hyperosmotic growth medium e.g., 50 % Murashige-Skoog medium (MS medium) with added salt.
- the salt concentration in the irrigation water, growth solution, or growth medium can be adjusted according to the specific characteristics of the specific plant cultivar or variety, so as to inflict a mild or moderate effect on the physiology and/or morphology of the plants (for guidelines as to appropriate concentration see, Bernstein and Kafkafi, Root Growth Under Salinity Stress In: Plant Roots, The Hidden Half 3rd ed. Waisel Y, Eshel A and Kafkafi U. (editors) Marcel Dekker Inc., New York, 2002, and reference therein).
- a salinity tolerance test can be performed by irrigating plants at different developmental stages with increasing concentrations of sodium chloride (for example 50 mM, 100 mM, 200 mM, 400 mM NaCl) applied from the bottom and from above to ensure even dispersal of salt. Following exposure to the stress condition the plants are frequently monitored until substantial physiological and/or morphological effects appear in wild type plants. Thus, the external phenotypic appearance, degree of chlorosis and overall success to reach maturity and yield progeny are compared between control and transgenic plants.
- sodium chloride for example 50 mM, 100 mM, 200 mM, 400 mM NaCl
- Quantitative parameters of tolerance measured include, but are not limited to, the average wet and dry weight, growth rate, leaf size, leaf coverage (overall leaf area), the weight of the seeds yielded, the average seed size and the number of seeds produced per plant. Transformed plants not exhibiting substantial physiological and/or morphological effects, or exhibiting higher biomass than wild-type plants, are identified as abiotic stress tolerant plants.
- Osmotic tolerance test Osmotic stress assays (including sodium chloride and PEG assays) are conducted to determine if an osmotic stress phenotype was sodium chloride-specific or if it was a general osmotic stress related phenotype. Plants which are tolerant to osmotic stress may have more tolerance to drought and/or freezing. For salt and osmotic stress experiments, the medium is supplemented for example with 50 mM, 100 mM, 200 mM NaCl or 15 %, 20 % or 25 % PEG.
- Drought tolerance assay - Soil-based drought screens are performed with plants overexpressing the polynucleotides detailed above. Seeds from control Arabidopsis plants, or other transgenic plants overexpressing the polypeptide of the invention are germinated and transferred to pots. Drought stress is obtained after irrigation is ceased. Transgenic and control plants are compared to each other when the majority of the control plants develop severe wilting. Plants are re-watered after obtaining a significant fraction of the control plants displaying a severe wilting. Plants are ranked comparing to controls for each of two criteria: tolerance to the drought conditions and recovery (survival) following re-watering.
- Quantitative parameters of tolerance measured include, but are not limited to, the average wet and dry weight, growth rate, leaf size, leaf coverage (overall leaf area), the weight of the seeds yielded, the average seed size and the number of seeds produced per plant. Transformed plants not exhibiting substantial physiological and/or morphological effects, or exhibiting higher biomass than wild-type plants, are identified as drought stress tolerant plants
- Cold stress tolerance One way to analyze cold stress is as follows. Mature (25 day old) plants are transferred to 4 °C chambers for 1 or 2 weeks, with constitutive light. Later on plants are moved back to greenhouse. Two weeks later damages from chilling period, resulting in growth retardation and other phenotypes, are compared between control and transgenic plants, by measuring plant weight (wet and dry), and by comparing growth rates measured as time to flowering, plant size, yield, and the like.
- Heat stress tolerance One way to measure heat stress tolerance is by exposing the plants to temperatures above 34 °C for a certain period. Plant tolerance is examined after transferring the plants back to 22 °C for recovery and evaluation after 5 days relative to internal controls (non-transgenic plants) or plants not exposed to neither cold or heat stress.
- Germination tests compare the percentage of seeds from transgenic plants that could complete the germination process to the percentage of seeds from control plants that are treated in the same manner. Normal conditions are considered for example, incubations at 22 °C under 22-hour light 2-hour dark daily cycles. Evaluation of germination and seedling vigor is conducted between 4 and 14 days after planting. The basal media is 50 % MS medium (Murashige and Skoog, 1962 Plant Physiology 15, 473-497).
- Germination is checked also at unfavorable conditions such as cold (incubating at temperatures lower than 10 °C instead of 22 °C) or using seed inhibition solutions that contain high concentrations of an osmolyte such as sorbitol (at concentrations of 50 mM, 100 mM, 200 mM, 300 mM, 500 mM, and up to 1000 mM) or applying increasing concentrations of salt (of 50 mM, 100 mM, 200 mM, 300 mM, 500 mM NaCl).
- Water use efficiency (WUE) - can be determined as the biomass produced per unit transpiration. To analyze WUE, leaf relative water content can be measured in control and transgenic plants.
- Relative water content is calculated according to the following Formula V:
- RWC (FW - DW/TW - DW) x 100 Plants that maintain high relative water content (RWC) compared to control lines are considered more tolerant to drought than those exhibiting reduced relative water content.
- RWC relative water content
- a non limiting example in Arabidopsis is when water uptake by roots matches water loss by transpiration from leaves. Under these circumstances the plant is determined to be under equilibrium and the RWC is about 0.9.
- the RWC of transgenic plants decreases significantly less as compared to wild type plants, the transgenic plants are considered more tolerant to drought [Gaxiola et al. PNAS September 25, 2001 vol. 98 no. 20 11444-11449].
- Fertilizer use efficiency To analyze whether the transgenic plants are more responsive to fertilizers, plants are grown in agar plates or pots containing growth media with a limited amount of fertilizer (e.g., nitrogen, phosphate, potassium), essentially as described in Yanagisawa et al (Proc Natl Acad Sci U S A. 2004; 101 :7833-8). The plants are analyzed for their overall size, time to flowering, yield, protein content of shoot, grain and/or seed production. The parameters checked are the overall size of the mature plant, its wet and dry weight, the weight of the seeds yielded, the average seed size and the number of seeds produced per plant.
- fertilizer e.g., nitrogen, phosphate, potassium
- NUE nitrogen use efficiency
- PUE phosphate use efficiency
- KUE potassium use efficiency
- Arabidopsis plants which express the exogenous polynucleotide of the invention are grown in 0.03 mM potassium (potassium deficient conditions) or 3 mM potassium (optimal potassium concentration) essentially as described by Watson et al. Plant Physiol. (1996) 11 1 : 1077-1 083.
- N (nitrogen) concentration determination in the structural parts of the plants involves the potassium persulfate digestion method to convert organic N to N(V (Purcell and King 1996 Argon. J. 88:111- 113, the modified Cd- mediated reduction of N(V to NO 2 - (Vodovotz 1996 Biotechniques 20:390-394) and the measurement of nitrite by the Griess assay (Vodovotz 1996, supra). The absorbance values are measured at 550 nm against a standard curve Of NaNO 2 . The procedure is described in details in Samonte et al. 2006
- Nitrogen use efficiency To analyze whether the transgenic Arabidopsis plants are more responsive to nitrogen plant are grown in 0.75- 1.5 rnM (nitrogen deficient conditions) or 6-10 mM (optimal nitrogen concentration). Plants are allowed to grow for additional 20 days or until seed production. The plants are then analyzed for their overall size, time to flowering, yield, protein content of shoot and/or grain/ seed production. The parameters checked can be the overall size of the plant, wet and dry weight, the weight of the seeds yielded, the average seed size and the number of seeds produced per plant.
- Nitrogen use efficiency assay using plantlets - The assay is done according to Yanagisawa-S. et al. with minor modifications ("Metabolic engineering with Dofl transcription factor in plants: Improved nitrogen assimilation and growth under low- nitrogen conditions" Proc. Natl. Acad. ScL USA 101, 7833-7838). Briefly, transgenic plants which are grown for 7-10 days in 0.5 x MS [Murashige-Skoog] supplemented with a selection agent are transferred to two nitrogen-limiting conditions: MS media in which the combined nitrogen concentration (NH4NO3 and KNO3) was 0.2 mM or 0.05 mM.
- Plants are allowed to grow for additional 30-40 days and then photographed, individually removed from the Agar (the shoot without the roots) and immediately weighed (fresh weight) for later statistical analysis. Constructs for which only Tl seeds are available are sown on selective media and at least 25 seedlings (each one representing an independent transformation event) are carefully transferred to the nitrogen-limiting media. For constructs for which T2 seeds are available, different transformation events are analyzed. Usually, 25 randomly selected plants from each event are transferred to the nitrogen-limiting media allowed to grow for 3-4 additional weeks and individually weighed at the end of that period. Transgenic plants are compared to control plants grown in parallel under the same conditions. Mock- transgenic plants expressing the uidA reporter gene (GUS) under the same promoter are used as control.
- GUS uidA reporter gene
- Grain protein concentration - Grain protein content (g grain protein m -2 ) is estimated as the product of the mass of grain N (g grain N m -2 ) multiplied by the N/protein conversion ratio of k-5.13 (Mosse 1990, supra).
- the grain protein concentration is estimated as the ratio of grain protein content per unit mass of the grain
- the present invention is of high agricultural value for promoting the yield, biomass, growth rate, vigor, water use efficiency, fertilizer use efficiency, nitrogen use efficiency and abiotic stress tolerance of commercially desired crops (e.g., biomass of vegetative organ such as poplar wood, or reproductive organ such as number of seeds or seed biomass).
- biomass of vegetative organ such as poplar wood, or reproductive organ such as number of seeds or seed biomass.
- compositions, method or structure may include additional ingredients, steps and/or parts, but only if the additional ingredients, steps and/or parts do not materially alter the basic and novel characteristics of the claimed composition, method or structure.
- a compound or “at least one compound” may include a plurality of compounds, including mixtures thereof.
- range format is merely for convenience and brevity and should not be construed as an inflexible limitation on the scope of the invention. Accordingly, the description of a range should be considered to have specifically disclosed all the possible subranges as well as individual numerical values within that range. For example, description of a range such as from 1 to 6 should be considered to have specifically disclosed subranges such as from 1 to 3, from 1 to 4, from 1 to 5, from 2 to 4, from 2 to 6, from 3 to 6 etc., as well as individual numbers within that range, for example, 1, 2, 3, 4, 5, and 6. This applies regardless of the breadth of the range.
- a numerical range is indicated herein, it is meant to include any cited numeral (fractional or integral) within the indicated range.
- the phrases "ranging/ranges between” a first indicate number and a second indicate number and “ranging/ranges from” a first indicate number “to” a second indicate number are used herein interchangeably and are meant to include the first and second indicated numbers and all the fractional and integral numerals therebetween.
- the term "method” refers to manners, means, techniques and procedures for accomplishing a given task including, but not limited to, those manners, means, techniques and procedures either known to, or readily developed from known manners, means, techniques and procedures by practitioners of the chemical, pharmacological, biological, biochemical and medical arts.
- the present inventors have identified polynucleotides which expression thereof in plants can increase yield, fiber yield, fiber quality, growth rate, vigor, biomass, growth rate, oil content, abiotic stress tolerance (ABST), nitrogen use efficiency (NUE), water use efficiency (WUE) and fertilizer use efficiency (FUE) of a plant, as follows.
- ABSST abiotic stress tolerance
- NUE nitrogen use efficiency
- WUE water use efficiency
- FUE fertilizer use efficiency
- nucleotide sequence datasets used here were originated from publicly available databases or from performing sequencing using the Solexa technology (e.g. Barley and Sorghum). Sequence data from 100 different plant species was introduced into a single, comprehensive database. Other information on gene expression, protein annotation, enzymes and pathways were also incorporated. Major databases used include:
- Database Assembly - was performed to build a wide, rich, reliable annotated and easy to analyze database comprised of publicly available genomic mRNA, ESTs DNA sequences, data from various crops as well as gene expression, protein annotation and pathway data QTLs, and other relevant information.
- Database assembly is comprised of a toolbox of gene refining, structuring, annotation and analysis tools enabling to construct a tailored database for each gene discovery project.
- Gene refining and structuring tools enable to reliably detect splice variants and antisense transcripts, generating understanding of various potential phenotypic outcomes of a single gene.
- the capabilities of the "LEADS” platform of Compugen LTD for analyzing human genome have been confirmed and accepted by the scientific community [see e.g., "Widespread Antisense Transcription", Yelin, et al.
- EST clustering and gene assembly For gene clustering and assembly of organisms with available genome sequence data (arabidopsis, rice, castorbean, grape, brachypodium, poplar, soybean, sorghum) the genomic LEADS version (GANG) was employed. This tool allows most accurate clustering of ESTs and mRNA sequences on genome, and predicts gene structure as well as alternative splicing events and anti-sense transcription.
- GANG genomic LEADS version
- Gene expression profiling Several data sources were exploited for gene expression profiling, namely microarray data and digital expression profile (see below).
- gene expression profile a correlation analysis was performed to identify genes which are co-regulated under different development stages and environmental conditions and associated with different phenotypes.
- a digital expression profile summary was compiled for each cluster according to all keywords included in the sequence records comprising the cluster.
- Digital expression also known as electronic Northern Blot, is a tool that displays virtual expression profile based on the EST sequences forming the gene cluster.
- the tool provides the expression profile of a cluster in terms of plant anatomy (e.g., the tissue/organ in which the gene is expressed), developmental stage (the developmental stages at which a gene can be found) and profile of treatment (provides the physiological conditions under which a gene is expressed such as drought, cold, pathogen infection, etc).
- the digital expression Given a random distribution of ESTs in the different clusters, the digital expression provides a probability value that describes the probability of a cluster having a total of N ESTs to contain X ESTs from a certain collection of libraries.
- expression data was analyzed and the EST libraries were classified using a fixed vocabulary of custom terms such as developmental stages (e.g., genes showing similar expression profile through development with up regulation at specific stage, such as at the seed filling stage) and/or plant organ (e.g., genes showing similar expression profile across their organs with up regulation at specific organs such as seed).
- developmental stages e.g., genes showing similar expression profile through development with up regulation at specific stage, such as at the seed filling stage
- plant organ e.g., genes showing similar expression profile across their organs with up regulation at specific organs such as seed.
- Orthologs and paralogs constitute two major types of homo logs: The first evolved from a common ancestor by specialization, and the latter are related by duplication events. It is assumed that paralogs arising from ancient duplication events are likely to have diverged in function while true orthologs are more likely to retain identical function over evolutionary time. To identify putative orthologs of the genes affecting plant yield, oil yield, oil content, seed yield, growth rate, vigor, biomass, abiotic stress tolerance and/or nitrogen use efficiency, all sequences were aligned using the BLAST (Basic Local Alignment Search Tool). Sequences sufficiently similar were tentatively grouped.
- BLAST Basic Local Alignment Search Tool
- Expression data was analyzed and the EST libraries were classified using a fixed vocabulary of custom terms such as developmental stages (e.g., genes showing similar expression profile through development with up regulation at specific stage, such as at the seed filling stage) and/or plant organ (e.g., genes showing similar expression profile across their organs with up regulation at specific organs such as seed).
- developmental stages e.g., genes showing similar expression profile through development with up regulation at specific stage, such as at the seed filling stage
- plant organ e.g., genes showing similar expression profile across their organs with up regulation at specific organs such as seed.
- the search and identification of homologous genes involves the screening of sequence information available, for example, in public databases such as the DNA Database of Japan (DDBJ), Genbank, and the European Molecular Biology Laboratory Nucleic Acid Sequence Database (EMBL) or versions thereof or the MIPS database.
- DDBJ DNA Database of Japan
- Genbank Genbank
- EMBL European Molecular Biology Laboratory Nucleic Acid Sequence Database
- a number of different search algorithms have been developed, including but not limited to the suite of programs referred to as BLAST programs.
- BLAST programs There are five implementations of BLAST, three designed for nucleotide sequence queries (BLASTN, BLASTX, and TBLASTX) and two designed for protein sequence queries (BLASTP and TBLASTN) (Coulson, Trends in Biotechnology: 76-80, 1994; Birren et al., Genome Analysis, I: 543, 1997).
- Such methods involve alignment and comparison of sequences.
- the BLAST algorithm calculates percent sequence identity and performs a statistical analysis of the similarity between the two sequences.
- the software for performing BLAST analysis is publicly available through the National Centre for Biotechnology Information.
- Other such software or algorithms are GAP, BESTFIT, FASTA and TFASTA.
- GAP uses the algorithm of Needleman and Wunsch (J. MoI. Biol. 48: 443- 453, 1970) to find the alignment of two complete sequences that maximizes the number of matches and minimizes the number of gaps.
- the homologous genes may belong to the same gene family.
- the analysis of a gene family may be carried out using sequence similarity analysis. To perform this analysis one may use standard programs for multiple alignments e.g. Clustal W. A neighbour-joining tree of the proteins homologous to the genes in this invention may be used to provide an overview of structural and ancestral relationships. Sequence identity may be calculated using an alignment program as described above. It is expected that other plants will carry a similar functional gene (ortholog) or a family of similar genes and those genes will provide the same preferred phenotype as the genes presented here.
- these family members may be useful in the methods of the invention.
- Example of other plants are included here but not limited to, barley (Hordeum vulgare), Arabidopsis (Arabidopsis thaliana), maize (Zea mays), cotton (Gossypium), Oilseed rape (Brassica napus), Rice (Oryza sativa), Sugar cane (Saccharum off ⁇ cinarum), Sorghum (Sorghum bicolor), Soybean (Glycine max), Sunflower (Helianthus annuus), Tomato (Lycopersicon esculentum), Wheat (Triticum aestivum).
- homologous sequences may be used to find similar sequences in other species and other organisms.
- Homologues of a protein encompass, peptides, oligopeptides, polypeptides, proteins and enzymes having amino acid substitutions, deletions and/or insertions relative to the unmodified protein in question and having similar biological and functional activity as the unmodified protein from which they are derived.
- amino acids of the protein may be replaced by other amino acids having similar properties (conservative changes, such as similar hydrophobicity, hydrophilicity, antigenicity, propensity to form or break a-helical structures or 3-sheet structures).
- Conservative substitution tables are well known in the art (see for example Creighton (1984) Proteins.
- Homologues of a nucleic acid encompass nucleic acids having nucleotide substitutions, deletions and/or insertions relative to the unmodified nucleic acid in question and having similar biological and functional activity as the unmodified nucleic acid from which they are derived.
- Table 2 hereinbelow, lists a summary of orthologous and homologous sequences of the polynucleotide sequences (SEQ ID NOs: 1-239) and polypeptide sequences (SEQ ID NOs:240-465) presented in Table 1 above, which were identified from the databases using the NCBI BLAST software (e.g., using the Blastp and tBlastn algorithms) and needle (EMBOSS package) as being at least 80% homologous to the selected polynucleotides and polypeptides, and which are expected to increase plant yield, seed yield, oil yield, oil content, growth rate, fiber yield, fiber quality, biomass, vigor, ABST and/or NUE of a plant.
- NCBI BLAST software e.g., using the Blastp and tBlastn algorithms
- EMBOSS package needle
- the output of the functional genomics approach described herein is a set of genes highly predicted to improve yield and/or other agronomic important traits such as growth rate, vigor, oil content, fiber yield and/or quality, biomass, growth rate, abiotic stress tolerance, nitrogen use efficiency, water use efficiency and fertilizer use efficiency of a plant by increasing their expression.
- each gene is predicted to have its own impact, modifying the mode of expression of more than one gene is expected to provide an additive or synergistic effect on the plant yield and/or other agronomic important yields performance. Altering the expression of each gene described here alone or set of genes together increases the overall yield and/or other agronomic important traits, hence expects to increase agricultural productivity.
- the array oligonucleotide represents about 47,500 Barley genes and transcripts.
- various plant characteristics of 25 different Barley accessions were analyzed. Among them, 13 accessions encompassing the observed variance were selected for RNA expression analysis.
- each micro-array expression information tissue type has received a Set ID as summarized in Table 3 below.
- Barley yield components and vigor related parameters assessment - 25 Barley accessions in 4 repetitive blocks (named A, B, C, and D), each containing 4 plants per plot were grown at net house. Plants were phenotyped on a daily basis following the standard descriptor of barley (Table 4, below). Harvest was conducted while 50 % of the spikes were dry to avoid spontaneous release of the seeds. Plants were separated to the vegetative part and spikes, of them, 5 spikes were threshed (grains were separated from the glumes) for additional grain analysis such as size measurement, grain count per spike and grain yield per spike. All material was oven dried and the seeds were threshed manually from the spikes prior to measurement of the seed characteristics (weight and size) using scanning and image analysis.
- the image analysis system included a personal desktop computer (Intel P4 3.0 GHz processor) and a public domain program - ImageJ 1.37 (Java based image processing program, which was developed at the U.S. National Institutes of Health and freely available on the internet [Hypertext Transfer Protocol ://rsbweb (dot) nih (dot) gov/]. Next, analyzed data was saved to text files and processed using the JMP statistical analysis software (SAS institute).
- SAS institute JMP statistical analysis software
- Grain average size (cm) - At the end of the experiment (50 % of the spikes were dry) all spikes from plots within blocks A-D are collected. The total grains from 5 spikes that were manually threshed were scanned and images were analyzed using the digital imaging system. Grain scanning was done using Brother scanner (model DCP- 135), at the 200 dpi resolution and analyzed with Image J software. The average grain size was calculated by dividing the total grain size by the total grain number.
- Grain average weight (mgr) At the end of the experiment (50 % of the spikes were dry) all spikes from plots within blocks A-D are collected. The total grains from 5 spikes that were manually threshed were counted and weight. The average weight was calculated by dividing the total weight by the total grain number.
- Grain yield per spike (gr) At the end of the experiment (50 % of the spikes were dry) all spikes from plots within blocks A-D are collected. The total grains from 5 spikes that were manually threshed were weight. The grain yield was calculated by dividing the total weight by the spike number.
- Spike length analysis At the end of the experiment (50 % of the spikes were dry) all spikes from plots within blocks A-D are collected. The five chosen spikes per plant were measured using measuring tape excluding the awns.
- Spike number analysis At the end of the experiment (50 % of the spikes were dry) all spikes from plots within blocks A-D are collected. The spikes per plant were counted.
- Plant height At the harvest stage (50 % of spikes were dry) each of the plants was measured for its height using measuring tape. Height was measured from ground level to top of the longest spike excluding awns. Days to flowering - Each of the plants was monitored for flowering date. Days of flowering was calculated from sowing date till flowering date.
- Harvest Index Average spike dry weight per plant/ (Average vegetative dry weight per plant + Average spike dry weight per plant)
- the array oligonucleotide represents about
- RNA extraction Five tissues at different developmental stages including root, leaf, flower at anthesis, seed at 5 days after flowering (DAF) and seed at 12 DAF, representing different plant characteristics, were sampled and RNA was extracted as described in Example 3 above. For convenience, each micro-array expression information tissue type has received a Set ID as summarized in Table 9 below.
- Yield components and vigor related parameters assessment - eight out of the nine Arabidopsis ecotypes were used in each of 5 repetitive blocks (named A, B, C, D and E), each containing 20 plants per plot.
- the plants were grown in a greenhouse at controlled conditions in 22 °C, and the N:P:K fertilizer (20:20:20; weight ratios) [nitrogen (N), phosphorus (P) and potassium (K)] was added.
- N:P:K fertilizer (20:20:20; weight ratios) [nitrogen (N), phosphorus (P) and potassium (K)] was added.
- N nitrogen
- P phosphorus
- K potassium
- Digital imaging in Tissue culture - A laboratory image acquisition system was used for capturing images of plantlets sawn in square agar plates.
- the image acquisition system consists of a digital reflex camera (Canon EOS 300D) attached to a 55 mm focal length lens (Canon EF-S series), mounted on a reproduction device (Kaiser RS), which included 4 light units (4x150 Watts light bulb) and located in a darkroom.
- the plants were dissected, each leaf was separated and was introduced between two glass trays, a photo of each plant was taken and the various parameters (such as leaf total area, laminar length etc.) were calculated from the images.
- the blade circularity was calculated as laminar width divided by laminar length.
- Root analysis During 17 days, the different ecotypes were grown in transparent agar plates. The plates were photographed every 3 days starting at day 7 in the photography room and the roots development was documented (see examples in Figures 3 A-F). The growth rate of roots was calculated according to Formula VII.
- Relative growth rate of root coverage Regression coefficient of root coverage along time course.
- Vegetative growth rate analysis - was calculated according to Formula VIII. The analysis was ended with the appearance of overlapping plants.
- Relative vegetative growth rate area Regression coefficient of vegetative area along time course.
- the calculated rate was normalized using plant developmental stage as represented by the number of true leaves. In cases where plants with 8 leaves had been sampled twice (for example at day 10 and day 13), only the largest sample was chosen and added to the Anova comparison. Seeds in siliques analysis - On day 70, 15-17 siliques were collected from each plot in blocks D and E. The chosen siliques were light brown color but still intact. The siliques were opened in the photography room and the seeds were scatter on a glass tray, a high resolution digital picture was taken for each plot. Using the images the number of seeds per silique was determined.
- Seed Oil yield Seed yield per plant (gr) * Oil % in seed
- Harvest Index Average seed yield per plant/ Average dry weight.
- Table 13 provides selected genes of some embodiments of the invention, the characterized parameters (which are used as x axis for correlation) and the correlated tissue transcriptom along with the correlation value (R, calculated using Pearson correlation).
- R correlation coefficient
- MICRO-ARRAY In order to produce a high throughput correlation analysis, the present inventors utilized a Arabidopsis oligonucleotide micro-array, produced by Agilent Technologies
- the array oligonucleotide represents about
- RNA expression analysis 44,000 Arabidopsis genes and transcripts.
- yield components or vigor related parameters various plant characteristics of 14 different Arabidopsis ecotypes were analyzed. Among them, ten ecotypes encompassing the observed variance were selected for RNA expression analysis. The correlation between the RNA levels and the characterized parameters was analyzed using Pearson correlation test [Hypertext Transfer Protocol ://World Wide Web (dot) davidmlane (dot) com/hyperstat/A34739 (dot) html].
- RNA extraction Two tissues of plants [leaves and stems] growing at two different nitrogen fertilization levels (1.5 mM Nitrogen or 6 mM Nitrogen) were sampled and RNA was extracted as described in Examples 3 above. For convenience, each micro-array expression information tissue type has received a Set ID as summarized in Table 14 below.
- Arabidopsis accessions in 2 repetitive plots each containing 8 plants per plot were grown at greenhouse.
- the growing protocol used was as follows: surface sterilized seeds were sown in Eppendorf tubes containing 0.5 x Murashige-Skoog basal salt medium and grown at 23 °C under 12-hour light and 12-hour dark daily cycles for 10 days. Then, seedlings of similar size were carefully transferred to pots filled with a mix of perlite and peat in a 1 :1 ratio.
- Constant nitrogen limiting conditions were achieved by irrigating the plants with a solution containing 1.5 mM inorganic nitrogen in the form of KNO 3 , supplemented with 2 mM CaCl 2 , 1.25 mM KH 2 PO 4 , 1.50 mM MgSO 4 , 5 mM KCl, 0.01 mM H 3 BO 3 and microelements, while normal irrigation conditions (Normal Nitrogen conditions) was achieved by applying a solution of 6 mM inorganic nitrogen also in the form of KNO 3 , supplemented with 2 mM CaCl 2 , 1.25 mM KH 2 PO 4 , 1.50 mM MgSO 4 , 0.01 mM H 3 BO 3 and microelements.
- Arabidopsis ecotypes were grown in trays, each containing 8 plants per plot, in a greenhouse with controlled temperature conditions for about 12 weeks. Plants were irrigated with different nitrogen concentration as described above depending on the treatment applied. During this time, data was collected documented and analyzed. Most of chosen parameters were analyzed by digital imaging. Digital imaging - Greenhouse assay An image acquisition system, which consists of a digital reflex camera (Canon EOS 400D) attached with a 55 mm focal length lens (Canon EF-S series) placed in a custom made Aluminum mount, was used for capturing images of plants planted in containers within an environmental controlled greenhouse. The image capturing process is repeated every 2-3 days starting at day 9-12 till day 16-19 (respectively) from transplanting.
- An image processing system was used, which consists of a personal desktop computer (Intel P4 3.0 GHz processor) and a public domain program - ImageJ 1.37, Java based image processing software, which was developed at the U.S. National Institutes of Health and is freely available on the internet at Hypertext Transfer Protocol ://rsbweb (dot) nih (dot) gov/. Images were captured in resolution of 10 Mega Pixels (3888x2592 pixels) and stored in a low compression JPEG (Joint Photographic Experts Group standard) format. Next, image processing output data was saved to text files and analyzed using the JMP statistical analysis software (SAS institute).
- SAS institute JMP statistical analysis software
- Leaf analysis Using the digital analysis leaves data was calculated, including leaf number, leaf blade area, plot coverage, Rosette diameter and Rosette area.
- Relative growth rate area The relative growth rate of the rosette and the leaves was calculated according to Formulas XIV and XVII , respectively.
- Seed yield and 1000 seeds weight At the end of the experiment all seeds from all plots were collected and weighed in order to measure seed yield per plant in terms of total seed weight per plant (gr). For the calculation of 1000 seed weight, an average weight of 0.02 grams was measured from each sample, the seeds were scattered on a glass tray and a picture was taken. Using the digital analysis, the number of seeds in each sample was calculated.
- Harvest Index Average seed yield per plant/ Average dry weight.
- Percent of seed yield reduction measures the amount of seeds obtained in plants when grown under nitrogen-limiting conditions compared to seed yield produced at normal nitrogen levels expressed in %.
- the array oligonucleotide represents about 44,000 Sorghum genes and transcripts.
- various plant characteristics of 17 different sorghum varieties were analyzed.
- RNA expression analysis 10 varieties encompassing the observed variance were selected for RNA expression analysis.
- RNA levels were analyzed using Pearson correlation test [Hypertext Transfer Protocol ://World Wide Web (dot) davidmlane (dot) com/hyperstat/A34739 (dot) html].
- RNA extraction All 10 selected Sorghum varieties were sample per each treatment. Plant tissues [Flag leaf, Flower meristem and Flower] growing under severe drought stress and plants grown under Normal conditions were sampled and RNA was extracted as described in Examples 3 above. For convenience, each micro-array expression information tissue type has received a Set ID as summarized in Table 17 below.
- Head Average Length (cm) At the end of the growing period 5 'Heads' were, photographed and images were processed using the below described image processing system.
- the 'Head' length (longest axis) was measured from those images and was divided by the number of 'Heads' .
- the image processing system was used, which consists of a personal desktop computer (Intel P4 3.0 GHz processor) and a public domain program - ImageJ 1.37, Java based image processing software, which was developed at the U.S. National Institutes of Health and is freely available on the internet at Hypertext Transfer Protocol ://rsbweb (dot) nih (dot) gov/.
- Images were captured in resolution of 10 Mega Pixels (3888x2592 pixels) and stored in a low compression JPEG (Joint Photographic Experts Group standard) format.
- image processing output data for seed area and seed length was saved to text files and analyzed using the JMP statistical analysis software (SAS institute). Additional parameters were collected either by sampling 5 plants per plot or by measuring the parameter across all the plants within the plot.
- Total Seed Weight/Head (gr.) - At the end of the experiment (plant 'Heads') heads from plots within blocks A-C were collected. 5 heads were separately threshed and grains were weighted, all additional heads were threshed together and weighted as well. The average grain weight per head was calculated by dividing the total grain weight by number of total heads per plot (based on plot). In case of 5 heads, the total grains weight of 5 heads was divided by 5.
- FW Head/Plant gr - At the end of the experiment (when heads were harvested) total and 5 selected heads per plots within blocks A-C were collected separetaly. The heads (total and 5) were weighted (gr.) separately and the average fresh weight per plant was calculated for total (FW Head/Plant gr based on plot) and for 5 (FW Head/Plant gr based on 5 plants).
- Plant height Plants were characterized for height during growing period at 5 time points. In each measure, plants were measured for their height using a measuring tape. Height was measured from ground level to top of the longest leaf.
- Plant leaf number Plants were characterized for leaf number during growing period at 5 time points. In each measure, plants were measured for their leaf number by counting all the leaves of 3 selected plants per plot.
- Relative growth rate of plant height Regression coefficient of plant height along time course.
- Relative growth rate of plant leaf number Regression coefficient of plant leaf number along time course.
- SPAD - Chlorophyll content was determined using a Minolta SPAD 502 chlorophyll meter and measurement was performed 64 days post sowing. SPAD meter readings were done on young fully developed leaf. Three measurements per leaf were taken per plot.
- Dry weight total weight of the vegetative portion above ground (excluding roots) after drying at 70 °C in oven for 48 hours;
- Full Hogland solution consists of: KNO 3 - 0.808 grams/liter, MgSO 4 - 0.12 grams/liter, KH 2 PO 4 - 0.172 grams/liter and 0.01 % (volume/volume) of 'Super coratin' micro elements (Iron-EDDHA [ethylenediamine-N,N'-bis(2-hydroxyphenylacetic acid)]- 40.5 grams/liter; Mn - 20.2 grams/liter; Zn 10.1 grams/liter; Co 1.5 grams/liter; and Mo 1.1 grams/liter), solution's pH should be 6.5 - 6.8].
- RNA extraction All 10 selected Sorghum varieties were sampled per each treatment.
- Cloning strategy Genes listed in Examples 1-6 hereinabove were cloned into binary vectors for the generation of transgenic plants. For cloning, the full-length open reading frame (ORF) was first identified. In case of ORF-EST clusters and in some cases already published mRNA sequences were analyzed to identify the entire open reading frame by comparing the results of several translation algorithms to known proteins from other plant species.
- ORF open reading frame
- PCR polymerase chain reaction
- PCR products were purified using PCR purification kit (Qiagen).
- the primer extension includes an endonuclease restriction site.
- the restriction sites were selected using two parameters: (a). The site did not exist in the cDNA sequence; and (b). The restriction sites in the forward and reverse primers were designed such that the digested cDNA is inserted in the sense formation into the binary vector utilized for transformation.
- Each digested PCR product was inserted into a high copy vector pBlue-script KS plasmid vector [pBlue-script KS plasmid vector, Hypertext Transfer Protocol ://World Wide Web (dot) stratagene (dot) com/manuals/212205 (dot) pdfj or into plasmids originating from this vector.
- pBlue-script KS plasmid vector Hypertext Transfer Protocol ://World Wide Web (dot) stratagene (dot) com/manuals/212205 (dot) pdfj
- the PCR product was inserted upstream to the NOS terminator (SEQ ID NO: 4194) originated from pBI 101.3 binary vector (GenBank Accession No. U12640, nucleotides 4356 to 4693) and downstream to the 35 S promoter.
- the digested products and the linearized plasmid vector were ligated using T4 DNA ligase enzyme (Roche, Switzerland). In some cases PCR products were cloned without digestion into pCR-Blunt II-TOPO vector (Invitrogen).
- High copy plasmids containing the cloned genes were digested with restriction endonucleases (New England BioLabs Inc) and cloned into binary vectors according to Table 27, below.
- Binary vectors used for cloning Evolution of binary vectors construction: The plasmid pPI was constructed by inserting a synthetic poly-(A) signal sequence, originating from pGL3 basic plasmid vector (Promega, Ace No U47295; bp 4658-4811) into the Hindlll restriction site of the binary vector pBI101.3 (Clontech, Ace. No. U12640).
- pGI pBXYN
- GUS gene was replaced by the GUS-Intron gene followed by the NOS terminator (SEQ ID NO:4194) (Vancanneyt. G, et al MGG 220, 245-50, 1990).
- the modified pGI vector (pQXYN) is a modified version of the pGI vector in which the cassette is inverted between the left and right borders so the gene and its corresponding promoter are close to the right border and the NPTII gene is close to the left border.
- Vectors used for cloning the polynucleotides of some embodiments of the invention Cloned genes were digested from the high copy vectors and cloned into one of the following binary vectors: pQFN or pQYN_6669.
- pQFN see Figure 2
- pQYN_6669 are modified pGI vectors in which the 35 S promoter was replaced by the new At6669 promoter (SEQ ID NO:4198).
- pQYN_6669 contains the GUSintron sequence, while pQFN lacks the GUSintron sequence
- Synthetic DNA is designed in silico. Suitable restriction enzymes sites were added to the cloned sequences at the 5' end and at the 3' end to enabled later cloning into the pQFN/ pQYN_6669 binary vectors downstream of the 6669 promoter (SEQ ID NO:4198).
- Each of the binary vectors described in Example 7 above are used to transform Agrobacterium cells.
- Two additional binary constructs, having a GUS/Luciferase reporter gene replacing the selected gene (positioned downstream of the At6669 promoter), are used as negative controls.
- the binary vectors are introduced to Agrobacterium tumefaciens GV301, or
- LB4404 competent cells (about 10 9 cells/mL) by electroporation.
- the electroporation is performed using a MicroPulser electroporator (Biorad), 0.2 cm cuvettes (Biorad) and EC-2 electroporation program (Biorad).
- the treated cells are cultured in LB liquid medium at 28 °C for 3 hours, then plated over LB agar supplemented with gentamycin (50 mg/L; for Agrobacterium strains GV301) or streptomycin (300 mg/L; for Agrobacterium strain LB4404) and kanamycin (50 mg/L) at 28 °C for 48 hours.
- the pots were covered with aluminum foil and a plastic dome, kept at 4 °C for 3-4 days, then uncovered and incubated in a growth chamber at 18-24 °C under 16/8 hours light/dark cycles.
- the To plants were ready for transformation six days before anthesis.
- the pellets comprising Agrobacterium cells were resuspended in a transformation medium which contained half-strength (2.15 g/L) Murashige-Skoog (Duchefa); 0.044 ⁇ M benzylamino purine (Sigma); 112 ⁇ g/L B5 Gam strig vitamins (Sigma); 5 % sucrose; and 0.2 ml/L Silwet L-77 (OSI Specialists, CT) in double-distilled water, at pH of 5.7.
- Transformation of To plants was performed by inverting each plant into an Agrobacterium suspension such that the above ground plant tissue was submerged for 3-5 seconds. Each inoculated To plant was immediately placed in a plastic tray, then covered with clear plastic dome to maintain humidity and was kept in the dark at room temperature for 18 hours to facilitate infection and transformation. Transformed (transgenic) plants were then uncovered and transferred to a greenhouse for recovery and maturation. The transgenic To plants were grown in the greenhouse for 3-5 weeks until siliques were brown and dry, then seeds were harvested from plants and kept at room temperature until sowing.
- Vital Ti Arabidopsis plants were transferred to a fresh culture plates for another week of incubation. Following incubation the Ti plants were removed from culture plates and planted in growth mix contained in 250 ml pots. The transgenic plants were allowed to grow in a greenhouse to maturity. Seeds harvested from Ti plants were cultured and grown to maturity as T 2 plants under the same conditions as used for culturing and growing the Ti plants.
- Greenhouse assays The plants were analyzed for their overall size, growth rate, flowering, seed yield, weight of 1,000 seeds, dry matter and harvest index (HI- seed yield/dry matter). Transgenic plants performance was compared to control plants grown in parallel under the same conditions. Mock- transgenic plants expressing the uidA reporter gene (GUS-Intron) or with no gene at all, under the same promoter were used as control. The experiment was planned in nested randomized plot distribution. For each gene of the invention three to five independent transformation events were analyzed from each construct. In cases where a certain event appears more than once, the event was tested in several independent experiments.
- GUS-Intron uidA reporter gene
- Tables 29 and 31 specify the parameters measured in plants in the greenhouse assays (till seed maturation and bolting assay, respectively).
- Digital imaging - A laboratory image acquisition system which consists of a digital reflex camera (Canon EOS 300D) attached with a 55 mm focal length lens (Canon EF-S series), mounted on a reproduction device (Kaiser RS), which included 4 light units (4 x 150 Watts light bulb) is used for capturing images of plant samples.
- the image capturing process was repeated every 2 days starting from day 1 after transplanting till day 16. Same camera, placed in a custom made iron mount, was used for capturing images of larger plants sawn in white tubs in an environmental controlled greenhouse.
- the tubs were square shape include 1.7 liter trays. During the capture process, the tubs were placed beneath the iron mount, while avoiding direct sun light and casting of shadows.
- An image analysis system was used, which consists of a personal desktop computer (Intel P4 3.0 GHz processor) and a public domain program - Image J 1.39
- Pixels (3888 x 2592 pixels) and stored in a low compression JPEG (Joint Photographic Experts Group standard) format. Next, analyzed data was saved to text files and processed using the JMP statistical analysis software (SAS institute).
- JPEG Joint Photographic Experts Group standard
- Leaf growth analysis Using the digital analysis leaves data was calculated, including leaf number, rosette area, rosette diameter, leaf blade area, plot coverage, leaf petiole length.
- the vegetative growth rate of the plant was defined by formulas XIII, XIV, XV and XVI.
- Relative growth rate of leaf blade area Regression coefficient of leaf area along time course.
- Relative growth rate of rosette area Regression coefficient of rosette area along time course.
- Relative growth rate of rosette diameter Regression coefficient of rosette diameter along time course.
- Relative growth rate of plot coverage Regression coefficient of plot coverage along time course.
- Seeds average weight (Seed weight or 1000 seed weight) - At the end of the experiment all seeds were collected. The seeds were scattered on a glass tray and a picture was taken. Using the digital analysis, the number of seeds in each sample was calculated.
- Seed yield per plant total seed weight per plant (gr.).
- 1000 seed weight (the weight of 1000 seeds) (gr.).
- Oil yield - The oil yield was calculated using Formula IX (described above).
- Silique length analysis On day 50 from sowing, 30 siliques from different plants in each plot were sampled in block A. The chosen siliques were green-yellow in color and were collected from the bottom parts of a grown plant's stem. A digital photograph was taken to determine silique's length.
- Statistical analyses To identify genes conferring significantly improved tolerance to abiotic stresses, the results obtained from the transgenic plants were compared to those obtained from control plants. To identify outperforming genes and constructs, results from the independent transformation events tested were analyzed separately. Data was analyzed using Student's t-test and results were considered significant if the p value was less than 0.1. The JMP statistics software package was used (Version 5.2.1, SAS Institute Inc., Cary, NC, USA).
- Plants expressing the polynucleotides of the some embodiments of the invention were assayed for a number of commercially desired traits. In cases where a certain event appears more than once, the event was tested in several independent experiments.
- T2 seeds T2 experiments herein below
- Tl seeds Tl experiments herein below
- S2 seeds T2 experiments herein below
- Tl seeds Tl experiments herein below
- S2 seeds Surface sterilized Tl or T2 seeds were sown in basal media [50% Murashige-Skoog medium (MS) supplemented with 0.8% plant agar as solidifying agent] in the presence of Kanamycin (for selecting only transgenic plants). After sowing, plates were transferred for 2-3 days for stratification at 4 °C and then grown at 25 °C under 12-hour light 12-hour dark daily cycles for 7 to 10 days. At this time point, at T2 experiments seedlings randomly chosen were carefully transferred to plates containing 0.5 MS media.
- MS Murashige-Skoog medium
- Each plate contained 5 seedlings of the same transgenic event, and 3-4 different plates (replicates) for each event.
- For each polynucleotide of the invention at least four independent transformation events were analyzed from each construct. Plants expressing the polynucleotides of the invention were compared to the average measurement of the control plants (empty vector or GUS reporter gene under the same promoter) used in the same experiment. Alternatively, at Tl experiments seedlings randomly chosen were carefully transferred to plates containing 0.5 MS media. Each plate contained 5 Tl seedlings representing 5 independent transgenic events, and 3-4 different plates (total of 15-20 events). Plants expressing the polynucleotides of the invention were compared to the average measurement of the control plants (empty vector or GUS reporter gene under the same promoter) used in the same experiment.
- each polynucleotide of the invention at least four independent transformation events were analyzed from each construct. Plants expressing the polynucleotides of the invention were compared to the average measurement of the control plants (empty vector or GUS reporter gene under the same promoter) used in the same experiment.
- Digital imaging - A laboratory image acquisition system which consists of a digital reflex camera (Canon EOS 300D) attached with a 55 mm focal length lens (Canon EF-S series), mounted on a reproduction device (Kaiser RS), which included 4 light units (4x150 Watts light bulb) and located in a darkroom, is used for capturing images of plantlets sawn in agar plates.
- An image analysis system was used, which consists of a personal desktop computer (Intel P4 3.0 GHz processor) and a public domain program - ImageJ 1.39 [Java based image processing program which was developed at the U.S. National Institutes of Health and freely available on the internet at Hypertext Transfer Protocol://rsbweb (dot) nih (dot) gov/]. Images were captured in resolution of 10 Mega Pixels (3888 x 2592 pixels) and stored in a low compression JPEG (Joint Photographic Experts Group standard) format. Next, analyzed data was saved to text files and processed using the JMP statistical analysis software (SAS institute). Seedling analysis - Using the digital analysis seedling data was calculated, including leaf area, root coverage and root length.
- Relative growth rate of leaf area Regression coefficient of leaf area along time course.
- Relative growth rate of root length Regression coefficient of root length along time course.
- plantlets were removed from the media and weighed for the determination of plant fresh weight. Plantlets were then dried for 24 hours at 60 °C, and weighed again to measure plant dry weight for later statistical analysis. Growth rate is determined by comparing the leaf area coverage, root coverage and root length, between each couple of sequential photographs, and results were used to resolve the effect of the gene introduced on plant vigor under optimal conditions. Similarly, the effect of the gene introduced on biomass accumulation, under optimal conditions, is determined by comparing the plants' fresh and dry weight to that of control plants (containing an empty vector or the GUS reporter gene under the same promoter). From every construct created, 3-5 independent transformation events were examined in replicates.
- Tables 33, 35 and 37 specify the parameters measured in plants in the tissue culture assays (T2 plants, Tl plants and low nitrogen T2 plants).
- Plants expressing the polynucleotides of the invention were assayed for a number of commercially desired traits. In cases where a certain event appears more than once, the event was tested in several independent experiments.
- transformed plants showing improved fresh and dry weight demonstrate the gene capacity to improve biomass a key trait of crops for forage and plant productivity; transformed plants showing improvement of seed yield demonstrate the genes capacity to improve plant productivity; transformed plants showing improvement of plot coverage and rosette diameter demonstrate the genes capacity to improve plant drought resistance as they reduce the loss of soil water by simple evaporation and reduce the competition with weeds; hence reduce the need to use herbicides to control weeds.
- Transformed plants showing improvement of relative growth rate of various organs demonstrate the gene capacity to promote plant growth and hence shortening the needed growth period and/or alternatively improving the utilization of available nutrients and water leading to increase of land productivity;
- Transformed plants showing improvement of organ number as demonstrated by the leaf number parameter exhibit a potential to improve biomass yield important for forage crops and improve the plant productivity;
- Transformed plants showing increased root length and coverage demonstrate the gene capacity to improve drought resistance and better utilization of fertilizers as the roots can reach larger soil volume;
- Transformed plants showing improvement of leaf petiole relative area and leaf blade area demonstrate the genes capacity to cope with limited light intensities results from increasing the plant population densities and hence improve land productivity.
Abstract
Description


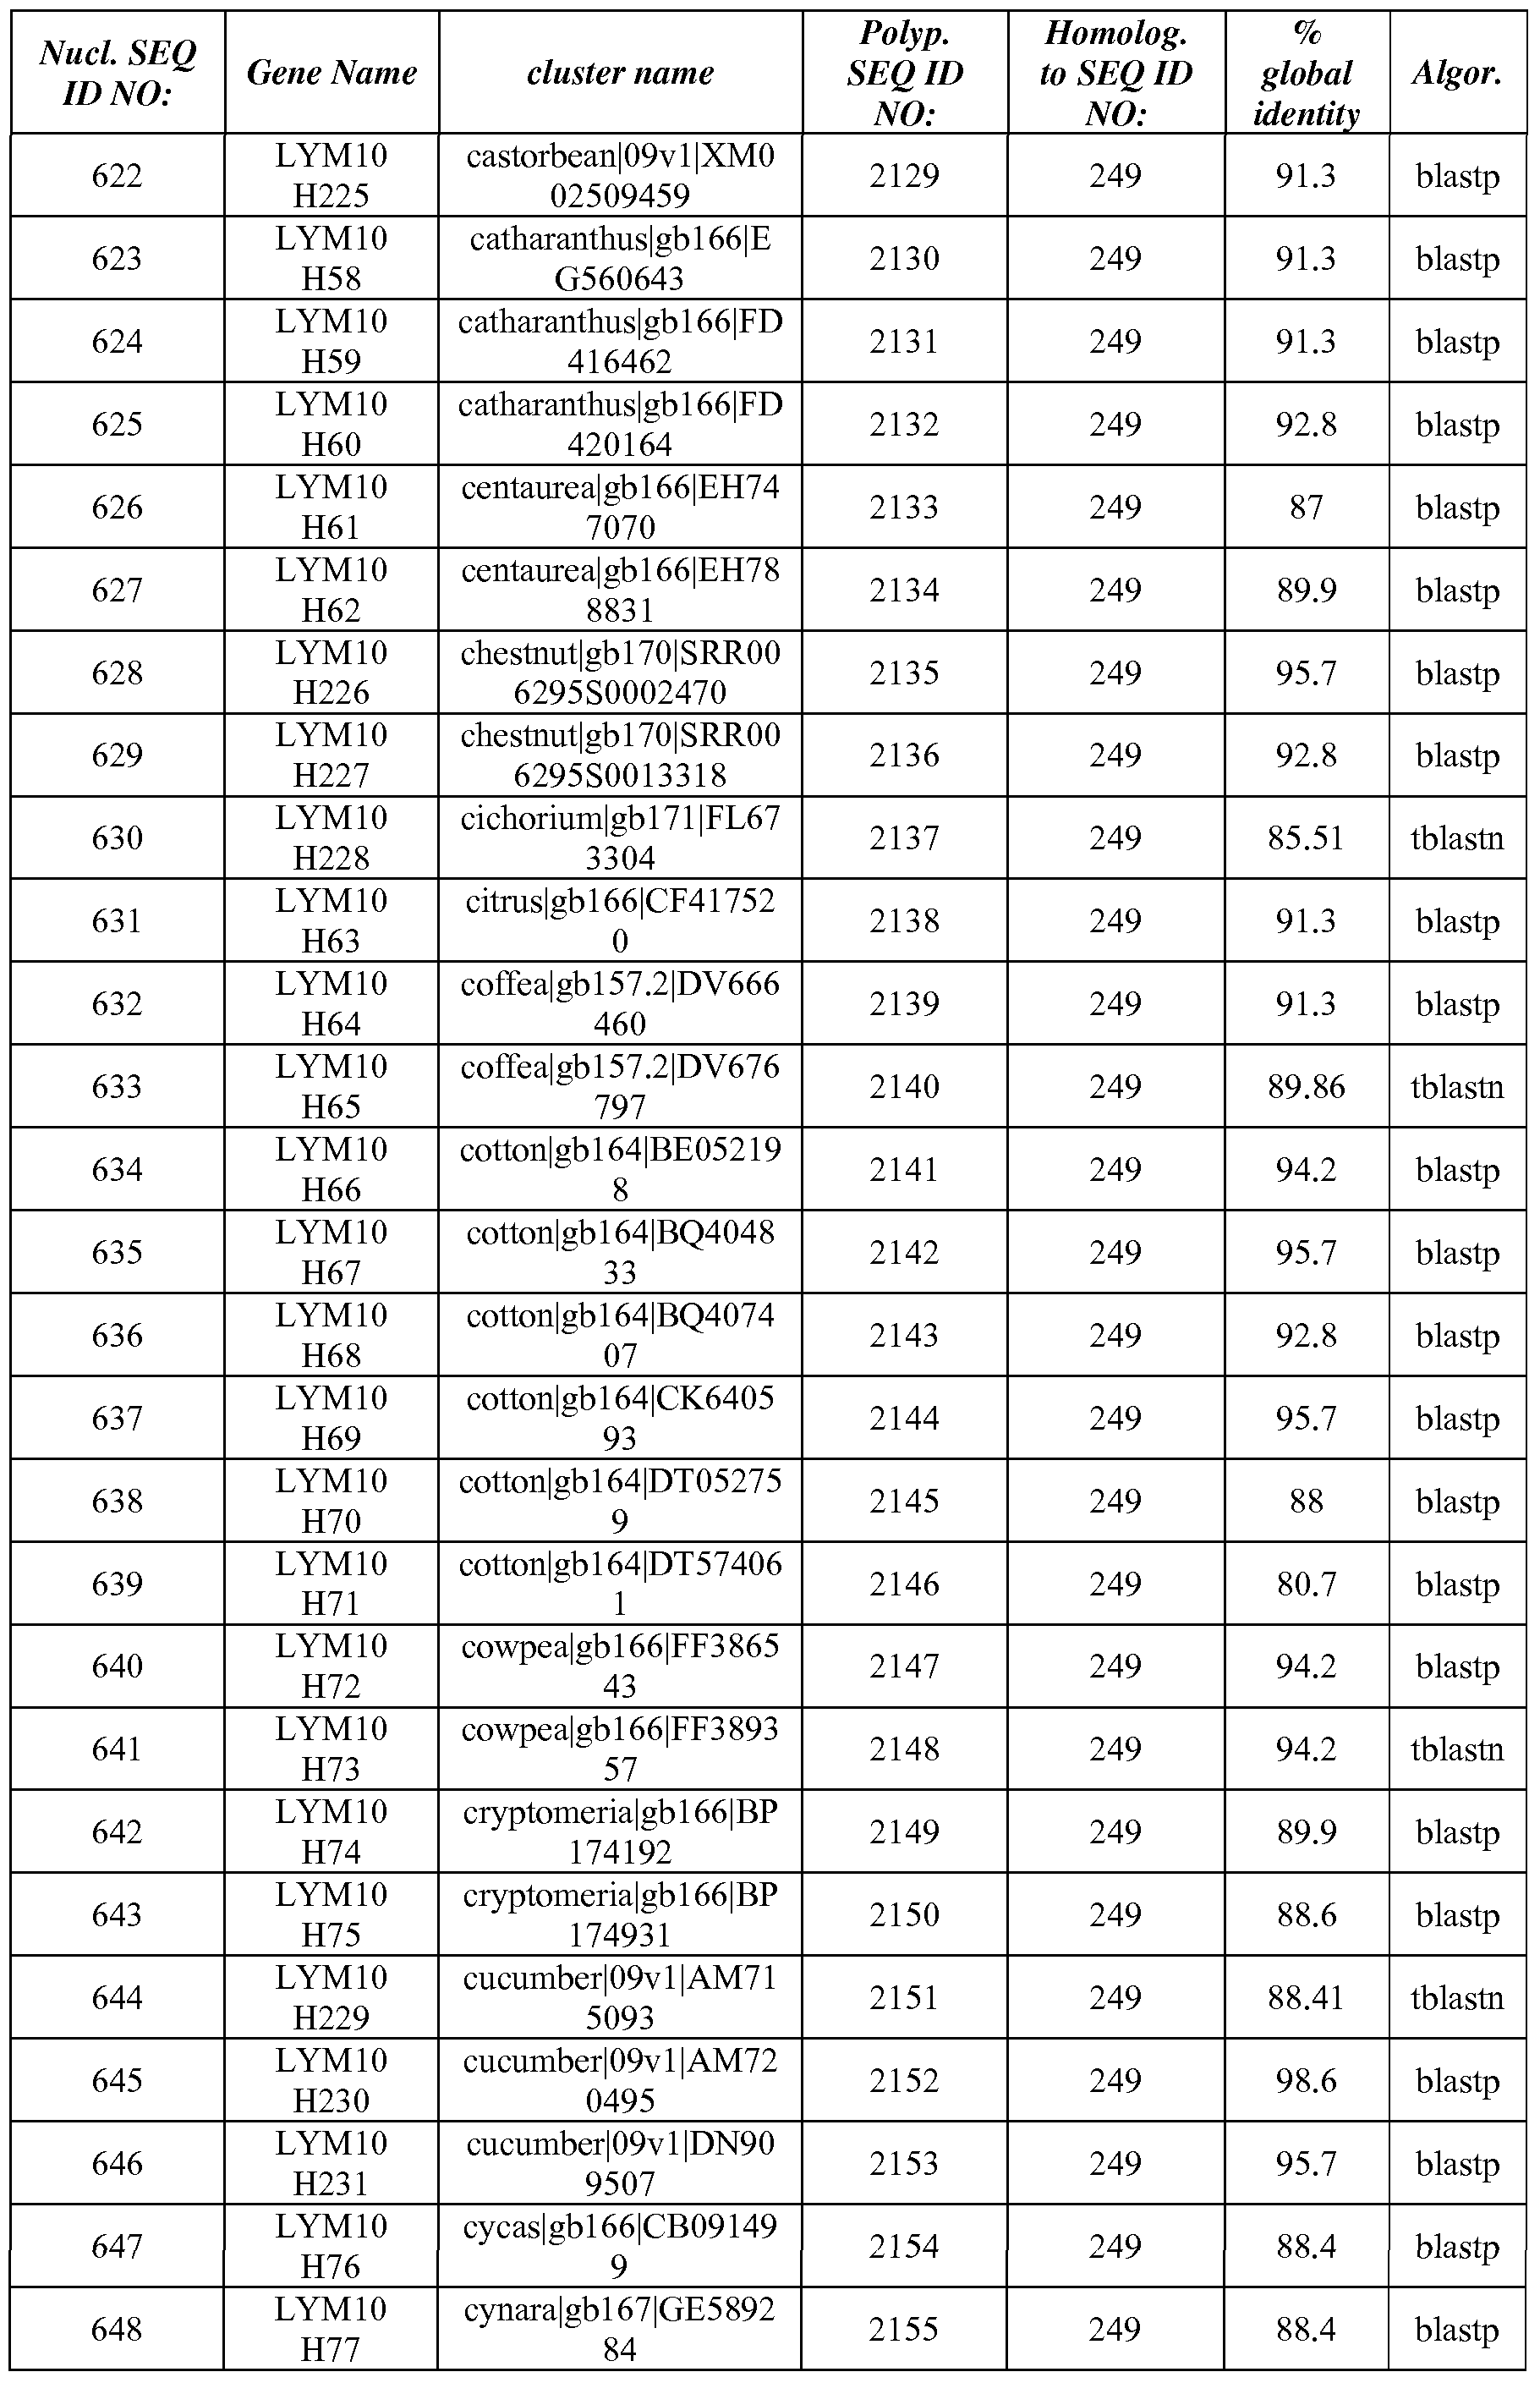


Claims
Priority Applications (15)
| Application Number | Priority Date | Filing Date | Title |
|---|---|---|---|
| EP21155351.6A EP3862433A3 (en) | 2009-03-02 | 2010-03-01 | Isolated polynucleotides and polypeptides, and methods of using same for increasing plant yield and/or agricultural characteristics |
| MX2016011426A MX351466B (en) | 2009-03-02 | 2010-03-01 | Isolated polynucleotides and polypeptides, and methods of using same for increasing plant yield and/or agricultural characteristics. |
| EP18202481.0A EP3460062B1 (en) | 2009-03-02 | 2010-03-01 | Isolated polynucleotides and polypeptides, and methods of using same for increasing plant yield and/or agricultural characteristics |
| MX2013015424A MX342016B (en) | 2009-03-02 | 2010-03-01 | Isolated polynucleotides and polypeptides, and methods of using same for increasing plant yield and/or agricultural characteristics. |
| US13/254,183 US8937220B2 (en) | 2009-03-02 | 2010-03-01 | Isolated polynucleotides and polypeptides, and methods of using same for increasing plant yield, biomass, vigor and/or growth rate of a plant |
| EP15188570.4A EP3000889B1 (en) | 2009-03-02 | 2010-03-01 | Isolated polynucleotides and polypeptides, and methods of using same for increasing plant yield and/or agricultural characteristics |
| MX2011009044A MX2011009044A (en) | 2009-03-02 | 2010-03-01 | Isolated polynucleotides and polypeptides, and methods of using same for increasing plant yield and/or agricultural characteristics. |
| EP10748403.2A EP2403956B1 (en) | 2009-03-02 | 2010-03-01 | Isolated polynucleotides and polypeptides, and methods of using same for increasing plant yield and/or agricultural characteristics |
| CA2753616A CA2753616C (en) | 2009-03-02 | 2010-03-01 | Isolated polynucleotides and polypeptides, and methods of using same for increasing plant yield and/or agricultural characteristics |
| BRPI1006257-2A BRPI1006257B1 (en) | 2009-03-02 | 2010-03-01 | INCOME METHOD, BIOMASS, GROWTH RATE, STRENGTH AND / OR OIL CONTENT OF A PLANT. |
| AU2010220157A AU2010220157C1 (en) | 2009-03-02 | 2010-03-01 | Isolated polynucleotides and polypeptides, and methods of using same for increasing plant yield and/or agricultural characteristics |
| ZA2011/07044A ZA201107044B (en) | 2009-03-02 | 2011-09-27 | Isolated polynucleotides and polypeptides and methods of using same for increasing plant yield and/or agricultural characteristics |
| US14/543,930 US9487795B2 (en) | 2009-03-02 | 2014-11-18 | Isolated polynucleotides and polypeptides, and methods of using same for increasing plant yield, biomass, oil content and/or growth rate |
| US15/238,739 US10597671B2 (en) | 2009-03-02 | 2016-08-17 | Isolated polynucleotides and polypeptides, and methods of using same for increasing plant yield, biomass, oil content and/or growth rate |
| US16/745,387 US20210087574A1 (en) | 2009-03-02 | 2020-01-17 | Isolated polynucleotides and polypeptides, and methods of using same for increasing plant yield, biomass, oil content and/or growth rate |
Applications Claiming Priority (6)
| Application Number | Priority Date | Filing Date | Title |
|---|---|---|---|
| US20245909P | 2009-03-02 | 2009-03-02 | |
| US61/202,459 | 2009-03-02 | ||
| US23134909P | 2009-08-05 | 2009-08-05 | |
| US61/231,349 | 2009-08-05 | ||
| US28218309P | 2009-12-28 | 2009-12-28 | |
| US61/282,183 | 2009-12-28 |
Related Child Applications (3)
| Application Number | Title | Priority Date | Filing Date |
|---|---|---|---|
| EP15188570.4A Previously-Filed-Application EP3000889B1 (en) | 2009-03-02 | 2010-03-01 | Isolated polynucleotides and polypeptides, and methods of using same for increasing plant yield and/or agricultural characteristics |
| US13/254,183 A-371-Of-International US8937220B2 (en) | 2009-03-02 | 2010-03-01 | Isolated polynucleotides and polypeptides, and methods of using same for increasing plant yield, biomass, vigor and/or growth rate of a plant |
| US14/543,930 Division US9487795B2 (en) | 2009-03-02 | 2014-11-18 | Isolated polynucleotides and polypeptides, and methods of using same for increasing plant yield, biomass, oil content and/or growth rate |
Publications (2)
| Publication Number | Publication Date |
|---|---|
| WO2010100595A2 true WO2010100595A2 (en) | 2010-09-10 |
| WO2010100595A9 WO2010100595A9 (en) | 2010-11-04 |
Family
ID=42710062
Family Applications (1)
| Application Number | Title | Priority Date | Filing Date |
|---|---|---|---|
| PCT/IB2010/050871 WO2010100595A2 (en) | 2009-03-02 | 2010-03-01 | Isolated polynucleotides and polypeptides, and methods of using same for increasing plant yield and/or agricultural characteristics |
Country Status (14)
| Country | Link |
|---|---|
| US (4) | US8937220B2 (en) |
| EP (4) | EP3000889B1 (en) |
| AR (1) | AR075773A1 (en) |
| AU (1) | AU2010220157C1 (en) |
| BR (1) | BRPI1006257B1 (en) |
| CA (3) | CA2999342C (en) |
| DK (1) | DK3460062T3 (en) |
| HR (1) | HRP20211209T1 (en) |
| HU (1) | HUE041819T2 (en) |
| LT (1) | LT3460062T (en) |
| MX (3) | MX2011009044A (en) |
| SI (1) | SI3460062T1 (en) |
| WO (1) | WO2010100595A2 (en) |
| ZA (1) | ZA201107044B (en) |
Cited By (40)
| Publication number | Priority date | Publication date | Assignee | Title |
|---|---|---|---|---|
| WO2012038528A1 (en) * | 2010-09-23 | 2012-03-29 | Genoplante-Valor | Plants resistant to fungal pathogens and methods for production thereof |
| WO2013027223A2 (en) * | 2011-08-23 | 2013-02-28 | Evogene Ltd. | Isolated polynucleotides and polypeptides, and methods of using same for increasing plant yield and/or agricultural characteristics |
| WO2012172556A3 (en) * | 2011-06-15 | 2013-05-02 | Yissum Research Development Company Of The Hebrew University Of Jerusalem Ltd. | Plants tolerant to abiotic stress |
| WO2013136273A2 (en) | 2012-03-13 | 2013-09-19 | University Of Guelph | Methods of increasing tolerance to heat stress and amino acid content of plants |
| US8847008B2 (en) | 2008-05-22 | 2014-09-30 | Evogene Ltd. | Isolated polynucleotides and polypeptides and methods of using same for increasing plant utility |
| US8921658B2 (en) | 2008-10-30 | 2014-12-30 | Evogene Ltd. | Isolated polynucleotides encoding a MAP65 polypeptide and methods of using same for increasing plant yield |
| US8937220B2 (en) | 2009-03-02 | 2015-01-20 | Evogene Ltd. | Isolated polynucleotides and polypeptides, and methods of using same for increasing plant yield, biomass, vigor and/or growth rate of a plant |
| US8952218B2 (en) | 2008-12-29 | 2015-02-10 | Evogene Ltd. | Polynucleotides, polypeptides encoded thereby, and methods of using same for increasing abiotic stress tolerance, biomass and/or yield in plants expressing same |
| US8962915B2 (en) | 2004-06-14 | 2015-02-24 | Evogene Ltd. | Isolated polypeptides, polynucleotides encoding same, transgenic plants expressing same and methods of using same |
| US9012728B2 (en) | 2004-06-14 | 2015-04-21 | Evogene Ltd. | Polynucleotides and polypeptides involved in plant fiber development and methods of using same |
| US9018445B2 (en) | 2008-08-18 | 2015-04-28 | Evogene Ltd. | Use of CAD genes to increase nitrogen use efficiency and low nitrogen tolerance to a plant |
| US9096865B2 (en) | 2009-06-10 | 2015-08-04 | Evogene Ltd. | Isolated polynucleotides and polypeptides, and methods of using same for increasing nitrogen use efficiency, yield, growth rate, vigor, biomass, oil content, and/or abiotic stress tolerance |
| US9303269B2 (en) | 2003-05-22 | 2016-04-05 | Evogene Ltd. | Methods of increasing abiotic stress tolerance and/or biomass in plants |
| US9309532B2 (en) * | 2012-07-26 | 2016-04-12 | Japan Science And Technology Agency | Iron-zinc binding control factor, and technique for improving iron deficiency tolerance of plant and enhancing iron and zinc accumulation in edible part thereof by controlling expression of novel iron-zinc binding control factor |
| US9328353B2 (en) | 2010-04-28 | 2016-05-03 | Evogene Ltd. | Isolated polynucleotides and polypeptides for increasing plant yield and/or agricultural characteristics |
| US9487796B2 (en) | 2005-08-15 | 2016-11-08 | Evogene Ltd. | Methods of increasing abiotic stress tolerance and/or biomass in plants and plants generated thereby |
| US9487793B2 (en) | 2007-04-09 | 2016-11-08 | Evogene Ltd. | Polynucleotides, polypeptides and methods for increasing oil content, growth rate and biomass of plants |
| US9493785B2 (en) | 2009-12-28 | 2016-11-15 | Evogene Ltd. | Isolated polynucleotides and polypeptides and methods of using same for increasing plant yield, biomass, growth rate, vigor, oil content, abiotic stress tolerance of plants and nitrogen use efficiency |
| US9518267B2 (en) | 2007-07-24 | 2016-12-13 | Evogene Ltd. | Polynucleotides, polypeptides encoded thereby, and methods of using same for increasing abiotic stress tolerance and/or biomass and/or yield in plants expressing same |
| US9551006B2 (en) | 2010-12-22 | 2017-01-24 | Evogene Ltd. | Isolated polynucleotides and polypeptides, and methods of using same for improving plant properties |
| US9574200B2 (en) | 2009-08-04 | 2017-02-21 | Evogene Ltd. | Polynucleotides and polypeptides for increasing desirable plant qualities |
| US9631000B2 (en) | 2006-12-20 | 2017-04-25 | Evogene Ltd. | Polynucleotides and polypeptides involved in plant fiber development and methods of using same |
| US9670501B2 (en) | 2007-12-27 | 2017-06-06 | Evogene Ltd. | Isolated polypeptides, polynucleotides useful for modifying water user efficiency, fertilizer use efficiency, biotic/abiotic stress tolerance, yield and biomass in plants |
| WO2017106274A1 (en) * | 2015-12-16 | 2017-06-22 | Syngenta Participations Ag | Genetic regions & genes associated with increased yield in plants |
| US9771598B2 (en) | 2012-12-26 | 2017-09-26 | Evogene Ltd. | Isolated polynucleotides and polypeptides, construct and plants comprising same and methods of using same for increasing nitrogen use efficiency of plants |
| US9834782B2 (en) | 2012-05-28 | 2017-12-05 | Evogene Ltd. | Isolated polynucleotides and polypeptides, and methods of using same for increasing plant yield and/or agricultural characteristics |
| US9890389B2 (en) | 2012-12-25 | 2018-02-13 | Evogene Ltd. | Isolated polynucleotides and polypeptides, and methods of using same for increasing nitrogen use efficiency of plants |
| US9920330B2 (en) | 2012-02-29 | 2018-03-20 | Evogene Ltd. | Isolated polynucleotides and polypeptides and methods of using same for increasing plant yield, biomass, growth rate, vigor, oil content, abiotic stress tolerance of plants and nitrogen use efficiency |
| US9920329B2 (en) | 2013-05-22 | 2018-03-20 | Evogene Ltd. | Isolated polynucleotides and polypeptides, and methods of using same for increasing plant yield and/or agricultural characteristics |
| US10000768B2 (en) | 2011-11-21 | 2018-06-19 | Syngenta Participations Ag | Compositions and methods for increasing nematode resistance in plants |
| US10006042B2 (en) | 2013-08-27 | 2018-06-26 | Evogene Ltd. | Isolated polynucleotides and polypeptides, and methods of using same for increasing plant yield and/or agricultural characteristics |
| US10113176B2 (en) | 2011-11-28 | 2018-10-30 | Evogene Ltd. | Isolated polynucleotides and polypeptides, and methods of using same for increasing nitrogen use efficiency, yield, growth rate, vigor, biomass, oil content, and/or abiotic stress tolerance |
| US10260073B2 (en) | 2011-12-28 | 2019-04-16 | Evogene Ltd. | Isolated polynucleotides and polypeptides, and methods of using same for increasing yield of plants |
| US10457954B2 (en) | 2010-08-30 | 2019-10-29 | Evogene Ltd. | Isolated polynucleotides and polypeptides, and methods of using same for increasing nitrogen use efficiency, yield, growth rate, vigor, biomass, oil content, and/or abiotic stress tolerance |
| US10760088B2 (en) | 2011-05-03 | 2020-09-01 | Evogene Ltd. | Isolated polynucleotides and polypeptides and methods of using same for increasing plant yield, biomass, growth rate, vigor, oil content, abiotic stress tolerance of plants and nitrogen use efficiency |
| CN111620935A (en) * | 2019-02-27 | 2020-09-04 | 中国农业大学 | Application of ZmCEP1 gene in regulation and control of corn kernel development |
| US10766935B2 (en) | 2015-12-28 | 2020-09-08 | Evogene Ltd. | Plant traits conferred by isolated polynucleotides and polypeptides |
| US10858403B2 (en) | 2014-08-27 | 2020-12-08 | Evogene Ltd. | Isolated polynucleotides and polypeptides, and methods of using same for increasing plant yield and/or agricultural characteristics |
| US10858665B2 (en) | 2012-08-27 | 2020-12-08 | Evogene Ltd. | Isolated polynucleotides, polypeptides and methods of using same for increasing abiotic stress tolerance, biomass and yield of plants |
| US10975383B2 (en) | 2014-05-28 | 2021-04-13 | Evogene Ltd. | Isolated polynucleotides, polypeptides and methods of using same for increasing abiotic stress tolerance, biomass and yield of plants |
Families Citing this family (9)
| Publication number | Priority date | Publication date | Assignee | Title |
|---|---|---|---|---|
| US9101100B1 (en) | 2014-04-30 | 2015-08-11 | Ceres, Inc. | Methods and materials for high throughput testing of transgene combinations |
| CN107557368A (en) * | 2016-06-30 | 2018-01-09 | 未名生物农业集团有限公司 | The plant and method that abiotic stress tolerance improves |
| CN108220402B (en) * | 2017-12-25 | 2020-07-07 | 山东省农业科学院蔬菜花卉研究所 | Method for identifying pedigree relationship between Chinese cabbage germplasm and variety |
| CN109652425B (en) * | 2019-01-08 | 2022-10-04 | 宁波大学 | Application of rice OsHIR3 gene and method for obtaining disease-resistant rice |
| CN111205357B (en) * | 2020-02-28 | 2022-09-06 | 中国科学院遗传与发育生物学研究所 | Wheat stripe rust resistance related protein TaWLT14.2, coding gene and application thereof |
| CN112552383B (en) * | 2020-12-07 | 2022-03-22 | 中国科学院遗传与发育生物学研究所 | Application of transcription factor HINGE1 in regulation and control of plant nitrogen-phosphorus homeostasis |
| CN114644692B (en) * | 2020-12-17 | 2023-08-11 | 中国农业大学 | Method for creating drought-sensitive corn germplasm by site-directed mutagenesis and application thereof |
| CN114539372A (en) * | 2021-04-06 | 2022-05-27 | 中国科学院遗传与发育生物学研究所 | Rice tillering angle control gene LAZY2 and application thereof |
| CN115109786B (en) * | 2022-06-29 | 2023-07-21 | 中国水稻研究所 | Application of rice OsHPP08 gene in regulation and control of rice blast resistance |
Citations (51)
| Publication number | Priority date | Publication date | Assignee | Title |
|---|---|---|---|---|
| US3791932A (en) | 1971-02-10 | 1974-02-12 | Akzona Inc | Process for the demonstration and determination of reaction components having specific binding affinity for each other |
| US3839153A (en) | 1970-12-28 | 1974-10-01 | Akzona Inc | Process for the detection and determination of specific binding proteins and their corresponding bindable substances |
| US3850578A (en) | 1973-03-12 | 1974-11-26 | H Mcconnell | Process for assaying for biologically active molecules |
| US3850752A (en) | 1970-11-10 | 1974-11-26 | Akzona Inc | Process for the demonstration and determination of low molecular compounds and of proteins capable of binding these compounds specifically |
| US3853987A (en) | 1971-09-01 | 1974-12-10 | W Dreyer | Immunological reagent and radioimmuno assay |
| US3867517A (en) | 1971-12-21 | 1975-02-18 | Abbott Lab | Direct radioimmunoassay for antigens and their antibodies |
| US3879262A (en) | 1972-05-11 | 1975-04-22 | Akzona Inc | Detection and determination of haptens |
| US3901654A (en) | 1971-06-21 | 1975-08-26 | Biological Developments | Receptor assays of biologically active compounds employing biologically specific receptors |
| US3935074A (en) | 1973-12-17 | 1976-01-27 | Syva Company | Antibody steric hindrance immunoassay with two antibodies |
| US3984533A (en) | 1975-11-13 | 1976-10-05 | General Electric Company | Electrophoretic method of detecting antigen-antibody reaction |
| US3996345A (en) | 1974-08-12 | 1976-12-07 | Syva Company | Fluorescence quenching with immunological pairs in immunoassays |
| US4034074A (en) | 1974-09-19 | 1977-07-05 | The Board Of Trustees Of Leland Stanford Junior University | Universal reagent 2-site immunoradiometric assay using labelled anti (IgG) |
| US4098876A (en) | 1976-10-26 | 1978-07-04 | Corning Glass Works | Reverse sandwich immunoassay |
| EP0067553A2 (en) | 1981-05-27 | 1982-12-22 | National Research Council Of Canada | An RNA plant virus vector or portion thereof, a method of construction thereof, and a method of producing a gene derived product therefrom |
| EP0194809A1 (en) | 1985-03-07 | 1986-09-17 | Lubrizol Genetics Inc. | RNA transformation vector |
| US4666828A (en) | 1984-08-15 | 1987-05-19 | The General Hospital Corporation | Test for Huntington's disease |
| US4683202A (en) | 1985-03-28 | 1987-07-28 | Cetus Corporation | Process for amplifying nucleic acid sequences |
| WO1987006261A1 (en) | 1986-04-11 | 1987-10-22 | Diatech Limited | Recombinant - rna packaging system |
| JPS6314693A (en) | 1986-07-04 | 1988-01-21 | Sumitomo Chem Co Ltd | Plant virus rna vector |
| EP0278667A2 (en) | 1987-02-09 | 1988-08-17 | Mycogen Plant Science, Inc. | Hybrid RNA virus |
| US4801531A (en) | 1985-04-17 | 1989-01-31 | Biotechnology Research Partners, Ltd. | Apo AI/CIII genomic polymorphisms predictive of atherosclerosis |
| US4855237A (en) | 1983-09-05 | 1989-08-08 | Teijin Limited | Double-stranded DNA having sequences complementary to a single-stranded DNA and derived from a bean golden mosaic virus |
| US4879219A (en) | 1980-09-19 | 1989-11-07 | General Hospital Corporation | Immunoassay utilizing monoclonal high affinity IgM antibodies |
| US4945050A (en) | 1984-11-13 | 1990-07-31 | Cornell Research Foundation, Inc. | Method for transporting substances into living cells and tissues and apparatus therefor |
| US5011771A (en) | 1984-04-12 | 1991-04-30 | The General Hospital Corporation | Multiepitopic immunometric assay |
| US5187267A (en) | 1990-06-19 | 1993-02-16 | Calgene, Inc. | Plant proteins, promoters, coding sequences and use |
| US5192659A (en) | 1989-08-25 | 1993-03-09 | Genetype Ag | Intron sequence analysis method for detection of adjacent and remote locus alleles as haplotypes |
| WO1993007278A1 (en) | 1991-10-04 | 1993-04-15 | Ciba-Geigy Ag | Synthetic dna sequence having enhanced insecticidal activity in maize |
| US5268463A (en) | 1986-11-11 | 1993-12-07 | Jefferson Richard A | Plant promoter α-glucuronidase gene construct |
| US5272057A (en) | 1988-10-14 | 1993-12-21 | Georgetown University | Method of detecting a predisposition to cancer by the use of restriction fragment length polymorphism of the gene for human poly (ADP-ribose) polymerase |
| US5281521A (en) | 1992-07-20 | 1994-01-25 | The Trustees Of The University Of Pennsylvania | Modified avidin-biotin technique |
| US5316931A (en) | 1988-02-26 | 1994-05-31 | Biosource Genetics Corp. | Plant viral vectors having heterologous subgenomic promoters for systemic expression of foreign genes |
| US5399680A (en) | 1991-05-22 | 1995-03-21 | The Salk Institute For Biological Studies | Rice chitinase promoter |
| US5464765A (en) | 1989-06-21 | 1995-11-07 | Zeneca Limited | Transformation of plant cells |
| US5466785A (en) | 1990-04-12 | 1995-11-14 | Ciba-Geigy Corporation | Tissue-preferential promoters |
| US5569597A (en) | 1985-05-13 | 1996-10-29 | Ciba Geigy Corp. | Methods of inserting viral DNA into plant material |
| US5604121A (en) | 1991-08-27 | 1997-02-18 | Agricultural Genetics Company Limited | Proteins with insecticidal properties against homopteran insects and their use in plant protection |
| US5608149A (en) | 1990-06-18 | 1997-03-04 | Monsanto Company | Enhanced starch biosynthesis in tomatoes |
| US5608142A (en) | 1986-12-03 | 1997-03-04 | Agracetus, Inc. | Insecticidal cotton plants |
| US5608144A (en) | 1994-08-12 | 1997-03-04 | Dna Plant Technology Corp. | Plant group 2 promoters and uses thereof |
| US5659026A (en) | 1995-03-24 | 1997-08-19 | Pioneer Hi-Bred International | ALS3 promoter |
| US5693507A (en) | 1988-09-26 | 1997-12-02 | Auburn University | Genetic engineering of plant chloroplasts |
| WO2001023884A1 (en) | 1999-09-27 | 2001-04-05 | Monsanto Technology Llc | Methods for determining oils in seeds |
| WO2004081173A2 (en) | 2003-03-12 | 2004-09-23 | Evogene Ltd. | Nucleotide sequences regulating gene expression and constructs and methods utilizing same |
| WO2004104162A2 (en) | 2003-05-22 | 2004-12-02 | Evogene Ltd. | Methods of increasing abiotic stress tolerance and/or biomass in plants and plants generated thereby |
| WO2005121364A2 (en) | 2004-06-14 | 2005-12-22 | Evogene Ltd. | Polynucleotides and polypeptides involved in plant fiber development and methods of using same |
| WO2007020638A2 (en) | 2005-08-15 | 2007-02-22 | Evogene Ltd. | Methods of increasing abiotic stress tolerance and/or biomass in plants and plants generated thereby |
| WO2007049275A2 (en) | 2005-10-24 | 2007-05-03 | Evogene Ltd. | Isolated polypeptides, polynucleotides encoding same, transgenic plants expressing same and methods of using same |
| WO2008075364A2 (en) | 2006-12-20 | 2008-06-26 | Evogene Ltd. | Polynucleotides and polypeptides involved in plant fiber development and methods of using same |
| WO2008122980A2 (en) | 2007-04-09 | 2008-10-16 | Evogene Ltd. | Polynucleotides, polypeptides and methods for increasing oil content, growth rate and biomass of plants |
| WO2009013750A2 (en) | 2007-07-24 | 2009-01-29 | Evogene Ltd. | Polynucleotides, polypeptides encoded thereby, and methods of using same for increasing abiotic stress tolerance and/or biomass and/or yield in plants expressing same |
Family Cites Families (143)
| Publication number | Priority date | Publication date | Assignee | Title |
|---|---|---|---|---|
| US5504200A (en) | 1983-04-15 | 1996-04-02 | Mycogen Plant Science, Inc. | Plant gene expression |
| US5420034A (en) | 1986-07-31 | 1995-05-30 | Calgene, Inc. | Seed-specific transcriptional regulation |
| US4943674A (en) | 1987-05-26 | 1990-07-24 | Calgene, Inc. | Fruit specific transcriptional factors |
| US5495070A (en) | 1988-10-04 | 1996-02-27 | Agracetus, Inc. | Genetically engineering cotton plants for altered fiber |
| US5597718A (en) | 1988-10-04 | 1997-01-28 | Agracetus | Genetically engineering cotton plants for altered fiber |
| US6329570B1 (en) | 1989-07-19 | 2001-12-11 | Calgene, Llc | Cotton modification using ovary-tissue transcriptional factors |
| US5859330A (en) | 1989-12-12 | 1999-01-12 | Epitope, Inc. | Regulated expression of heterologous genes in plants and transgenic fruit with a modified ripening phenotype |
| PT100930B (en) | 1991-10-04 | 2004-02-27 | Univ North Carolina State | TRANSGENIC PLANTS RESISTANT TO PATHOGENIC AGENTS AND METHOD FOR THEIR PRODUCTION |
| US5356816A (en) | 1991-11-19 | 1994-10-18 | Board Of Trustees Operating Michigan State University | Method and compositions using polypeptides of arabidopsis thaliana |
| US5296462A (en) | 1992-11-19 | 1994-03-22 | Board Of Trustees Operating Michigan State University | Method and compositions using polypeptides of arabidopsis thaliana |
| US5521708A (en) | 1992-11-25 | 1996-05-28 | Canon Information & Systems, Inc. | Correlated color temperature detector |
| ZA939767B (en) | 1993-01-21 | 1994-09-14 | Univ North Carolina State | Nematode-resistant transgenic plants |
| AU7925094A (en) | 1993-09-30 | 1995-04-18 | Agracetus, Inc. | Transgenic cotton plants producing heterologous peroxidase |
| US5598515A (en) | 1994-01-10 | 1997-01-28 | Gen Tech Corp. | System and method for reconstructing surface elements of solid objects in a three-dimensional scene from a plurality of two dimensional images of the scene |
| US7262055B2 (en) | 1998-08-25 | 2007-08-28 | Gendaq Limited | Regulated gene expression in plants |
| US6310194B1 (en) | 1994-09-26 | 2001-10-30 | Carnegie Institution Of Washington | Plant fatty acid hydroxylases |
| US5961466A (en) | 1995-01-03 | 1999-10-05 | Omnicorder Technologies, Inc. | Method of detection of cancerous lesions by their effect on the spatial distribution of modulation of temperature and homogeneity of tissue |
| CA2221747A1 (en) | 1995-06-07 | 1996-12-19 | Kevin Mcbride | Cotton fiber transcriptional factors |
| JPH0967270A (en) | 1995-08-31 | 1997-03-11 | Res Dev Corp Of Japan | Prevention and therapy for opacity of crystalline lens and medicine therefor |
| US6084153A (en) | 1996-02-14 | 2000-07-04 | The Governors Of The University Of Alberta | Plants having enhanced nitrogen assimilation/metabolism |
| JPH1094392A (en) | 1996-09-20 | 1998-04-14 | Nisshinbo Ind Inc | Cotton gene |
| CA2239766A1 (en) | 1996-10-24 | 1998-04-30 | Japan Tobacco Inc. | Method for controlling water content of plant |
| IL119831A (en) | 1996-12-15 | 2002-12-01 | Cognitens Ltd | Apparatus and method for 3d surface geometry reconstruction |
| CA2278796A1 (en) | 1997-01-21 | 1998-07-23 | Monsanto Company | Strawberry promoters and genes |
| WO1999010498A2 (en) | 1997-08-27 | 1999-03-04 | Pioneer Hi-Bred International, Inc. | Genes encoding enzymes for lignin biosynthesis and uses thereof |
| US6201541B1 (en) | 1997-12-11 | 2001-03-13 | Cognitens, Ltd. | System and method for “Stitching” a plurality of reconstructions of three-dimensional surface features of object(s) in a scene defined relative to respective coordinate systems to relate them to a common coordinate system |
| US20090093620A1 (en) | 2000-09-05 | 2009-04-09 | David Kovalic | Annotated Plant Genes |
| ATE528401T1 (en) | 1998-08-04 | 2011-10-15 | Cropdesign Nv | GENES INVOLVED IN TOLERANCE TO ENVIRONMENTAL STRESS |
| US6313375B1 (en) | 1998-08-13 | 2001-11-06 | Pioneer Hi-Bred International, Inc. | Maize aquaporins and uses thereof |
| US6313376B1 (en) | 1998-08-14 | 2001-11-06 | Pioneer Hi-Bred International, Inc. | Maize aquaporins and uses thereof |
| US7511190B2 (en) | 1999-11-17 | 2009-03-31 | Mendel Biotechnology, Inc. | Polynucleotides and polypeptides in plants |
| US6717034B2 (en) | 2001-03-30 | 2004-04-06 | Mendel Biotechnology, Inc. | Method for modifying plant biomass |
| JP3178672B2 (en) | 1998-10-14 | 2001-06-25 | 農林水産省国際農林水産業研究センター所長 | Environmental stress tolerant plant |
| EP1033405A3 (en) | 1999-02-25 | 2001-08-01 | Ceres Incorporated | Sequence-determined DNA fragments and corresponding polypeptides encoded thereby |
| WO2000066610A1 (en) | 1999-04-30 | 2000-11-09 | Agritope, Inc. | Apple promoters for expression of transgenes in plants |
| US20110214206A1 (en) | 1999-05-06 | 2011-09-01 | La Rosa Thomas J | Nucleic acid molecules and other molecules associated with plants |
| US20100293669A2 (en) | 1999-05-06 | 2010-11-18 | Jingdong Liu | Nucleic Acid Molecules and Other Molecules Associated with Plants and Uses Thereof for Plant Improvement |
| US20040031072A1 (en) | 1999-05-06 | 2004-02-12 | La Rosa Thomas J. | Soy nucleic acid molecules and other molecules associated with transcription plants and uses thereof for plant improvement |
| US20030233670A1 (en) | 2001-12-04 | 2003-12-18 | Edgerton Michael D. | Gene sequences and uses thereof in plants |
| US8877916B2 (en) | 2000-04-26 | 2014-11-04 | Ceres, Inc. | Promoter, promoter control elements, and combinations, and uses thereof |
| US6559363B1 (en) | 1999-07-05 | 2003-05-06 | Toyo Boseki Kabushiki Kaisha | Cotton plants with improved cotton fiber characteristics and method for producing cotton fibers from these cotton plants |
| EP1225231A4 (en) | 1999-07-19 | 2003-01-29 | Japan Science & Tech Corp | Environmental stress resistance gene |
| US6472588B1 (en) | 1999-09-10 | 2002-10-29 | Texas Tech University | Transgenic cotton plants with altered fiber characteristics transformed with a sucrose phosphate synthase nucleic acid |
| US6359196B1 (en) | 1999-09-23 | 2002-03-19 | Finn Lok | Germination-specific plant promoters |
| US6403862B1 (en) | 1999-09-24 | 2002-06-11 | Pioneer Hi-Bred International, Inc. | Seed-preferred promoter from maize |
| IT1313518B1 (en) | 1999-10-22 | 2002-07-24 | Meta Instr S R L | METHODS AND EQUIPMENT FOR MEASURING THE THREE-DIMENSIONAL DISTRIBUTION OF TEMPERATURES INSIDE DIELECTRIC MEDIA. |
| US6407315B1 (en) | 1999-11-02 | 2002-06-18 | Pioneer Hi-Bred International, Inc. | Seed-preferred promoter from barley |
| US6828476B1 (en) | 1999-12-02 | 2004-12-07 | The Regents Of The University Of California | Cotton transcription factors and their uses |
| GB2358752A (en) | 2000-01-31 | 2001-08-01 | Tricorder Technology Plc | Surface or volumetric data processing method and apparatus |
| JP3807721B2 (en) | 2000-02-21 | 2006-08-09 | シャープ株式会社 | Image synthesizer |
| DE60126771T2 (en) | 2000-04-07 | 2007-11-15 | Basf Plant Science Gmbh | STRESS-COUPLED GTP-BINDING PROTEIN AND ITS USE IN PLANTS |
| US20110131679A2 (en) * | 2000-04-19 | 2011-06-02 | Thomas La Rosa | Rice Nucleic Acid Molecules and Other Molecules Associated with Plants and Uses Thereof for Plant Improvement |
| US7834146B2 (en) | 2000-05-08 | 2010-11-16 | Monsanto Technology Llc | Recombinant polypeptides associated with plants |
| US20040181830A1 (en) | 2001-05-07 | 2004-09-16 | Kovalic David K. | Nucleic acid molecules and other molecules associated with plants and uses thereof for plant improvement |
| US6701081B1 (en) | 2000-06-06 | 2004-03-02 | Air Controls, Inc. | Dual camera mount for stereo imaging |
| WO2002016655A2 (en) | 2000-08-24 | 2002-02-28 | The Scripps Research Institute | Stress-regulated genes of plants, transgenic plants containing same, and methods of use |
| TW519485B (en) | 2000-09-20 | 2003-02-01 | Ind Tech Res Inst | Infrared 3D scanning system |
| US20020170088A1 (en) | 2000-11-03 | 2002-11-14 | The Regents Of The University Of California | Novel auxin binding proteins and uses thereof |
| JP2002164066A (en) | 2000-11-22 | 2002-06-07 | Mitsubishi Heavy Ind Ltd | Stacked heat exchanger |
| CA2430642A1 (en) | 2000-12-01 | 2003-02-20 | John B. Ohlrogge | Plant seed specific promoters |
| EP1349446B1 (en) | 2000-12-08 | 2013-01-23 | Commonwealth Scientific And Industrial Research Organisation | Modification of sucrose synthase gene expression in plant tissue and uses therefor |
| US7214786B2 (en) * | 2000-12-14 | 2007-05-08 | Kovalic David K | Nucleic acid molecules and other molecules associated with plants and uses thereof for plant improvement |
| US6801257B2 (en) | 2001-01-12 | 2004-10-05 | Cognitens Ltd. | Optical three-dimensional digital imaging and mensuration system for industrial applications |
| EP1395108B1 (en) | 2001-03-16 | 2012-01-11 | BASF Plant Science GmbH | Sugar and lipid metabolism regulators in plants |
| JP4739569B2 (en) | 2001-04-09 | 2011-08-03 | パナソニック株式会社 | Driving assistance device |
| US8078262B2 (en) | 2001-04-16 | 2011-12-13 | The Johns Hopkins University | Method for imaging and spectroscopy of tumors and determination of the efficacy of anti-tumor drug therapies |
| AU2002302595B2 (en) | 2001-05-03 | 2006-07-13 | Vlaams Interuniversitair Instituut Voor Biotechnologie Vzw | Freeze-tolerant eukaryotic cells |
| WO2003020025A2 (en) | 2001-08-31 | 2003-03-13 | The Dow Chemical Company | Nucleic acid compositions conferring insect control in plants |
| US7038111B2 (en) | 2001-09-06 | 2006-05-02 | The Arizona Board Of Regents | Method for increasing stress tolerance in plants |
| DE10150918C2 (en) | 2001-10-18 | 2003-10-09 | Inframedic Ag | Process for the evaluation of thermal images of a female or male breast |
| US20050108791A1 (en) | 2001-12-04 | 2005-05-19 | Edgerton Michael D. | Transgenic plants with improved phenotypes |
| EP1572927A4 (en) | 2002-04-08 | 2007-10-17 | Pioneer Hi Bred Int | Enhanced silk exsertion under stress |
| BR0311449A (en) | 2002-05-08 | 2005-03-15 | Basf Plant Science Gmbh | A process for increasing the total oil content in a plant organism or a tissue, organ, part, cell, or propagating material, transgenic expression cassette, transgenic vector, transgenic plant organism, or tissue, organ, part, cell, or material. propagation, and use of them |
| US20030221218A1 (en) | 2002-05-17 | 2003-11-27 | The Regents Of The University Of California | Bioengineering cotton fiber properties |
| JP2005185101A (en) * | 2002-05-30 | 2005-07-14 | National Institute Of Agrobiological Sciences | VEGETABLE FULL-LENGTH cDNA AND UTILIZATION THEREOF |
| AU2003246361B2 (en) | 2002-07-10 | 2008-04-10 | Basf Plant Science Gmbh | Use of a gene for increasing the oil content in plants |
| WO2004035798A2 (en) | 2002-10-18 | 2004-04-29 | Cropdesign N.V. | Identification of e2f target genes and uses thereof |
| AU2002351325A1 (en) | 2002-12-04 | 2004-06-30 | G. Banu | Transgenic maize with enhanced phenotype |
| CN100343279C (en) * | 2002-12-31 | 2007-10-17 | 德里大学 | A novel gene OSISAP1 of rice confers tolerance to stresses and a method thereof |
| AU2004230490C1 (en) | 2003-04-15 | 2012-08-16 | Basf Plant Science Gmbh | Nucleic acid sequences encoding proteins associated with abiotic stress response and plant cells and plants with increased tolerance to environmental stress |
| DE602004013569D1 (en) | 2003-04-16 | 2008-06-19 | Basf Plant Science Gmbh | N PLANTS |
| US7554007B2 (en) | 2003-05-22 | 2009-06-30 | Evogene Ltd. | Methods of increasing abiotic stress tolerance and/or biomass in plants |
| EP1636333A4 (en) | 2003-06-19 | 2007-10-24 | Evogene Ltd | Nucleotide sequences for regulating gene expression in plant trichomes and constructs and methods utilizing same |
| JP4452876B2 (en) | 2003-08-06 | 2010-04-21 | 国立大学法人 香川大学 | Control of seed yield and dry weight of plants by gene transfer using LKP2 partial cDNA |
| US7884261B2 (en) | 2004-06-30 | 2011-02-08 | CERES,Inc. | Nucleotide sequences and corresponding polypeptides conferring modulated plant growth rate and biomass in plants |
| US7803983B2 (en) | 2004-06-30 | 2010-09-28 | Ceres, Inc. | Nucleotide sequences and corresponding polypeptides conferring modulated plant growth rate and biomass in plants |
| US20060048240A1 (en) | 2004-04-01 | 2006-03-02 | Nickolai Alexandrov | Sequence-determined DNA fragments and corresponding polypeptides encoded thereby |
| US7989676B2 (en) | 2006-08-31 | 2011-08-02 | Ceres, Inc. | Nucleotide sequences and corresponding polypeptides conferring modulated plant characteristics |
| US20060150283A1 (en) | 2004-02-13 | 2006-07-06 | Nickolai Alexandrov | Sequence-determined DNA fragments and corresponding polypeptides encoded thereby |
| US20060143729A1 (en) | 2004-06-30 | 2006-06-29 | Ceres, Inc. | Nucleotide sequences and polypeptides encoded thereby useful for modifying plant characteristics |
| US20060107345A1 (en) | 2003-09-30 | 2006-05-18 | Nickolai Alexandrov | Sequence-determined DNA fragments and corresponding polypeptides encoded thereby |
| US20050096515A1 (en) | 2003-10-23 | 2005-05-05 | Geng Z. J. | Three-dimensional surface image guided adaptive therapy system |
| WO2005084331A2 (en) | 2004-03-01 | 2005-09-15 | Syngenta Participations Ag | Sorghum gene expression profiling |
| AU2005229157B2 (en) | 2004-03-31 | 2011-07-21 | Commonwealth Scientific And Industrial Research Organisation | Genes involved in plant fibre development |
| US8049069B2 (en) | 2004-03-31 | 2011-11-01 | Commonwealth Scientific And Industrial Research Organisation | Genes involved in plant fibre development |
| BRPI0510082A (en) | 2004-04-23 | 2007-10-16 | Ceres Inc | nucleotide sequences and polypeptides encoded by them useful for modifying the efficiency characteristics of nitrogen use in plants |
| CA2564202A1 (en) | 2004-05-05 | 2005-11-17 | The Royal Veterinary And Agricultural University | Ammonium/ammonia transporter |
| JP2008505684A (en) | 2004-07-07 | 2008-02-28 | リアル イメージング リミテッド | 3D thermal breast cancer detection |
| BRPI0517294A (en) | 2004-10-22 | 2008-10-07 | Agrinomics Llc | generation of plants with altered oil content |
| WO2006076099A2 (en) | 2004-12-08 | 2006-07-20 | Ceres, Inc. | Nucleotide sequences and corresponding polypeptides conferring modulated plant size and biomass in plants |
| CN101442902B (en) | 2004-12-21 | 2013-09-18 | 孟山都技术有限公司 | Preparation method of transgenic plants with enhanced agronomic traits |
| US20080148432A1 (en) | 2005-12-21 | 2008-06-19 | Mark Scott Abad | Transgenic plants with enhanced agronomic traits |
| US20070124833A1 (en) | 2005-05-10 | 2007-05-31 | Abad Mark S | Genes and uses for plant improvement |
| BRPI0610212A2 (en) | 2005-05-26 | 2010-06-01 | Monsanto Technology Llc | oil elevation in monocotiledÈneas plants |
| WO2006138012A1 (en) | 2005-06-17 | 2006-12-28 | Ceres Inc. | P450 substrates and methods related thereto |
| US20080301839A1 (en) | 2005-08-30 | 2008-12-04 | Ravanello Monica P | Transgenic plants with enhanced agronomic traits |
| BRPI0706526A2 (en) | 2006-01-13 | 2011-03-29 | Ceres Inc | nucleotide sequences and corresponding polypeptides that confer improved nitrogen efficiency in plants |
| EP2333078A3 (en) | 2006-03-24 | 2012-01-04 | BASF Plant Science GmbH | Proteins associated with abiotic stress response and homologs |
| EP2441844A1 (en) | 2006-03-31 | 2012-04-18 | BASF Plant Science GmbH | Plants having enhanced yield-related traits and a method for making the same |
| US8362322B2 (en) | 2006-10-27 | 2013-01-29 | Ceres, Inc. | Modulating lignin in plants |
| EP2175714A4 (en) | 2007-07-10 | 2011-01-26 | Monsanto Technology Llc | Transgenic plants with enhanced agronomic traits |
| US8362325B2 (en) | 2007-10-03 | 2013-01-29 | Ceres, Inc. | Nucleotide sequences and corresponding polypeptides conferring modulated plant characteristics |
| WO2009083958A2 (en) | 2007-12-27 | 2009-07-09 | Evogene Ltd. | Isolated polypeptides, polynucleotides useful for modifying water user efficiency, fertilizer use efficiency, biotic/abiotic stress tolerance, yield and biomass in plants |
| EP2238572B1 (en) | 2007-12-31 | 2014-07-09 | Real Imaging Ltd. | Method apparatus and system for analyzing thermal images |
| CA2710939C (en) | 2007-12-31 | 2016-11-08 | Real Imaging Ltd. | System and method for registration of imaging data |
| US10299686B2 (en) | 2008-03-28 | 2019-05-28 | Real Imaging Ltd. | Method apparatus and system for analyzing images |
| TR201808744T4 (en) | 2008-05-22 | 2018-07-23 | Evogene Ltd | Isolated polynucleotides and polypeptides and methods for their use to enhance plant benefit. |
| EP2297336A1 (en) | 2008-05-29 | 2011-03-23 | Vib Vzw | Minichromosome maintenance complex interacting protein involved in cancer |
| BR122021014193B1 (en) | 2008-08-18 | 2022-08-30 | Evogene Ltd | METHOD TO INCREASE NITROGEN USE EFFICIENCY, FERTILIZER USE EFFICIENCY, PRODUCTION, GROWTH RATE, VIGOR, BIOMASS AND/OR STRESS TOLERANCE DUE TO A PLANT NUTRIENT DEFICIENCY |
| BRPI0914522B1 (en) | 2008-10-30 | 2019-04-02 | Evogene Ltd | METHOD FOR INCREASING YIELD, BIOMASS, GROWTH RATE, STRENGTH, OIL OTEOR, AND / OR EFFICIENCY OF NITROGEN USE OF A PLANT |
| AR074925A1 (en) | 2008-12-29 | 2011-02-23 | Evogene Ltd | POLINUCLEOTIDES, CODED POLYPEPTIDES, AND METHODS TO USE THEM TO MODULATE TOLERANCE TO ABIOTIC STRESS, BIOMASS AND / OR PERFORMANCE IN PLANTS THAT EXPRESS THEM |
| WO2010100595A2 (en) | 2009-03-02 | 2010-09-10 | Evogene Ltd. | Isolated polynucleotides and polypeptides, and methods of using same for increasing plant yield and/or agricultural characteristics |
| EP2440033B1 (en) | 2009-06-10 | 2017-03-15 | Evogene Ltd. | Isolated polynucleotides and polypeptides, and methods of using same for increasing nitrogen use efficiency, yield, growth rate, vigor, biomass, oil content, and/or abiotic stress tolerance |
| BR122019015757B1 (en) | 2009-08-04 | 2021-05-25 | Evogene Ltd | method for increasing abiotic stress tolerance, yield, biomass, growth rate, vigor, and/or nitrogen use efficiency of a plant |
| US20110080674A1 (en) | 2009-10-02 | 2011-04-07 | Joel Durand | Magnetic azimuth adjustment for tonearm |
| AR081095A1 (en) | 2009-12-28 | 2012-06-13 | Evogene Ltd | POLINUCLEOTIDES AND ISOLATED POLYPEPTIDES AND METHODS TO USE THEM TO INCREASE THE PERFORMANCE OF THE PLANT, BIOMASS, GROWTH RATE, VIGOR, OIL CONTENT, TOLERANCE TO THE ABIOTIC STRESS AND EFFECTIVENESS IN THE USE OF NITROG NITROG |
| EP2563112A4 (en) | 2010-04-28 | 2014-03-05 | Evogene Ltd | Isolated polynucleotides and polypeptides, and methods of using same for increasing plant yield and/or agricultural characteristics |
| WO2012028993A2 (en) | 2010-08-30 | 2012-03-08 | Evogene Ltd. | Isolated polynucleotides and polypeptides, and methods of using same for increasing nitrogen use efficiency, yield, growth rate, vigor, biomass, oil content, and/or abiotic stress tolerance |
| CA2821257C (en) | 2010-12-22 | 2020-12-22 | Evogene Ltd. | Isolated polynucleotides and polypeptides, and methods of using same for increasing abiotic stress tolerance, yield, growth rate, vigor, biomass, oil content, and/or nitrogen use efficiency of plants |
| AU2012251353B2 (en) | 2011-05-03 | 2016-10-27 | Evogene Ltd. | Isolated polynucleotides and polypeptides and methods of using same for increasing plant yield, biomass, growth rate, vigor, oil content, abiotic stress tolerance of plants and nitrogen use efficiency |
| CA3177595A1 (en) | 2011-08-23 | 2013-02-28 | Evogene Ltd. | Isolated polynucleotides and polypeptides, and methods of using same for increasing plant yield and/or agricultural characteristics |
| CN104254242A (en) | 2011-11-21 | 2014-12-31 | 先正达参股股份有限公司 | Compositions and methods for increasing nematode resistance in plants |
| US10113176B2 (en) | 2011-11-28 | 2018-10-30 | Evogene Ltd. | Isolated polynucleotides and polypeptides, and methods of using same for increasing nitrogen use efficiency, yield, growth rate, vigor, biomass, oil content, and/or abiotic stress tolerance |
| BR122020022832B1 (en) | 2011-12-28 | 2021-08-17 | Evogene Ltd | METHOD TO INCREASE THE PRODUCTION, GROWTH RATE, BIOMASS, ENERGY AND/OR SEED PRODUCTION OF A PLANT COMPARED TO A NATIVE PLANT, AND, ISOLATED NUCLEIC ACID CONSTRUCTION |
| BR112014021561B1 (en) | 2012-02-29 | 2022-05-03 | Evogene Ltd | Method for increasing the growth rate, biomass and/or seed yield and/or reducing the flowering emergence time and/or inflorescence time of a plant under stress-free conditions compared to a control plant of the same species under the same culture conditions, and nucleic acid construction |
| BR112014029908B1 (en) | 2012-05-28 | 2022-02-15 | Evogene Ltd | METHOD TO INCREASE THE PRODUCTION, GROWTH RATE, BIOMASS, VIGOR, AND/OR EFFICIENCY IN THE USE OF NITROGEN OF A PLANT, AND, CONSTRUCTION OF NUCLEIC ACID |
| CA2881623C (en) | 2012-08-27 | 2023-01-24 | Evogene Ltd. | Isolated polynucleotides, polypeptides and methods of using same for increasing abiotic stress tolerance, biomass and yield of plants |
| BR112015015415B1 (en) | 2012-12-25 | 2022-08-16 | Evogene Ltd. | METHODS TO INCREASE NITROGEN USE EFFICIENCY, GROWTH RATE, BIOMASS, SEED YIELD, PHOTOSYNTHETIC CAPACITY AND/OR TOLERANCE TO ABIOTIC STRESS OF A PLANT, TO PRODUCE A CULTURE, TO GROW A CROP, AND, TO SELECT A PLANT |
| BR122020005661B1 (en) | 2012-12-26 | 2022-10-25 | Evogene Ltd | METHOD TO INCREASE NITROGEN USE EFFICIENCY, GROWTH RATE, BIOMASS, VIGOR, OIL CONTENT, SEED YIELD, FIBER YIELD, FIBER QUALITY, FIBER LENGTH, PHOTOSYNTHETIC CAPACITY AND/OR TOLERANCE TO ABIOTIC STRESS OF A PLANT , METHOD TO SELECT A TRANSFORMED PLANT AND NUCLEIC ACID CONSTRUCTION |
| AU2014269927B9 (en) | 2013-05-22 | 2020-04-16 | Evogene Ltd. | Isolated polynucleotides and polypeptides, and methods of using same for increasing plant yield and/or agricultural characteristics |
| BR112016004099A2 (en) | 2013-08-27 | 2017-10-17 | Evogene Ltd | isolated polynucleotides and polypeptides and methods of their use to increase plant yield and / or agricultural characteristics |
| MX2016015571A (en) | 2014-05-28 | 2017-02-23 | Evogene Ltd | Isolated polynucleotides, polypeptides and methods of using same for increasing abiotic stress tolerance, biomass and yield of plants. |
| WO2016030885A1 (en) | 2014-08-27 | 2016-03-03 | Evogene Ltd. | Isolated polynucleotides and polypeptides, and methods of using same for increasing plant yield and/or agricultural characteristics |
-
2010
- 2010-03-01 WO PCT/IB2010/050871 patent/WO2010100595A2/en active Application Filing
- 2010-03-01 SI SI201032081T patent/SI3460062T1/en unknown
- 2010-03-01 DK DK18202481.0T patent/DK3460062T3/en active
- 2010-03-01 US US13/254,183 patent/US8937220B2/en active Active
- 2010-03-01 HU HUE15188570A patent/HUE041819T2/en unknown
- 2010-03-01 MX MX2011009044A patent/MX2011009044A/en active IP Right Grant
- 2010-03-01 EP EP15188570.4A patent/EP3000889B1/en active Active
- 2010-03-01 AR ARP100100601 patent/AR075773A1/en active IP Right Grant
- 2010-03-01 MX MX2016011426A patent/MX351466B/en unknown
- 2010-03-01 EP EP10748403.2A patent/EP2403956B1/en active Active
- 2010-03-01 BR BRPI1006257-2A patent/BRPI1006257B1/en not_active IP Right Cessation
- 2010-03-01 AU AU2010220157A patent/AU2010220157C1/en not_active Ceased
- 2010-03-01 MX MX2013015424A patent/MX342016B/en unknown
- 2010-03-01 CA CA2999342A patent/CA2999342C/en active Active
- 2010-03-01 EP EP18202481.0A patent/EP3460062B1/en active Active
- 2010-03-01 LT LTEP18202481.0T patent/LT3460062T/en unknown
- 2010-03-01 CA CA2753616A patent/CA2753616C/en active Active
- 2010-03-01 CA CA3123543A patent/CA3123543A1/en active Pending
- 2010-03-01 EP EP21155351.6A patent/EP3862433A3/en not_active Withdrawn
-
2011
- 2011-09-27 ZA ZA2011/07044A patent/ZA201107044B/en unknown
-
2014
- 2014-11-18 US US14/543,930 patent/US9487795B2/en active Active
-
2016
- 2016-08-17 US US15/238,739 patent/US10597671B2/en active Active
-
2020
- 2020-01-17 US US16/745,387 patent/US20210087574A1/en not_active Abandoned
-
2021
- 2021-07-27 HR HRP20211209TT patent/HRP20211209T1/en unknown
Patent Citations (52)
| Publication number | Priority date | Publication date | Assignee | Title |
|---|---|---|---|---|
| US3850752A (en) | 1970-11-10 | 1974-11-26 | Akzona Inc | Process for the demonstration and determination of low molecular compounds and of proteins capable of binding these compounds specifically |
| US3839153A (en) | 1970-12-28 | 1974-10-01 | Akzona Inc | Process for the detection and determination of specific binding proteins and their corresponding bindable substances |
| US3791932A (en) | 1971-02-10 | 1974-02-12 | Akzona Inc | Process for the demonstration and determination of reaction components having specific binding affinity for each other |
| US3901654A (en) | 1971-06-21 | 1975-08-26 | Biological Developments | Receptor assays of biologically active compounds employing biologically specific receptors |
| US3853987A (en) | 1971-09-01 | 1974-12-10 | W Dreyer | Immunological reagent and radioimmuno assay |
| US3867517A (en) | 1971-12-21 | 1975-02-18 | Abbott Lab | Direct radioimmunoassay for antigens and their antibodies |
| US3879262A (en) | 1972-05-11 | 1975-04-22 | Akzona Inc | Detection and determination of haptens |
| US3850578A (en) | 1973-03-12 | 1974-11-26 | H Mcconnell | Process for assaying for biologically active molecules |
| US3935074A (en) | 1973-12-17 | 1976-01-27 | Syva Company | Antibody steric hindrance immunoassay with two antibodies |
| US3996345A (en) | 1974-08-12 | 1976-12-07 | Syva Company | Fluorescence quenching with immunological pairs in immunoassays |
| US4034074A (en) | 1974-09-19 | 1977-07-05 | The Board Of Trustees Of Leland Stanford Junior University | Universal reagent 2-site immunoradiometric assay using labelled anti (IgG) |
| US3984533A (en) | 1975-11-13 | 1976-10-05 | General Electric Company | Electrophoretic method of detecting antigen-antibody reaction |
| US4098876A (en) | 1976-10-26 | 1978-07-04 | Corning Glass Works | Reverse sandwich immunoassay |
| US4879219A (en) | 1980-09-19 | 1989-11-07 | General Hospital Corporation | Immunoassay utilizing monoclonal high affinity IgM antibodies |
| EP0067553A2 (en) | 1981-05-27 | 1982-12-22 | National Research Council Of Canada | An RNA plant virus vector or portion thereof, a method of construction thereof, and a method of producing a gene derived product therefrom |
| US4855237A (en) | 1983-09-05 | 1989-08-08 | Teijin Limited | Double-stranded DNA having sequences complementary to a single-stranded DNA and derived from a bean golden mosaic virus |
| US5011771A (en) | 1984-04-12 | 1991-04-30 | The General Hospital Corporation | Multiepitopic immunometric assay |
| US4666828A (en) | 1984-08-15 | 1987-05-19 | The General Hospital Corporation | Test for Huntington's disease |
| US4945050A (en) | 1984-11-13 | 1990-07-31 | Cornell Research Foundation, Inc. | Method for transporting substances into living cells and tissues and apparatus therefor |
| EP0194809A1 (en) | 1985-03-07 | 1986-09-17 | Lubrizol Genetics Inc. | RNA transformation vector |
| US4683202A (en) | 1985-03-28 | 1987-07-28 | Cetus Corporation | Process for amplifying nucleic acid sequences |
| US4683202B1 (en) | 1985-03-28 | 1990-11-27 | Cetus Corp | |
| US4801531A (en) | 1985-04-17 | 1989-01-31 | Biotechnology Research Partners, Ltd. | Apo AI/CIII genomic polymorphisms predictive of atherosclerosis |
| US5569597A (en) | 1985-05-13 | 1996-10-29 | Ciba Geigy Corp. | Methods of inserting viral DNA into plant material |
| WO1987006261A1 (en) | 1986-04-11 | 1987-10-22 | Diatech Limited | Recombinant - rna packaging system |
| JPS6314693A (en) | 1986-07-04 | 1988-01-21 | Sumitomo Chem Co Ltd | Plant virus rna vector |
| US5268463A (en) | 1986-11-11 | 1993-12-07 | Jefferson Richard A | Plant promoter α-glucuronidase gene construct |
| US5608142A (en) | 1986-12-03 | 1997-03-04 | Agracetus, Inc. | Insecticidal cotton plants |
| EP0278667A2 (en) | 1987-02-09 | 1988-08-17 | Mycogen Plant Science, Inc. | Hybrid RNA virus |
| US5316931A (en) | 1988-02-26 | 1994-05-31 | Biosource Genetics Corp. | Plant viral vectors having heterologous subgenomic promoters for systemic expression of foreign genes |
| US5693507A (en) | 1988-09-26 | 1997-12-02 | Auburn University | Genetic engineering of plant chloroplasts |
| US5272057A (en) | 1988-10-14 | 1993-12-21 | Georgetown University | Method of detecting a predisposition to cancer by the use of restriction fragment length polymorphism of the gene for human poly (ADP-ribose) polymerase |
| US5464765A (en) | 1989-06-21 | 1995-11-07 | Zeneca Limited | Transformation of plant cells |
| US5192659A (en) | 1989-08-25 | 1993-03-09 | Genetype Ag | Intron sequence analysis method for detection of adjacent and remote locus alleles as haplotypes |
| US5466785A (en) | 1990-04-12 | 1995-11-14 | Ciba-Geigy Corporation | Tissue-preferential promoters |
| US5608149A (en) | 1990-06-18 | 1997-03-04 | Monsanto Company | Enhanced starch biosynthesis in tomatoes |
| US5187267A (en) | 1990-06-19 | 1993-02-16 | Calgene, Inc. | Plant proteins, promoters, coding sequences and use |
| US5399680A (en) | 1991-05-22 | 1995-03-21 | The Salk Institute For Biological Studies | Rice chitinase promoter |
| US5604121A (en) | 1991-08-27 | 1997-02-18 | Agricultural Genetics Company Limited | Proteins with insecticidal properties against homopteran insects and their use in plant protection |
| WO1993007278A1 (en) | 1991-10-04 | 1993-04-15 | Ciba-Geigy Ag | Synthetic dna sequence having enhanced insecticidal activity in maize |
| US5281521A (en) | 1992-07-20 | 1994-01-25 | The Trustees Of The University Of Pennsylvania | Modified avidin-biotin technique |
| US5608144A (en) | 1994-08-12 | 1997-03-04 | Dna Plant Technology Corp. | Plant group 2 promoters and uses thereof |
| US5659026A (en) | 1995-03-24 | 1997-08-19 | Pioneer Hi-Bred International | ALS3 promoter |
| WO2001023884A1 (en) | 1999-09-27 | 2001-04-05 | Monsanto Technology Llc | Methods for determining oils in seeds |
| WO2004081173A2 (en) | 2003-03-12 | 2004-09-23 | Evogene Ltd. | Nucleotide sequences regulating gene expression and constructs and methods utilizing same |
| WO2004104162A2 (en) | 2003-05-22 | 2004-12-02 | Evogene Ltd. | Methods of increasing abiotic stress tolerance and/or biomass in plants and plants generated thereby |
| WO2005121364A2 (en) | 2004-06-14 | 2005-12-22 | Evogene Ltd. | Polynucleotides and polypeptides involved in plant fiber development and methods of using same |
| WO2007020638A2 (en) | 2005-08-15 | 2007-02-22 | Evogene Ltd. | Methods of increasing abiotic stress tolerance and/or biomass in plants and plants generated thereby |
| WO2007049275A2 (en) | 2005-10-24 | 2007-05-03 | Evogene Ltd. | Isolated polypeptides, polynucleotides encoding same, transgenic plants expressing same and methods of using same |
| WO2008075364A2 (en) | 2006-12-20 | 2008-06-26 | Evogene Ltd. | Polynucleotides and polypeptides involved in plant fiber development and methods of using same |
| WO2008122980A2 (en) | 2007-04-09 | 2008-10-16 | Evogene Ltd. | Polynucleotides, polypeptides and methods for increasing oil content, growth rate and biomass of plants |
| WO2009013750A2 (en) | 2007-07-24 | 2009-01-29 | Evogene Ltd. | Polynucleotides, polypeptides encoded thereby, and methods of using same for increasing abiotic stress tolerance and/or biomass and/or yield in plants expressing same |
Non-Patent Citations (125)
| Title |
|---|
| "Immobilized Cells and Enzymes", 1986, IRL PRESS |
| "Methods in Enzymology", vol. 1-317, ACADEMIC PRESS |
| "PCR Protocols: A Guide To Methods And Applications", 1990, ACADEMIC PRESS |
| ALBANIETAL, PLANT CELL, vol. 9, 1997, pages 171 - 184 |
| AN ET AL., PLANT J., vol. 10, no. 1, 1996, pages 107 - 121 |
| AUSUBEL ET AL.: "Current Protocols in Molecular Biology", 1989, JOHN WILEY AND SONS |
| AUSUBEL, R. M.: "Current Protocols in Molecular Biology", vol. I-III, 1994 |
| BASZCZYNSKI ET AL., PLANT MOL. BIOL., vol. 14, 1990, pages 633 |
| BIRREN ET AL., GENOME ANALYSIS, vol. 543, 1997 |
| BIRREN ET AL.: "Genome Analysis: A Laboratory Manual Series", vol. 1-4, 1998, COLD SPRING HARBOR LABORATORY PRESS |
| BUCHOLZ ET AL., PLANT MOL BIOL., vol. 25, no. 5, 1994, pages 837 - 43 |
| BUSK ET AL., PLANT J., vol. 11, 1997, pages 1285 - 1295 |
| CELLIS, J. E.: "Cell Biology: A Laboratory Handbook", vol. I-III, 1994 |
| CHAPMAN, G. P. AND MANTELL, S. H. AND DANIELS, W.: "Experimental Manipulation of Ovule Tissue", 1985, LONGMAN, article DEWET ET AL., pages: 197 - 209 |
| CHRISTENSEN ET AL., PLANT MOL. BIOL., vol. 18, 1992, pages 675 - 689 |
| CHRISTENSEN ET AL., PLANT SOL. BIOL., vol. 18, 1992, pages 675 - 689 |
| CLOUGH SJ; BENT AF.: "Floral dip: a simplified method for Agrobacterium-mediated transformation of Arabidopsis thaliana", PLANT J., vol. 16, no. 6, 1998, pages 735 - 43 |
| COLIGAN J. E.: "Current Protocols in Immunology", vol. I-III, 1994 |
| CONWAY TF. AND EARLE FR.: "Journal of the American Oil Chemists' Society", - 1963 |
| COULSON, TRENDS IN BIOTECHNOLOGY, 1994, pages 76 - 80 |
| CREIGHTON: "Proteins", 1984, W.H. FREEMAN AND COMPANY |
| CUMMINS ET AL., PLANT MOL. BIOL., vol. 19, 1992, pages 873 - 876 |
| DAWSON, W. O. ET AL., VIROLOGY, vol. 172, 1989, pages 285 - 292 |
| DE PATER ET AL., PLANT J, vol. 2, no. 6, November 1992 (1992-11-01), pages 837 - 44 |
| DESFEUX C; CLOUGH SJ; BENT AF: "Female reproductive tissues are the primary targets of Agrobacterium-mediated transformation by the Arabidopsis floral-dip method", PLANT PHYSIOL., vol. 123, no. 3, 2000, pages 895 - 904 |
| ELLIS ET AL., PLANT MOL. BIOL., vol. 10, 1988, pages 203 - 214 |
| EMB03, 1984, pages 1409 - 15 |
| FOSTER AND TATLOR: "Plant Virology Protocols: From Virus Isolation to Transgenic Resistance (Methods in Molecular Biology", vol. 81, 1998, HUMANA PRESS |
| FRENCH ET AL., SCIENCE, vol. 231, 1986, pages 1294 - 1297 |
| FRESHNEY, R. I.: "Animal Cell Culture", 1986 |
| FROMM ET AL., NATURE, vol. 319, 1986, pages 791 - 793 |
| GAIT, M. J.: "Oligonucleotide Synthesis", 1984 |
| GAXIOLA ET AL., PNAS, vol. 98, no. 20, 25 September 2001 (2001-09-25), pages 11444 - 11449 |
| GLUZMAN, Y. ET AL.: "Communications in Molecular Biology: Viral Vectors", 1988, COLD SPRING HARBOR LABORATORY, pages: 172 - 189 |
| GOTOR ET AL., PLANT J., vol. 3, 1993, pages 509 - 18 |
| HAMES, B. D., AND HIGGINS S. J.: "Nucleic Acid Hybridization", 1985 |
| HAMES, B. D., AND HIGGINS S. J.: "Transcription and Translation", 1984 |
| HILL, S.A.: "Methods in Plant Virology", 1984, BLACKWELL |
| HORSCH ET AL.: "Plant Molecular Biology Manual", vol. A5, 1988, KLUWER ACADEMIC PUBLISHERS, pages: 1 - 9 |
| KADO AND AGRAWA: "Principles and Techniques in Plant Virology", VAN NOSTRAND-REINHOLD |
| KLEE ET AL., ANNU. REV. PLANT PHYSIOL., vol. 38, 1987, pages 467 - 486 |
| KLEIN ET AL., BIO/TECHNOLOGY, vol. 6, 1988, pages 559 - 563 |
| KUNG, S, AND ARNTZEN, C. J.: "Plant Biotechnology", 1989, BUTTERWORTH PUBLISHERS, article GATENBY, pages: 93 - 112 |
| KURIHARA; WATANABE, MOLECULAR PLANT PATHOLOGY, vol. 4, 2003, pages 259 - 269 |
| KWON ET AL., PLANT PHYSIOL., vol. 105, 1994, pages 357 - 67 |
| LAST ET AL., THEOR. APPL. GENET., vol. 81, 1991, pages 581 - 588 |
| LEPETIT ET AL., MOL. GEN. GENET., vol. 231, 1992, pages 276 - 285 |
| LEV-MAOR ET AL.: "Splicing of Alu Sequences", SCIENCE, vol. 300, no. 5623, 2003, pages 1288 - 91 |
| MARAMOROSH AND KOPROWSKI: "Methods in Virology", vol. 1-7, 1967, ACADEMIC PRESS |
| MARSHAK ET AL.: "Strategies for Protein Purification and Characterization - A Laboratory Course Manual", 1996, CSHL PRESS |
| MATSUOKA ET AL., PROC. NATL. ACAD. SCI. USA, vol. 90, 1993, pages 9586 - 9590 |
| MATZKE ET AL., PLANT MOL BIOL, vol. 143, 1990, pages 323 - 32 |
| MCCABE ET AL., BIO/TECHNOLOGY, vol. 6, 1988, pages 923 - 926 |
| MCELROY ET AL., PLANT CELL, vol. 2, 1990, pages 163 - 171 |
| MENA ET AL., THE PLANT JOURNAL, vol. 116, no. 1, 1998, pages 53 - 62 |
| MISHELL AND SHIIGI: "Selected Methods in Cellular Immunology", 1980, W. H. FREEMAN AND CO. |
| MOL GEN GENET, vol. 216, 1989, pages 81 - 90 |
| MOL GEN GENET, vol. 250, 1996, pages 750 - 60 |
| MURASHIGE; SKOOG, PLANT PHYSIOLOGY, vol. 15, 1962, pages 473 - 497 |
| MURRAY ET AL., NUC ACIDS RES., vol. 17, 1989, pages 477 - 498 |
| NAKASE ET AL., PLANT MOL. BIOL., vol. 33, 1997, pages 513 - S22 |
| NAR, vol. 17, pages 461 - 2 |
| NEEDLEMAN; WUNSCH, J. MOL. BIOL., vol. 48, 1970, pages 443 - 453 |
| NEUHAUS ET AL., THEOR. APPL. GENET., vol. 75, 1987, pages 30 - 36 |
| NEUHAUS; SPANGENBERG, PHYSIOL. PLANT., vol. 79, 1990, pages 213 - 217 |
| NI ET AL., THE PLANT JOURNAL, vol. 7, 1995, pages 661 - 76 |
| NILSSON ET AL., PHYSIOL. PLANT, vol. 100, 1997, pages 456 - 462 |
| ODELL ET AL., NATURE, vol. 313, 1985, pages 810 - 812 |
| OHTA, PROC. NATL. ACAD. SCI. USA, vol. 83, 1986, pages 715 - 719 |
| OROZCO ET AL., PLANT MOL. BIOL., vol. 23, 1993, pages 1129 - 1138 |
| PEARSON ET AL., PLANT MOL. BIOL., vol. 18, 1992, pages 235 - 245 |
| PELLESCHI ET AL., PLANT MOL. BIOL., vol. 39, 1999, pages 373 - 380 |
| PERBAL, B.: "A Practical Guide to Molecular Cloning", 1984 |
| PERBAL: "A Practical Guide to Molecular Cloning", 1988, JOHN WILEY & SONS |
| PLA ET AL., PLANT MOL. BIOL., vol. 21, 1993, pages 259 - 266 |
| PLANT J, vol. 12, 1997, pages 235 - 46 |
| PLANT J, vol. 4, 1993, pages 343 - 55 |
| PMB, vol. 32, 1996, pages 1029 - 35 |
| PORTNOY ET AL.: "Analysis Of The Melon Fruit Transcriptome Based On 454 Pyrosequencing", PLANT & ANIMAL GENOMES XVII CONFERENCE, SAN DIEGO, CA, 2009 |
| POSTMA-HAARSMA ET AL., PLANT MOL. BIOL., vol. 39, 1999, pages 257 - 71 |
| POTRYKUS, I., ANNU. REV. PLANT. PHYSIOL., PLANT. MOL. BIOL., vol. 42, 1991, pages 205 - 225 |
| PURCELL; KING, ARGON. J., vol. 88, 1996, pages 111 - 113 |
| QUESDA ET AL., PLANT PHYSIOL., vol. 130, 2002, pages 951 - 063 |
| SAMBROOK ET AL., MOLECULAR CLONING: A LABORATORY MANUAL, 1989 |
| SAMBROOK J.; E.F. FRITSCH; T. MANIATIS: "Molecular Cloning. A Laboratory Manual, 2nd ed.", 1989, COLD SPRING HARBOR LABORATORY PRESS |
| SAMONTE ET AL., AGRON. J., vol. 98, 2006, pages 168 - 176 |
| SANFORD, PHYSIOL. PLANT., vol. 79, 1990, pages 206 - 209 |
| SARDANA ET AL., PLANT CELL REPORTS, vol. 15, 1996, pages 677 - 681 |
| SATO ET AL., PROC. NATL. ACAD. SCI. USA, vol. 93, pages 8117 - 8122 |
| SCHELL, J., AND VASIL, L. K.: "Molecular Biology of Plant Nuclear Genes", vol. 6, 1989, ACADEMIC PUBLISHERS, article KLEE; ROGERS: "Cell Culture and Somatic Cell Genetics of Plants", pages: 2 - 25 |
| SCHELL, J., AND VASIL, L. K.: "Molecular Biology of Plant Nuclear Genes", vol. 6, 1989, ACADEMIC PUBLISHERS, article PASZKOWSKI ET AL.: "Cell Culture and Somatic Cell Genetics of Plants", pages: 52 - 68 |
| SCOFIELD ET AL., J. BIOL. CHEM., vol. 262, 1987, pages 12202 |
| See also references of EP2403956A4 |
| SHIMAMOTO ET AL., NATURE, vol. 338, 1989, pages 274 - 276 |
| SIMON ET AL., PLANT MOL. BIOL., vol. 5, 1985, pages 191 |
| SOXHLET, F.: "Die gewichtsanalytische Bestimmung des Milchfettes", POLYTECHNISCHES J. (DINGLER'S, vol. 232, pages 461 |
| SOXHLET, F.: "Die gewichtsanalytische Bestimmung des Milchfettes", POLYTECHNISCHES J., vol. 232, pages 461 |
| STALBERG ET AL., PLANTA, vol. 199, 1996, pages 515 - 519 |
| STITES ET AL.: "Basic and Clinical Immunology, 8th ed.", 1994, APPLETON & LANGE |
| TAKAIWA ET AL., FEBS LETTS., vol. 221, 1987, pages 43 - 47 |
| TAKAIWA ET AL., MOL. GEN. GENET., vol. 208, 1986, pages 15 - 22 |
| TAKAMATSU ET AL., EMBO J., vol. 6, 1987, pages 307 - 311 |
| TAKAMATSU ET AL., FEBS LETTERS, vol. 269, 1990, pages 73 - 76 |
| THEOR APPL GEN, vol. 98, 1999, pages 1253 - 62 |
| TORIYAMA, K. ET AL., BIO/TECHNOLOGY, vol. 6, 1988, pages 1072 - 1074 |
| TRANS RES, vol. 6, 1997, pages 157 - 68 |
| TWELL ET AL., MOL. GEN GENET., vol. 217, 1989, pages 240 - 245 |
| VAN DER MEER ET AL., PLANT MOL. BIOL., vol. 15, 1990, pages 95 - 109 |
| VANCANNEYT. G, ET AL., MGG, vol. 220, 1990, pages 245 - 50 |
| VICENTE-CARBAJOSA ET AL., PLANT J., vol. 13, 1998, pages 629 - 640 |
| VODOVOTZ, BIOTECHNIQUES, vol. 20, 1996, pages 390 - 394 |
| WAISEL Y, ESHEL A AND KAFKAFI U.: "Plant Roots, The Hidden Half 3rd ed.", 2002, MARCEL DEKKER INC, article BERNSTEIN; KAFKAFI: "Root Growth Under Salinity Stress" |
| WALKEY, D.G.A: "Applied Plant Virology", 1985, WILEY |
| WATSON ET AL., PLANT PHYSIOL., vol. 11 1, 1996, pages 1077 - 1 083 |
| WATSON ET AL.: "Scientific American Books", article "Recombinant DNA" |
| WU ET AL., PLANT CELL PHYSIOLOGY, vol. 39, no. 8, 1998, pages 885 - 889 |
| WU, J. BIOCHEM., vol. 123, 1998, pages 386 |
| XIE H ET AL.: "Computational analysis of alternative splicing using EST tissue information", GENOMICS, 2002 |
| YAMAGUCHI-SHINOZALEI ET AL., MOL. GEN. GENET., vol. 236, 1993, pages 331 - 340 |
| YAMAMOTO ET AL., PLANT CELL PHYSIOL., vol. 35, 1994, pages 773 - 778 |
| YAMAMOTO ET AL., PLANT J., vol. 12, 1997, pages 255 - 265 |
| YANAGISAWA ET AL., PROC NATL ACAD SCI U S A., vol. 101, 2004, pages 7833 - 8 |
| YANAGISAWA-S. ET AL.: "Metabolic engineering with Dofl transcription factor in plants: Improved nitrogen assimilation and growth under low-nitrogen conditions", PROC. NATL. ACAD. SCI. USA, vol. 101, pages 7833 - 7838 |
| YELIN ET AL.: "Widespread Antisense Transcription", NATURE BIOTECHNOLOGY, vol. 21, 2003, pages 379 - 85 |
| ZHANG ET AL., PLANT CELL REP., vol. 7, 1988, pages 379 - 384 |
Cited By (111)
| Publication number | Priority date | Publication date | Assignee | Title |
|---|---|---|---|---|
| US10184132B2 (en) | 2003-05-22 | 2019-01-22 | Evogene Ltd. | Methods of increasing abiotic stress tolerance, yield and/or biomass in plants |
| US9303269B2 (en) | 2003-05-22 | 2016-04-05 | Evogene Ltd. | Methods of increasing abiotic stress tolerance and/or biomass in plants |
| US10533184B2 (en) | 2004-06-14 | 2020-01-14 | Evogene Ltd. | Isolated polypeptides, polynucleotides encoding same, transgenic plants expressing same and methods of using same |
| US10774339B2 (en) | 2004-06-14 | 2020-09-15 | Evogene Ltd. | Polynucleotides and polypeptides involved in plant fiber development and methods of using same |
| US9834781B2 (en) | 2004-06-14 | 2017-12-05 | Evogene Ltd. | Polynucleotides and polypeptides involved in plant fiber development and methods of using same |
| US8962915B2 (en) | 2004-06-14 | 2015-02-24 | Evogene Ltd. | Isolated polypeptides, polynucleotides encoding same, transgenic plants expressing same and methods of using same |
| US9012728B2 (en) | 2004-06-14 | 2015-04-21 | Evogene Ltd. | Polynucleotides and polypeptides involved in plant fiber development and methods of using same |
| US10214749B2 (en) | 2005-08-15 | 2019-02-26 | Evogene Ltd. | Methods of increasing abiotic stress tolerance and/or biomass in plants and plants generated thereby |
| US10829777B2 (en) | 2005-08-15 | 2020-11-10 | Evogene Ltd. | Methods of increasing abiotic stress tolerance and/or biomass in plants and plants generated thereby |
| US9487796B2 (en) | 2005-08-15 | 2016-11-08 | Evogene Ltd. | Methods of increasing abiotic stress tolerance and/or biomass in plants and plants generated thereby |
| US10844393B2 (en) | 2006-12-20 | 2020-11-24 | Evogene Ltd. | Polynucleotides and polypeptides involved in plant fiber development and methods of using same |
| US9631000B2 (en) | 2006-12-20 | 2017-04-25 | Evogene Ltd. | Polynucleotides and polypeptides involved in plant fiber development and methods of using same |
| US9487793B2 (en) | 2007-04-09 | 2016-11-08 | Evogene Ltd. | Polynucleotides, polypeptides and methods for increasing oil content, growth rate and biomass of plants |
| US10036031B2 (en) | 2007-04-09 | 2018-07-31 | Evogene Ltd. | Polynucleotides, polypeptides and methods for increasing oil content, growth rate and biomass of plants |
| US9518267B2 (en) | 2007-07-24 | 2016-12-13 | Evogene Ltd. | Polynucleotides, polypeptides encoded thereby, and methods of using same for increasing abiotic stress tolerance and/or biomass and/or yield in plants expressing same |
| US10155957B2 (en) | 2007-07-24 | 2018-12-18 | Evogene Ltd. | Polynucleotides, polypeptides encoded thereby, and methods of using same for increasing abiotic stress tolerance and/or biomass and/or yield in plants expressing same |
| US10961544B2 (en) | 2007-07-24 | 2021-03-30 | Evogene Ltd. | Polynucleotides, polypeptides encoded thereby, and methods of using same for increasing abiotic stress tolerance and/or biomass and/or yield in plants expressing same |
| US10995341B2 (en) | 2007-07-24 | 2021-05-04 | Evogene Ltd. | Polynucleotides, polypeptides encoded thereby, and methods of using same for increasing abiotic stress tolerance and/or biomass and/or yield in plants expressing same |
| US9670501B2 (en) | 2007-12-27 | 2017-06-06 | Evogene Ltd. | Isolated polypeptides, polynucleotides useful for modifying water user efficiency, fertilizer use efficiency, biotic/abiotic stress tolerance, yield and biomass in plants |
| US10407690B2 (en) | 2007-12-27 | 2019-09-10 | Evogene Ltd. | Isolated polypeptides, polynucleotides useful for modifying water user efficiency, fertilizer use efficiency, biotic/abiotic stress tolerance, yield and biomass in plants |
| US10900048B2 (en) | 2008-05-22 | 2021-01-26 | Evogene Ltd. | Isolated polynucleotides and polypeptides and methods of using same for increasing plant utility |
| US9714430B2 (en) | 2008-05-22 | 2017-07-25 | Evogene Ltd. | Isolated polynucleotides and polypeptides and methods of using same for increasing plant utility |
| US10100326B2 (en) | 2008-05-22 | 2018-10-16 | Evogene Ltd. | Isolated polynucleotides and polypeptides and methods of using same for increasing plant utility |
| US8847008B2 (en) | 2008-05-22 | 2014-09-30 | Evogene Ltd. | Isolated polynucleotides and polypeptides and methods of using same for increasing plant utility |
| US10208316B2 (en) | 2008-08-18 | 2019-02-19 | Evogene Ltd. | Use of UMP-CMP kinases for increasing nitrogen use efficiency and low nitrogen tolerance in plants |
| US10829776B2 (en) | 2008-08-18 | 2020-11-10 | Evogene Ltd. | Use of MFS transporters for increasing biomass, growth rate, nitrogen use efficiency and low nitrogen tolerance in plants |
| US9783818B2 (en) | 2008-08-18 | 2017-10-10 | Evogene Ltd. | Use of ADP/ATP transporter genes to increase nitrogen use efficiency and low nitrogen tolerance to a plant |
| US9018445B2 (en) | 2008-08-18 | 2015-04-28 | Evogene Ltd. | Use of CAD genes to increase nitrogen use efficiency and low nitrogen tolerance to a plant |
| US11453887B2 (en) | 2008-08-18 | 2022-09-27 | Evogene Ltd. | Isolated polypeptides and polynucleotides useful for increasing nitrogen use efficiency, abiotic stress tolerance, yield and biomass in plants |
| US8921658B2 (en) | 2008-10-30 | 2014-12-30 | Evogene Ltd. | Isolated polynucleotides encoding a MAP65 polypeptide and methods of using same for increasing plant yield |
| US9745595B2 (en) | 2008-10-30 | 2017-08-29 | Evogene Ltd. | Methods of increasing biomass and/or growth rate of a plant under non-stress conditions |
| US10793870B2 (en) | 2008-10-30 | 2020-10-06 | Evogene Ltd. | Methods of increasing biomass and/or growth rate of a plant under non-stress conditions |
| US8952218B2 (en) | 2008-12-29 | 2015-02-10 | Evogene Ltd. | Polynucleotides, polypeptides encoded thereby, and methods of using same for increasing abiotic stress tolerance, biomass and/or yield in plants expressing same |
| US10975382B2 (en) | 2008-12-29 | 2021-04-13 | Evogene Ltd. | Polynucleotides, polypeptides encoded thereby, and methods of using same for increasing abiotic stress tolerance, biomass and/or yield in plants expressing same |
| US8937220B2 (en) | 2009-03-02 | 2015-01-20 | Evogene Ltd. | Isolated polynucleotides and polypeptides, and methods of using same for increasing plant yield, biomass, vigor and/or growth rate of a plant |
| US9487795B2 (en) | 2009-03-02 | 2016-11-08 | Evogene Ltd. | Isolated polynucleotides and polypeptides, and methods of using same for increasing plant yield, biomass, oil content and/or growth rate |
| US10597671B2 (en) | 2009-03-02 | 2020-03-24 | Evogene Ltd. | Isolated polynucleotides and polypeptides, and methods of using same for increasing plant yield, biomass, oil content and/or growth rate |
| US10791690B2 (en) | 2009-06-10 | 2020-10-06 | Evogene Ltd. | Isolated polynucleotides and polypeptides, and methods of using same for increasing nitrogen use efficiency, yield, growth rate, vigor, biomass, oil content, and/or abiotic stress tolerance |
| US10006040B2 (en) | 2009-06-10 | 2018-06-26 | Evogene Ltd. | Isolated polynucleotides and polypeptides, and methods of using same for increasing nitrogen use efficiency, yield, growth rate, vigor, biomass, oil content, and/or abiotic stress tolerance |
| US9096865B2 (en) | 2009-06-10 | 2015-08-04 | Evogene Ltd. | Isolated polynucleotides and polypeptides, and methods of using same for increasing nitrogen use efficiency, yield, growth rate, vigor, biomass, oil content, and/or abiotic stress tolerance |
| US11286495B2 (en) | 2009-06-10 | 2022-03-29 | Evogene Ltd. | Isolated polynucleotides and polypeptides, and methods of using same for increasing nitrogen use efficiency, yield, growth rate, vigor, biomass, oil content, and/or abiotic stress tolerance |
| US9574200B2 (en) | 2009-08-04 | 2017-02-21 | Evogene Ltd. | Polynucleotides and polypeptides for increasing desirable plant qualities |
| US10883115B2 (en) | 2009-08-04 | 2021-01-05 | Evogene Ltd. | Protein kinase polynucleotides and polypeptides for increasing abiotic stress tolerance, yield, biomass, growth rate, and/or vigor in a plant |
| US10227607B2 (en) | 2009-08-04 | 2019-03-12 | Evogene Ltd. | MADS-box polynucleotides and polypeptides for increasing abiotic stress tolerance, yield, biomass, growth rate, and/or vigor in a plant |
| US11530418B2 (en) | 2009-08-04 | 2022-12-20 | Evogene Ltd. | Polynucleotides and polypeptides for increasing desirable plant qualities |
| US10982224B2 (en) | 2009-12-28 | 2021-04-20 | Evogene Ltd. | Isolated polynucleotides and polypeptides and methods of using same for increasing plant yield, biomass, growth rate, vigor, oil content, abiotic stress tolerance of plants and nitrogen use efficiency |
| US9493785B2 (en) | 2009-12-28 | 2016-11-15 | Evogene Ltd. | Isolated polynucleotides and polypeptides and methods of using same for increasing plant yield, biomass, growth rate, vigor, oil content, abiotic stress tolerance of plants and nitrogen use efficiency |
| US10351873B2 (en) | 2009-12-28 | 2019-07-16 | Evogene Ltd. | Isolated polynucleotides and polypeptides and methods of using same for increasing plant yield, biomass, growth rate, vigor, oil content, abiotic stress tolerance of plants and nitrogen use efficiency |
| US10689662B2 (en) | 2010-04-28 | 2020-06-23 | Evogene Ltd. | Isolated polynucleotides and polypeptides for increasing plant yield and/or agricultural characteristics |
| US11542522B2 (en) | 2010-04-28 | 2023-01-03 | Evogene Ltd. | Isolated polynucleotides and polypeptides for increasing plant yield and/or agricultural characteristics |
| US9328353B2 (en) | 2010-04-28 | 2016-05-03 | Evogene Ltd. | Isolated polynucleotides and polypeptides for increasing plant yield and/or agricultural characteristics |
| US11130957B2 (en) | 2010-08-30 | 2021-09-28 | Evogene Ltd. | Isolated polynucleotides and polypeptides, and methods of using same for increasing nitrogen use efficiency, yield, growth rate, vigor, biomass, oil content, and/or abiotic stress tolerance |
| US10457954B2 (en) | 2010-08-30 | 2019-10-29 | Evogene Ltd. | Isolated polynucleotides and polypeptides, and methods of using same for increasing nitrogen use efficiency, yield, growth rate, vigor, biomass, oil content, and/or abiotic stress tolerance |
| WO2012038528A1 (en) * | 2010-09-23 | 2012-03-29 | Genoplante-Valor | Plants resistant to fungal pathogens and methods for production thereof |
| US9551006B2 (en) | 2010-12-22 | 2017-01-24 | Evogene Ltd. | Isolated polynucleotides and polypeptides, and methods of using same for improving plant properties |
| US10457952B2 (en) | 2010-12-22 | 2019-10-29 | Evogene Ltd. | Isolated polynucleotides and polypeptides, and methods of using same for improving plant properties |
| US10760088B2 (en) | 2011-05-03 | 2020-09-01 | Evogene Ltd. | Isolated polynucleotides and polypeptides and methods of using same for increasing plant yield, biomass, growth rate, vigor, oil content, abiotic stress tolerance of plants and nitrogen use efficiency |
| US11111499B2 (en) | 2011-05-03 | 2021-09-07 | Evogene Ltd. | Isolated polynucleotides and polypeptides and methods of using same for increasing plant yield, biomass, growth rate, vigor, oil content, abiotic stress tolerance of plants and nitrogen use efficiency |
| WO2012172556A3 (en) * | 2011-06-15 | 2013-05-02 | Yissum Research Development Company Of The Hebrew University Of Jerusalem Ltd. | Plants tolerant to abiotic stress |
| US9976157B2 (en) | 2011-08-23 | 2018-05-22 | Evogene Ltd. | Isolated polynucleotides and polypeptides, and methods of using same for increasing plant yield and/or agricultural characteristics |
| US10501750B2 (en) | 2011-08-23 | 2019-12-10 | Evogene Ltd. | Isolated polynucleotides and polypeptides, and methods of using same for increasing plant yield and/or agricultural characteristics |
| WO2013027223A2 (en) * | 2011-08-23 | 2013-02-28 | Evogene Ltd. | Isolated polynucleotides and polypeptides, and methods of using same for increasing plant yield and/or agricultural characteristics |
| US11293032B2 (en) | 2011-08-23 | 2022-04-05 | Evogene Ltd. | Isolated polynucleotides and polypeptides, and methods of using same for increasing plant yield and/or agricultural characteristics |
| WO2013027223A3 (en) * | 2011-08-23 | 2013-07-11 | Evogene Ltd. | Isolated polynucleotides and polypeptides, and methods of using same for increasing plant yield and/or agricultural characteristics |
| US10900052B2 (en) | 2011-11-21 | 2021-01-26 | Syngenta Participations Ag | Compositions and methods for increasing nematode resistance in plants |
| US10000768B2 (en) | 2011-11-21 | 2018-06-19 | Syngenta Participations Ag | Compositions and methods for increasing nematode resistance in plants |
| US10113176B2 (en) | 2011-11-28 | 2018-10-30 | Evogene Ltd. | Isolated polynucleotides and polypeptides, and methods of using same for increasing nitrogen use efficiency, yield, growth rate, vigor, biomass, oil content, and/or abiotic stress tolerance |
| US11078492B2 (en) | 2011-11-28 | 2021-08-03 | Evogene Ltd. | Isolated polynucleotides and polypeptides, and methods of using same for increasing nitrogen use efficiency, yield, growth rate, vigor, biomass, oil content, and/or abiotic stress tolerance |
| US11242538B2 (en) | 2011-12-28 | 2022-02-08 | Evogene Ltd. | Isolated polynucleotides and polypeptides, and methods of using same for increasing yield of plants |
| US10260073B2 (en) | 2011-12-28 | 2019-04-16 | Evogene Ltd. | Isolated polynucleotides and polypeptides, and methods of using same for increasing yield of plants |
| US11326179B2 (en) | 2012-02-29 | 2022-05-10 | Evogene Ltd. | Isolated polynucleotides and polypeptides and methods of using same for increasing plant yield, biomass, growth rate, vigor, oil content, abiotic stress tolerance of plants and nitrogen use efficiency |
| US10815492B2 (en) | 2012-02-29 | 2020-10-27 | Evogene Ltd. | Isolated polynucleotides and polypeptides and methods of using same for increasing plant yield, biomass, growth rate, vigor, oil content, abiotic stress tolerance of plants and nitrogen use efficiency |
| US9920330B2 (en) | 2012-02-29 | 2018-03-20 | Evogene Ltd. | Isolated polynucleotides and polypeptides and methods of using same for increasing plant yield, biomass, growth rate, vigor, oil content, abiotic stress tolerance of plants and nitrogen use efficiency |
| US10253327B2 (en) | 2012-02-29 | 2019-04-09 | Evogene Ltd. | Isolated polynucleotides and polypeptides and methods of using same for increasing plant yield, biomass, growth rate, vigor, oil content, abiotic stress tolerance of plants and nitrogen use efficiency |
| US11365421B2 (en) | 2012-02-29 | 2022-06-21 | Evogene Ltd. | Isolated polynucleotides and polypeptides and methods of using same for increasing plant yield, biomass, growth rate, vigor, oil content, abiotic stress tolerance of plants and nitrogen use efficiency |
| WO2013136273A2 (en) | 2012-03-13 | 2013-09-19 | University Of Guelph | Methods of increasing tolerance to heat stress and amino acid content of plants |
| US9834782B2 (en) | 2012-05-28 | 2017-12-05 | Evogene Ltd. | Isolated polynucleotides and polypeptides, and methods of using same for increasing plant yield and/or agricultural characteristics |
| US10982222B2 (en) | 2012-05-28 | 2021-04-20 | Evogene Ltd. | Isolated polynucleotides and polypeptides, and methods of using same for increasing plant yield and/or agricultural characteristics |
| US9309532B2 (en) * | 2012-07-26 | 2016-04-12 | Japan Science And Technology Agency | Iron-zinc binding control factor, and technique for improving iron deficiency tolerance of plant and enhancing iron and zinc accumulation in edible part thereof by controlling expression of novel iron-zinc binding control factor |
| US10858665B2 (en) | 2012-08-27 | 2020-12-08 | Evogene Ltd. | Isolated polynucleotides, polypeptides and methods of using same for increasing abiotic stress tolerance, biomass and yield of plants |
| US11512323B2 (en) | 2012-08-27 | 2022-11-29 | Evogene Ltd. | Isolated polynucleotides, polypeptides and methods of using same for increasing abiotic stress tolerance, biomass and yield of plants |
| US11485982B1 (en) | 2012-08-27 | 2022-11-01 | Evogene Ltd. | Isolated polynucleotides, polypeptides and methods of using same for increasing abiotic stress tolerance, biomass and yield of plants |
| US9890389B2 (en) | 2012-12-25 | 2018-02-13 | Evogene Ltd. | Isolated polynucleotides and polypeptides, and methods of using same for increasing nitrogen use efficiency of plants |
| US10597672B2 (en) | 2012-12-25 | 2020-03-24 | Evogene Ltd. | Isolated polynucleotides and polypeptides, and methods of using same for increasing nitrogen use efficiency of plants |
| US11352636B2 (en) | 2012-12-25 | 2022-06-07 | Evogene Ltd. | Isolated polynucleotides and polypeptides, and methods of using same for increasing nitrogen use efficiency of plants |
| US10501751B2 (en) | 2012-12-26 | 2019-12-10 | Evogene Ltd. | Isolated polynucleotides and polypeptides, construct and plants comprising same and methods of using same for increasing nitrogen use efficiency of plants |
| US11453888B2 (en) | 2012-12-26 | 2022-09-27 | Evogene Ltd. | Isolated polynucleotides and polypeptides, construct and plants comprising same and methods of using same for increasing nitrogen use efficiency of plants |
| US9771598B2 (en) | 2012-12-26 | 2017-09-26 | Evogene Ltd. | Isolated polynucleotides and polypeptides, construct and plants comprising same and methods of using same for increasing nitrogen use efficiency of plants |
| US11549122B2 (en) | 2013-05-22 | 2023-01-10 | Evogene Ltd. | Isolated polynucleotides and polypeptides, and methods of using same for increasing plant yield and/or agricultural characteristics |
| US9920329B2 (en) | 2013-05-22 | 2018-03-20 | Evogene Ltd. | Isolated polynucleotides and polypeptides, and methods of using same for increasing plant yield and/or agricultural characteristics |
| US11560573B2 (en) | 2013-05-22 | 2023-01-24 | Evogene Ltd. | Isolated polynucleotides and polypeptides, and methods of using same for increasing plant yield and/or agricultural characteristics |
| US10214748B2 (en) | 2013-05-22 | 2019-02-26 | Evogene Ltd. | Isolated polynucleotides and polypeptides, and methods of using same for increasing plant yield and/or agricultural characteristics |
| US11525141B2 (en) | 2013-05-22 | 2022-12-13 | Evogene Ltd. | Isolated polynucleotides and polypeptides, and methods of using same for increasing plant yield and/or agricultural characteristics |
| US10889827B2 (en) | 2013-05-22 | 2021-01-12 | Evogene Ltd. | Isolated polynucleotides and polypeptides, and methods of using same for increasing plant yield and/or agricultural characteristics |
| US10006042B2 (en) | 2013-08-27 | 2018-06-26 | Evogene Ltd. | Isolated polynucleotides and polypeptides, and methods of using same for increasing plant yield and/or agricultural characteristics |
| US10774340B2 (en) | 2013-08-27 | 2020-09-15 | Evogene Ltd. | Isolated polynucleotides and polypeptides, and methods of using same for increasing plant yield and/or agricultural characteristics |
| US10337023B2 (en) | 2013-08-27 | 2019-07-02 | Evogene Ltd. | Isolated polynucleotides and polypeptides, and methods of using same for increasing plant yield and/or agricultural characteristics |
| US11499161B2 (en) | 2013-08-27 | 2022-11-15 | Evogene Ltd. | Isolated polynucleotides and polypeptides, and methods of using same for increasing plant yield and/or agricultural characteristics |
| US10975383B2 (en) | 2014-05-28 | 2021-04-13 | Evogene Ltd. | Isolated polynucleotides, polypeptides and methods of using same for increasing abiotic stress tolerance, biomass and yield of plants |
| US11421004B2 (en) | 2014-08-27 | 2022-08-23 | Evogene Ltd. | Isolated polynucleotides and polypeptides, and methods of using same for increasing plant yield and/or agricultural characteristics |
| US11485761B2 (en) | 2014-08-27 | 2022-11-01 | Evogene Ltd. | Isolated polynucleotides and polypeptides, and methods of using same for increasing plant yield and/or agricultural characteristics |
| US11472853B1 (en) | 2014-08-27 | 2022-10-18 | Evogene Ltd. | Isolated polynucleotides and polypeptides, and methods of using same for increasing plant yield and/or agricultural characteristics |
| US10858403B2 (en) | 2014-08-27 | 2020-12-08 | Evogene Ltd. | Isolated polynucleotides and polypeptides, and methods of using same for increasing plant yield and/or agricultural characteristics |
| WO2017106274A1 (en) * | 2015-12-16 | 2017-06-22 | Syngenta Participations Ag | Genetic regions & genes associated with increased yield in plants |
| CN108697752B (en) * | 2015-12-16 | 2022-07-01 | 先正达参股股份有限公司 | Genetic regions and genes associated with increased yield in plants |
| CN108697752A (en) * | 2015-12-16 | 2018-10-23 | 先正达参股股份有限公司 | With the relevant genetic region of the increased yield of plant and gene |
| AU2016371903B2 (en) * | 2015-12-16 | 2023-10-19 | Syngenta Participations Ag | Genetic regions and genes associated with increased yield in plants |
| US10766935B2 (en) | 2015-12-28 | 2020-09-08 | Evogene Ltd. | Plant traits conferred by isolated polynucleotides and polypeptides |
| US11566053B2 (en) | 2015-12-28 | 2023-01-31 | Evogene Ltd. | Plant traits conferred by isolated polynucleotides and polypeptides |
| CN111620935A (en) * | 2019-02-27 | 2020-09-04 | 中国农业大学 | Application of ZmCEP1 gene in regulation and control of corn kernel development |
| CN111620935B (en) * | 2019-02-27 | 2023-08-11 | 中国农业大学 | Application of ZmCEP1 gene in regulation and control of corn kernel development |
Also Published As
Similar Documents
| Publication | Publication Date | Title |
|---|---|---|
| US11542522B2 (en) | Isolated polynucleotides and polypeptides for increasing plant yield and/or agricultural characteristics | |
| US10883115B2 (en) | Protein kinase polynucleotides and polypeptides for increasing abiotic stress tolerance, yield, biomass, growth rate, and/or vigor in a plant | |
| US10006040B2 (en) | Isolated polynucleotides and polypeptides, and methods of using same for increasing nitrogen use efficiency, yield, growth rate, vigor, biomass, oil content, and/or abiotic stress tolerance | |
| EP3460062B1 (en) | Isolated polynucleotides and polypeptides, and methods of using same for increasing plant yield and/or agricultural characteristics | |
| AU2012345456B2 (en) | Isolated polynucleotides and polypeptides, and methods of using same for increasing nitrogen use efficiency, yield, growth rate, vigor, biomass, oil content, and/or abiotic stress tolerance | |
| US10457954B2 (en) | Isolated polynucleotides and polypeptides, and methods of using same for increasing nitrogen use efficiency, yield, growth rate, vigor, biomass, oil content, and/or abiotic stress tolerance | |
| US20150082486A1 (en) | Isolated polynucleotides and polypeptides, and methods of using same for increasing yield of plants | |
| AU2010280419B2 (en) | Polynucleotides and polypeptides for increasing desirable plant qualities | |
| AU2016213786A1 (en) | Isolated Polynucleotides and Polypeptides, and Methods of Using Same for Increasing Plant Yield and/or Agricultural Characteristics |
Legal Events
| Date | Code | Title | Description |
|---|---|---|---|
| 121 | Ep: the epo has been informed by wipo that ep was designated in this application |
Ref document number: 10748403 Country of ref document: EP Kind code of ref document: A2 |
|
| WWE | Wipo information: entry into national phase |
Ref document number: 2753616 Country of ref document: CA |
|
| WWE | Wipo information: entry into national phase |
Ref document number: MX/A/2011/009044 Country of ref document: MX |
|
| WWE | Wipo information: entry into national phase |
Ref document number: 13254183 Country of ref document: US |
|
| NENP | Non-entry into the national phase |
Ref country code: DE |
|
| WWE | Wipo information: entry into national phase |
Ref document number: 2010748403 Country of ref document: EP |
|
| WWE | Wipo information: entry into national phase |
Ref document number: 2010220157 Country of ref document: AU |
|
| WWE | Wipo information: entry into national phase |
Ref document number: 2002/MUMNP/2011 Country of ref document: IN |
|
| ENP | Entry into the national phase |
Ref document number: 2010220157 Country of ref document: AU Date of ref document: 20100301 Kind code of ref document: A |
|
| REG | Reference to national code |
Ref country code: BR Ref legal event code: B01A Ref document number: PI1006257 Country of ref document: BR |
|
| REG | Reference to national code |
Ref country code: BR Ref legal event code: B01E Ref document number: PI1006257 Country of ref document: BR |
|
| ENP | Entry into the national phase |
Ref document number: PI1006257 Country of ref document: BR Kind code of ref document: A2 Effective date: 20110902 |