WO2009021674A1 - Predictive markers for egfr inhibitor treatment - Google Patents

Predictive markers for egfr inhibitor treatment Download PDF

Info

Publication number
WO2009021674A1
WO2009021674A1 PCT/EP2008/006513 EP2008006513W WO2009021674A1 WO 2009021674 A1 WO2009021674 A1 WO 2009021674A1 EP 2008006513 W EP2008006513 W EP 2008006513W WO 2009021674 A1 WO2009021674 A1 WO 2009021674A1
Authority
WO
WIPO (PCT)
Prior art keywords
gene
expression level
patient
egfr inhibitor
cancer
Prior art date
Application number
PCT/EP2008/006513
Other languages
French (fr)
Inventor
Paul Delmar
Barbara Klughammer
Verena Lutz
Patricia Mcloughlin
Original Assignee
F. Hoffmann-La Roche Ag
Priority date (The priority date is an assumption and is not a legal conclusion. Google has not performed a legal analysis and makes no representation as to the accuracy of the date listed.)
Filing date
Publication date
Application filed by F. Hoffmann-La Roche Ag filed Critical F. Hoffmann-La Roche Ag
Priority to MX2010001571A priority Critical patent/MX2010001571A/en
Priority to EP08785419A priority patent/EP2188391A1/en
Priority to US12/672,946 priority patent/US20110184004A1/en
Priority to BRPI0815415-5A2A priority patent/BRPI0815415A2/en
Priority to CA2695485A priority patent/CA2695485A1/en
Priority to CN200880103326A priority patent/CN101778954A/en
Priority to AU2008286407A priority patent/AU2008286407A1/en
Priority to JP2010520464A priority patent/JP2010535517A/en
Publication of WO2009021674A1 publication Critical patent/WO2009021674A1/en

Links

Classifications

    • CCHEMISTRY; METALLURGY
    • C12BIOCHEMISTRY; BEER; SPIRITS; WINE; VINEGAR; MICROBIOLOGY; ENZYMOLOGY; MUTATION OR GENETIC ENGINEERING
    • C12QMEASURING OR TESTING PROCESSES INVOLVING ENZYMES, NUCLEIC ACIDS OR MICROORGANISMS; COMPOSITIONS OR TEST PAPERS THEREFOR; PROCESSES OF PREPARING SUCH COMPOSITIONS; CONDITION-RESPONSIVE CONTROL IN MICROBIOLOGICAL OR ENZYMOLOGICAL PROCESSES
    • C12Q1/00Measuring or testing processes involving enzymes, nucleic acids or microorganisms; Compositions therefor; Processes of preparing such compositions
    • C12Q1/68Measuring or testing processes involving enzymes, nucleic acids or microorganisms; Compositions therefor; Processes of preparing such compositions involving nucleic acids
    • C12Q1/6876Nucleic acid products used in the analysis of nucleic acids, e.g. primers or probes
    • C12Q1/6883Nucleic acid products used in the analysis of nucleic acids, e.g. primers or probes for diseases caused by alterations of genetic material
    • C12Q1/6886Nucleic acid products used in the analysis of nucleic acids, e.g. primers or probes for diseases caused by alterations of genetic material for cancer
    • AHUMAN NECESSITIES
    • A61MEDICAL OR VETERINARY SCIENCE; HYGIENE
    • A61PSPECIFIC THERAPEUTIC ACTIVITY OF CHEMICAL COMPOUNDS OR MEDICINAL PREPARATIONS
    • A61P35/00Antineoplastic agents
    • AHUMAN NECESSITIES
    • A61MEDICAL OR VETERINARY SCIENCE; HYGIENE
    • A61PSPECIFIC THERAPEUTIC ACTIVITY OF CHEMICAL COMPOUNDS OR MEDICINAL PREPARATIONS
    • A61P43/00Drugs for specific purposes, not provided for in groups A61P1/00-A61P41/00
    • GPHYSICS
    • G01MEASURING; TESTING
    • G01NINVESTIGATING OR ANALYSING MATERIALS BY DETERMINING THEIR CHEMICAL OR PHYSICAL PROPERTIES
    • G01N33/00Investigating or analysing materials by specific methods not covered by groups G01N1/00 - G01N31/00
    • G01N33/15Medicinal preparations ; Physical properties thereof, e.g. dissolubility
    • CCHEMISTRY; METALLURGY
    • C12BIOCHEMISTRY; BEER; SPIRITS; WINE; VINEGAR; MICROBIOLOGY; ENZYMOLOGY; MUTATION OR GENETIC ENGINEERING
    • C12QMEASURING OR TESTING PROCESSES INVOLVING ENZYMES, NUCLEIC ACIDS OR MICROORGANISMS; COMPOSITIONS OR TEST PAPERS THEREFOR; PROCESSES OF PREPARING SUCH COMPOSITIONS; CONDITION-RESPONSIVE CONTROL IN MICROBIOLOGICAL OR ENZYMOLOGICAL PROCESSES
    • C12Q2600/00Oligonucleotides characterized by their use
    • C12Q2600/106Pharmacogenomics, i.e. genetic variability in individual responses to drugs and drug metabolism
    • CCHEMISTRY; METALLURGY
    • C12BIOCHEMISTRY; BEER; SPIRITS; WINE; VINEGAR; MICROBIOLOGY; ENZYMOLOGY; MUTATION OR GENETIC ENGINEERING
    • C12QMEASURING OR TESTING PROCESSES INVOLVING ENZYMES, NUCLEIC ACIDS OR MICROORGANISMS; COMPOSITIONS OR TEST PAPERS THEREFOR; PROCESSES OF PREPARING SUCH COMPOSITIONS; CONDITION-RESPONSIVE CONTROL IN MICROBIOLOGICAL OR ENZYMOLOGICAL PROCESSES
    • C12Q2600/00Oligonucleotides characterized by their use
    • C12Q2600/118Prognosis of disease development
    • CCHEMISTRY; METALLURGY
    • C12BIOCHEMISTRY; BEER; SPIRITS; WINE; VINEGAR; MICROBIOLOGY; ENZYMOLOGY; MUTATION OR GENETIC ENGINEERING
    • C12QMEASURING OR TESTING PROCESSES INVOLVING ENZYMES, NUCLEIC ACIDS OR MICROORGANISMS; COMPOSITIONS OR TEST PAPERS THEREFOR; PROCESSES OF PREPARING SUCH COMPOSITIONS; CONDITION-RESPONSIVE CONTROL IN MICROBIOLOGICAL OR ENZYMOLOGICAL PROCESSES
    • C12Q2600/00Oligonucleotides characterized by their use
    • C12Q2600/158Expression markers

Definitions

  • the present invention provides biomarkers that are predictive for the clinical benefit of EGFR inhibitor treatment in cancer patients.
  • EGF epidermal growth factor receptor
  • TGF- ⁇ transforming growth factor- ⁇
  • TGF- ⁇ transforming growth factor- ⁇
  • tumour cell proliferation in vitro. It has been postulated that stimulation of tumour cells via the EGFR may be important for both tumour growth and tumour survival in vivo.
  • TarcevaTM an inhibitor of the EGFR tyrosine kinase
  • Clinical phase I and II trials in patients with advanced disease have demonstrated that TarcevaTM has promising clinical activity in a range of epithelial tumours. Indeed, TarcevaTM has been shown to be capable of inducing durable partial remissions in previously treated patients with head and neck cancer, and NSCLC (Non small cell lung cancer) of a similar order to established second line chemotherapy, but with the added benefit of a better safety profile than chemo therapy and improved convenience (tablet instead of intravenous [i.v.] administration).
  • a recently completed, randomised, double-blind, placebo-controlled trial (BR.21) has shown that single agent TarcevaTM significantly prolongs and improves the survival of NSCLC patients for whom standard therapy for advanced disease has failed.
  • TarcevaTM (erlotinib) is a small chemical molecule; it is an orally active, potent, selective inhibitor of the EGFR tyrosine kinase (EGFR-TKI).
  • Lung cancer is the major cause of cancer-related death in North America and Europe. In the United States, the number of deaths secondary to lung cancer exceeds the combined total deaths from the second (colon), third (breast), and fourth (prostate) leading causes of cancer deaths combined. About 75% to 80% of all lung cancers are NSCLC, with approximately 40% of patients presenting with locally advanced and/or unresectable disease. This group typically includes those with bulky stage IIIA and IIIB disease, excluding malignant pleural effusions.
  • Advanced tumours often are not amenable to surgery and may also be resistant to tolerable doses of radiotherapy and chemotherapy.
  • the currently most active combination chemotherapies achieved response rates of approximately 30% to 40% and a 1-year survival rate between 35% and 40%. This is really an advance over the 10% 1-year survival rate seen with supportive care alone (Shepherd 1999).
  • the present invention provides an in vitro method of predicting the clinical benefit of a cancer patient in response to treatment with an EGFR inhibitor.
  • Said method comprises the steps: determining an expression level of at least one gene selected from table 3 in a tumour sample of a patient and comparing the expression level of the at least one gene to a value representative of an expression level of the at least one gene in tumours of a population of patients deriving no clinical benefit from the treatment, wherein a differential expression level of the at least one gene in the tumour sample of the patient is indicative for a patient who will derive clinical benefit from the treatment.
  • a value representative of an expression level of the at least one marker gene in tumours of a population of patients deriving no clinical benefit from the treatment refers to an estimate of the mean expression level of a marker gene in tumours of a population of patients who do not derive a clinical benefit from the treatment.
  • Clinical benefit was defined as either having an objective response, or disease stabilization for > 12 weeks.
  • the expression level of at least two genes is determined.
  • the expression level of at least three genes is determined.
  • the gene is selected from the group consisting of
  • the gene is selected from the group consisting of SDCl, CEBPA, ST6GALNAC2, PLA2G6, PMS2L1 1, C19orf7, DDXl 7, SFPQ, PMS2L3, SLC35E2, PMSL2, URG4, PPP1R13B, NRCAM, FLJ10916, FLJ13197, GPR172B, ZNF506, ARHGAP8, CELSRl, LYK5 and said gene shows a higher expression level in the tumour sample of the patient compared to the value representative of the expression level in tumours of the population of patients deriving no clinical benefit from the treatment.
  • the expression level of the at least one gene is determined by microarray technology.
  • the construction and use of gene chips are well known in the art. see, U. S. Pat Nos. 5,202,231; 5,445,934; 5,525,464; 5,695,940; 5,744,305; 5,795, 716 and 1
  • gene expression level can be determined by other methods that are known to a person skilled in the art such as e.g. northern blots, RT-PCR, real time quantitative PCR, primer extension, RNase protection, RNA expression profiling.
  • Biomarker sets can be built from any combination of biomarkers listed in Table 3 to make predictions about the effect of EGFR inhibitor treatment in cancer patients.
  • the various biomarkers and biomarkers sets described herein can be used, for example, to predict how patients with cancer will respond to therapeutic intervention with an EGFR inhibitor.
  • the term "gene” as used herein comprises variants of the gene.
  • the term “variant” relates to nucleic acid sequences which are substantially similar to the nucleic acid sequences given by the GenBank accession number.
  • the term “substantially similar” is well understood by a person skilled in the art.
  • a gene variant may be an allele which shows nucleotide exchanges compared to the nucleic acid sequence of the most prevalent allele in the human population.
  • such a substantially similar nucleic acid sequence has a sequence similarity to the most prevalent allele of at least 80%, preferably at least 85%, more preferably at least 90%, most preferably at least 95%.
  • variants is also meant to relate to splice variants.
  • the EGFR inhibitor can be selected from the group consisting of gefitinib, erlotinib,
  • the EGFR inhibitor is erlotinib.
  • the cancer is NSCLC.
  • Techniques for the detection of gene expression of the genes described by this invention include, but are not limited to northern blots, RT-PCR, real time quantitative PCR, primer extension, RNase protection, RNA expression profiling and related techniques. These techniques are well known to those of skill in the art see e.g. Sambrook J et al., Molecular Cloning: A Laboratory Manual, Third Edition (Cold Spring Harbor Press, Cold Spring Harbor, 2000).
  • IHC immunohistochemistry
  • cells from a patient tissue sample e.g., a tumour or cancer biopsy
  • test cells e.g., tumour or cancer biopsy
  • results or failure of a cancer treatment can be determined based on the biomarker expression pattern of the cells from the test tissue (test cells), e.g., tumour or cancer biopsy, as being relatively similar or different from the expression pattern of a control set of the one or more biomarkers.
  • test cells e.g., tumour or cancer biopsy
  • test cells show a biomarker expression profile which corresponds to that of a patient who responded to cancer treatment, it is highly likely or predicted that the individual's cancer or tumour will respond favorably to treatment with the EGFR inhibitor.
  • biomarkers of the present invention i.e.
  • the genes listed in table 3 are a first step towards an individualized therapy for patients with cancer, in particular patients with refractory NSCLC.
  • This individualized therapy will allow treating physicians to select the most appropriate agent out of the existing drugs for cancer therapy, in particular NSCLC.
  • the benefit of individualized therapy for each future patient are: response rates / number of benefiting patients will increase and the risk of adverse side effects due to ineffective treatment will be reduced.
  • the present invention provides a therapeutic method of treating a cancer patient identified by the in vitro method of the present invention.
  • Said therapeutic method comprises administering an EGFR inhibitor to the patient who has been selected for treatment based on the predictive expression pattern of at least one of the genes listed in table 3.
  • a preferred EGFR inhibitor is erlotinib and a preferred cancer to be treated is NSCLC.
  • tumour sample was collected at the same time and stored in paraffin (formalin fixed paraffin embedded, FFPE). This sample was analysed for alterations in the EGFR signaling pathway. The ability to perform tumour biopsies via bronchoscopy was a prerequisite for this study. Bronchoscopy is a standard procedure to confirm the diagnosis of lung cancer. Although generally safe, there is a remaining risk of complications, e.g. bleeding.
  • This study was a first step towards an individualized therapy for patients with refractory NSCLC. This individualized therapy will allow treating physicians to select the most appropriate agent out of the existing drugs for this indication.
  • TarcevaTM was given orally once per day at a dose of 150 mg until disease progression, intolerable toxicities or death. The selection of this dose was based on pharmacokinetic parameters, as well as the safety and tolerability profile of this dose observed in Phase I, II and III trials in heavily pre-treated patients with advanced cancer. Drug levels seen in the plasma of patients with cancer receiving the 150 mg/day dose were consistently above the average plasma concentration of 500 ng / ml targeted for clinical efficacy. BR.21 showed a survival benefit with this dose. Objectives of the Study The primary objective was the identification of differentially expressed genes that are predictive for clinical benefit (CR, PR or SD >12 weeks) of TarcevaTM treatment. Identification of differentially expressed genes predictive for "response" (CR, PR) to TarcevaTM treatment was an important additional objective.
  • Tumour tissue and blood samples were obtained for molecular analyses to evaluate the effects of TarcevaTM and to identify subgroups of patients benefiting from therapy. Predictive Marker Assessments
  • Biopsies of the tumour were taken within 2 weeks before start of treatment. Two different samples were collected:
  • the second sample was fixed in formalin and embedded in paraffin Snap frozen tissue had the highest priority in this study.
  • Figure 2 shows a scheme of the sample processing.
  • the snap frozen samples were used for laser capture microdissection (LCM) of tumour cells to extract tumour RNA and RNA from tumour surrounding tissue.
  • the RNA was analysed on Affymetrix microarray chips (HG-U 133A) to establish the patients' tumour gene expression profile. Quality Control of Affymetrix chips was used to select those samples of adequate quality for statistical comparison.
  • the second tumour biopsy was used to perform DNA mutation, IHC and ISH analyses as described below. Similar analyses were performed on tissue collected at initial diagnosis.
  • the DNA mutation status of the genes encoding EGFR and other molecules involved in the EGFR signaling pathway were analysed by DNA sequencing. Gene amplification of EGFR and related genes were be studied by FISH. Protein expression analyses included immunohistochemical [IHC] analyses of EGFR and other proteins within the EGFR signalling pathway.
  • the RECIST Uni-dimensional Tumour Measurement
  • RECIST Uni-dimensional Tumour Measurement
  • These criteria can be found under the following link: http://www.eortc.be/recist/ Note that:To be assigned a status of CR or PR, changes in tumour measurements must be confirmed by repeated assessments at least 4 weeks apart at any time during the treatment period.
  • follow-up measurements must have met the SD criteria at least once after study entry at a minimum interval of 6 weeks.
  • follow-up measurements must have met the SD criteria at least once after study entry with maintenance duration of at least 12 weeks.
  • RNases are RNA degrading enzymes and are found everywhere and so all procedures where RNA will be used must be strictly controlled to minimize RNA degradation. Most mRNA species themselves have rather short half-lives and so are considered quite unstable.
  • RNA concentration and quality profile can be assessed using an instrument from Agilent (Agilent Technologies, Inc., Palo Alto, CA) called a 2100 Bioanalyzer®.
  • the instrument software generates an RNA Integrity Number (RIN), a quantitation estimate (Schroeder, A., et al., The RIN: an RNA integrity number for assigning integrity values to RNA measurements. BMC MoI Biol, 2006. 7: p. 3), and calculates ribosomal ratios of the total RNA sample.
  • the RJN is determined from the entire electrophoretic trace of the RNA sample, and so includes the presence or absence of degradation products.
  • the RNA quality was analysed by a 2100 Bioanalyzer®.
  • RNA samples were received from the pathology lab for further processing.
  • Target labeling was carried out according to the Two-Cycle Target Labeling Amplification Protocol from Affymetrix (Affymetrix, Santa Clara, California), as per the manufacturer's instructions.
  • the method is based on the standard Eberwine linear amplification procedure [but uses two cycles of this procedure to generate sufficient labeled cRNA for hybridization to a microarray.
  • Total RNA input used in the labeling reaction was IOng for those samples where more than IOng RNA was available; if less than this amount was available or if there was no quantity data available (due to very low RNA concentration), half of the total sample was used in the reaction. Yields from the labeling reactions ranged from 20-180 ⁇ g cRNA.
  • a normalization step was introduced at the level of hybridization where 15 ⁇ g cRNA was used for every sample.
  • RNA Human Reference RNA (Stratagene, Carlsbad, CA, USA) was used as a control sample in the workflow with each batch of samples. IOng of this RNA was used as input alongside the test samples to verify that the labeling and hybridization reagents were working as expected. Microarray hybridizations
  • Affymetrix HG-U 133 A microarrays contain over 22,000 probe sets targeting approximately 18,400 transcripts and variants which represent about 14,500 well- characterized genes.
  • Hybridization for all samples was carried out according to Affymetrix instructions (Affymetrix Inc., Expression Analysis Technical Manual, 2004). Briefly, for each sample,
  • GCOS GeneChip Operating Software
  • Step 1 was quality control. The goal was to identify and exclude from analysis array data with a sub-standard quality profile.
  • Step 2 was pre-processing and normalization. The goal was to create a normalized and scaled "analysis data set", amenable to inter-chip comparison. It comprised background noise estimation and subtraction, probe summarization and scaling.
  • Step 3 was exploration and description. The goal was to identify potential bias and sources of variability. It consisted of applying multivariate and univariate descriptive analysis techniques to identify influential covariates.
  • Step 4 was modeling and testing. The goal was to identify a list of candidate markers based on statistical evaluation of the difference in mean expression level between "clinical benefit” and "no clinical benefit” patients. It consisted in fitting an adequate statistical model to each probe-set and deriving a measure of statistical significance.
  • Step 5 was a robustness analysis. The goal was to generate a qualified list of candidate markers that do not heavily depend on the pre-processing methods and statistical assumptions. It consisted in reiterating the analysis with different methodological approaches and intersecting the list of candidates.
  • Step 1 Quality Control
  • This step also included visual inspection of virtual chip images for detecting localized hybridization problems, and comparison of each chip to a virtual median chip for detecting any unusual departure from median behavior. Inter-chip correlation analysis was also performed to detect outlier samples. In addition, ancillary measures of RNA quality obtained from analysis of RNA samples with the Agilent BioanalyzerTM 2100 were taken into consideration.
  • Step 2 Data pre-processing and normalization
  • the rma algorithm (Irizarry, R. A., et al., Summaries of Affymetrix GeneChip probe level data. Nucl. Acids Res., 2003. 31(4): p. el5) was used for pre-processing and normalization.
  • the mas5 algorithm (AFFYMETRIX, GeneChip® Expression: Data Analysis
  • Probe-sets called “absent” or “marginal” in all samples were removed from further analysis; 5930 probe-sets were removed from analysis based on this criterion.
  • the analysis data set therefore consisted of a matrix with 16353 (out of 22283) probe-sets measured in 102 patients.
  • RNA processing (later referred to as batch), RIN (Schroeder, A., et al., The RIN: an RNA integrity number for assigning integrity values to RNA measurements. BMC MoI Biol, 2006. 7: p. 3) (as a measure of RNA quality/integrity), Operator and Center of sample collection.
  • Clinical covariates included: Histology type, smoking status, tumour grade, performance score (Oken, M.M., et al., Toxicity and response criteria of the Eastern Cooperative Oncology Group. Am J Clin Oncol, 1982. 5(6): p. 649-55), demographic data, responder status and clinical benefit status.
  • the analysis tools included univariate ANOVA and principal component analysis. For each of these covariates, univariate ANOVA was applied independently to each probe-set. A significant effect of the batch variable was identified. In practice, the batch variable captured differences between dates of sample processing and Affymetrix chip lot. After checking that the batch variable was nearly independent from the variables of interest, the batch effect was corrected using the method described in Johnson, W.E., C. Li, and A. Rabinovic, Adjusting batch effects in microarray expression data using empirical Bayes methods. Biostat, 2007. 8(1): p. 118-127.
  • the normalized data set after batch effect correction served as the analysis data set in subsequent analyses.
  • Step 4 Data modeling and testing.
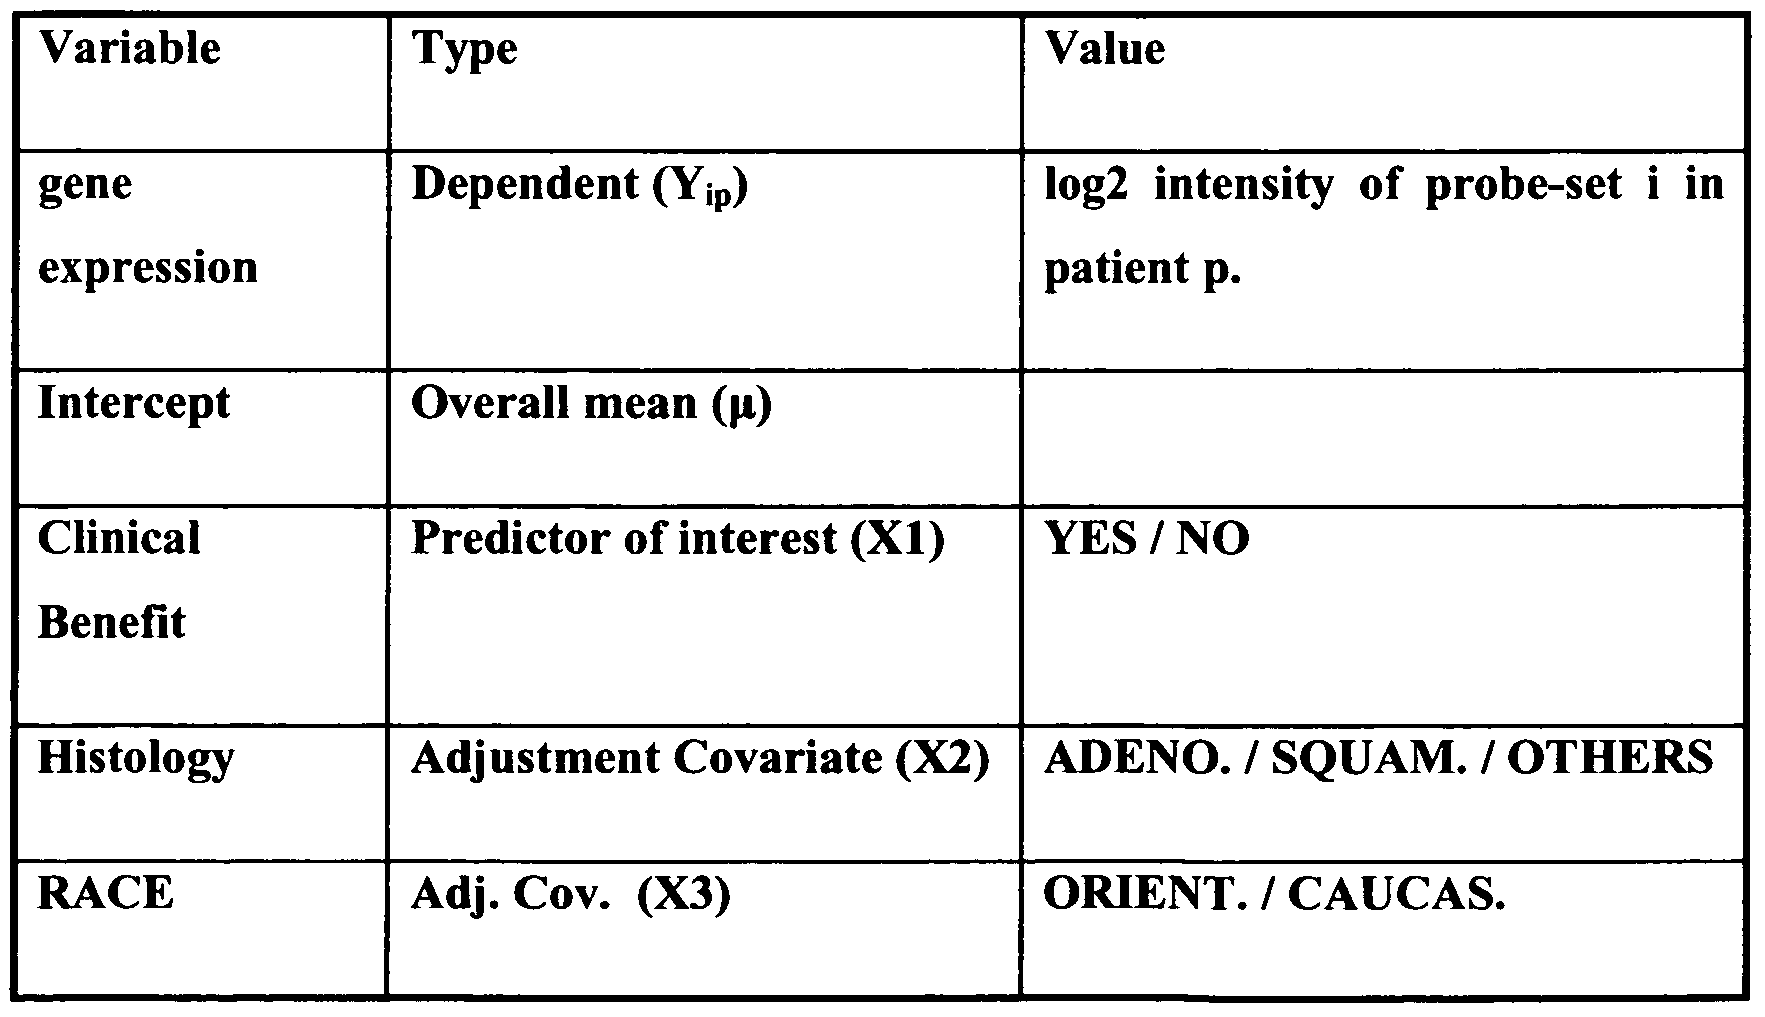
  • Table 2 Description of the variables included in the linear model.
  • the aim of the statistical test was to reject the hypothesis that the mean expression levels in patients with clinical benefit and patients without clinical benefit are equal, taking into account the other adjustment covariates listed in table 2.
  • the null hypothesis of equality was tested against a two sided alternative. The corresponding p- values are reported in table 3.
  • linear modeling is a versatile, well-characterized and robust approach that allows for adjustment of confounding variables when estimating the effect of the variable of interest.
  • sample size of 102 and the normalization and scaling of the data set, the normal distribution assumption was reasonable and justified.
  • Step 5 Robustness
  • the goal of the robustness analysis was to reduce the risk that the results of the analysis might be artifactual and a result of the pre-processing steps or assumptions underlying the statistical analysis.
  • the following three aspects were considered: a) inclusion or exclusion of a few extra chips at the quality control step; b) pre-processing and normalization algorithm; c) statistical assumptions and testing approach.
  • the list of candidate markers was defined as the subset of genes consistently declared as significant with different analysis settings.
  • the different applied analysis options were the following: a) An additional subset of 8 chips was identified based on more stringent quality control criteria. A "reduced data set" was defined by excluding these 8 chips.
  • MAS5 was identified as an alternative to rma for pre-processing and normalization. MAS5 uses different method for background estimation, probe summarization and normalization.
  • Two additional statistical tests were employed. These two additional tests rely on a different set of underlying statistical assumptions.
  • Table 3 Gene markers of Clinical Benefit based on the robustness analysis after application of the composite Criterion.
  • Column 1 is the Affymetrix identifier of the probe-set.
  • Column 2 is the GenBank accession number of the corresponding gene sequence.
  • Column 3 is the corresponding official gene name.
  • Column 4 is the corresponding adjusted mean fold change in expression level between clinical and no clinical benefit patient, as estimated with the linear model.
  • Column 5 is the p-value for the test of difference in expression level between clinical benefit and no clinical benefit patients as derived from the linear model.
  • table 3 contains genes that are useful for discriminating different tumour categories, in particular with regard to response to the EGFR inhibitor Erlotinib.
  • Column 1 is the GenBank accession number of the human gene sequence; Column 2 is the corresponding official gene name and Column 3 is the Sequence Identification number of the human nucleotide sequence as used in the present application.
  • table 4 contains more than one sequence identification number since several variants of the gene are registered in the GeneBank.

Abstract

The present invention provides biomarkers which are predictive for the clinical benefit of EGFR inhibitor treatment in cancer patients.

Description

Predictive markers for EGFR inhibitor treatment
The present invention provides biomarkers that are predictive for the clinical benefit of EGFR inhibitor treatment in cancer patients.
A number of human malignancies are associated with aberrant or over-expression of the epidermal growth factor receptor (EGFR). EGF, transforming growth factor-α (TGF-α), and a number of other ligands bind to the EGFR, stimulating autophosphorylation of the intracellular tyrosine kinase domain of the receptor. A variety of intracellular pathways are subsequently activated, and these downstream events result in tumour cell proliferation in vitro. It has been postulated that stimulation of tumour cells via the EGFR may be important for both tumour growth and tumour survival in vivo. Early clinical data with Tarceva™ (erlotinib), an inhibitor of the EGFR tyrosine kinase, indicate that the compound is safe and generally well tolerated at doses that provide the targeted effective concentration (as determined by preclinical data). Clinical phase I and II trials in patients with advanced disease have demonstrated that Tarceva™ has promising clinical activity in a range of epithelial tumours. Indeed, Tarceva™ has been shown to be capable of inducing durable partial remissions in previously treated patients with head and neck cancer, and NSCLC (Non small cell lung cancer) of a similar order to established second line chemotherapy, but with the added benefit of a better safety profile than chemo therapy and improved convenience (tablet instead of intravenous [i.v.] administration). A recently completed, randomised, double-blind, placebo-controlled trial (BR.21) has shown that single agent Tarceva™ significantly prolongs and improves the survival of NSCLC patients for whom standard therapy for advanced disease has failed.
Tarceva™ (erlotinib) is a small chemical molecule; it is an orally active, potent, selective inhibitor of the EGFR tyrosine kinase (EGFR-TKI).
Lung cancer is the major cause of cancer-related death in North America and Europe. In the United States, the number of deaths secondary to lung cancer exceeds the combined total deaths from the second (colon), third (breast), and fourth (prostate) leading causes of cancer deaths combined. About 75% to 80% of all lung cancers are NSCLC, with approximately 40% of patients presenting with locally advanced and/or unresectable disease. This group typically includes those with bulky stage IIIA and IIIB disease, excluding malignant pleural effusions.
The crude incidence of lung cancer in the European Union is 52.5, the death rate 48.7 cases/ 100000/year. Among men the rates are 79.3 and 78.3, among women 21.6 and 20.5, respectively. NSCLC accounts for 80% of all lung cancer cases. About 90% of lung cancer mortality among men, and 80% among women, is attributable to smoking. hi the US, according to the American Cancer Society, during 2004, there were approximately 173,800 new cases of lung cancer (93,100 in men and 80,700 in women) and were accounting for about 13% of all new cancers. Most patients die as a consequence of their disease within two years of diagnosis. For many NSCLC patients, successful treatment remains elusive. Advanced tumours often are not amenable to surgery and may also be resistant to tolerable doses of radiotherapy and chemotherapy. In randomized trials the currently most active combination chemotherapies achieved response rates of approximately 30% to 40% and a 1-year survival rate between 35% and 40%. This is really an advance over the 10% 1-year survival rate seen with supportive care alone (Shepherd 1999).
Until recently therapeutic options for relapsed patients following relapse were limited to best supportive care or palliation. A recent trial comparing docetaxel (Taxotere) with best supportive care showed that patients with NSCLC could benefit from second line chemotherapy after cisplatin-based first-line regimens had failed. Patients of all ages and with ECOG performance status of 0, 1, or 2 demonstrated improved survival with docetaxel, as did those who had been refractory to prior platinum-based treatment. Patients who did not benefit from therapy included those with weight loss of 10%, high lactate dehydrogenase levels, multi-organ involvement, or liver involvement. Additionally, the benefit of docetaxel monotherapy did not extend beyond the second line setting. Patients receiving docetaxel as third-line treatment or beyond showed no prolongation of survival. Single-agent docetaxel became a standard second-line therapy for NSCLC. Recently another randomized phase III trial in second line therapy of NSCLC compared pemetrexed (Alimta®) with docetaxel. Treatment with pemetrexed resulted in a clinically equivalent efficacy but with significantly fewer side effects compared with docetaxel. It has long been acknowledged that there is a need to develop methods of individualising cancer treatment. With the development of targeted cancer treatments, there is a particular interest in methodologies which could provide a molecular profile of the tumour target, (i.e. those that are predictive for clinical benefit). Proof of principle for gene expression profiling in cancer has already been established with the molecular classification of tumour types which are not apparent on the basis of current morphological and immunohistochemical tests. Two separate disease entities were differentiated with differing prognoses from the single current classification of diffuse large B-cell lymphoma using gene expression profiling.
Therefore, it is an aim of the present invention to provide expression biomarkers that are predictive for the clinical benefit of EGFR inhibitor treatment in cancer patients.
In a first object the present invention provides an in vitro method of predicting the clinical benefit of a cancer patient in response to treatment with an EGFR inhibitor. Said method comprises the steps: determining an expression level of at least one gene selected from table 3 in a tumour sample of a patient and comparing the expression level of the at least one gene to a value representative of an expression level of the at least one gene in tumours of a population of patients deriving no clinical benefit from the treatment, wherein a differential expression level of the at least one gene in the tumour sample of the patient is indicative for a patient who will derive clinical benefit from the treatment.
The term "a value representative of an expression level of the at least one marker gene in tumours of a population of patients deriving no clinical benefit from the treatment" refers to an estimate of the mean expression level of a marker gene in tumours of a population of patients who do not derive a clinical benefit from the treatment. Clinical benefit was defined as either having an objective response, or disease stabilization for > 12 weeks. hi a further preferred embodiment, the expression level of at least two genes is determined. hi another preferred embodiment, the expression level of at least three genes is determined. hi a further preferred embodiment, the gene is selected from the group consisting of
ATP6V0E1, MAPREl, PSMA5, ACSL3, RAPlA, SLC2A3, CHMP2B, RFK, CTGF, HSP A8, AKAP12, LOX, SLMO2, NOMO3, APOO and said gene shows a lower expression level in the tumour sample of the patient compared to the value representative of the expression level in tumours of the population of patients deriving no clinical benefit from the treatment. hi a further preferred embodiment, the the gene is selected from the group consisting of SDCl, CEBPA, ST6GALNAC2, PLA2G6, PMS2L1 1, C19orf7, DDXl 7, SFPQ, PMS2L3, SLC35E2, PMSL2, URG4, PPP1R13B, NRCAM, FLJ10916, FLJ13197, GPR172B, ZNF506, ARHGAP8, CELSRl, LYK5 and said gene shows a higher expression level in the tumour sample of the patient compared to the value representative of the expression level in tumours of the population of patients deriving no clinical benefit from the treatment.
In a preferred embodiment, the expression level of the at least one gene is determined by microarray technology. The construction and use of gene chips are well known in the art. see, U. S. Pat Nos. 5,202,231; 5,445,934; 5,525,464; 5,695,940; 5,744,305; 5,795, 716 and 1
5,800,992. See also, Johnston, M. Curr. Biol. 8:R171-174 (1998); Iyer VR et al., Science
283:83-87 (1999). Of course, the gene expression level can be determined by other methods that are known to a person skilled in the art such as e.g. northern blots, RT-PCR, real time quantitative PCR, primer extension, RNase protection, RNA expression profiling.
The genes of the present invention can be combined to biomarker sets. Biomarker sets can be built from any combination of biomarkers listed in Table 3 to make predictions about the effect of EGFR inhibitor treatment in cancer patients. The various biomarkers and biomarkers sets described herein can be used, for example, to predict how patients with cancer will respond to therapeutic intervention with an EGFR inhibitor.
The term "gene" as used herein comprises variants of the gene. The term "variant" relates to nucleic acid sequences which are substantially similar to the nucleic acid sequences given by the GenBank accession number. The term "substantially similar" is well understood by a person skilled in the art. In particular, a gene variant may be an allele which shows nucleotide exchanges compared to the nucleic acid sequence of the most prevalent allele in the human population. Preferably, such a substantially similar nucleic acid sequence has a sequence similarity to the most prevalent allele of at least 80%, preferably at least 85%, more preferably at least 90%, most preferably at least 95%. The term "variants" is also meant to relate to splice variants. The EGFR inhibitor can be selected from the group consisting of gefitinib, erlotinib,
PKI- 166, EKB-569, GW2016, CI- 1033 and an anti-erbB antibody such as trastuzumab and cetuximab. hi another embodiment, the EGFR inhibitor is erlotinib. hi yet another embodiment, the cancer is NSCLC. Techniques for the detection of gene expression of the genes described by this invention include, but are not limited to northern blots, RT-PCR, real time quantitative PCR, primer extension, RNase protection, RNA expression profiling and related techniques. These techniques are well known to those of skill in the art see e.g. Sambrook J et al., Molecular Cloning: A Laboratory Manual, Third Edition (Cold Spring Harbor Press, Cold Spring Harbor, 2000).
Techniques for the detection of protein expression of the respective genes described by this invention include, but are not limited to immunohistochemistry (IHC). In accordance with the invention, cells from a patient tissue sample, e.g., a tumour or cancer biopsy, can be assayed to determine the expression pattern of one or more biomarkers. Success or failure of a cancer treatment can be determined based on the biomarker expression pattern of the cells from the test tissue (test cells), e.g., tumour or cancer biopsy, as being relatively similar or different from the expression pattern of a control set of the one or more biomarkers. In the context of this invention, it was found that the genes listed in table 3 are differentially expressed i.e. show a higher or lower expression level, in tumours of patients who derived benefit from the EGFR inhibitor treatment compared to tumours of patients who did not derive clinical benefit from the EGFR inhibitor treatment. Thus, if the test cells show a biomarker expression profile which corresponds to that of a patient who responded to cancer treatment, it is highly likely or predicted that the individual's cancer or tumour will respond favorably to treatment with the EGFR inhibitor. By contrast, if the test cells show a biomarker expression pattern corresponding to that of a patient who did not respond to cancer treatment, it is highly likely or predicted that the individual's cancer or tumour will not respond to treatment with the EGFR inhibitor. The biomarkers of the present invention i.e. the genes listed in table 3, are a first step towards an individualized therapy for patients with cancer, in particular patients with refractory NSCLC. This individualized therapy will allow treating physicians to select the most appropriate agent out of the existing drugs for cancer therapy, in particular NSCLC. The benefit of individualized therapy for each future patient are: response rates / number of benefiting patients will increase and the risk of adverse side effects due to ineffective treatment will be reduced.
In a further object the present invention provides a therapeutic method of treating a cancer patient identified by the in vitro method of the present invention. Said therapeutic method comprises administering an EGFR inhibitor to the patient who has been selected for treatment based on the predictive expression pattern of at least one of the genes listed in table 3. A preferred EGFR inhibitor is erlotinib and a preferred cancer to be treated is NSCLC. Short description of the figures Figure 1 shows the study design and Figure 2 shows the scheme of sample processing.
Experimental part
Rationale for the Study and Study Design
Recently mutations within the EGFR gene in the tumour tissue of a subset of NSCLC patients and the association of these mutations with sensitivity to erlotinib and gefitinib were described (Pao W, et al. 2004; Lynch et al. 2004; Paez et al. 2004). For the patients combined from two studies, mutated EGFR was observed in 13 of 14 patients who responded to gefitinib and in none of the 11 gefϊtinib-treated patients who did not respond. The reported prevalence of these mutations was 8% (2 of 25) in unselected NSCLC patients. These mutations were found more frequently in adenocarcinomas (21%), in tumours from females
(20%), and in tumours from Japanese patients (26%). These mutations result in increased in vitro activity of EGFR and increased sensitivity to gefitinib. The relationship of the mutations to prolonged stable disease or survival duration has not been prospectively evaluated.
Based on exploratory analyses from the BR.21 study, it appeared unlikely that the observed survival benefit is only due to the EGFR mutations, since a significant survival benefit is maintained even when patients with objective response are excluded from analyses (data on file). Other molecular mechanisms must also contribute to the effect.
Based on the assumption that there are changes in gene expression levels that are predictive of response / benefit to Tarceva™ treatment, microarray analysis was used to detect these changes
This required a clearly defined study population treated with Tarceva™ monotherapy after failure of 1st line therapy. Based on the experience from the BR.21 study, benefiting population was defined as either having objective response, or disease stabilization for 12 weeks. Clinical and microarray datasets were analyzed according to a pre-defined statistical plan.
The application of this technique requires fresh frozen tissue (FFT). Therefore a mandatory biopsy had to be performed before start of treatment. The collected material was frozen in liquid nitrogen (N2).
A second tumour sample was collected at the same time and stored in paraffin (formalin fixed paraffin embedded, FFPE). This sample was analysed for alterations in the EGFR signaling pathway. The ability to perform tumour biopsies via bronchoscopy was a prerequisite for this study. Bronchoscopy is a standard procedure to confirm the diagnosis of lung cancer. Although generally safe, there is a remaining risk of complications, e.g. bleeding.
This study was a first step towards an individualized therapy for patients with refractory NSCLC. This individualized therapy will allow treating physicians to select the most appropriate agent out of the existing drugs for this indication.
Once individualized therapy will be available, the benefit for each future patient will outweigh the risk patients have to take in the present study: response rates / number of benefiting patients will increase, the risk of adverse side effects due to ineffective treatment will be reduced.
Rationale for Dosage Selection
Tarceva™ was given orally once per day at a dose of 150 mg until disease progression, intolerable toxicities or death. The selection of this dose was based on pharmacokinetic parameters, as well as the safety and tolerability profile of this dose observed in Phase I, II and III trials in heavily pre-treated patients with advanced cancer. Drug levels seen in the plasma of patients with cancer receiving the 150 mg/day dose were consistently above the average plasma concentration of 500 ng / ml targeted for clinical efficacy. BR.21 showed a survival benefit with this dose. Objectives of the Study The primary objective was the identification of differentially expressed genes that are predictive for clinical benefit (CR, PR or SD >12 weeks) of Tarceva™ treatment. Identification of differentially expressed genes predictive for "response" (CR, PR) to Tarceva™ treatment was an important additional objective.
The secondary objectives were to assess alterations in the EGFR signaling pathways with respect to benefit from treatment. Study Design
Overview of Study Design and Dosing Regimen
This was an open-label, predictive marker identification Phase II study. The study was conducted in approximately 26 sites in about 12 countries. 264 patients with advanced NSCLC following failure of at least one prior chemotherapy regimen were enrolled over a 12 month period. Continuous oral Tarceva™ was given at a dose of 150 mg/day. Dose reductions were permitted based on tolerability to drug therapy. Clinical and laboratory parameters were assessed to evaluate disease control and toxicity. Treatment continued until disease progression, unacceptable toxicity or death. The study design is depicted in figure 1.
Tumour tissue and blood samples were obtained for molecular analyses to evaluate the effects of Tarceva™ and to identify subgroups of patients benefiting from therapy. Predictive Marker Assessments
Biopsies of the tumour were taken within 2 weeks before start of treatment. Two different samples were collected:
The first sample was always frozen immediately in liquid N2
The second sample was fixed in formalin and embedded in paraffin Snap frozen tissue had the highest priority in this study.
Figure 2 shows a scheme of the sample processing.
Microarray Analysis
The snap frozen samples were used for laser capture microdissection (LCM) of tumour cells to extract tumour RNA and RNA from tumour surrounding tissue. The RNA was analysed on Affymetrix microarray chips (HG-U 133A) to establish the patients' tumour gene expression profile. Quality Control of Affymetrix chips was used to select those samples of adequate quality for statistical comparison.
Single Biomarker Analyses on Formalin Fixed Paraffin Embedded Tissue
The second tumour biopsy, the FFPE sample, was used to perform DNA mutation, IHC and ISH analyses as described below. Similar analyses were performed on tissue collected at initial diagnosis.
The DNA mutation status of the genes encoding EGFR and other molecules involved in the EGFR signaling pathway were analysed by DNA sequencing. Gene amplification of EGFR and related genes were be studied by FISH. Protein expression analyses included immunohistochemical [IHC] analyses of EGFR and other proteins within the EGFR signalling pathway.
Response Assessments
The RECIST (Uni-dimensional Tumour Measurement) criteria were used to evaluate response. These criteria can be found under the following link: http://www.eortc.be/recist/ Note that:To be assigned a status of CR or PR, changes in tumour measurements must be confirmed by repeated assessments at least 4 weeks apart at any time during the treatment period. In the case of SD, follow-up measurements must have met the SD criteria at least once after study entry at a minimum interval of 6 weeks. hi the case of maintained SD, follow-up measurements must have met the SD criteria at least once after study entry with maintenance duration of at least 12 weeks. Survival Assessment
A regular status check every 3 months was performed either by a patient's visit to the clinic or by telephone. All deaths were recorded. At the end of the study a definitive confirmation of survival was required for each patient.
Methods RNA sample preparation and quality control of RNA samples
All biopsy sample processing was handled by a pathology reference laboratory; fresh frozen tissue samples were shipped from investigator sites to the Clinical Sample Operations facility in Roche Basel and from there to the pathology laboratory for further processing. Laser capture microdissection was used to select tumour cells from surrounding tissue. After LCM, RNA was purified from the enriched tumour material. The pathology laboratory then carried out a number of steps to make an estimate of the concentration and quality of the RNA.
RNases are RNA degrading enzymes and are found everywhere and so all procedures where RNA will be used must be strictly controlled to minimize RNA degradation. Most mRNA species themselves have rather short half-lives and so are considered quite unstable.
Therefore it is important to perform RNA integrity checks and quantification before any assay.
RNA concentration and quality profile can be assessed using an instrument from Agilent (Agilent Technologies, Inc., Palo Alto, CA) called a 2100 Bioanalyzer®. The instrument software generates an RNA Integrity Number (RIN), a quantitation estimate (Schroeder, A., et al., The RIN: an RNA integrity number for assigning integrity values to RNA measurements. BMC MoI Biol, 2006. 7: p. 3), and calculates ribosomal ratios of the total RNA sample. The RJN is determined from the entire electrophoretic trace of the RNA sample, and so includes the presence or absence of degradation products. The RNA quality was analysed by a 2100 Bioanalyzer®. Only samples with at least one rRNA peak above the added poly-I noise and sufficient RNA were selected for further analysis on the Affymetrix platform. The purified RNA was forwarded to the Roche Centre for Medical Genomics (RCMG; Basel, Switzerland) for analysis by microarray. 122 RNA samples were received from the pathology lab for further processing.
Target Labeling of tissue RNA samples
Target labeling was carried out according to the Two-Cycle Target Labeling Amplification Protocol from Affymetrix (Affymetrix, Santa Clara, California), as per the manufacturer's instructions.
The method is based on the standard Eberwine linear amplification procedure [but uses two cycles of this procedure to generate sufficient labeled cRNA for hybridization to a microarray. Total RNA input used in the labeling reaction was IOng for those samples where more than IOng RNA was available; if less than this amount was available or if there was no quantity data available (due to very low RNA concentration), half of the total sample was used in the reaction. Yields from the labeling reactions ranged from 20-180μg cRNA. A normalization step was introduced at the level of hybridization where 15μg cRNA was used for every sample.
Human Reference RNA (Stratagene, Carlsbad, CA, USA) was used as a control sample in the workflow with each batch of samples. IOng of this RNA was used as input alongside the test samples to verify that the labeling and hybridization reagents were working as expected. Microarray hybridizations
Affymetrix HG-U 133 A microarrays contain over 22,000 probe sets targeting approximately 18,400 transcripts and variants which represent about 14,500 well- characterized genes.
Hybridization for all samples was carried out according to Affymetrix instructions (Affymetrix Inc., Expression Analysis Technical Manual, 2004). Briefly, for each sample,
15μg of biotin-labeled cRNA were fragmented in the presence of divalent cations and heat and hybridized overnight to Affymetrix HG-U 133 A full genome oligonucleotide arrays. The following day arrays were stained with streptavidin-phycoerythrin (Molecular Probes;
Eugene, OR) according to the manufacturer's instructions. Arrays were then scanned using a GeneChip Scanner 3000 (Affymetrix), and signal intensities were automatically calculated by
GeneChip Operating Software (GCOS) Version 1.4 (Affymetrix).
Statistical Analysis
Analysis of the Affymetrix™ data consisted of five main steps. Step 1 was quality control. The goal was to identify and exclude from analysis array data with a sub-standard quality profile.
Step 2 was pre-processing and normalization. The goal was to create a normalized and scaled "analysis data set", amenable to inter-chip comparison. It comprised background noise estimation and subtraction, probe summarization and scaling.
Step 3 was exploration and description. The goal was to identify potential bias and sources of variability. It consisted of applying multivariate and univariate descriptive analysis techniques to identify influential covariates.
Step 4 was modeling and testing. The goal was to identify a list of candidate markers based on statistical evaluation of the difference in mean expression level between "clinical benefit" and "no clinical benefit" patients. It consisted in fitting an adequate statistical model to each probe-set and deriving a measure of statistical significance.
Step 5 was a robustness analysis. The goal was to generate a qualified list of candidate markers that do not heavily depend on the pre-processing methods and statistical assumptions. It consisted in reiterating the analysis with different methodological approaches and intersecting the list of candidates.
All analyses were performed using the R software package.
Step 1 : Quality Control
The assessment of data quality was based on checking several parameters. These included standard Affymetrix GeneChip™ quality parameters, in particular: Scaling Factor,
Percentage of Present Call and Average Background. This step also included visual inspection of virtual chip images for detecting localized hybridization problems, and comparison of each chip to a virtual median chip for detecting any unusual departure from median behavior. Inter-chip correlation analysis was also performed to detect outlier samples. In addition, ancillary measures of RNA quality obtained from analysis of RNA samples with the Agilent Bioanalyzer™ 2100 were taken into consideration.
Based on these parameters, data from 20 arrays were excluded from analysis. Thus data from a total of 102 arrays representing 102 patients was included in the analysis. The clinical description of these 102 samples set is reported in table 1. Table 1: Description of clinical characteristics of patients included in the analysis
Figure imgf000013_0001
Step 2: Data pre-processing and normalization
The rma algorithm (Irizarry, R. A., et al., Summaries of Affymetrix GeneChip probe level data. Nucl. Acids Res., 2003. 31(4): p. el5) was used for pre-processing and normalization. The mas5 algorithm (AFFYMETRIX, GeneChip® Expression: Data Analysis
Fundamentals. 2004, AFFYMETRIX) was used to make detection calls for the individual probe-sets. Probe-sets called "absent" or "marginal" in all samples were removed from further analysis; 5930 probe-sets were removed from analysis based on this criterion. The analysis data set therefore consisted of a matrix with 16353 (out of 22283) probe-sets measured in 102 patients.
Step 3: Data description and exploration
Descriptive exploratory analysis was performed to identify potential bias and major sources of variability. A set of covariates with a potential impact on gene expression profiles was screened. It comprised both technical and clinical variables. Technical covariates included: date of RNA processing (later referred to as batch), RIN (Schroeder, A., et al., The RIN: an RNA integrity number for assigning integrity values to RNA measurements. BMC MoI Biol, 2006. 7: p. 3) (as a measure of RNA quality/integrity), Operator and Center of sample collection. Clinical covariates included: Histology type, smoking status, tumour grade, performance score (Oken, M.M., et al., Toxicity and response criteria of the Eastern Cooperative Oncology Group. Am J Clin Oncol, 1982. 5(6): p. 649-55), demographic data, responder status and clinical benefit status.
The analysis tools included univariate ANOVA and principal component analysis. For each of these covariates, univariate ANOVA was applied independently to each probe-set. A significant effect of the batch variable was identified. In practice, the batch variable captured differences between dates of sample processing and Affymetrix chip lot. After checking that the batch variable was nearly independent from the variables of interest, the batch effect was corrected using the method described in Johnson, W.E., C. Li, and A. Rabinovic, Adjusting batch effects in microarray expression data using empirical Bayes methods. Biostat, 2007. 8(1): p. 118-127.
The normalized data set after batch effect correction served as the analysis data set in subsequent analyses.
Histology and RlN were two additional important variables highlighted by the descriptive analysis. Step 4: Data modeling and testing.
A linear model was fitted independently to each probe-set. Variables included in the model are reported in table 2. The model parameters were estimated by the maximum likelihood technique. The parameter corresponding to the "Clinical Benefit" variable (Xl) was used to assess the difference in expression level between the group of patients with clinical benefit and the group with no clinical benefit.
Table 2: Description of the variables included in the linear model.
Figure imgf000014_0001
Figure imgf000015_0001
For each probe-set i, the aim of the statistical test was to reject the hypothesis that the mean expression levels in patients with clinical benefit and patients without clinical benefit are equal, taking into account the other adjustment covariates listed in table 2. Formally, the null hypothesis of equality was tested against a two sided alternative.The corresponding p- values are reported in table 3.
The choice of linear model was motivated by two reasons. Firstly, linear modeling is a versatile, well-characterized and robust approach that allows for adjustment of confounding variables when estimating the effect of the variable of interest. Secondly, given the sample size of 102, and the normalization and scaling of the data set, the normal distribution assumption was reasonable and justified.
For each probe-set, the assumption of homogeneity of variance was evaluated using Fligner-Killeen tests based on the model residuals. The analysis consisted of 3 steps:
1. Test each categorical variables for homogeneity of residual variance 2. Note the variable V with the least p-value
3. If the least p-value is less than 0.001, re-fit the model allowing the different level of variables V to have a different variance.
Step 5 : Robustness
The goal of the robustness analysis was to reduce the risk that the results of the analysis might be artifactual and a result of the pre-processing steps or assumptions underlying the statistical analysis. The following three aspects were considered: a) inclusion or exclusion of a few extra chips at the quality control step; b) pre-processing and normalization algorithm; c) statistical assumptions and testing approach.
The list of candidate markers was defined as the subset of genes consistently declared as significant with different analysis settings. The different applied analysis options were the following: a) An additional subset of 8 chips was identified based on more stringent quality control criteria. A "reduced data set" was defined by excluding these 8 chips. b) MAS5 was identified as an alternative to rma for pre-processing and normalization. MAS5 uses different method for background estimation, probe summarization and normalization. c) Two additional statistical tests were employed. These two additional tests rely on a different set of underlying statistical assumptions. a. A wilcoxon test for the difference between clinical and no clinical benefit and b. a likelihood ratio test (LRT) testing for the logistic regression model where Clinical benefit was taken as the response variable and gene expression as covariates. For each probe-set, the LRT was following a Chi-square with 1 degree of freedom.
In summary, two sets of samples (the "full" data-set and the "reduced" data-set) , and 2 pre-processing algorithm (mas5 and rma) were considered; this resulted in four different analysis data sets. To each of these four data sets, three different statistical tests were applied. Therefore, for each probe-set, three p-values were calculated. In each analysis data set, a composite criterion was applied to identify the list of differentially regulated genes. This criterion was defined as: the maximum p-value is less than 0.05 and the geometric mean of p- values is less than 0.01.
The robustness analysis using criterion 2 for identifying markers resulted in a list of 36 probe-sets, corresponding to 36 different genes. These markers are reported in table 3.
Table 3: Gene markers of Clinical Benefit based on the robustness analysis after application of the composite Criterion.
Column 1 is the Affymetrix identifier of the probe-set. Column 2 is the GenBank accession number of the corresponding gene sequence. Column 3 is the corresponding official gene name. Column 4 is the corresponding adjusted mean fold change in expression level between clinical and no clinical benefit patient, as estimated with the linear model. Column 5 is the p-value for the test of difference in expression level between clinical benefit and no clinical benefit patients as derived from the linear model.
Figure imgf000016_0001
Figure imgf000017_0001
Figure imgf000018_0001
Discussion
By analyzing tissue samples with high-density oligonucleotide microarray technology, and applying statistical modeling to the data, we have been able to identify genes whose expression levels may be predictive of patients deriving a clinical benefit from treatment with erlotinib. A composite significance criterion (defined here above), was applied and resulted in a list (see table 3) of 36 probe sets representing 35 known genes. The function of these genes is complex and not always well characterized or fully understood.
The functional annotations of genes in table 3 was analyzed using the Ingenuity software (Ingenuity® Systems, www.ingenuity.com). This software provides an interface to a proprietary knowledge base of gene annotation compiled and regularly updated based on scientific literature.
This global analysis shows that table 3 contains genes that are useful for discriminating different tumour categories, in particular with regard to response to the EGFR inhibitor Erlotinib.
Table 4: List of the marker genes of the present invention
Column 1 is the GenBank accession number of the human gene sequence; Column 2 is the corresponding official gene name and Column 3 is the Sequence Identification number of the human nucleotide sequence as used in the present application. For certain genes table 4 contains more than one sequence identification number since several variants of the gene are registered in the GeneBank.
Figure imgf000019_0001
Figure imgf000020_0001
Figure imgf000021_0001

Claims

Claims
I . An in vitro method of predicting the response of a cancer patient to treatment with an EGFR inhibitor comprising: determining an expression level of at least one gene selected from table 3 in a tumour sample of a patient and comparing the expression level of the at least one gene to a value representative of an expression level of the at least one gene in tumours of a patient population deriving no clinical benefit from EGFR inhibitor treatment, wherein a differential expression level of the at least one gene in the tumour sample of the patient is indicative for a patient who will derive clinical benefit from the treatment.
2. The method of claim 1, wherein the expression level is determined by microarray technology.
3. The method of claim 1 or 2, wherein the expression level of two genes is determined.
4. The method of claims 1 to 3, wherein the expression level of three genes is determined.
5. The method of claims 1 to 4, wherein the gene is selected from the group consisting of ATP6V0E1, MAPREl, PSMA5, ACSL3, RAPlA, SLC2A3, CHMP2B, RFK, CTGF, HSP A8, AKAP12, LOX, SLMO2, NOMO3, APOO and said gene shows a lower expression level in the tumour sample of the patient compared to the value representative of an expression level of the at least one gene in tumours of a patient population deriving no clinical benefit from EGFR inhibitor treatment
6. The method of claims 1 to 4, wherein the the gene is selected from the group consisting of SDCl, CEBPA, ST6GALNAC2, PLA2G6, PMS2L11, C19orf7, DDX 17, SFPQ, PMS2L3, SLC35E2, PMSL2, URG4, PPP1R13B, NRCAM, FLJ10916, FLJ13197, GPRl 72B, ZNF506, ARHGAP8, CELSRl, LYK5 and said gene shows a higher expression level in the tumour sample of the patient compared to the value representative of an expression level of the at least one gene in tumours of a patient population deriving no clinical benefit from EGFR inhibitor treatment.
7. The method of claims 1 to 6, wherein the EGFR inhibitor is erlotinib.
8. The method of claims 1 to 7, wherein the cancer is NSCLC.
9. Use of a gene listed in table 3 for predicting the response of a cancer patient to
EGFR inhibitor treatment.
10. The use of claim 9, wherein the cancer is NSCLC.
I 1. The use of claim 9 or 10, wherein the EGFR inhibitor is erlotinib.
12. A method of treating a cancer patient identified by a method of claims 1 to 8 comprising administering an EGFR inhibitor to the patient.
13. The method of claim 12, wherein the EGFR inhibitor is erlotinib.
14. The method of claim 12 or 13, wherein the cancer is NSCLC.
PCT/EP2008/006513 2007-08-14 2008-08-07 Predictive markers for egfr inhibitor treatment WO2009021674A1 (en)

Priority Applications (8)

Application Number Priority Date Filing Date Title
MX2010001571A MX2010001571A (en) 2007-08-14 2008-08-07 Predictive markers for egfr inhibitor treatment.
EP08785419A EP2188391A1 (en) 2007-08-14 2008-08-07 Predictive markers for egfr inhibitor treatment
US12/672,946 US20110184004A1 (en) 2007-08-14 2008-08-07 Predictive marker for egfr inhibitor treatment
BRPI0815415-5A2A BRPI0815415A2 (en) 2007-08-14 2008-08-07 PREDICTIVE MARKER FOR EGFR INHIBITOR TREATMENT
CA2695485A CA2695485A1 (en) 2007-08-14 2008-08-07 Predictive markers for egfr inhibitor treatment
CN200880103326A CN101778954A (en) 2007-08-14 2008-08-07 Predictive markers for egfr inhibitor treatment
AU2008286407A AU2008286407A1 (en) 2007-08-14 2008-08-07 Predictive markers for EGFR inhibitor treatment
JP2010520464A JP2010535517A (en) 2007-08-14 2008-08-07 Predictive marker for EGFR inhibitor treatment

Applications Claiming Priority (2)

Application Number Priority Date Filing Date Title
EP07114292.1 2007-08-14
EP07114292 2007-08-14

Publications (1)

Publication Number Publication Date
WO2009021674A1 true WO2009021674A1 (en) 2009-02-19

Family

ID=39884813

Family Applications (1)

Application Number Title Priority Date Filing Date
PCT/EP2008/006513 WO2009021674A1 (en) 2007-08-14 2008-08-07 Predictive markers for egfr inhibitor treatment

Country Status (9)

Country Link
EP (1) EP2188391A1 (en)
JP (1) JP2010535517A (en)
KR (1) KR20100037637A (en)
CN (1) CN101778954A (en)
AU (1) AU2008286407A1 (en)
BR (1) BRPI0815415A2 (en)
CA (1) CA2695485A1 (en)
MX (1) MX2010001571A (en)
WO (1) WO2009021674A1 (en)

Cited By (1)

* Cited by examiner, † Cited by third party
Publication number Priority date Publication date Assignee Title
EP2419522A2 (en) * 2009-04-17 2012-02-22 Glen Weiss Methods and kits to predict therapeutic outcome of tyrosine kinase inhibitors

Families Citing this family (4)

* Cited by examiner, † Cited by third party
Publication number Priority date Publication date Assignee Title
CN108732351A (en) * 2017-04-20 2018-11-02 中国科学院上海生命科学研究院 EPS8L2 is as tubercle and the biomarker of early warning liver cancer in instruction liver
CN108732349A (en) * 2017-04-20 2018-11-02 中国科学院上海生命科学研究院 LTA4H is as tubercle and the biomarker of early warning liver cancer in instruction liver
CN108732350A (en) * 2017-04-20 2018-11-02 中国科学院上海生命科学研究院 PLA2G6 is as tubercle and the biomarker of early warning liver cancer in instruction liver
CN110780072B (en) * 2019-12-09 2021-08-06 四川大学华西医院 Application of APOO autoantibody detection reagent in preparation of lung cancer screening kit

Citations (12)

* Cited by examiner, † Cited by third party
Publication number Priority date Publication date Assignee Title
US5202231A (en) 1987-04-01 1993-04-13 Drmanac Radoje T Method of sequencing of genomes by hybridization of oligonucleotide probes
US5445934A (en) 1989-06-07 1995-08-29 Affymax Technologies N.V. Array of oligonucleotides on a solid substrate
US5525464A (en) 1987-04-01 1996-06-11 Hyseq, Inc. Method of sequencing by hybridization of oligonucleotide probes
US5744305A (en) 1989-06-07 1998-04-28 Affymetrix, Inc. Arrays of materials attached to a substrate
US5795716A (en) 1994-10-21 1998-08-18 Chee; Mark S. Computer-aided visualization and analysis system for sequence evaluation
US5800992A (en) 1989-06-07 1998-09-01 Fodor; Stephen P.A. Method of detecting nucleic acids
WO2001079556A2 (en) * 2000-04-14 2001-10-25 Millennium Pharmaceuticals, Inc. Novel genes, compositions and methods for the identification, assessment, prevention, and therapy of human cancers
WO2004071572A2 (en) * 2003-02-06 2004-08-26 Genomic Health, Inc. Gene expression markers for response to egfr inhibitor drugs
WO2005049829A1 (en) * 2003-05-30 2005-06-02 Astrazeneca Uk Limited Process
WO2006101925A2 (en) 2005-03-16 2006-09-28 Osi Pharmaceuticals, Inc. Biological markers predictive of anti-cancer response to epidermal growth factor receptor kinase inhibitors
WO2006119980A1 (en) * 2005-05-11 2006-11-16 F. Hoffmann-La Roche Ag Determination of responders to chemotherapy
WO2007067500A2 (en) * 2005-12-05 2007-06-14 Genomic Health, Inc. Predictors of patient response to treatment with egfr inhibitors

Patent Citations (13)

* Cited by examiner, † Cited by third party
Publication number Priority date Publication date Assignee Title
US5695940A (en) 1987-04-01 1997-12-09 Hyseq, Inc. Method of sequencing by hybridization of oligonucleotide probes
US5202231A (en) 1987-04-01 1993-04-13 Drmanac Radoje T Method of sequencing of genomes by hybridization of oligonucleotide probes
US5525464A (en) 1987-04-01 1996-06-11 Hyseq, Inc. Method of sequencing by hybridization of oligonucleotide probes
US5800992A (en) 1989-06-07 1998-09-01 Fodor; Stephen P.A. Method of detecting nucleic acids
US5744305A (en) 1989-06-07 1998-04-28 Affymetrix, Inc. Arrays of materials attached to a substrate
US5445934A (en) 1989-06-07 1995-08-29 Affymax Technologies N.V. Array of oligonucleotides on a solid substrate
US5795716A (en) 1994-10-21 1998-08-18 Chee; Mark S. Computer-aided visualization and analysis system for sequence evaluation
WO2001079556A2 (en) * 2000-04-14 2001-10-25 Millennium Pharmaceuticals, Inc. Novel genes, compositions and methods for the identification, assessment, prevention, and therapy of human cancers
WO2004071572A2 (en) * 2003-02-06 2004-08-26 Genomic Health, Inc. Gene expression markers for response to egfr inhibitor drugs
WO2005049829A1 (en) * 2003-05-30 2005-06-02 Astrazeneca Uk Limited Process
WO2006101925A2 (en) 2005-03-16 2006-09-28 Osi Pharmaceuticals, Inc. Biological markers predictive of anti-cancer response to epidermal growth factor receptor kinase inhibitors
WO2006119980A1 (en) * 2005-05-11 2006-11-16 F. Hoffmann-La Roche Ag Determination of responders to chemotherapy
WO2007067500A2 (en) * 2005-12-05 2007-06-14 Genomic Health, Inc. Predictors of patient response to treatment with egfr inhibitors

Non-Patent Citations (4)

* Cited by examiner, † Cited by third party
Title
IYER VR ET AL., SCIENCE, vol. 283, 1999, pages 83 - 87
JOHNSTON, M. CURR. BIOL., vol. 8, 1998, pages R171 - 174
MING-SOUND TSAO ET AL: "Erlotinib in Lung Cancer Molecular and Clinical Predictors of Outcome", NEW ENGLAND JOURNAL OF MEDICINE, MASSACHUSETTS MEDICAL SOCIETY, BOSTON, MA, US, vol. 353, no. 2, 14 July 2005 (2005-07-14), pages 133 - 145, XP007905868, ISSN: 1533-4406 *
SAMBROOK J: "Molecular Cloning A Laboratory Manual, Third Edition", 2000, COLD SPRING HARBOR PRESS

Cited By (2)

* Cited by examiner, † Cited by third party
Publication number Priority date Publication date Assignee Title
EP2419522A2 (en) * 2009-04-17 2012-02-22 Glen Weiss Methods and kits to predict therapeutic outcome of tyrosine kinase inhibitors
EP2419522A4 (en) * 2009-04-17 2012-10-31 Glen Weiss Methods and kits to predict therapeutic outcome of tyrosine kinase inhibitors

Also Published As

Publication number Publication date
JP2010535517A (en) 2010-11-25
AU2008286407A1 (en) 2009-02-19
KR20100037637A (en) 2010-04-09
BRPI0815415A2 (en) 2015-02-03
EP2188391A1 (en) 2010-05-26
MX2010001571A (en) 2010-03-15
CA2695485A1 (en) 2009-02-19
CN101778954A (en) 2010-07-14

Similar Documents

Publication Publication Date Title
EP2188391A1 (en) Predictive markers for egfr inhibitor treatment
US20110218212A1 (en) Predictive markers for egfr inhibitors treatment
AU2008286335B2 (en) Predictive marker for EGFR inhibitor treatment
US20110245279A1 (en) Predictive marker for egfr inhibitor treatment
US9121067B2 (en) Predictive marker for EGFR inhibitor treatment
EP2179056A2 (en) Egfr inhibitor treatment marker
US20110312981A1 (en) Predictive marker for egfr inhibitor treatment
US20110184004A1 (en) Predictive marker for egfr inhibitor treatment
WO2009021680A1 (en) Predictive marker for egfr inhibitor treatment
US20110190321A1 (en) Predictive marker for egfr inhibitor treatment
EP2176429A1 (en) Predictive marker for egfr inhibitor treamtent

Legal Events

Date Code Title Description
WWE Wipo information: entry into national phase

Ref document number: 200880103326.X

Country of ref document: CN

121 Ep: the epo has been informed by wipo that ep was designated in this application

Ref document number: 08785419

Country of ref document: EP

Kind code of ref document: A1

WWE Wipo information: entry into national phase

Ref document number: 2008785419

Country of ref document: EP

WWE Wipo information: entry into national phase

Ref document number: 2008286407

Country of ref document: AU

WWE Wipo information: entry into national phase

Ref document number: 203648

Country of ref document: IL

WWE Wipo information: entry into national phase

Ref document number: 2695485

Country of ref document: CA

WWE Wipo information: entry into national phase

Ref document number: 233/MUMNP/2010

Country of ref document: IN

WWE Wipo information: entry into national phase

Ref document number: MX/A/2010/001571

Country of ref document: MX

WWE Wipo information: entry into national phase

Ref document number: 2010520464

Country of ref document: JP

ENP Entry into the national phase

Ref document number: 20107003315

Country of ref document: KR

Kind code of ref document: A

NENP Non-entry into the national phase

Ref country code: DE

ENP Entry into the national phase

Ref document number: 2008286407

Country of ref document: AU

Date of ref document: 20080807

Kind code of ref document: A

WWE Wipo information: entry into national phase

Ref document number: 12672946

Country of ref document: US

ENP Entry into the national phase

Ref document number: PI0815415

Country of ref document: BR

Kind code of ref document: A2

Effective date: 20100212