US9670409B1 - Method for reducing swell potential of expansive clayey soil with nano-level constitutive modeling - Google Patents
Method for reducing swell potential of expansive clayey soil with nano-level constitutive modeling Download PDFInfo
- Publication number
- US9670409B1 US9670409B1 US15/134,474 US201615134474A US9670409B1 US 9670409 B1 US9670409 B1 US 9670409B1 US 201615134474 A US201615134474 A US 201615134474A US 9670409 B1 US9670409 B1 US 9670409B1
- Authority
- US
- United States
- Prior art keywords
- expansive
- clayey soil
- tcedm
- expansive clayey
- reduction agent
- Prior art date
- Legal status (The legal status is an assumption and is not a legal conclusion. Google has not performed a legal analysis and makes no representation as to the accuracy of the status listed.)
- Expired - Fee Related
Links
Images


Classifications
-
- E—FIXED CONSTRUCTIONS
- E02—HYDRAULIC ENGINEERING; FOUNDATIONS; SOIL SHIFTING
- E02D—FOUNDATIONS; EXCAVATIONS; EMBANKMENTS; UNDERGROUND OR UNDERWATER STRUCTURES
- E02D3/00—Improving or preserving soil or rock, e.g. preserving permafrost soil
- E02D3/12—Consolidating by placing solidifying or pore-filling substances in the soil
-
- A—HUMAN NECESSITIES
- A01—AGRICULTURE; FORESTRY; ANIMAL HUSBANDRY; HUNTING; TRAPPING; FISHING
- A01G—HORTICULTURE; CULTIVATION OF VEGETABLES, FLOWERS, RICE, FRUIT, VINES, HOPS OR SEAWEED; FORESTRY; WATERING
- A01G25/00—Watering gardens, fields, sports grounds or the like
- A01G25/06—Watering arrangements making use of perforated pipe-lines located in the soil
-
- B—PERFORMING OPERATIONS; TRANSPORTING
- B09—DISPOSAL OF SOLID WASTE; RECLAMATION OF CONTAMINATED SOIL
- B09C—RECLAMATION OF CONTAMINATED SOIL
- B09C1/00—Reclamation of contaminated soil
- B09C1/08—Reclamation of contaminated soil chemically
-
- C—CHEMISTRY; METALLURGY
- C04—CEMENTS; CONCRETE; ARTIFICIAL STONE; CERAMICS; REFRACTORIES
- C04B—LIME, MAGNESIA; SLAG; CEMENTS; COMPOSITIONS THEREOF, e.g. MORTARS, CONCRETE OR LIKE BUILDING MATERIALS; ARTIFICIAL STONE; CERAMICS; REFRACTORIES; TREATMENT OF NATURAL STONE
- C04B33/00—Clay-wares
- C04B33/02—Preparing or treating the raw materials individually or as batches
- C04B33/04—Clay; Kaolin
-
- C—CHEMISTRY; METALLURGY
- C04—CEMENTS; CONCRETE; ARTIFICIAL STONE; CERAMICS; REFRACTORIES
- C04B—LIME, MAGNESIA; SLAG; CEMENTS; COMPOSITIONS THEREOF, e.g. MORTARS, CONCRETE OR LIKE BUILDING MATERIALS; ARTIFICIAL STONE; CERAMICS; REFRACTORIES; TREATMENT OF NATURAL STONE
- C04B33/00—Clay-wares
- C04B33/02—Preparing or treating the raw materials individually or as batches
- C04B33/13—Compounding ingredients
- C04B33/131—Inorganic additives
-
- C—CHEMISTRY; METALLURGY
- C04—CEMENTS; CONCRETE; ARTIFICIAL STONE; CERAMICS; REFRACTORIES
- C04B—LIME, MAGNESIA; SLAG; CEMENTS; COMPOSITIONS THEREOF, e.g. MORTARS, CONCRETE OR LIKE BUILDING MATERIALS; ARTIFICIAL STONE; CERAMICS; REFRACTORIES; TREATMENT OF NATURAL STONE
- C04B33/00—Clay-wares
- C04B33/02—Preparing or treating the raw materials individually or as batches
- C04B33/13—Compounding ingredients
- C04B33/1315—Non-ceramic binders
-
- C—CHEMISTRY; METALLURGY
- C09—DYES; PAINTS; POLISHES; NATURAL RESINS; ADHESIVES; COMPOSITIONS NOT OTHERWISE PROVIDED FOR; APPLICATIONS OF MATERIALS NOT OTHERWISE PROVIDED FOR
- C09K—MATERIALS FOR MISCELLANEOUS APPLICATIONS, NOT PROVIDED FOR ELSEWHERE
- C09K17/00—Soil-conditioning materials or soil-stabilising materials
- C09K17/02—Soil-conditioning materials or soil-stabilising materials containing inorganic compounds only
- C09K17/06—Calcium compounds, e.g. lime
-
- C—CHEMISTRY; METALLURGY
- C09—DYES; PAINTS; POLISHES; NATURAL RESINS; ADHESIVES; COMPOSITIONS NOT OTHERWISE PROVIDED FOR; APPLICATIONS OF MATERIALS NOT OTHERWISE PROVIDED FOR
- C09K—MATERIALS FOR MISCELLANEOUS APPLICATIONS, NOT PROVIDED FOR ELSEWHERE
- C09K17/00—Soil-conditioning materials or soil-stabilising materials
- C09K17/02—Soil-conditioning materials or soil-stabilising materials containing inorganic compounds only
- C09K17/10—Cements, e.g. Portland cement
-
- E—FIXED CONSTRUCTIONS
- E02—HYDRAULIC ENGINEERING; FOUNDATIONS; SOIL SHIFTING
- E02D—FOUNDATIONS; EXCAVATIONS; EMBANKMENTS; UNDERGROUND OR UNDERWATER STRUCTURES
- E02D31/00—Protective arrangements for foundations or foundation structures; Ground foundation measures for protecting the soil or the subsoil water, e.g. preventing or counteracting oil pollution
- E02D31/10—Protective arrangements for foundations or foundation structures; Ground foundation measures for protecting the soil or the subsoil water, e.g. preventing or counteracting oil pollution against soil pressure or hydraulic pressure
-
- B—PERFORMING OPERATIONS; TRANSPORTING
- B09—DISPOSAL OF SOLID WASTE; RECLAMATION OF CONTAMINATED SOIL
- B09C—RECLAMATION OF CONTAMINATED SOIL
- B09C2101/00—In situ
-
- C—CHEMISTRY; METALLURGY
- C04—CEMENTS; CONCRETE; ARTIFICIAL STONE; CERAMICS; REFRACTORIES
- C04B—LIME, MAGNESIA; SLAG; CEMENTS; COMPOSITIONS THEREOF, e.g. MORTARS, CONCRETE OR LIKE BUILDING MATERIALS; ARTIFICIAL STONE; CERAMICS; REFRACTORIES; TREATMENT OF NATURAL STONE
- C04B2235/00—Aspects relating to ceramic starting mixtures or sintered ceramic products
- C04B2235/70—Aspects relating to sintered or melt-casted ceramic products
- C04B2235/74—Physical characteristics
- C04B2235/77—Density
Definitions
- the present disclosure relates to methods of reducing the swell potential of an expansive clayey soil. More specifically, the present disclosure relates to methods of reducing the swell potential of an expansive clayey soil comprising at least one expansive clay mineral with the aid of a nano-level constitutive modeling and preferably with a swelling reduction agent selected from calcite, gypsum, potassium chloride, a composition comprising exchangeable K + , a composition comprising exchangeable Ca 2+ , a composition comprising exchangeable Mg 2 ⁇ , and a combination thereof.
- a swelling reduction agent selected from calcite, gypsum, potassium chloride, a composition comprising exchangeable K + , a composition comprising exchangeable Ca 2+ , a composition comprising exchangeable Mg 2 ⁇ , and a combination thereof.
- Expansive clays are widely prevalent all over the world as one of the most problematic and challenging soils. These soils undergo significant volume change with the change in the moisture regime, thereby posing problems to the stability of the structures founded on such strata.
- the expansive clays become highly erratic in behavior especially when present in unsaturated/partially saturated state having fluctuations of the saturation levels.
- More challenging is the fact that foundations of most civil engineering structures are generally placed in the partially saturated soil zones with a continuously varying degree of saturation with the environmental and weather conditions.
- Dry unit weight gd, kN/m 3 10 14 Water content, wn, % 15 40 Liquid limit, LL, % 120 160 Plastic limit, PL, % 30 60 Plasticity index, PI, % 90 100 Shrinkage limit, SL, % 9 15 Percent sand, % 0 5 Percent silt, % 15 50 Percent clay, % 50 90 Specific gravity, Gs 2.5 2.6 Selling pressure, kN/m 3 200 1000 Swell percent 2 20
- Microfabric is defined as regular aggregations of particles and the very small pores between them; typical fabric units are up to a few tens of micrometers across.
- the minifabric consists of the aggregations of the microfabric and the interassemblage pores between them; minifabric being a few hundred micrometers in size.
- macrofabric may contain cracks, root holes, laminations, and the like that correspond to the transassemblage pores.
- Abduljauwad and Al-Sulaimani carried out detailed research on the swelling potential of the clay soils in Qatif area of Saudi Arabia. See Abduljauwad, S. N. and Al-Sulaimani, G. J.
- Lumped fabric consisting of micro and nano level pores and idealization of a single mineral fabric attained under controlled compaction conditions by Gens and Alonso and their followers might not have led to the formulation of a complete representative behavior model.
- Nano or molecular level processes may play a role in understanding the volume change behavior of expansive clays.
- Some studies have been conducted to simulate the swelling and/or water absorption behavior of the single or isolated expansive clay minerals, but modelling of the real/natural expansive soil fabric and its interaction with pore fluids at molecular level is still lacking.
- no efforts have been directed to couple the macro and micro scale material behavior based on the findings of these molecular simulations.
- molecular level modeling studies could lead to the real insights into soil behavior, it would result in the validation and/or modifications of several macroscopic (continuum) constitutive behaviors.
- Recent advances in numerical computational methods, high performance hardware, molecular modeling software, and experimental techniques could be used to provide the real insight into the real behavior at the molecular level.
- the present disclosure covers the general comprehension of the fabric and structure of the swelling clays, swelling mechanism, and the corresponding level of efforts in the constitutive and molecular level modeling of expansive clayey soils. All these pertinent issues related to expansive clays are discussed in detail herein.
- the excessive volume change tendency of expansive clays is mainly attributed to the presence of expansive clay minerals in the soil fabric. These expansive clay minerals have got high affinity to the water and dissolved ions due to the net unbalanced electrical charges present on their surfaces. Volume change of the clay structure occurs once these expansive minerals absorb water and move from one partially saturated state to another.
- the volume change behavior is invariably controlled by many factors including type of clay minerals, current degree of saturation, past wetting-drying cycles, fabric and structure created during the compaction/natural deposition, presence of non-expansive minerals, their sizes, percentages and distribution in the matrix.
- a comprehensive constitutive model should encompass all these factors and their relative contribution to the physico-chemical-mechanical interactions at various scale levels. In order to integrate all these factors in a constitutive model, understanding the behavior of the fabric at micro and nano level and its association with the macro behavior is required.
- Each clay particle could be conceptualized as a flake/sheet like structure having dimensions of an order of nanometer with a length or width to thickness ratio of about 2000:1. See Sharma, R. S. (1998), “Mechanical Behavior of Unsaturated Highly Expansive Clays”, PhD Thesis, Oxford University, UK, incorporated herein by reference in its entirety.
- the clay particles are also referred to as particles, lamellae or micelles at these finest levels. See Quirk, J. P. and Murray, R. S.
- Lambe provided a conceptual picture of the clay fabric, although his work was mainly related to the compacted clays only. See Lambe, T. W. (1958), “The structure of compacted clay”, Journal of Soil Mechanics and Foundations Division, ASCE, Vol. 84 (SM2), 1654, incorporated herein by reference in its entirety. He defined the bimodal fabric on dry side and massive and unimodal fabric on wet side of the optimum with the microvoids in between platelets and macrovoids in group of platelets.
- Gens and Alonso considered as pioneers in formulating the first constitutive model framework for the expansive soils, envisaged an expansive clay fabric ( FIGS. 3A, 3B and 3C ). They conceptualized the structural arrangement consisting of three basic microfabric features: elementary particle arrangements or quasi-crystals, particle assemblages, and pore spaces. Gens and Alonso described the particle assemblages formed by arrays of elementary particle arrangements as matrices. In their model, pore spaces in the matrices are made up of intramatrix pores existing between elementary particle arrangements. Elementary particle arrangements join together to make aggregates resulting in a three-dimensional structure of a granular type. Both inter and intra-aggregate pore spaces exist in the aggregated structure.
- a further level of void space also exists in the intraelement pores separating the clay platelets in the elementary particle arrangements. They related both the expansive and collapse type of phenomena to these forms of fabric.
- Clay structure conceptualized by Gens and Alonso was further supported by SEM micrographs of clay samples at optimum and dry and wet sides of optimum by Delage and Graham. See Delage, P. and Graham, J. (1996), “Mechanical behavior of unsaturated soils: understanding the behavior of unsaturated soils requires reliable conceptual models”, In: Alonso EE and Delage P. (eds), Proceedings of 1st International conference on Unsaturated Soils, Paris, vol. 3, Balkema Presses des Ponts et C puzzles pp.
- Likos and Lu were the first to consider a more realistic fabric consisting of inter-aggregate, intra-aggregate (or inter-particle) and interlayer space levels. See Likos, W. J. and Lu, N. (2006), “Pore scale analysis of bulk volume change from crystalline swelling in Na+- and Ca2+-smectite”, Clays and Clay Minerals, Vol. 54, No. 4, pp. 516-529, incorporated herein by reference in its entirety. Their model is shown in FIGS. 4A, 4B and 4C .
- the clay fabric was also further elaborated by Sharma, defining the micro and macro structure as assemblage of particles with three levels of voids as micro, macro and intra platelet voids. His conceptual model is shown schematically in FIGS. 5A, 5B and 5C .
- Sanches et al. also adopted the model of Gens and Alonso considering the two general levels of structures ( FIG. 6 ) and the assumption that microstructure is being considered as saturated at all the field conditions. See Sanchez, M., Gens, A., Guimaras, L. N. and Olivella, S.
- FIG. 7 The conceptual model prepared by them for the cyclic load simulation is shown in FIG. 7 .
- This model could be considered a promising attempt to incorporate natural soil behavior but may be applicable to the homogenous type of clay rocks only and not to the soils consisting of multiple minerals.
- Pinyol et al. did not consider the effects of presence of fissures and cracks present in the natural clay fabric. These fissures and cracks should be considered inherent part of the natural deposits and contribute significantly towards the digenesis and weathering processes.
- Fityus and Buzzi discussed and reviewed the effects of the clay microfabric on the volume change of the macrofabric in the existing models. See Fityus, S. and Buzzi, O (2008), “The place of expansive clays in the framework of unsaturated soil mechanics”, Applied Clay Science, Vol. 43, Issue 2, page 150-155, incorporated herein by reference in its entirety. They conceptualized clay structure as a group of aggregates and clusters into single structural element group called peds.
- a ped is a naturally occurring, structured soil element within a ripened (Pons and Van der Molen) heavy clay soil; that is bounded by discontinuities (typically cracks) that separate it from the adjacent elements of similar form. See Pons, L. J. and Van der Molen, W. H.
- Likos and Wayllace studied the porosity evolution of free and confined bentonite during the phase of the interlayer hydration. See Likos, W. J., Wayllace, A. (2010), “Porosity Evolution of Free and Confined Bentonites During Interlayer Hydration” Clays and Clay Minerals, Vol. 58 (3), pp. 399-414, incorporated herein by reference in its entirety. They came up with a bimodal porosity model developed for Wyoming bentonite using SEM image of the compacted bentonite. The schematic sketch of the model at several levels is shown in FIGS. 9A, 9B, 9C, 9D, and 9E .
- Hueckel while presenting his mixture theory approach for water-mineral interaction in clays under environmental loads provided in a schematic sketch various forms of water in high density clayey soil. His concept of various forms of water and the corresponding pores in a natural soil deposit are shown in FIG. 10 .
- the imaging or mapping methods involve use of dry specimens.
- the crystallites In dry form, the crystallites most probably get fused at the edges and ends and grow into larger crystallites.
- flocculated fabric may also be responsible for such discrepancy. Therefore, the techniques involving the wet specimens such as ESEM and in the dispersed fabric form could provide the real fundamental crystallite size for clay minerals.
- DDL develops for individual clay units and platelets and is schematically shown in FIG. 11 .
- DDL can successively model the effects of cation valence, dielectric constant, electrolyte concentration, and temperature.
- cations are being considered as point charges, DDL may not develop in highly compacted soils and there is less likelihood of presence of parallel clay particles in real clay fabric.
- Wayllace developed a general understanding of the structure of the swelling clay minerals, short and long-term water adsorption mechanisms, and influences of particle and pore fabric on swelling behavior using the porosity evolution model developed by Likos and Lu; the model is conceptually shown in FIG. 12 . See Wayllace, A. (2008), “Volume change and swelling pressure of expansive clay in the Crystalline swelling regime”, PhD Thesis, University of Missouri, US, incorporated herein by reference in its entirety.
- Wayllace divided the water adsorption phenomenon of the clay minerals into three micro-scale mechanisms as hydration, capillarity, and osmosis. Hydration and osmosis play a central role in two main clay swelling processes i.e. crystalline and osmotic swelling (Marshall; Van Olphen; madsen and Muller-Vonfenders). See Marshall, C. E. (1949) “The Colloid Chemistry of the Silicate Minerals”, New York: Academic Press, P. 54; Van Olphen, H. (1977), “An introduction to clay colloid chemistry”, 2nd ed. New York: John Wiley and Sons; Madsen, F. T. and Muller-Vonmoos, M.
- Crystalline swelling is a process whereby expandable 2:1 phyllosilicates sequentially intercalate one, two, three or four discrete layers of H 2 O molecules between the mineral interlayer (Norrish) shown schematically in FIG. 13 .
- Type-II swelling mechanism involves the hydration of the cations dissolved in the water layers.
- Van Olphen calculated that for Ca-montmorillonite, the pressure associated with removing the water from the fourth, third, second, and first hydration states were 20,000 kPa, 125,000 kPa, 250,000 kPa, and 600,000 kPa, respectively. See Van Olphen, H. (1963), “Compaction of Clay Sediments in the Range of Molecular Particle Distances”, Clays and Clay Minerals, Vol. 11, pp. 178-187, incorporated herein by reference in its entirety.
- Constitutive model of expansive clays could be considered as a special case of the general constitutive models for the unsaturated soils.
- Matyas and Radhakrishna could be considered as the pioneers to create the concept of state (constitutive) surfaces relating the void ratio and degree of saturation with the state parameters net stress, p and suction, s. See Matyas, E. I. and Radhakrishna, H. S. (1968), “Volume change characteristics of partially saturated soils”, Geotechnique, Vol. 18 (4), 432-448, incorporated herein by reference in its entirety.
- Alonso et al. (1987) were the first ones to present an integrated volumetric and shear strength elasto-plastic framework of the unsaturated soils. See Alonso, E. E., Gens, A. and Hight, D. W. (1987), “Special Problem Soils, General Report”, Proceedings 9th European Conference on Soil Mechanics, Dublin, Vol. 3, 1087-1146, incorporated herein by reference in its entirety.
- the qualitative framework was further developed into its mathematical form by Alonso et al. (1990) in their landmark paper and was named Barcelona Basic Model (BBM). See Alonso, E. E., Gens, A. and Josa, A. (1990), “A constitutive model for partially saturated soils”, Geotechnique, Vol.
- BBM was quite able to define several typical behaviors of unsaturated soils such as the variation of wetting-induced swelling or collapse strains depending on the magnitude of applied stresses, the reversal of volumetric strains observed during wetting-induced collapse, the increase of shear strength with the increase in suction, stress path independency associated with wetting paths and the opposite when the stress path involves drying or the apparent increase of pre-consolidation stress with suction.
- BBM became a basis for its specific and advanced model for the expansive soils, BExM.
- the extended model incorporates a microfabric of clay particles and aggregations embedded into an overall macrofabric of silt and sand size particles.
- the elementary particles group together to form aggregations and resulting in granular type of structure.
- the pores sizes in the formulated structure are present both as intra and inter aggregations. They considered microfabric to be only affected by the local stresses and hence effective stress principles may be applicable and volume change in microfabric to be reversible and unaffected by strain in the macrofabric. This assumption leads to the fact that if sum of net stress and suction (p+s) remains constant, then no change in overall volume would occur and the stress state moves on a line known as neutral line ( FIG. 17 ).
- microfabric in their model is essentially considered saturated even if the overall saturation of the soil fabric is not achieved.
- micro structural level behavior remains generally independent of the macrostructure behavior and is basically controlled by the physicochemical processes causing volume variations, there is an obvious interaction and this has been covered in the extended model by coupling of the micro and macro structure ( FIGS. 18A and 18B ). Therefore, the extended model for expansive clays should consist of three elements as soil behavior at macroscale, behavior at microscale, and the coupling between the two levels.
- One of the major limitations of the Gens and Alonso model was the assumption regarding the permanent saturation of the microfabric as that does not seem to be realistic as microvoids/inter platelet voids may remain unsaturated as well.
- the permanent saturation of the microfabric may be considered valid only for the intraplatelet fabric only.
- this model was mainly conceptual in nature and no detailed mathematical formulation was provided till a complete mathematical model by Alonso et al. (1999), named as Barcelona Expansive Model (BExM). See Alonso, E. E., Vaunat, J., Gens, A. (1999), “Modeling the mechanical behavior of expansive Clays”, Eng Geol 1999; 54:173-83, incorporated herein by reference in its entirety.
- Alonso et al. (1999) had a landmark contribution in expansive clays model by developing a mathematical model for expansive clays based on the concepts developed in the models of Alonso et al. (1990) and Gens and Alonso.
- the model by Alonso et al. (1999) is able to predict the irreversible expansion caused by wetting at low stresses and shrinkage at high stresses.
- BExM The challenge with BExM is that the micro parameters and the function coupling the micro and macro structural strains are difficult to determine experimentally. Moreover, BExM is mainly concentrating on the stress-strain and strength behavior without considering the water retention behavior of the expansive soils. In this respect, several models have been developed for unsaturated soils but no such effort has been made for expansive soils. Sun and Sun developed an elasto-plastic constitutive model for predicting the hydraulic and mechanical behavior of unsaturated expansive soils based on an existing hydro-mechanical model for unsaturated non-expansive soils. See Sun, W. and Sun, D.
- Guimaraes et al. may be considered as the pioneer in the formulation of a chemo-mechanical model for the expansive clays with due consideration of the contribution from cation content, osmotic suction, and the cation exchange. See Guimares, L. D., Gens, A., Sanchez, M., and Olivella, S. (2013), “A chemo-mechanical constitutive model accounting for cation exchange in expansive clays”, Geotechnique 63, No. 3, 221-234, incorporated herein by reference in its entirety. Their model is a contribution to the microstructure model in the double-structure approach used by Sanchez et al. Their main assumption regarding the elastic or reversibility of the microstructure behavior remains the same.
- the model is quite capable of predicting the behavior of saturated and unsaturated behavior, but most of the basis is through the indirect inferences from macro level studies and no input from molecular level has been incorporated.
- Expansive clay minerals are nano-materials and nano-mechanics concepts can be used to improve fundamental understanding of the behavior and predict the volumetric changes under the desired boundary and stress conditions.
- the macro-scale material behavior can be obtained, with limited input parameters and with great accuracy and details.
- MD Molecular Dynamics
- MD is a computational method which calculates the time dependent behavior of a molecular system.
- MD is based on Newton's second law of motion and provides a trajectory which specifies the variation of position and velocity of individual atoms in a molecular system with time.
- Individual atoms are characterized by balls with bonds represented as springs.
- springs A variety of springs are introduced that capture stretching, angular rotation, and torsion non-bonded interactions are modeled as van der Waals and electrostatic.
- individual atoms would be represented by the balls and the connecting major bonds as springs, while non-bonded interactions among the molecules would be represented by the van der Waal's and electrostatics.
- Skipper et al. performed the swelling simulation of various clay minerals using Monte Carlo (MC) simulation technique. See Skipper, N. T., Sposito, G., and Chang, F. R. (1995a), “Monte Carlo simulations of interlayer molecular structure in swelling clay minerals 1. Methodology”, Clays and Clay Minerals, Vol. 43. No. 3, pp. 285-293; Skipper, N. T., Sposito, G., and Chang, F. R. (1995b), “Monte Carlo simulations of interlayer molecular structure in swelling clay minerals 1. Monolayer Hydrates”, Clays and Clay Minerals, Vol. 43, No. 3. pp. 294-303, each incorporated herein by reference in their entirety.
- MC Monte Carlo
- Karaborni et al. was one of the early researchers who adopted MD for the nano level simulations. See Karaborni, S., Smit, B., Heidug, W. Urai, E. and van Oort, (1996), “The Swelling of Clays: Molecular Simulations of the Hydration of Montmorillonite”, Science, Vol. 271, 23 February, 1996, 1102-1104, incorporated herein by reference in its entirety. They performed molecular dynamics and Monte Carlo simulations to study the lattice expansion mechanism of the Na-montmorillonite ( FIG. 23 ). The simulation results revealed and confirmed the generally accepted theory of four stable states at lattice basal spacings of 9.7, 12.0, 15.5 and 18.3 ⁇ respectively.
- Katti et al. (2005) conducted Molecular Dynamics (MD) study of the interlayer response of pyrophyllite under the influence of water and cations in the interlayer. See Katti, D. R., Schmidt, S., Ghosh, P., and Katti, K. S., (2005), “Modeling Response of Pyrophyllite Clay Interlayer to Applied Stress Using Steered Molecular Dynamics”, Clays and Clay Minerals, Vol. 52, n2, 171-178, incorporated herein by reference in its entirety. They used NAMD (Phillips et al.) and VMD software to perform interactive simulations and these were simulated on the North Dakota State University 32 processor parallel computer system. See Phillips, J.
- CFF Consistent Force Field
- the force F i acting on a particle i is calculated from the interatomic potential function U (r, r 1 , r 2 , r N . . . )
- the function is composed of several potentials such as Coulomb (attractive or repulsive), Born-Mayer-Higgins short range repulsion, van der Waals, and Morse terms. They used TINKER software Ponder for carrying out MD simulations. See Ponder, J. W. (2011), http://dasher.wustl.edu/, Washington University, US, incorporated herein by reference in its entirety. Data input included the initial configuration of the atomic structures and the interatomic potentials assigned to the specific mineral. An NPT (constant number of particles N, pressure P, and temperature T) ensemble was used to acquire the stress-strain behavior of the simulated minerals. The results of the simulations as shown in FIG. 26 reveal a general agreement between the measured and known values of modulli for the minerals except Kaolinite. The authors have attributed the anomalously higher modulus value of Kaolinite to the molecular arrangement at the crystal lattice level.
- Katti et al. (2009) studied the effect of swelling and swelling pressure of the montmorillonite clay using the experimental set up and further validated the results using numerical techniques. See Katti, D. R., Matar, M. I., Katti, K. S. and Amarasinghe, P. M. (2009), “Multiscale Modeling of Swelling Clays: A Computational and Experimental Approach”, KSCE Journal of Civil Engineering (2009) 13(4): 243-255, incorporated herein by reference in its entirety. They used a specially designed swelling device to control the swelling and swelling pressure of the sample and studied the clay fabric created at each specified level. They concluded that there is breakdown of the clay particles/assemblages as the swelling of the clay particles increases as a result of intake of water.
- Tao et al. performed molecular dynamics simulations to investigate the role of the cations K, Na, and Ca on the stability and swelling of montmorillonite. See Tao, L., Xiao-Feng, T., Yu, Z. and Tao, G. (2010), “Swelling of K+, Na+ and Ca2+-montmorillonites and hydration of interlayer cations: a molecular dynamics simulation”, Chin. Phys. B Vol. 19, No. 10 (2010), incorporated herein by reference in its entirety. They used CLAYFF force field (Cygan et al.) to predict the basal spacing as a function of the water content in the interlayer. See Cygan, R. T., Liang, J. J.
- Katti et al. (2011) presented the results of modeling of molecular interactions between swelling clay and fluids and their effects on the mechanical and flow characteristics.
- MD simulations were conducted to study the possible interactions among clay, water, and cations present in the interlayer using MD based software NAMD (Phillips et al.) and the visualization software VMD (Humphrey et al.). See Humphrey, W., Dalke, A., and Schulten, K (1996), “VMD: Visual molecular dynamics”, Journal of Molecular Graphics, 14(1), 33-35, incorporated herein by reference in its entirety.
- the results of the study showed an increased breakdown of the aggregated particles and their corresponding contributions towards the enhanced swelling and the swelling pressure.
- the present disclosure relates to a method of reducing the swell potential of an expansive clayey soil comprising at least one expansive clay mineral.
- the proportion of the weight of the at least one expansive clay mineral relative to the total weight of the expansive clayey soil is P ECM .
- the expansive clayey soil has a water content and a cation exchange capacity (CEC) expressed in meq/100 g dry expansive clayey soil.
- the method includes (a) calculating a first amount of a swelling reduction agent to be incorporated into the expansive clayey soil to form a first swelling reduction agent incorporated expansive clayey soil with a reduced swell potential S 1i(soil) that is no greater than a pre-set level T with a nano-level constitutive modeling based on the water content as an initial water content (IWC) and the cation exchange capacity (CEC) of the expansive clayey soil, wherein the first swelling reduction agent incorporated expansive clayey soil comprises a first swelling reduction agent incorporated at least one expansive clay mineral having a swell potential represented by S 1i(ECM) , wherein the swelling reduction agent is at least one selected from the group consisting of calcite, gypsum, potassium chloride, a composition comprising exchangeable K + , a composition comprising exchangeable Ca 2+, and a composition comprising exchangeable Mg 2+ , wherein the incorporation of the first amount of the swelling reduction agent produces a modified total cohesive energy density (TCED
- the method further comprises measuring the actual swell potential of the expansive clayey soil represented by S* soil .
- the swelling reduction agent comprises gypsum
- the gypsum is white gypsum, red gypsum, or a mixture of white gypsum and red gypsum.
- the at least one expansive clay mineral is at least one selected from the group consisting of smectite, bentonite, montmorillonite, beidellite, vermiculite, attapulgite, nontronite, illite, and chlorite.
- the expansive clayey soil further comprises sand and the method further comprises removing all or a portion of the sand from the expansive clayey soil prior to the incorporating the first amount of the swelling reduction agent into the expansive clayey soil to form the first swelling reduction agent incorporated expansive clayey soil.
- the expansive clayey soil further comprises sand and the method further comprises replacing all or a portion of the sand in the expansive clayey soil with at least one non-expansive clay mineral prior to the incorporating the first amount of the swelling reduction agent into the expansive clayey soil to form the first swelling reduction agent incorporated expansive clayey soil.
- the at least one non-expansive clay mineral is selected from the group consisting of kaolinite, mica, hydroxy interlayered vermiculite (HIV), and hydroxy interlayered smectite (HIS).
- the method further comprises measuring the actual swell potential of the first swelling reduction agent incorporated expansive clayey soil represented by S 1i * (soil) , and comparing S 1i * (soil) with the pre-set level T.
- S 1i * (soil) is greater than the pre-set level T and the method further comprises: (a) determining a water content and a cation exchange capacity (CEC) of the first swelling reduction agent incorporated expansive clayey soil, the CEC expressed in meq/100 g dry first swelling reduction agent incorporated expansive clayey soil, (b) calculating a second amount of a swelling reduction agent to be incorporated into the first swelling reduction agent incorporated expansive clayey soil to form a second swelling reduction agent incorporated expansive clayey soil with a further reduced swell potential S 2i(soil) that is no greater than the pre-set level T with the nano-level constitutive modeling based on the water content as an initial water content (IWC) and the cation exchange capacity (CEC) of the first swelling reduction agent incorporated expansive clayey soil, wherein the second swelling reduction agent incorporated expansive clayey soil comprises a second swelling reduction agent incorporated at least one expansive clay mineral having a swell potential represented by S 2i(
- the present disclosure relates to another method of reducing the swell potential of an expansive clayey soil comprising at least one expansive clay mineral.
- the proportion of the weight of the at least one expansive clay mineral relative to the total weight of the expansive clayey soil is P ECM .
- the expansive clayey soil has a first water content and a cation exchange capacity (CEC) expressed in meq/100 g dry expansive clayey soil.
- the method includes (a) determining a second water content of a wetted expansive clayey soil to be formed by wetting the expansive clayey soil with water, the wetted expansive clayey soil having a reduced swell potential S w(soil) that is no greater than a pre-set level T in accordance with a nano-level constitutive modeling based on the cation exchange capacity (CEC) of the expansive clayey soil and the second water content of the wetted expansive clayey soil as an initial water content (IWC), wherein the wetted expansive clayey soil comprises wetted at least one expansive clay mineral having the second water content and a swell potential S w(ECM) , wherein the second water content as the initial water content (IWC) is greater than the first water content but no greater than a final water content (FWC) of the at least one expansive clay mineral when the at least one expansive clay mineral reaches the swell potential, and produces a modified total cohesive energy density (TCEDm) of the wetted at least
- the present disclosure relates to a method of preparing a site having an expansive clayey soil having a swell potential S soil between T2 and T1, where T2 ⁇ T1, under a two-limit criteria or at or above a pre-set limit T* under a single limit criteria, a first water content, and a cation exchange capacity (CEC) expressed in meq/100 g dry expansive clayey soil, and comprising at least one expansive clay mineral to build a structure.
- the proportion of the weight of the at least one expansive clay mineral relative to the total weight of the expansive clayey soil is P ECM .
- the method includes (a) calculating a first amount of a swelling reduction agent to be incorporated into the expansive clayey soil to form a first swelling reduction agent incorporated expansive clayey soil with a reduced swell potential S 1i(soil) that is no greater than T2 or the pre-set limit T* with a nano-level constitutive modeling based on the first water content as an initial water content (IWC) and the cation exchange capacity (CEC) of the expansive clayey soil, wherein the first swelling reduction agent incorporated expansive clayey soil comprises a first swelling reduction agent incorporated at least one expansive clay mineral having a swell potential represented by S 1i(ECM) , wherein the swelling reduction agent is at least one selected from the group consisting of calcite, gypsum, potassium chloride, a composition comprising exchangeable K + , a composition comprising exchangeable Ca 2+ , and a composition comprising exchangeable Mg 2 ⁇ , wherein the incorporation of the first amount of the swelling reduction agent produces a modified total cohesive
- the swelling reduction agent comprises gypsum
- the gypsum is white gypsum, red gypsum, or a mixture of white gypsum and red gypsum.
- the method further comprises incorporating into the expansive clayey soil or the first swelling reduction agent incorporated expansive clayey soil a soil stabilizing composition comprising at least one material selected from the group consisting of ground granulated blastfurnace slag (GGBS), cement, resins, fly ash, lime, pozzolana, and a mixture of lime and pozzolana to form a stabilized expansive clayey soil or a stabilized first swelling reduction agent incorporated expansive clayey soil.
- GGBS ground granulated blastfurnace slag
- the swelling reduction agent comprises gypsum
- the soil stabilizing composition comprises ground granulated blastfurnace slag (GGBS)
- GGBS ground granulated blastfurnace slag
- the weight ratio of the gypsum:the GGBS in the mixture lies in the range of 1:3 to 3:2.
- the soil stabilizing composition further comprises lime to adjust the pH of the mixture of the gypsum and the GGBS to be greater than 10.5.
- the at least one expansive clay mineral is at least one selected from the group consisting of smectite, bentonite, montmorillonite, beidellite, vermiculite, attapulgite, nontronite, illite, and chlorite.
- the expansive clayey soil further comprises sand and the method further comprises removing all or a portion of the sand from the expansive clayey soil prior to the incorporating the first amount of the swelling reduction agent into the expansive clayey soil to form the first swelling reduction agent incorporated expansive clayey soil.
- the structure is selected from the group consisting of a building foundation, a railway line foundation, a pipe, a footing, a landfill liner, a nuclear waste storage containment liner, a swimming pool, a wall, a driveway, a road, a pavement, a basement floor, and a wellbore.
- FIG. 1A is a graphical presentation of swelling behavior of Sand-Clay mixture (El Sohbi and Rabba, 1981).
- FIG. 1B is a graphical presentation of swelling behavior of Silt-Clay mixture (El Sohbi and Rabba, 1981).
- FIG. 2 is a schematic of smectite clay mineral group (Mitchell, 2005).
- FIG. 3A is a graphical presentation of micro level clay fabric (Gens and Alonso, 1992).
- FIG. 3B is a graphical presentation of macro level clay fabric (Gens and Alonso, 1992).
- FIG. 3C is a graphical presentation of platelet level clay fabric (Gens and Alonso, 1992).
- FIG. 4A is a graphical presentation of conceptual microstructures for Ca 2+ -smectite.
- FIG. 4B is a graphical presentation of conceptual microstructures for Na + -smectite.
- FIG. 4C is a graphical presentation of features of an individual quasicrystal for the quantitative microstructural model (Likos and Lu, 2006).
- FIGS. 5A, 5B, and 5C are graphical presentations of conceptual fabric of clayey soils (Sharma, 1998).
- FIG. 6 is a graphical presentation of micro and macro level clay structure concept (Sanchez et al., 2005).
- FIG. 7 is a graphical presentation of interpretation of diagenesis process and structural effects of loading (a, b, and d), unloading (d and c) and reloading (c and e) cycle on a clayey rock (Pinyol et al., 2007).
- FIG. 8 is a schematic representation of a desiccated clay soil showing the differentiation between the unsaturated soil mass and the saturated soil elements (Fityus and Buzzy, 2009).
- FIG. 9A is an SEM Image of compacted Wyoming bentonite showing bimodal porosity (image obtained parallel to compacted direction).
- FIG. 9B is a conceptual diagram of pore spaces on the inter-aggregate scale (Likos and Wayllace, 2010).
- FIG. 9C is a conceptual diagram of pore spaces on the intra-aggregate scale (Likos and Wayllace, 2010).
- FIG. 9D is a conceptual diagram of pore spaces on the quasicrystal scale (Likos and Wayllace, 2010).
- FIG. 9E is a conceptual diagram of pore spaces on the interlayer scale (Likos and Wayllace, 2010).
- FIG. 10 is a graphical presentation of forms of water in high-density clay soil (F, Free or bulk water; E, external or inter-cluster water; Im, inter-lamellar or intra-cluster water; S, Silt; K, Kaolinite; I, Illite; Sm, Smectite) (Hueckel, 1992).
- F Free or bulk water
- E external or inter-cluster water
- Im inter-lamellar or intra-cluster water
- S Silt
- K Kaolinite
- I Illite
- Sm Smectite
- FIG. 11 is a graphical presentation of diffuse Double Layer (DDL) concept (Guoy, 1910 and Chapman, 1913).
- DDL diffuse Double Layer
- FIG. 12 is a graphical presentation of regimes of crystalline and osmotic swelling (Wayllace, 2008).
- FIG. 13 is a graphical presentation of hydration process of the clay particle layers (Wayllace, 2008).
- FIG. 14A is a graphical presentation of Load Collapse (LC) yield surface concept (Alonso et al., 1990).
- FIG. 14B is a graphical presentation of change in specific volume corresponding to L1, L2, and L3 according to FIG. 14A (Alonso et al., 1990).
- FIG. 14C is a graphical presentation of change in specific volume corresponding to C1, C2, and C3 according to FIG. 14A (Alonso et al., 1990).
- FIGS. 15A, 15B, 15C, and 15D are graphical presentations of elastic zone bounded by Load Collapse (LC) and Suction Increase (SI) curves (Alonso et al., 1990).
- LC Load Collapse
- SI Suction Increase
- FIG. 16 is a graphical presentation of 3-D yield surfaces in p-q-s space (Alonso et al., 1990).
- FIG. 17 is a graphical presentation of neutral line representing microstructure in the model (Gens and Alonso, 1992).
- FIGS. 18A and 18B are graphical presentations of coupling function in the expansive clay model (Gens and Alonso, 1992).
- FIG. 19 is a graphical presentation of Barcelona Expansive Model (BExM) (Alonso et al., 1999).
- FIG. 20 is a graphical presentation of interaction and coupling functions in BExM (Alonso et al., 1999).
- FIGS. 21A and 21B are graphical presentations of constitutive surface for expansive clay in the model (Sanchez et al., 2005).
- FIG. 22 is a graphical presentation of coupling functions between macro and micro structure in the model (Sanchez et al., 2005).
- FIG. 23 is a graphical presentation of Molecular Simulation of the Hydration of Na Montmorillonite (Karaborni et al., 1996).
- FIG. 24 is a perspective view of two pyrophyllite layers comprising 2 ⁇ 4 unit cells each (Katti et al., 2005).
- FIG. 25 is a graphical presentation of forces applied normal to the simulation cell (Katti et al., 2005).
- FIG. 26 is a graphical presentation of modulli values for various minerals obtained from the Nano-scale modelling (Wang et al., 2007).
- FIG. 27 is a snapshot of Na-montmorillonite with 3 water layers in the interlayer (Katti et al., 2009).
- FIG. 28 is a graphical presentation of stress vs. interlayer strain plots for various level of hydration in the interlayer (Katti et al., 2009).
- FIG. 29 is a graphical presentation of swelling curves of the potassium, sodium and calcium-montmorillonite clay showing the dependence of the layer spacing on the water molecules of the clay (Tao et al., 2010).
- FIG. 30 is a plot of interaction energies versus number of water layers in the interlayer (Katti et al., 2011).
- FIG. 31 is a graphical presentation of Proctor Moisture-Density relationships for various bentonite-sand proportioned mixes.
- FIG. 32 is a graphical presentation of swell potential test results using laboratory oedometer tests.
- FIG. 33 is a graphical presentation of typical crystallite size determination using Scherrer (1918) method.
- FIG. 36 is a typical view of water molecule.
- FIG. 37 is a typical view of gypsum unit cell.
- FIG. 38 is a typical view of calcite unit cell.
- FIG. 39 is a graphical presentation of typical initial water sorption in a dry MCEC Na-montmorillonite.
- FIG. 40 is a graphical presentation of the final picture of the MCEC Na-montmorillonite after sorption of 30% water and the subsequent molecular dynamics.
- FIG. 41 is a graphical presentation of variation in d-spacing of MCEC Na-montmorillonite single crystallite during the water sorption process.
- FIG. 42 is a graphical presentation of an empty unit cell (54 ⁇ 26 ⁇ 20 ⁇ ) by using Sorption module.
- FIG. 43 is a graphical presentation of simulation of loose clay minerals mix showing four water sorbed MCEC Na-montmorillonite crystallites occupying random positions in the unit cell by using Sorption module.
- FIG. 44 is a graphical presentation of comparison of compaction to maximum density levels at different confining pressures.
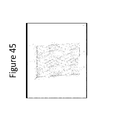
- FIG. 45 is a 3-D view of multiple unit cells showing the continuity of fabric in the compacted MCEC Na-montmorillonite structure.
- FIG. 46 is a graphical presentation of simulation of compaction process of loose crystallites showing compacted crystallites.
- FIG. 47 is a graphical presentation of compaction curve showing density change with time.
- FIG. 48 is a graphical presentation of simulation of stress relief (overconsolidation) showing expanded MCEC Na-montmorillonite structure against a stress relief of 0.001 GPa.
- FIG. 49 is a graphical presentation of density change during the stress relief process.
- FIG. 50 is a graphical presentation of water sorption simulation in a stress relaxed MCEC Na-montmorillonite using Sorption module.
- FIG. 51 is a graphical presentation of swelling simulation of water sorbed MCEC Na-montmorillonite showing the expanded structure.
- FIG. 52 is a graphical presentation of the swelling curve derived from the swelling simulation according to FIG. 51 .
- FIG. 53 is a graphical presentation of swelling versus moisture content plot for MCEC Na-montmorillonite compacted at an initial moisture content of 30%.
- FIG. 54 is a graphical presentation of adsorption of Ca 2+ and SO 4 2 ⁇ on the individual clay crystallite.
- FIG. 55 is a graphical presentation of final fabric of the compacted four crystallites unit cell after swelling simulation according to FIG. 54 .
- FIG. 56 is a graphical presentation of variation of cohesive energy density with moisture and density conditions for HCEC Na-montmorillonite.
- FIG. 57 is a graphical presentation of variation of cohesive energy density with moisture and density conditions for MCEC Na-montmorillonite.
- FIG. 58 is a graphical presentation of variation of cohesive energy density with moisture and density conditions for LCEC Na-montmorillonite.
- FIG. 59 is a graphical presentation of comparison of d-spacing change of a single Na-montmorillonite crystallite using original and modified UFF.
- FIG. 60 is an ESEM image showing a closed fabric in a post swell sample comprising 100% bentonite.
- FIG. 61 is an ESEM image showing an open fabric in a post swell sample comprising 30% bentonite and 70% sand.
- FIG. 62 is a graphical presentation of analysis of d-spacing in compacted 100% bentonite-dry of OMC showing the XRD pattern.
- FIG. 63 is a graphical presentation of analysis of d-spacing in compacted 100% bentonite dry of OMC showing the d-spacing.
- FIG. 64 is a graphical presentation of analysis of d-spacing in compacted 100% bentonite-wet of OMC showing the XRD pattern.
- FIG. 65 is a graphical presentation of analysis of d-spacing in compacted 100% bentonite-wet of OMC showing the d-spacing.
- FIG. 66 is a graphical presentation of initial stage of sorption of water molecules onto montmorillonite crystallite showing Na + cation surrounded by two water molecules.
- FIG. 67 is a graphical presentation of initial stage of sorption of water molecules onto montmorillonite crystallite showing a closer view of Na cation with sorbed water molecule.
- FIG. 68 is a graphical presentation of completely hydrated N + cations providing a general view showing all the cations in the interlayer.
- FIG. 69 is a graphical presentation of completely hydrated Na + cations providing a close up view of a single hydrated Na + cation.
- FIG. 70 is a graphical presentation of interaction of montmorillonite with calcite.
- FIG. 71 is a graphical presentation of interaction of montmorillonite with gypsum.
- FIG. 72 is a graphical presentation of water molecules sorption (10%) to montmorillonite with 40% Na+60% K.
- FIG. 73 is a graphical presentation of water molecules sorption (10%) to montmorillonite with 40% Na+60% Ca.
- FIG. 74 is a graphical presentation of typical fabric of Na-montmorillonite after compaction at 30% water content.
- FIG. 75 is a graphical presentation of typical fabric of Na-montmorillonite after compaction at 40% water content.
- FIG. 76 is a graphical presentation of cohesive energy density plots for crystallites for all stages of simulations (loose, compacted, relaxed, and swelling) for HCEC.
- FIG. 77 is a graphical presentation of cohesive energy density plots for crystallites for all stages of simulations (loose, compacted, relaxed, and swelling) for MCEC.
- FIG. 78 is a graphical presentation of cohesive energy density plots for crystallites for all stages of simulations (loose, compacted, relaxed, and swelling) for LCEC.
- FIG. 79 is a graphical presentation of cohesive energy density plots for crystallites for all stages of simulations (loose, compacted, relaxed, and swelling) for LCEC (same as FIG. 78 with y scale).
- FIG. 80 is a graphical presentation of cohesive energy density plots for crystallites for all stages of simulations (loose, compacted, relaxed, and swelling) for changes in cementation compounds.
- FIG. 81 is a graphical presentation of cohesive energy density plots for crystallites for all stages of simulations (loose, compacted, relaxed, and swelling) for changes in exchangeable cations.
- FIG. 82 is a graphical presentation of the compacted fabric created for Na-montmorillonite at 30% water content using Berendsen barostat.
- FIG. 83 is a graphical presentation of the compacted fabric created for Na-montmorillonite at 30% water content using Parrinello barostat.
- FIG. 84 is a graphical presentation of a fabric before the stress relief for Na-montmorillonite.
- FIG. 85 is a graphical presentation of a fabric after the stress relief for Na-montmorillonite.
- FIG. 86 is a graphical presentation of typical water molecules sorption in Na-montmorillonite crystallites compacted at 30% water content, with blue colored water molecules (in the original color figure) indicating the sorption in the current sorption step.
- FIG. 87 is a graphical presentation of swelling simulation of crystallites unit cell of Na-montmorillonite showing pre swell fabric at 30% water content.
- FIG. 88 is a graphical presentation of swelling simulation of crystallites unit cell of Na-montmorillonite showing post swell fabric at 40% water content.
- FIG. 89 is a graphical presentation of variation of van der Waals cohesive energy density with initial water content.
- FIG. 90 is a graphical presentation of variation of total cohesive energy density of Na-montmorillonite crystallites of different CECs compacted at a range of initial water content.
- FIG. 91 is a graphical presentation of variation of total cohesive energy density of montmorillonite crystallites of LCEC compacted at a range of initial water content.
- FIG. 92 is a graphical presentation of variation of total cohesive energy density of montmorillonite crystallites of MCEC compacted at a range of initial water content.
- FIG. 93 is a graphical presentation of variation of total cohesive energy density of montmorillonite crystallites of HCEC compacted at a range of initial water content.
- FIG. 94 is a graphical presentation of relationships between total cohesive energy density and swell potential for different cases of montmorillonite with variation in cations and non-clay cementation compounds.
- FIG. 95 is a graphical presentation of 3-D representation of constitutive surface of the Nano level model for expansive clays.
- FIG. 96 is a graphical presentation of basic relationship between total cohesive energy density and initial water content.
- FIG. 97 is a graphical presentation of variation of initial density with total cohesive energy density.
- FIG. 98 is a graphical presentation of variation of final density with total cohesive energy density.
- FIG. 99 is a graphical presentation of variation of final water content with the total cohesive energy density.
- FIG. 100 is a graphical presentation showing comparison of swell potential tests results from Hameed (1991) and nano/molecular model predictions.
- FIG. 101 is a graphical presentation of water content-swell relationship for Na-montmorillonite (MCEC).
- FIG. 102 is a graphical presentation of water content-swell relationship for Na-montmorillonite (HCEC).
- FIG. 103 is a graphical presentation of water content-swell relationship for 20% Gypsum (MCEC).
- FIG. 104 is a graphical presentation of XRD results of dry bentonite sample.
- FIG. 105 is a graphical presentation of XRD results of gypsum sample.
- FIG. 106 is a graphical presentation of XRD results of Calcium Carbonate sample.
- FIG. 107 is a graphical presentation of XRD results of kaolinite sample.
- FIG. 108 is a graphical presentation of XRD results of sand sample.
- FIG. 109 is a graphical presentation of XRD Results of 100% bentonite compacted on dry of OMC-pre swell conditions.
- FIG. 110 is a graphical presentation of XRD Results of 100% bentonite compacted on dry of OMC-post swell conditions.
- FIG. 111 is a graphical presentation of XRD Results of 100% bentonite compacted on wet of OMC-pre swell conditions.
- FIG. 112 is a graphical presentation of XRD Results of 100% bentonite compacted on wet of OMC-post swell conditions.
- FIG. 113 is a graphical presentation of XRD Results of 30% bentonite, 50% Calcite, and 20% Sand compacted on dry of OMC-pre swell conditions.
- FIG. 114 is a graphical presentation of XRD Results of 30% bentonite, 50% Calcite, and 20% Sand compacted on dry of OMC post swell conditions.
- FIG. 115 is a graphical presentation of XRD Results of 30% bentonite, 50% Gypsum, and 20% Sand compacted on dry of OMC pre swell conditions.
- FIG. 116 is a graphical presentation of XRD Results of 30% bentonite, 50% gypsum, and 20% sand compacted on dry of OMC-post swell conditions.
- FIG. 117 is a graphical presentation of XRD Results of 30% bentonite, static compaction on dry of OMC-pre swell conditions.
- FIG. 118 is a graphical presentation of XRD Results of 30% bentonite, static compaction on dry of OMC-post swell conditions.
- FIG. 119 is a graphical presentation of XRD Results of 30% bentonite, 30% calcite, and 40% sand compacted on dry of OMC-pre swell conditions.
- FIG. 120 is a graphical presentation of XRD Results of 30% bentonite, 30% calcite, and 40% sand compacted on dry of OMC-post swell conditions.
- FIG. 121 is a graphical presentation of XRD Results of 30% bentonite, 30% kaolinite, and 40% sand compacted on dry of OMC-pre swell conditions.
- FIG. 122 is a graphical presentation of XRD Results of 30% bentonite, 30% kaolinite, and 40% sand compacted on dry of OMC-post swell conditions.
- FIG. 123 is a graphical presentation of XRD Results of 60% bentonite and 40% sand compacted on dry of OMC-pre swell conditions.
- FIG. 124 is a graphical presentation of XRD Results of 60% bentonite and 40% sand compacted on dry of OMC-post swell conditions.
- FIG. 125 is a graphical presentation of XRD Results of 60% bentonite, and 40% sand compacted on wet of OMC-pre swell conditions.
- FIG. 126 is a graphical presentation of XRD Results of 60% Bentonite and 40% Sand compacted on wet of OMC-post swell conditions.
- FIG. 127 is a graphical presentation of XRD Results of Qatif-1 sample at NMC-pre swell conditions.
- FIG. 128 is a graphical presentation of XRD Results of Qatif-1 sample at NMC-post swell conditions.
- FIG. 129 is a graphical presentation of XRD Results of 10% Bentonite and 90% Sand compacted on wet of OMC-pre swell conditions.
- FIG. 130 is a graphical presentation of XRD Results of 10% Bentonite and 90% Sand compacted on wet of OMC-post swell conditions.
- FIG. 131 is a graphical presentation of XRD Results of 30% Bentonite, 30% Gypsum, and 40% Sand compacted on dry of OMC-pre swell conditions.
- FIG. 132 is a graphical presentation of XRD Results of 30% Bentonite, 30% Gypsum, and 40% Sand compacted on dry of OMC-post swell conditions.
- FIG. 133 is a graphical presentation of XRD Results of 30% Bentonite and 70% Sand compacted on wet of OMC-pre swell conditions.
- FIG. 134 is a graphical presentation of XRD Results of 30% Bentonite and 70% Sand compacted on wet of OMC-post swell conditions.
- FIG. 135 is a graphical presentation of XRD Results of Qatif-2 sample at NMC-pre swell conditions.
- FIG. 136 is a graphical presentation of XRD Results of Qatif-2 sample at NMC-post swell conditions.
- FIG. 137 is a graphical presentation of XRD Results of Na-montmorillonite from The Clay Minerals Society compacted on dry of OMC-pre swell conditions.
- FIG. 138 is a graphical presentation of XRD Results of Na-montmorillonite from The Clay Minerals Society compacted on dry of OMC-post swell conditions.
- FIG. 139 is a graphical presentation of XRD Results of Ca-montmorillonite from The Clay Minerals Society compacted on dry of OMC-pre swell conditions.
- FIG. 140 is a graphical presentation of XRD Results of Ca-montmorillonite from The Clay Minerals Society compacted on dry of OMC post swell conditions.
- FIG. 141 is a graphical presentation of FTIR results of dry Bentonite sample.
- FIG. 142 is a graphical presentation of FTIR results of Calcium Carbonate sample.
- FIG. 143 is a graphical presentation of FTIR results of Gypsum sample.
- FIG. 144 is a graphical presentation of FTIR results of Sand sample.
- FIG. 145 is a graphical presentation of FTIR results of Kaolinite sample.
- FIG. 146 is a graphical presentation of comparison of FTIR results of dry Bentonite and at various moisture contents from 10% to 60%.
- FIG. 147 is a graphical presentation of FTIR results of 100% Bentonite compacted on dry of OMC-pre swell conditions.
- FIG. 148 is a graphical presentation of FTIR results of 100% Bentonite compacted on dry of OMC-post swell conditions.
- FIG. 149 is a graphical presentation of FTIR results of 60% Bentonite and 40% Sand compacted on dry of OMC-pre swell conditions.
- FIG. 150 is a graphical presentation of FTIR results of 60% Bentonite and 40% Sand compacted on dry of OMC-post swell conditions.
- FIG. 151 is a graphical presentation of FTIR results of 30% Bentonite and 70% Sand compacted on dry of OMC-pre swell conditions.
- FIG. 152 is a graphical presentation of FTIR results of 30% Bentonite and 70% Sand compacted on dry of OMC-post swell conditions.
- FIG. 153 is a graphical presentation of FTIR results of Qatif-2 sample at NMC-pre swell conditions.
- FIG. 154 is a graphical presentation of FTIR results of Qatif-2 sample at NMC-post swell conditions.
- FIG. 155 is a graphical presentation of FTIR results of 30% Bentonite, 30% Gypsum, and 40% Sand compacted on dry of OMC pre swell conditions.
- FIG. 156 is a graphical presentation of FTIR results of 30% Bentonite, 30% Gypsum, and 40% Sand compacted on dry of OMC-post swell conditions.
- FIG. 157 is a graphical presentation of FTIR results of 30% Bentonite, 50% Gypsum, and 20% Sand compacted on dry of OMC-pre swell conditions.
- FIG. 158 is a graphical presentation of FTIR results of 30% Bentonite, 50% Gypsum, and 20% Sand compacted on dry of OMC-post swell conditions.
- FIG. 159 is a graphical presentation of FTIR results of 30% Bentonite, 10% Gypsum, and 60% Sand compacted on dry of OMC-pre swell conditions.
- FIG. 160 is a graphical presentation of FTIR results of 30% Bentonite, 10% Gypsum, and 60% Sand compacted on dry of OMC-post swell conditions.
- FIG. 161 is a graphical presentation of FTIR results of 30% Bentonite, 30% Calcite, and 40% Sand compacted on dry of OMC-pre swell conditions.
- FIG. 162 is a graphical presentation of FTIR results of 30% Bentonite, 30% Calcite, and 40% Sand compacted on dry of OMC-post swell conditions.
- FIG. 163 is a graphical presentation of FTIR results of 30% Bentonite, 50% Calcite, and 20% Sand compacted on dry of OMC pre swell conditions.
- FIG. 164 is a graphical presentation of FTIR results of 30% Bentonite, 50% Calcite, and 20% Sand compacted on dry of OMC-post swell conditions.
- FIG. 165 is a graphical presentation of FTIR results of 30% Bentonite, 30% Kaolinite, and 40% Sand compacted on dry of OMC-pre swell conditions.
- FIG. 166 is a graphical presentation of FTIR results of 30% Bentonite, 30% Kaolinite, and 40% Sand compacted on dry of OMC-post swell conditions.
- FIG. 167 is a graphical presentation of FTIR results of 10% Bentonite and 90% Sand compacted on wet of OMC-pre swell conditions.
- FIG. 168 is a graphical presentation of FTIR results of 10% Bentonite and 90% Sand compacted on wet of OMC-post swell conditions.
- FIG. 169 is an ESEM image of 100% Bentonite compacted on dry of OMC-pre swell.
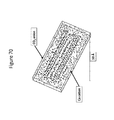
- FIG. 170 is a graphical presentation of EDS of general area of ESEM in FIG. 169 .
- FIG. 171 is an ESEM image of 100% Bentonite compacted on dry of OMC-pre swell.
- FIG. 172 is an ESEM image of 100% Bentonite compacted on dry of OMC-post swell.
- FIG. 173 is an ESEM image of 100% Bentonite compacted on wet of OMC-pre swell.
- FIG. 174 is an ESEM image of 100% Bentonite compacted on wet of OMC-post swell.
- FIG. 175 is a graphical presentation of EDS of 100% Bentonite compacted on dry of OMC-pre swell.
- FIG. 176 is a graphical presentation of EDS of 100% Bentonite compacted on dry of OMC-post swell.
- FIG. 177 is a graphical presentation of EDS of 100% Bentonite compacted on wet of OMC-pre swell.
- FIG. 178 is a graphical presentation of EDS of 100% Bentonite compacted on dry of OMC post swell.
- FIG. 179 is an ESEM image of dry Bentonite sample.
- FIG. 180 is a graphical presentation of EDS of dry Bentonite sample.
- FIG. 181 is an ESEM image of Qatif-2 sample-pre swell.
- FIG. 182 is a graphical presentation of EDS of Qatif-2 sample pre swell.
- FIG. 183 is an ESEM image of 30% Bentonite and 70% Sand-Dry of OMC-Pre swell.
- FIG. 184 is an ESEM image of 30% Bentonite and 70% Sand-Dry of OMC-Post swell.
- FIG. 185 is an ESEM image of 30% Bentonite and 70% Sand Dry of OMC Pre swell.
- FIG. 186 is an ESEM image of 30% Bentonite and 70% Sand-Dry of OMC-Post swell.
- FIG. 187 is an ESEM image of 30% Bentonite, 70% Sand-Static-Dry of OMC-Pre swell.
- FIG. 188 is an ESEM image of 30% Bentonite, 70% Sand-Static-Dry of OMC-Post swell.
- FIG. 189 is an ESEM image of 30% Bentonite, 70% Sand-Static-Dry of OMC-Pre swell.
- FIG. 190 is an ESEM image of 30% Bentonite, 70% Sand-Static-Dry of OMC-Post swell.
- FIG. 191 is an ESEM image of 30% Bentonite, 10% Gypsum, 60% Sand-Dry of OMC-Pre swell.
- FIG. 192 is an ESEM image of 30% Bentonite, 10% Gypsum, 60% Sand-Dry of OMC-Post swell.
- FIG. 193 is a graphical presentation of EDS of 30% Bentonite, 10% Gypsum, 60% Sand-Dry of OMC-Pre swell.
- FIG. 194 is a graphical presentation of EDS of 30% Bentonite, 10% Gypsum, 60% Sand-Dry of OMC Post swell.
- FIG. 195 is an ESEM image of 30% Bentonite, 30% Gypsum, 40% Sand-Dry of OMC-Pre swell.
- FIG. 196 is an ESEM image of 30% Bentonite, 30% Gypsum, 40% Sand-Dry of OMC-Post swell.
- FIG. 197 is an ESEM image of 30% Bentonite, 30% Gypsum, 40% Sand-Dry of OMC-Post swell.
- FIG. 198 is a graphical presentation of EDS of 30% Bentonite, 30% Gypsum, 40% Sand-Dry of OMC-Post swell.
- FIG. 199 is an ESEM image of 30% Bentonite, 30% Calcite, 40% Sand-Dry of OMC-Pre swell.
- FIG. 200 is an ESEM image of 30% Bentonite, 30% Calcite, 40% Sand-Dry of OMC-Post swell.
- FIG. 201 is a graphical presentation of EDS of 30% Bentonite, 30% Calcite, 40% Sand-Dry of OMC-Pre swell.
- FIG. 202 is a graphical presentation of EDS of 30% Bentonite, 30% Calcite, 40% Sand-Dry of OMC Post swell.
- FIGS. 203A, 203B, and 203C are Micro CT Scans of Kaolinite-Sand Compacted Specimens (Pre Swelling).
- FIGS. 204A, 204B, and 204C are Micro CT Scans of Kaolinite-Sand Compacted Specimens (Post Swelling).
- FIGS. 205A, 205B, and 205C are Micro CT Scans of Na-Montmorillonite-Sand Compacted Specimens (Pre Swelling).
- FIGS. 206A, 206B, and 206C are Micro CT Scans of Na-montmorillonite-Sand Compacted Specimens (Post Swelling).
- FIGS. 207A, 207B, and 207C are Micro CT Scans of Ca-montmorillonite-Sand Compacted Specimens (Pre Swelling).
- FIGS. 208A, 208B, and 208C are Micro CT Scans of Ca-montmorillonite-Sand Compacted Specimens (Post Swelling).
- FIGS. 209A and 209B are Micro CT Scans of Qatif-1 Specimens (Pre and Post Swelling).
- FIG. 215 is a graphical presentation of stress relaxation plot of the unit cell of Na-montmorillonite MCEC at 40% water content.
- the present disclosure relates to a method of reducing the swell potential of an expansive clayey soil comprising at least one expansive clay mineral.
- the proportion of the weight of the at least one expansive clay mineral relative to the total weight of the expansive clayey soil is P ECM .
- the expansive clayey soil has a water content and a cation exchange capacity (CEC) expressed in meq/100 g dry expansive clayey soil.
- the method includes (a) calculating a first amount of a swelling reduction agent to be incorporated into the expansive clayey soil to form a first swelling reduction agent incorporated expansive clayey soil with a reduced swell potential S 1i(soil) that is no greater than a pre-set level T with a nano-level constitutive modeling based on the water content as an initial water content (IWC) and the cation exchange capacity (CEC) of the expansive clayey soil, wherein the first swelling reduction agent incorporated expansive clayey soil comprises a first swelling reduction agent incorporated at least one expansive clay mineral having a swell potential represented by S 1i(ECM) , wherein the swelling reduction agent is at least one selected from the group consisting of calcite, gypsum, potassium chloride, a composition comprising exchangeable K + , a composition comprising exchangeable Ca 2+ , and a composition comprising exchangeable Mg 2+ , wherein the incorporation of the first amount of the swelling reduction agent produces a modified total cohesive energy density (TC
- Expansive clay mineral is a type of clay mineral that is known as a lightweight aggregate with a rounded structure, with a porous inner, and a resistant and hard outer layer.
- An expansive clay mineral or an expansive clayey soil comprising one or more expansive clay minerals is prone to large volume changes (swelling and shrinking) that are directly related to changes in water content.
- An expansive clayey soil comprising smectite, montmorillonite, and bentonite clay minerals has the most dramatic shrink-swell capacity.
- An expansive clayey soil can swell in a wet season and shrink and form cracks in a dry season.
- a laboratory test to measure the swell potential of an expansive clayey soil is ASTM D 4829, or more preferably ASTM D 5890.
- a compacted or a natural undisturbed expansive clayey soil sample may be subjected to free swell testing in the presence of water in an oedometer test equipment. Increase in height of the sample is recorded at regular time intervals until no further noticeable change in height of the sample is recorded. Maximum change in the height of the sample divided by the original height is recorded and expressed in percent swell for the tested sample.
- Soils are composed of a variety of materials, most of which do not expand in the presence of moisture. However, a number of clay minerals are expansive.
- the expansive clayey soil comprises at least one expansive clay mineral selected from the group consisting of smectite, bentonite, montmorillonite, beidellite, vermiculite, attapulgite, nontronite, illite, and chlorite.
- the swell potential of the expansive clayey soil is determined by the type and weight percentage of the expansive clay minerals, the type and weight percentage of non-swell cementitious minerals (e.g. calcite and gypsum), and the type and weight percentage of non-expansive clay minerals (e.g. kaolinite).
- compositions of an expansive clayey soil including the types and weight percentages of expansive clay minerals and non-expansive clay minerals, the types and weight percentages of non-clay, non-swell cementitious minerals (e.g. calcite and gypsum), and the weight percentage of quartz (sand) in an expansive clayey soil, can be determined by a mineralogical analysis using, for example, powder X-ray diffraction (XRD) as shown in Table 6 in the “Examples” of the present disclosure, scanning electron microscopy (SEM) with associated energy dispersive micro analysis (EDA), optical microscopy and petrographic analysis.
- XRD powder X-ray diffraction
- the proportion of the weight of the expansive clay minerals relative to the total weight of the expansive clayey soil P ECM , or the weight percentage of the expansive clay minerals (e.g. smectite and illite) in the expansive clayey soil is 5-80%, 10-70%, 20-60%, or 30-50%.
- the weight percentage of non-swell cementitious minerals in the expansive clayey soil is 1-50%, 10-40%, or 20-30%.
- the swell potential of the expansive clayey soil is 1-40%, 5-30%, or 10-20%.
- the expansive clayey soil is a laboratory compacted expansive clayey soil.
- the expansive clayey soil is a natural undisturbed expansive clayey soil.
- nano-level constitutive modeling When the nano-level constitutive modeling is applied to a natural undisturbed expansive clayey soil where macro features dominate in controlling the water in flow and volume change, coupling of the nano-level constitutive modeling with micro and macro level models may be preferred to correlate the amount of the swelling reduction agent incorporated into the expansive clayey soil with the resulting swell potential of the swelling reduction agent incorporated expansive clayey soil.
- An expansive clayey soil comprising one or more expansive clay minerals swells or shrinks when there is a change in water content.
- the water content of the expansive clayey soil may be determined according to ASTM D 2216—Standard Test Method for Laboratory Determination of Water (Moisture) Content of Soil, Rock, and Soil-Aggregate Mixtures.
- the water content is the ratio, expressed as a percentage, of the mass of “pore” or “free” water in a given mass of soil to the mass of the dry soil solids.
- the water content of the soil is calculated according to the following equation:
- the cation exchange capacity (CEC) of the expansive clayey soil is the number of exchangeable cations per dry weight that the expansive clayey soil is capable of holding, at a given pH value, and available for exchange with the soil water solution. It is expressed as milliequivalent of hydrogen per 100 g of dry soil (meq+/100 g), or the SI unit centi-mol per kg (cmol+/kg).
- the expansive and non-expansive clay minerals and humus in the expansive clayey soil have electrostatic surface charges that attract and hold ions.
- the holding capacity of a clay mineral varies with the type of the clay mineral. Humus has a CEC that is two to three times that of the best clay mineral.
- the CEC is dependent upon the pH of the expansive clayey soil. As soil acidity increases (pH decreases), more H ions are attached to the soil colloids, pushing the other cations from the soil colloids and into the soil water solution. Inversely, when an expansive clayey soil becomes more basic (pH increases), the available cations in the soil water solution decreases because there are fewer H + ions to push cations into the soil water solution from the soil colloids (CEC increases).
- the CEC of the expansive clayey soil may be determined by two standardized International Soil Reference and Information Centre methods: extraction with ammonium acetate; and the silver-thiourea method (one-step centrifugal extraction).
- the CEC of the expansive clayey soil may be preferably determined according to the method disclosed by Rayment and Higginson, Electrical Conductivity, In “Australian Laboratory Handbook of Soil and Water Chemical Methods,” Inkata Press: Melbourne, 1992, incorporated herein by reference in its entirety.
- the CEC of the expansive clayey soil is in the range of 30-250 meq/100 g, 40-150 meq/100 g, 60-120 meq/100 g, or 80-100 meq/100 g.
- the water content of the expansive soil is in the range of 5-100%, 10-90%, 20-80%, 30-70%, or 40-60%.
- the swelling reduction agent used by the disclosed method preferably includes, without limitation, calcite, gypsum, potassium chloride, a composition comprising exchangeable K + , a composition comprising exchangeable Ca 2+ , a composition comprising exchangeable Mg 2 ⁇ , and a combination thereof.
- Calcite is a carbonate mineral and the most stable polymorph of calcium carbonate (CaCO 3 ). All forms of calcite, such as fibrous, granular, lamellar, and/or compact calcite, and either highly pure or calcite with impurities may be used. Calcite can be either dissolved by groundwater or precipitated by groundwater, depending on several factors including the water temperature, pH, and dissolved ion concentrations. Calcite is fairly insoluble in cold water, and exhibits an unusual characteristic called retrograde solubility in which it becomes less soluble in water as the temperature increases.
- the pH of the expansive clayey soil is preferably acidic, e.g. a pH of 1-6, preferably a pH of 1-4, or preferably a pH of 2-3, and the temperature of the expansive clayey soil is preferably at a low ambient temperature of 4-30° C., preferably 10-25° C., or more preferably 15-20° C.
- calcite is incorporated into the expansive clayey soil by mixing calcite particles with the expansive clayey soil and/or by depositing a layer of calcite particles on the surface of the expansive clayey soil to let the expansive clayey soil absorb and/or adsorb calcite from the soil water solution.
- calcite is incorporated into the expansive clayey soil by microbiologically induced calcium carbonate precipitation, whereby photosynthetic microorganisms such as cyanobacteria and microalgae; sulfate-reducing bacteria; and some species of microorganisms involved in nitrogen cycle produce calcium carbonate through autotrophic and heterotrophic pathways and induce calcium carbonate precipitation within the soil matrix. Calcite reduces the swell potential of the expansive clayey soil probably by providing binding or cementation effects to the individual or group of the expansive clay mineral particles.
- Gypsum is a soft sulfate mineral composed of calcium sulfate dihydrate, with the chemical formula CaSO 4 .2H 2 O. Gypsum is moderately water-soluble ( ⁇ 2.0-2.25 g/L at 25° C.) and, in contrast to most other salts, exhibits retrograde solubility, becoming less soluble at higher temperatures. Thus, to increase the incorporation of gypsum into the expansive clayey soil through, for example, absorption and/or adsorption, the expansive clayey soil is preferably at a low ambient temperature of 4-30° C., preferably 10-25° C., or more preferably 15-20° C. to facilitate dissolution of gypsum in the soil water solution.
- the gypsum used is pure gypsum that has a white color, i.e. white gypsum.
- the gypsum used is gypsum with impurities that has a wide range of colors, including red gypsum.
- Red gypsum or secondary gypsum is typically comprised predominantly of calcium sulfate in varying states of hydration, along with oxides of iron in an amount varying from about 3-35%, and various trace elements.
- Red gypsum may be produced as an industrial by-product, for example, in the manufacture of titanium dioxide pigment via the well-known sulfate process, in which it is precipitated from acidic solution filtrates.
- incorporación of red gypsum into the expansive clayey soil may also increase the plastic limit and reduce frost susceptibility of the expansive clayey soil.
- the gypsum used is a mixture of white gypsum, red gypsum, and/or one or more other types of impure gypsum.
- Gypsum may be incorporated into the expansive clayey soil by spraying a gypsum water solution onto the expansive clayey soil, soaking the expansive clayey soil in a gypsum water solution, injecting a gypsum water solution into the expansive clayey soil, mixing gypsum particles with the expansive clayey soil, depositing a layer of gypsum particles on the surface of the expansive clayey soil to let the expansive clayey soil absorb and/or adsorb gypsum from the soil water solution.
- gypsum has a higher solubility in water than calcite, in practice using gypsum as a swelling reduction agent advantageously results in a greater reduction in the swell potential of the expansive clayey soil than using an equivalent amount of calcite.
- concentration of the gypsum water solution may be 0.5-2.5 g/L, 1-2 g/L, or 1.5 g/L.
- gypsum reduces the swell potential of the expansive clayey soil probably by providing binding or cementation effects to the individual or group of the expansive clay mineral particles.
- incorporation of potassium chloride into the expansive clayey soil can be accomplished by spraying a KCl water solution onto the expansive clayey soil, soaking the expansive clayey soil in a KCl water solution, injecting a KCl water solution into the expansive clayey soil, mixing solid KCl particles with the expansive clayey soil, depositing a layer of solid KCl particles on the surface of the expansive clayey soil to let the expansive clayey soil absorb and/or adsorb KCl from the soil water solution.
- the concentration of the KCl water solution may be 10-400 g/L, 50-300 g/L, or 100-200 g/L. Similar to calcite and gypsum, KCl reduces the swell potential of the expansive clayey soil probably due to a binding or cementation effect it provides to the expansive clay mineral particles.
- a composition comprising exchangeable K + , Ca 2+ , and/or Mg 2+ may be an aqueous solution comprising K + , Ca 2+ , and/or Mg 2+ , or may be a K + Ca 2+ , and/or Mg 2+ loaded exchange resin to replace certain cations in the expansive clayey soil, e.g. Na + and Li + , with K + , Ca 2+ , and/or Mg 2+ .
- the pH of the expansive clayey soil is adjusted to 8-14, 9-13, or 10-12 by, for example, NaOH, KOH, and/or lime prior to incorporating the swelling reduction agent comprising one or more compositions comprising exchangeable K, Ca 2+ and/or Mg 2+ into the expansive clayey soil.
- the exchangeable K + , Ca 2+ , and/or Mg 2 ⁇ may be incorporated into the expansive clayey soil by spraying the aqueous solution onto the expansive clayey soil, soaking the expansive clayey soil in the aqueous solution, and/or injecting the aqueous solution into the expansive clayey soil.
- the resin particles may be batch mixed with the expansive clayey soil.
- the resin particles may be first packed in resin bags made of, for example, a piece of porous nylon fabric and then the resin bags may be mixed with the expansive clayey soil.
- the resin bags may vary in size, for example, from small ones holding only a few grams of resin to others several centimeters in diameter, depending on the volume of the expansive clayey soil to be treated and the desired efficiency of the contact of the resin particles with the expansive clayey soil.
- the ion exchange resin is modified and shaped as a membrane, and sheets of the resin membranes are placed at various depths and/or on the surface of the expansive clayey soil.
- the chemical structures from which the membrane is made is similar to those to make ion-exchange resin particles.
- membranes may be extruded into sheets and combined with reinforcing material to provide dimensional stability and mechanical strength.
- membranes simplifies the separation of the resin from the expansive clayey soil when the desired cation exchange process, e.g. replacing Na + adsorbed on the surface of the expansive clay minerals with K + , Ca 2+ , and/or Mg 2+ , is complete and when such separation of the resin from the expansive clayey soil is desirable.
- cohesive energy density is an excellent indicator of the interaction of the soil structure with the water sorption and the consequent volume change.
- Cohesive energy density is the amount of energy needed to completely remove unit volume of molecules from their neighbors to infinite separation (an ideal gas).
- CED is highly sensitive to various volume change variables such as water content, density, CEC, type and percentage of exchangeable and non-exchangeable cations, and anions.
- Total CED of any combination of molecules is contributed from two components, i.e., electrostatic and van der Waals forces. Contribution from van der Waals could either be repulsion or attraction in nature, while it is always attraction in nature from electrostatic forces.
- a general trend is that low CEC expansive clay mineral crystallites produce lesser CED, while a higher CEC and the expansive clay mineral crystallites sorbed with other compounds show higher values of CED.
- Total CED has been found to be increasing with an increase in CEC, density, cementation, and bivalent cations and decreasing with water content, while van der Waals CED reduces and becomes repulsion in nature with the same variation of the above parameters.
- lesser water content results in higher cohesive energy, but for same density/moisture, higher CEC crystallites achieve much higher cohesive energy.
- the swell potential of the expansive clayey soil S soil can be calculated based on the proportion of the weight of the expansive clay mineral(s) relative to the total weight of the expansive clayey soil (P ECM ) and the swell potential of the expansive clay mineral(s) (S ECM ) calculated according to the nano-level constitutive modeling for water-induced swelling of the expansive clay mineral(s).
- Equation (6) is the same as Equation (1) when the expansive clayey soil or the expansive clay mineral(s) do not comprise any of the swelling reduction agents listed above, Equation (6) and the corresponding TCEDm supersede Equation (1) and TCED, respectively, hereafter in the “Detailed Description of the Embodiments” when calculations of total cohesive energy density of expansive clay mineral(s) are described and discussed.
- CEC is the cation exchange capacity of the expansive clayey soil expressed in meq/100 g dry expansive clayey soil.
- the swell potential of the expansive clay mineral(s) can be calculated according to Equation (5), following the calculation of TCEDm according to Equation (6) based on the initial water content (IWC) of the expansive clayey soil, the calculation of IDD according to Equation (2) based on the CEC of the expansive clayey soil and TCEDm obtained from Equation (6), and the calculation of FDD according to Equation (3) based on the TCEDm obtained from Equation (6).
- the final water content (FWC) of the expansive clay mineral(s) when S ECM is reached can be calculated according to Equation (4) based on the CEC of the expansive clayey soil and the TCEDm obtained from Equation (6).
- the swell potential of the expansive clayey soil S soil equals S ECM ⁇ P ECM .
- S soil equals S ECM ⁇ 0.3.
- the swell potential of the swelling reduction agent-incorporated expansive clayey soil can be likewise calculated according to Equations (6), (2), (3), and (5) if the type(s) and the amount(s) of the swelling reduction agent(s) and P ECM are known. Conversely, if a target swell potential of the swelling reduction agent-incorporated expansive clayey soil is set based on the pre-set level T, the type(s) and the amount(s) of the swelling reduction agent(s) that need to be incorporated into the expansive clayey soil to obtain the target swell potential can be solved using the same set of equations based on the water content (as the initial water content, IWC) and the CEC of the expansive clayey soil and P ECM .
- a single swelling reduction agent or combinations of the swelling reduction agents to obtain a swell potential of the first swelling reduction agent incorporated expansive clayey soil (S 1i(soil) ) that is no greater than the pre-set level T according to the nano-level constitutive modeling, specifically according to Equations (6), (2), (3), and (5).
- the preferred choices for the single swelling reduction agent or the combinations of the swelling reduction agents to be incorporated into the expansive clayey soil are those where the first amount of calcite needed as calculated according to the nano-level constitutive modeling is in the range of 10-70%, 20-60%, or 30-50% of the total weight of the first swelling reduction agent incorporated expansive clayey soil, the first amount of gypsum needed as calculated according to the nano-level constitutive modeling is in the range of 5-75%, 10-60%, 15-50%, or 20-40% of the total weight of the first swelling reduction agent incorporated expansive clayey soil, the first amount of KC needed as calculated according to the nano-level constitutive modeling is in the range of 2-30%, 5-25%, or 10-20% of the total weight of the first swelling reduction agent incorporated expansive clayey soil, and/or the first amount of the composition comprising exchangeable K + , Ca 2+ , and/or Mg 2+ needed as calculated according to the nano-level constitutive modeling replaces 5-100%, 10-90%, 20-80%
- the pre-set level T may be set based on an acceptable level of swell potential of the expansive clayey soil, for example, a level at which the expansive clayey soil may not exert enough force on a building or other structure built on or within the expansive clayey soil to cause damage, such as 5-10%, 6-9%, or 7-8%.
- the method may further comprise measuring the actual swell potential of the expansive clayey soil represented by S* soil .
- an expansive clayey soil also comprises sand, particularly a large percentage of sand (e.g. at least 50 wt %, at least 60 wt %, or at least 70 wt % of the total weight of the expansive clayey soil)
- the expansive clayey soil may have a relatively open fabric containing relatively large sized pores as compared to an expansive clayey soil containing, for example, 100 wt % of expansive clay minerals, indicating a better water permeability favoring a complete swelling of all the expansive clay minerals present in the soil fabric.
- the expansive clayey soil also comprises sand
- all or a portion of the sand is preferably removed from the expansive clayey soil prior to incorporating the swelling reduction agent, particularly calcite, gypsum, and/or KCl that provide binding or cementation effects to the individual or group of the expansive clay mineral particles, into the expansive clayey soil to reduce the swell potential of the expansive clayey soil.
- the swelling reduction agent particularly calcite, gypsum, and/or KCl that provide binding or cementation effects to the individual or group of the expansive clay mineral particles
- the sand facilitates the contact of the swelling reduction agent with the expansive clay minerals and may require a smaller amount of the swelling reduction agent to make the swell potential of the swelling reduction agent incorporated expansive clayey soil no greater than the pre-set level T.
- the sand may be separated and removed from the expansive clayey soil with one or more soil screen sieves.
- the expansive clayey soil that preferably has been dried and broken up into loose particles may be passed through a soil screen sieve, or more preferably a set of soil screen sieves with the mesh sizes of, for example, #5, #10, #60, and #230 (mesh size is an indication of number of openings per linear inch) and arranged with the soil screen sieve of the largest screen size (e.g. the #5 mesh size screen) on top followed by the soil screen sieves of proportionately decreasing screen sizes to a closed bottom container, preferably with shaking.
- the expansive clayey soil particles that remain on the first sieve of the #5 mesh size are gravels.
- the expansive clayey soil particles that remain on the second sieve of the #10 mesh size are fine gravels.
- the expansive clayey soil particles that remain on the third sieve of the #60 mesh size are coarse sand.
- the expansive clayey soil particles that remain on the fourth sieve of the #230 mesh size are fine sand.
- the expansive clayey soil particles that are collected in the closed bottom container are silt and clay.
- the total mass of the expansive clayey soil processed by the soil screen sieves and the mass of the sand particles are preferably measured by a scale or a balance so that the weight percent of the sand present in or removed from the expansive clayey soil can be determined.
- replacing the sand at an amount of 10-50 wt % of the total weight of the expansive clayey soil with the same mass of gypsum may reduce the swell potential of the expansive clayey soil 60-95%, or 70-90%, or 80% based on the actual swell potential tests performed in the present disclosure and shown in the Examples.
- replacing the sand at an amount of 30-50% of the total weight of the expansive clayey soil with the same mass of calcite may reduce the swell potential of the expansive clayey soil 20-60%, 30-50%, or 40% based on the actual swell potential tests performed in the present disclosure and shown in the Examples.
- all or a portion of the sand removed from the expansive clayey soil may be replaced by at least one non-expansive clay mineral, such as kaolinite, mica, hydroxy interlayered vermiculite (HIV), and hydroxy interlayered smectite (HIS), prior to incorporating the swelling reduction agent into the expansive clayey soil, probably because a non-expansive clay mineral like kaolinite has a fine grained texture with a low water permeability as compared to sand.
- kaolinite such as kaolinite, mica, hydroxy interlayered vermiculite (HIV), and hydroxy interlayered smectite (HIS)
- replacing the sand at an amount of 20-40%, 25-35%, or 30% of the total weight of the expansive clayey soil with the same mass of kaolinite may reduce the swell potential of the expansive clayey soil 10-30%, 15-25%, or 20% based on the actual swell potential tests performed in the present disclosure and shown in the Examples.
- the method further comprises measuring the actual swell potential of the first swelling reduction agent incorporated expansive clayey soil represented by S 1i * (soil) , and comparing S 1i * (soil) with the pre-set level T.
- the difference between the actual swell potential of the first swelling reduction agent-incorporated expansive clayey soil S 1i * (soil) and the calculated swell potential of the first swelling reduction agent-incorporated expansive clayey soil S 1i(soil) with the nano-level constitutive modeling, particularly when gypsum is used as the swelling reduction agent, is less than 10%, less than 5%, less than 3%, or less than 1% of S 1i * (soil) .
- S 1i * may significantly deviate from S 1i(soil) and/or may be larger than the pre-set level T, particularly when calcite is used as the swelling reduction agent.
- Calcite has a lower solubility in water compared to gypsum, resulting in a low percentage of the total input calcite actually interacting with the expansive clay mineral particles and an overestimation of the swelling reduction effect of calcite by the nano-level constitutive modeling.
- the disclosed method may be performed a second time, i.e.
- the method may further comprise (a) determining a water content and a cation exchange capacity (CEC) of the first swelling reduction agent incorporated expansive clayey soil, the CEC expressed in meq/100 g dry first swelling reduction agent incorporated expansive clayey soil, (b) calculating a second amount of a swelling reduction agent to be incorporated into the first swelling reduction agent incorporated expansive clayey soil to form a second swelling reduction agent incorporated expansive clayey soil with a further reduced swell potential S 2i(soil) that is no greater than the pre-set level T with the nano-level constitutive modeling based on the water content as an initial water content (IWC) and the cation exchange capacity (CEC) of the first swelling reduction agent incorporated expansive clayey soil, wherein the second swelling reduction agent incorporated expansive clayey soil comprises a second swelling reduction agent incorporated at least one expansive clay mineral having a swell potential represented by S 2i(ECM) , wherein the swelling reduction agent is at least one selected from the group consisting of calcite
- the method may further comprise measuring the actual swell potential of the second swelling reduction agent incorporated expansive clayey soil and comparing it with the pre-set level T.
- an additional one or more rounds of incorporation of the swelling reduction agent(s) into the previously swelling reduction agent incorporated expansive clayey soil with the aid of the nano-level constitutive modeling may be performed based on the result from the comparing.
- the present disclosure relates to another method of reducing the swell potential of an expansive clayey soil comprising at least one expansive clay mineral.
- the proportion of the weight of the at least one expansive clay mineral relative to the total weight of the expansive clayey soil is P ECM .
- the expansive clayey soil has a first water content and a cation exchange capacity (CEC) expressed in meq/100 g dry expansive clayey soil.
- the method includes (a) determining a second water content of a wetted expansive clayey soil to be formed by wetting the expansive clayey soil with water, the wetted expansive clayey soil having a reduced swell potential S w(soil) that is no greater than a pre-set level T in accordance with a nano-level constitutive modeling based on the cation exchange capacity (CEC) of the expansive clayey soil and the second water content of the wetted expansive clayey soil as an initial water content (IWC), wherein the wetted expansive clayey soil comprises wetted at least one expansive clay mineral having the second water content and a swell potential S w(ECM) , wherein the second water content as the initial water content (IWC) is greater than the first water content but no greater than a final water content (FWC) of the at least one expansive clay mineral when the at least one expansive clay mineral reaches the swell potential, and produces a modified total cohesive energy density (TCEDm) of the wetted at least
- the method further comprises determining the final water content (FWC) of the expansive clayey soil (and also the expansive clay mineral(s) the expansive clayey soil comprises) when the expansive clayey soil reaches the swell potential experimentally, for example, following a swell potential test.
- FWC final water content
- the wetting of the expansive clayey soil is performed in a controlled manner, for example, by pre-estimating the amount of water needed and/or by applying (e.g. spraying or injecting) the water to the expansive clayey soil while monitoring the water content of the wetted expansive clayey soil, so that the wetted expansive clayey soil reaches the second water content that is higher than the first water content.
- an increase of 2-30 percentage points, 4-25 percentage points, 6-20 percentage points, 8-15 percentage points, or 10-12 percentage points in the water content of the expansive clayey soil may result in a 5-95%, 10-90%, 15-85%, 20-80%, 30-70%, 40-60%, or 50% reduction in the swell potential of the expansive clayey soil, depending on the initial water content of the expansive clayey soil, the weight percent of the expansive clay minerals in the expansive clayey soil or P ECM , and the weight percent of sand in the expansive clayey soil.
- the method may further comprise calculating the swell potential of the (unwetted) expansive clayey soil according to the nano-level constitutive modeling, based on the first water content (as the initial water content, IWC) and the CEC of the expansive clayey soil and P ECM .
- the first water content of the expansive clayey soil is used as the initial water content (IWC) to calculate the modified total cohesive energy density (TCEDm) of the expansive clay mineral(s) in the expansive clayey soil according to Equation (6) whether or not the expansive clayey soil further comprises at least one selected from the group consisting of calcite, gypsum, potassium chloride, calcium exchangeable cation, magnesium exchangeable cation, and potassium exchangeable cation.
- the swell potential of the (unwetted) expansive clay mineral(s) in expansive clayey soil (S (unwetted))ECM ) can be calculated according to Equations (2), (3), and (5) and the swell potential of the (unwetted) expansive clayey soil equals S (unwetted)ECM ⁇ P ECM .
- the method may further comprise measuring the actual swell potential of the (unwetted) expansive clayey soil by performing a swell potential test.
- the method further comprises maintaining or controlling the water content of the wetted expansive clayey soil, to keep the wetted expansive clayey soil at a relatively constant level of water content.
- One way to keep the wetted expansive clayey soil at a relatively constant level of water content may be by injecting water into the wetted expansive clayey soil at a plurality of injection points, with the amount of water determined based on the season and humidity.
- periodic measurement of the water content of the wetted expansive clayey soil is performed so that the amount of water injected can be adjusted accordingly.
- the second water content needed to reduce the swell potential of the expansive clayey soil to no greater than the pre-set level T based on the calculation with the nano-level constitutive modeling is greater than the final water content, or the second water content is considered too high to be maintained practically, incorporating the swelling reduction agent(s) into the expansive clayey soil described in the first aspect of the present disclosure may be combined with the wetting.
- the expansive clayey soil may be pre-wetted to reach a second water content that is higher than the first water content and is considered reasonable or practical prior to incorporating the swelling reduction agent(s) into the wetted expansive clayey soil, with the amount(s) of the swelling reduction agent(s) incorporated into the wetted expansive clayey soil calculated to result in a swell potential of the wetted swelling reduction agent incorporated expansive clayey soil that is no greater than the pre-set level T according to the nano-level constitutive modeling, specifically according to equations (6), (2), (3) and (5) based on the second water content (as the initial water content, IWC) of the wetted expansive clayey soil, the CEC of the expansive clayey soil, and P ECM .
- the second water content as the initial water content, IWC
- the swelling reduction agent(s) may be incorporated into the expansive clayey soil to form a swelling reduction agent incorporated expansive clayey soil with a first water content, and then the swelling reduction agent incorporated expansive clayey soil may be wetted to reach a second water content that is higher than the first water content, is no greater than a final water content of the swelling reduction agent incorporated expansive clay mineral(s) when the swelling reduction agent incorporated expansive clay mineral(s) reach the swell potential, and is considered reasonable or practical.
- the amount of the swelling reduction agent(s) incorporated into the expansive clayey soil is calculated to result in a swell potential of the swelling reduction agent incorporated wetted expansive clayey soil that is no greater than the pre-set level T according to the nano-level constitutive modeling, specifically according to equations (6), (2), (3) and (5) based on the second water content (as the initial water content, IWC) of the swelling reduction agent incorporated wetted expansive clayey soil, the CEC of the expansive clayey soil, and P ECM .
- the final water content of the swelling reduction agent incorporated expansive clay mineral(s) when the swelling reduction agent incorporated expansive clay mineral(s) reach the swell potential may be obtained experimentally, for example, following a swell potential test with the swelling reduction agent incorporated expansive clayey soil, or calculated according to the nano-level constitutive modeling, specifically according to equations (6) and (4) based on the first water content of the swelling reduction agent incorporated expansive clayey soil as the initial water content (IWC) and the CEC of the expansive clayey soil.
- IWC initial water content
- the present disclosure relates to a method of preparing a site having an expansive clayey soil having a swell potential S soil between T2 and T1, where T2 ⁇ T1, under a two-limit criteria or at or above a pre-set limit T* under a single limit criteria, a first water content, and a cation exchange capacity (CEC) expressed in meq/100 g dry expansive clayey soil, and comprising at least one expansive clay mineral to build a structure.
- the proportion of the weight of the at least one expansive clay mineral relative to the total weight of the expansive clayey soil is P ECM .
- the method includes (a) calculating a first amount of a swelling reduction agent to be incorporated into the expansive clayey soil to form a first swelling reduction agent incorporated expansive clayey soil with a reduced swell potential S 1i(soil) that is no greater than T2 or the pre-set limit T* with a nano-level constitutive modeling based on the first water content as an initial water content (IWC) and the cation exchange capacity (CEC) of the expansive clayey soil, wherein the first swelling reduction agent incorporated expansive clayey soil comprises a first swelling reduction agent incorporated at least one expansive clay mineral having a swell potential represented by S 1i(ECM) , wherein the swelling reduction agent is at least one selected from the group consisting of calcite, gypsum, potassium chloride, a composition comprising exchangeable K + , a composition comprising exchangeable Ca 2+ , and a composition comprising exchangeable Mg 2 ⁇ , wherein the incorporation of the first amount of the swelling reduction agent produces a modified total cohesive
- the swell potential of the expansive clayey soil needs to be evaluated and be reduced if necessary, since the expansive clayey soil will exert pressure on the structure, such as the vertical face of a foundation, basement or retaining wall, resulting in lateral movement. Additionally, the expansive clayey soil that has expanded or swelled due to a high ground moisture experiences a loss of soil strength or “capacity” and the resulting instability can result in various forms of problems and/or failures of the structures built on or within the expansive clayey soil.
- the determination of the (first) water content and cation exchange capacity of the expansive clayey soil, the determination of P ECM , the incorporation of the swelling reduction agent(s) into the expansive clayey soil, and the types, characteristics, and preferred amount ranges of the swelling reduction agents of the method of this aspect are the same as those of the method of the first aspect of the disclosure.
- the method may further comprise determining the swell potential S soil of the expansive clayey soil (if not known).
- the swell potential S soil of the expansive clayey soil is a calculated swell potential of the expansive clayey soil with the nano-level constitutive modeling based on P ECM and the first water content and the cation exchange capacity of the expansive clayey soil, specifically based on P ECM and the swell potential of the expansive clay mineral(s) S ECM calculated according to Equations (6) (whether or not the expansive clayey soil further comprises at least one selected from the group consisting of calcite, gypsum, potassium chloride, calcium exchangeable cation, magnesium exchangeable cation, and potassium exchangeable cation before the incorporating the first amount of the swelling reduction agent), (2), (3), and (5) using the first water content (as the initial water content, IWC) and the CEC of the expansive clayey soil, with S soil equaling S ECM ⁇ P ECM .
- the expansive clayey soil comprises at least one expansive clay mineral selected from the group consisting of smectite, bentonite, montmorillonite, beidellite, vermiculite, attapulgite, nontronite, illite, and chlorite.
- the structure to be built at the site includes, without limitation, a building foundation, a railway line foundation, a pipe, a footing, a landfill liner, a nuclear waste storage containment liner, a swimming pool, a wall, a driveway, a road, a pavement, a basement floor, and a wellbore.
- the method employs a two-limit (T1 and T2, T2 ⁇ T1) criteria to evaluate swell potential S soil of the expansive clayey soil for determining whether the expansive clayey soil at the site is suitable, not suitable, or may be suitable after a treatment with one or more of the swelling reduction agents for building a structure. Specifically, if S soil is at or above a pre-determined limit T1, the expansive clayey soil will be considered unsuitable and the site will be rejected to build the structure. If S soil is no greater than a pre-determined limit T2, where T2 is less than T1, the expansive clayey soil will be considered suitable and the site will be accepted to build the structure.
- T1 and T2, T2 ⁇ T1 two-limit
- a(n) (first) amount of the swelling reduction agent will be incorporated into the expansive clayey soil at the site to form a (first) swelling reduction agent incorporated expansive clayey soil with a reduced swell potential S 1i(soil) that is no greater than the pre-determined limit T2.
- the (first) amount of the swelling reduction agent is calculated with the nano-level constitutive modeling based on the first water content as an initial water content (IWC) and the cation exchange capacity (CEC) of the expansive clayey soil and P ECM .
- the T1 and T2 values may vary.
- a uniform mass of an expansive clayey soil which becomes saturated with moisture will exert pressure in all directions as each individual expanding clay mineral seeks to occupy more space.
- the direction and magnitude of the expansive clayey soil movement will depend upon the magnitude of the confining pressure at any particular point of resistance.
- the expansive clayey soil movement will be minimized where confining pressures are the largest, while the movement will be greatest where the magnitude of the confining pressure is the smallest.
- the weight of the overburden soil creates increasing confining pressure.
- the expansion resistance is generally greater at depth than it is near the surface.
- the magnitude of an expanding expansive clayey soil movement will be greatest near the surface and in the upward direction.
- the greatest magnitude of movement will again be nearest the surface but the primary direction of movement will also have a horizontal or “lateral” component.
- Buildings and other structures which have been constructed on top of a mass of an expansive clayey soil create confining pressure which tends to mitigate soil movement.
- the magnitude of the confining pressure from a building or structure is determined by the load distribution together with other expansion-resisting design elements. When the confining pressure of a building or other structure does not exceed the pressure exerted by the expanding expansive clayey soil, foundation movement will occur on the form of “heave” or upward movement.
- T1 may be in the range of 10-30%, 15-25%, or 18-20%, and T2 may be in the range of 1-7%, 2-6%, or 3-5%.
- the expansive clayey soil with a swell potential of 7-30%, 10-25%, or 15-20% may be suitable for building a structure after it is treated with one or more of the swelling reduction agents.
- the method may employ a simpler single pre-set limit T* criteria to evaluate the swell potential S soil of the expansive clayey soil for determining whether the expansive clayey soil at the site is suitable, not suitable, or may be suitable after a treatment with one or more of the swelling reduction agents for building a structure.
- T* may be in the range of 5-10%, 6-9%, or 7-8%. If S soil is at or above T*, the expansive clayey soil at the site is to be treated with one or more of the swelling reduction agents to reduce the swell potential. On the other hand, if S soil is less than T*, the site is accepted for building the structure without treating the expansive clayey soil with the swelling reduction agents.
- the swelling reduction agent includes, without limitation, calcite, gypsum, potassium chloride, a composition comprising exchangeable K + , a composition comprising exchangeable Ca 2+ , a composition comprising exchangeable Mg 2 ⁇ , and a combination thereof, and the first amount of the swelling reduction agent incorporated into the expansive clayey soil is calculated to result in a swell potential of the first swelling reduction agent incorporated expansive clayey soil represented by S 1i(soil) that is no greater than T2 or the pre-set limit T* according to the nano-level constitutive modeling based on P ECM and the first water content and the cation exchange capacity of the expansive clayey soil, specifically based on P ECM and S 1i(ECM) calculated according to equations (6), (2), (3) and (5) using the first water content (as the initial water content, IWC) and the CEC of the expansive clayey soil, with S 1i(soil) equaling S 1i(
- the method of this aspect may use white gypsum, red gypsum, one or more other types of impure gypsum, or a mixture of white gypsum, red gypsum, and/or one or more other types of impure gypsum as the swelling reduction agent.
- the swelling reduction agent of calcite, gypsum, potassium chloride, a composition comprising exchangeable K + , a composition comprising exchangeable Ca 2+ , and/or a composition comprising exchangeable Mg 2+ , and a soil stabilizing composition comprising at least one material selected from the group consisting of ground granulated blastfurnace slag (GGBS), cement, resins, fly ash, lime, pozzolana, and a mixture of lime and pozzolana are incorporated into the expansive clayey soil either together or sequentially to reduce the swell potential as well as increase the stability and strength of the expansive clayey soil to make the swelling reduction agent incorporated expansive clayey soil more stable and suitable for building a structure.
- GGBS ground granulated blastfurnace slag
- a mixture of ground granulated blastfurnace slag (GGBS) and gypsum, preferably red gypsum, may be incorporated into the expansive clayey soil, with the weight ratio of the gypsum:the GGBS in the mixture in the range of 1:5 to 5:1, 1:4 to 4:1, preferably 1:3 to 3:1, more preferably 1:3 to 3:2, or more preferably 1:4 to 2:3, with the pH of the mixture preferably adjusted by lime to be greater than 10.5, or preferably greater than 12, to increase the strength of the expansive clayey soil as well as decrease the swell potential of the expansive clayey soil.
- GGBS ground granulated blastfurnace slag
- gypsum preferably red gypsum
- the first amount of the gypsum calculated to be incorporated into the expansive clayey soil according to the nano-level constitutive modeling is 20-50%, or 20-40% of the total weight of the first swelling reduction agent incorporated expansive clayey soil, with the co-incorporated GGBS at an amount of 15-60%, 20-50%, or 30-40% of the total weight of the first swelling reduction agent incorporated expansive clayey soil, and the co-incorporated lime at an amount of 0.1-5%, or 0.5-3% of the total weight of the first swelling reduction agent incorporated expansive clayey soil.
- the method of this aspect preferably further comprises removing all or a portion of the sand from the expansive clayey soil, for example, with one or more soil screen sieves as described in the first aspect, prior to the incorporating the first amount of the swelling reduction agent into the expansive clayey soil to form the first swelling reduction agent incorporated expansive clayey soil.
- all or a portion of the sand is removed from the expansive clayey soil and replaced by one or more non-expansive clay minerals such as kaolinite, mica, hydroxy interlayered vermiculite (HIV), and hydroxy interlayered smectite (HIS), preferably at a fraction of the weight of the sand removed or at an equal weight of the sand removed prior to the incorporating the first amount of the swelling reduction agent into the expansive clayey soil to form the first swelling reduction agent incorporated expansive clayey soil.
- non-expansive clay minerals such as kaolinite, mica, hydroxy interlayered vermiculite (HIV), and hydroxy interlayered smectite (HIS)
- the method of this aspect may further comprise measuring the actual swell potential of the first swelling reduction agent incorporated expansive clayey soil represented by S 1i * (soil) and comparing S 1i * (soil) with T2 or T*.
- S 1i * (soil) is no greater than T2 or T*, and the expansive clayey soil at the site is deemed suitable for building a structure.
- S 1i * (soil) is greater than T2 or T*.
- a second round of incorporating the swelling reduction agent into the first swelling reduction agent incorporated expansive clayey soil may be necessary to further reduce the swell potential of the first swelling reduction agent incorporated expansive clayey soil, similar to the method of the first aspect of the present disclosure.
- the method may further comprise (a) determining a water content and a cation exchange capacity (CEC) of the first swelling reduction agent incorporated expansive clayey soil expressed in meq/100 g dry first swelling reduction agent incorporated expansive clayey soil, (b) calculating a second amount of a swelling reduction agent to be incorporated into the first swelling reduction agent incorporated expansive clayey soil to form a second swelling reduction agent incorporated expansive clayey soil with a further reduced swell potential S 2i(soil) that is no greater than T2 or T* with the nano-level constitutive modeling based on the water content as an initial water content (IWC) and the cation exchange capacity (CEC) of the first swelling reduction agent incorporated expansive clayey soil, wherein the second swelling reduction agent incorporated expansive clayey soil comprises a second swelling reduction agent incorporated at least one expansive clay mineral having a swell potential represented by S 2i(ECM) , wherein the swelling reduction agent is at least one selected from the group consisting of calcite, g
- the method may still further comprise measuring the actual swell potential of the second swelling reduction agent incorporated expansive clayey soil and comparing it to T2 or T*, and an additional one or more rounds of incorporation of the swelling reduction agent into the previously swelling reduction agent incorporated expansive clayey soil, with the amount of the swelling reduction agent calculated according to the nano-level constitutive modeling, may be performed based on the result from the comparing.
- another preferred embodiment of the method involves a combination of wetting and incorporating the swelling reduction agent into the expansive clayey soil that comprises expansive clay mineral(s) at a weight proportion of P ECM and has a swell potential S soil between T2 and T1, where T2 ⁇ T1, under a two-limit criteria, or at or above a pre-set limit T* under a single limit criteria, a first water content, and a cation exchange capacity (CEC).
- the expansive clayey soil that comprises expansive clay mineral(s) at a weight proportion of P ECM and has a swell potential S soil between T2 and T1, where T2 ⁇ T1, under a two-limit criteria, or at or above a pre-set limit T* under a single limit criteria, a first water content, and a cation exchange capacity (CEC).
- CEC cation exchange capacity
- the method includes (a) determining a second water content of a wetted expansive clayey soil to be formed by wetting the expansive clayey soil with water and a first amount of the swelling reduction agent to be incorporated into the wetted expansive clayey soil at the site to form a wetted first swelling reduction agent incorporated expansive clayey soil to result in a swell potential of the wetted first swelling reduction agent incorporated expansive clayey soil represented by S w1i(soil) that is no greater than T2 or T* according to the nano-level constitutive modeling based on P ECM and the second water content of the wetted expansive clayey soil and the cation exchange capacity (CEC) of the expansive clayey soil.
- S w1i(soil) that is no greater than T2 or T* according to the nano-level constitutive modeling based on P ECM and the second water content of the wetted expansive clayey soil and the cation exchange capacity (CEC) of the expansive clayey soil.
- the TCEDm of the wetted first swelling reduction agent incorporated expansive clay mineral(s) in the expansive clayey soil is calculated using the second water content of the wetted expansive clayey soil as the initial water content (IWC) according to Equation (6).
- the calculated TCEDm together with the CEC of the expansive clayey soil results in S w1i(ECM) , the swell potential of the wetted first swelling reduction agent incorporated expansive clay mineral(s), calculated according to Equations (2), (3), and (5) and S w1i(soil) equaling S w1i(ECM) ⁇ P ECM .
- the second water content is greater than the first water content but no greater than a final water content of the expansive clay mineral(s) when the expansive clay mineral(s) reach the swell potential; (b) wetting the expansive clayey soil with water to form the wetted expansive clayey soil having the second water content; and (c) incorporating the first amount of the swelling reduction agent into the wetted expansive clayey soil at the site to form the wetted first swelling reduction agent incorporated expansive clayey soil.
- the amount of the swelling reduction agent needed to obtain the swell potential of the wetted first swelling reduction agent incorporated expansive clayey soil that is no greater than T2 or T* may be less than that without pre-wetting the expansive clayey soil.
- the final water content of the expansive clay mineral(s) when the expansive clay mineral(s) reach the swell potential may be determined experimentally, for example, following a swell potential test of the expansive clayey soil, or calculated according to Equation (6) (whether or not the expansive clayey soil further comprises at least one selected from the group consisting of calcite, gypsum, potassium chloride, calcium exchangeable cation, magnesium exchangeable cation, and potassium exchangeable cation before the incorporating the first amount of the swelling reduction agent), and Equation (4) of the nano-level constitutive modeling based on the first water content (as the initial water content, IWC) and the CEC of the expansive clayey soil.
- wetting may be performed after incorporating the swelling reduction agent into the expansive clayey soil, e.g. wetting may be performed on the first or second swelling reduction agent incorporated expansive clayey soil, or more generally, the expansive clayey soil that has been incorporated with the swelling reduction agent for any number of times and may or may not have been previously wetted.
- the swelling reduction agent incorporated expansive clayey soil before the wetting, has a first water content and a cation exchange capacity (CEC).
- CEC cation exchange capacity
- the swelling reduction agent incorporated wetted expansive clayey soil has a second water content that is higher than the first water content.
- the swell potential of the swelling reduction agent incorporated wetted expansive clayey soil can be calculated using Equations (6), (2), (3) and (5) of the nano-level constitutive modeling based on the second water content (as the initial water content, IWC) of the swelling reduction agent incorporated wetted expansive clayey soil and the CEC of the swelling reduction agent incorporated expansive clayey soil as well as P ECM .
- the second water content of the swelling reduction agent incorporated wetted expansive clayey soil may not exceed a final water content of the swelling reduction agent incorporated expansive clay mineral(s) in the expansive clayey soil when the swelling reduction agent incorporated expansive clay mineral(s) in the expansive clayey soil reach the swell potential.
- the final water content may be determined either experimentally, for example, following a swell potential test of the swelling reduction agent incorporated expansive clayey soil, or calculated according to Equations (6) and (4) based on the first water content (as the initial water content, IWC) and the CEC of the swelling reduction agent incorporated expansive clayey soil.
- the higher second water content achieved by the wetting of the expansive clayey soil or the swelling reduction agent incorporated expansive clayey soil preferably needs to be maintained or stabilized, for example, by subgrade irrigation when the wetted swelling reduction agent incorporated expansive soil is used as foundation soil.
- Subgrade irrigation involves the installation of pipes to conduct water into the foundation soil at various injection points. The amount of water required depends on the season and the humidity. Periodic measurement of the wetted swelling reduction agent incorporated expansive clayey soil moisture may be required so that the amount of water injected can be adjusted accordingly.
- the source of water may be a well or the domestic water supply.
- soil stabilization materials such as ground granulated blastfurnace slag, cement, resins, fly ash, lime, pozzolana, and a mixture of lime and pozzolana, together with the swelling reduction agents are preferably incorporated into the wetted expansive clayey soil.
- the methodology of the examples covered three major levels of activities; macro level testing, micro level imaging and analysis, and molecular level simulation and modeling.
- the research methodology generally involved formulation of several types and nature of fabrics/structures of expansive clays through preparation and compaction of mixes of expansive clay minerals and non-expansive/non-clay minerals in various proportions at several moisture and density conditions, mapping and analysis of the fabric and structure of the laboratory compacted expansive clays specimens using nano/micro level imaging laboratory techniques at the pre and post swelling states. This was achieved through advanced imaging techniques such as X-ray diffraction (XRD), Environmental SEM (ESEM), Fourier Transform Infrared Spectroscopy (FTIR), and Computerized X-ray Tomography (Micro CT).
- XRD X-ray diffraction
- ESEM Environmental SEM
- FTIR Fourier Transform Infrared Spectroscopy
- Micro CT Computerized X-ray Tomography
- One of the objectives of this disclosure is to compare the behavior of the natural expansive clay deposits and the laboratory reconstituted specimens using controlled proportions of the standard soil constituents with the simulation models. Therefore, to constitute the control samples besides obtaining undisturbed samples from natural expansive soil deposits, individual soil constituents were also acquired from standard/known sources.
- bentonite samples were also obtained from Kanoo establishment, one of the bentonite (drilling mud) suppliers in KSA.
- the source of this bentonite is from the shale deposits in Gujrat city of India.
- the bentonite is quarried from these deposits, crushed to fine powder (passing Sieve No. 200), homogenized, and marketed in 50 lbs bags.
- five bentonite bags were obtained from the supplier and were stored in controlled temperature and humidity rooms. Several samples were collected from different parts of the bags for the characterization and further verification of the homogeneity and uniformity of the bag samples. The test results indicate a uniformly distributed material throughout the bags.
- control laboratory specimens were prepared at various moisture contents using the distilled water and compacted at various densities using both static and dynamic compaction techniques. Detailed steps and procedures for the sample preparations in the laboratory are provided herein.
- control specimens with known proportions of clay minerals and non-clay minerals/particles were prepared at various known densities and moisture contents.
- Types of clay and non-clay constituents and the corresponding proportions used for preparing the controlled specimens are listed in Table 8.
- the samples were compacted to a pressure of 1500 kPa.
- the compacted specimens were immediately sealed with several wraps of plastic cling film and cased in polythene bags.
- additional similar specimens were prepared for the micro investigation on the pre swell samples. These pre swell samples, taken from the compacted layer, were later on evaluated using molecular/nano level investigation and imaging techniques. All the laboratory prepared specimens were subjected to swell potential tests as detailed below.
- Specimens for the swell potential tests were prepared with various proportions of bentonite, sand, and/or gypsum, calcite, and kaolinite. Similarly, standard clays were also mixed with 40% and 70% sand and compacted to the maximum density corresponding to 1500 kPa static pressure. In order to ensure that specimens of standard clays be compacted on the dry side of OMC, it was assessed from the PL of these clay samples. Swell potential tests were carried out in general agreement with ASTM D 5890 and compacted specimens were subjected to free swell testing in the oedometer test equipment.
- the specimens were surcharged with a low surcharge pressure of 2 kPa and flooded with distilled water in the oedometer specimen holder. Increase in height of the specimen was recorded at regular time intervals until no further noticeable change in height of the specimen is recorded. Maximum change in the height of the specimen divided by the original height was recorded and expressed in percent swell for each tested specimen. After the swelling test, samples for moisture content were cut from the middle of the ring and rest was preserved for the post-swell micro level imaging and tests. The results of the swell tests carried out on bentonite, sand, and other inclusions are summarized in Table 9 and plotted in FIG. 22 .
- Micro level fabric testing and visualization of the pre and post swell samples was carried out using X-ray Diffraction (XRD), Fourier Transform Infrared Spectroscopy (FTIR), Micro Computed Tomography Scan (CT), and Environmental Scanning Electron Microscopy (ESEM).
- XRD and CT were performed at Center of Excellence in Nanotechnology of KFUPM, while FTIR tests were conducted at the Center for Refining and Petrochemicals of the Research Institute (RI) of KFUPM.
- ESEM were conducted at R&D Center of Saudi Aramco at Dhahran, KSA.
- the main objectives achieved through this laboratory study were the soil fabric visualization, variation in interlayer spacing with change in moisture regime, assessment of crystallite size, and interaction among swelling and non-swelling soil particles in the fabric on the dry and wet side of optimum moisture content both in pre and post swell state.
- the molecular level information acquired from these tests was used as an input in the molecular level modeling schemes.
- XRD equipment is equipped with a 40 keV X-ray tube, radiation safe enclosure, water chiller, and a monochromator.
- the XRD results are presented as peak positions at d spacings and X-ray counts (intensity) in the form of x-y plots in FIGS. 104 to 140 . These plots were also used to determine the changes in lattice/d-spacing upon change in moisture content in the pre and post swell state.
- BM measured montmorillonite peak breadth
- BS average measured aluminum peak breadth in radians
- FTIR Fourier Transform Infrared Spectroscopy
- the pre and post swell samples obtained from the swell test specimens were viewed, examined, and studied using Environmental Scanning Electron Microscope (ESEM).
- ESEM Environmental Scanning Electron Microscope
- FEI-Phillips ESEM-FEG Quanta 400 available at R&D center of Saudi Aramco was used for the purpose.
- ESEM electrospray electrospray
- Representative sample particles/particle assemblage of the pre and post-swell specimens were placed on the copper strips pasted on the specimen holders.
- the specimens were scanned in the ESEM at 20 keV to acquire the high contrasting micrographs at different resolutions varying from 100 ⁇ to 30,000 ⁇ .
- Spot and general area level elemental analysis was also carried out using Energy Dispersive Spectroscopy (EDS) at the selected locations and/or areas of the specimens using 20 keV energy electron beams. EDS spectrums of several spots on the selected specimens were obtained to assess the elemental composition of the specimen.
- EDS Energy Dispersive Spectroscopy
- Micro CT X-ray Computed Tomography
- This equipment is capable of providing tomographic sections of the specimens in 2-D and 3-D with a resolution of 1 micron.
- the equipment is equipped with an X-ray source of 100 keV to focus on a spot size of less than 5 micron.
- the associated acquisition and analysis software aid in the acquisition of the data and further analyzing and presenting the data in 2-D and 3-D tomographic sections.
- Cubical to cylindrical specimens of about 15 mm ⁇ 25 mm in size were used for the CT scanning of the pre and post swell samples.
- the specimens were fixed on the sample holder placed in the sample chamber of the equipment. Through the acquisition software, the specimens were focused to scan the middle section of the specimen without any dried end effects.
- the specimens were scanned using X-ray energy of 72 keV and scans were obtained every 2° of the specimen. After the complete scan, data was loaded in the analysis software for display and development of tomographic sections. The raw data was reconstructed to formulate a series of tomographic sections of the entire height of the specimen.
- An objective of the present disclosure is to simulate and study the processes and interactions occurring at the molecular level in the natural and compacted fabrics of the expansive soils.
- a typical natural microstructure of expansive soils consists of clay and non-clay particles assemblages, pores varying from nano to micro level, and the water present in all these pore levels.
- a particle assemblage further consists of various sizes of the unit crystallites or quasi-crystals of each constituent.
- molecular mechanics (MM), molecular dynamics (MD), and Monte Carlo (MC) based simulation techniques were used to study the interactions between clay and non-clay particles in the presence of various combinations of interlayer and intra layer cations, anions, and water under various fabric and structure conditions. Materials Studio software (2013) have been used in this simulation study.
- Unit molecules used in the formulation are Na-montmorillonite of three different Cation Exchange Capacity (CEC), pyrophyllite, kaolinite, calcite (Calcium Carbonate), Calcium Sulfate (Gypsum), Potassium Chloride, and water. Most of these basic molecular units including two CEC Na-montmorillonite, kaolinite, Calcium Carbonate, and Calcium Sulfate were acquired from Nanoscale Simulation Lab at University of Akron, US (2013), while other molecules were prepared using the drafting tools of the software.
- CEC Cation Exchange Capacity
- pyrophyllite pyrophyllite
- kaolinite calcite (Calcium Carbonate)
- Calcium Sulfate Gypsum
- Potassium Chloride Potassium Chloride
- Nanoscale Simulation Lab at University of Akron, US (2013) http://www2.uakron.edu/cpspe/dpe/web/nsl/interface-force-field.php, incorporated herein by reference in its entirety.
- the molecules acquired from Nanoscale simulation lab are already in charged state and their charges were verified using charge equilibration method QEq of the Materials Studio software.
- Other molecules formulated in the software were charged using QEq module of the software.
- Na-montmorillonite molecules of three different CECs of 54, 90, and 144 meq/100 g were used.
- FIGS. 34 and 35 A typical Na-montmorillonite model with CEC of 90 meq/100 g and Na as interlayer cations is shown in FIGS. 34 and 35 .
- CEC pyrophyllite
- FIGS. 34 and 35 A typical pyrophyllite crystallite is shown in FIGS. 34 and 35 .
- knowledge of several other well-known behaviors have been used to verify the parameters and other procedures adopted in the software.
- Calcite and gypsum unit cells and water molecule are also shown in FIGS. 36, 37, and 38 .
- the simulation study consisted of several steps starting from sorption of water molecules on the individual crystallite, assemblage of crystallites through natural randomness concepts, compaction to the maximum density, relaxation to simulate stress relief, and finally volume change upon sorption of water molecules in the pore spaces.
- the procedure is repeated for all the three CEC varied Na-montmorillonite and further variations in the exchangeable cations and the cementation due to the interactions with other soil constituents (Tables 10, 11, and 12). All the simulations as per combinations in Table 10 were carried out on Na-montmorillonite with Na as the sole exchangeable cation.
- MCEC Na-montmorillonite was then selected to simulate the cementation effects due to potassium chloride, gypsum, and calcite as per permutations in Table 11.
- LCEC montmorillonite was finally selected for the simulations by changing the type and amount of exchangeable cations as given in Table 12.
- the water sorption step simulates the sorption of water molecules on the individual Na-montmorillonite crystallites. It represents the processes of water mixing with the clay in the laboratory conditions or the interaction of clay particles with water during the geological depositional processes. Based on the knowledge from the literature and the findings of XRD results of the samples with similar densities on the moisture density plots in the present disclosure, a basic crystallite size of a ⁇ b ⁇ c: 26 ⁇ 54 ⁇ 20 ⁇ was chosen as the fundamental particle/crystallite for Na-montmorillonite in the simulation.
- Sorption module is based on Monte Carlo simulation technique in which water molecules get sorbed on the clay particle on its surfaces, interlayer, and edges.
- Sorption module sorbate (single water molecules) is absorbed in the sorbent framework of clay molecule. Fixed loading was used to find the global minimum energy sites for the water molecules in a clay crystallite by running cycles of fixed loading simulation series where the temperature is steadily reduced over the series.
- Metropolis Monte Carlo method (Metropolis et al.) used in the Sorption module is a conventional Monte Carlo method in which trial configurations are generated without bias.
- the simulation is based on the concept of finding locations in the unit cell where water molecules would cause the maximum lowering in the energy.
- the water molecules get to the locations in the unit cell based on the lowering of the energy principle and the sorption is continued till an energy cut off is reached.
- 25000 steps cut off was adopted as the threshold limit for the realistic sorption. Simulation beyond 25000 steps resulted in the occupation of higher energy sites by water molecules and an unrealistically high volume change occurred.
- pyrophyllite was also shown to be adsorbing water and showing high swell potential at steps more than 25000. After sorption of the water molecules in 25000 steps, equilibration was achieved in 15000 steps to a temperature of 298° K.
- Pyrophyllite is the clay mineral in which no isomorphous substitution takes place and hence its CEC is zero.
- pyrophyllite crystallite of the same size 54 ⁇ 26 ⁇ 20 ⁇ was also used for the simulation. Adopting the same parameters in the sorption simulation, pyrophyllite did not show any adsorption of the water molecules.
- Sorption module was used to simulate the assemblages of water sorbed crystallites when mixed together in the loose form before the compaction process.
- four crystallites were randomly sorbed in a 125 ⁇ 125 ⁇ 125 ⁇ cubic unit cell ( FIGS. 42 and 43 ).
- Several cubic unit cells sizes ranging from 100 ⁇ to 200 ⁇ were experimented and 125 ⁇ was finally selected. Bigger unit cells resulted in distances larger than the crystallite themselves and smaller ones caused overlapping of the crystallites.
- these four crystallites occupy relative positions in the cubic space ( FIGS. 42 and 43 ).
- the relative positions are taken up by the crystallites either parallel to faces, edge to edge, edge to the face, or an intermediate form depending on the charge distribution on each crystallite and the moisture content. These unit cells repeat infinitely in space with the superposition of the periodic boundary conditions. In this way, several possible fabrics during the loose mix state were created using Sorption module of the software. As a next step, simulation of the creation of the fabric and structure due to compaction was performed using molecular dynamics Forcite module as detailed below.
- unit cells consisting of the loose clay crystallites created in the previous step were compressed to the required density using Forcite molecular dynamics module.
- NPT ensemble was used to compress the unit cell to high density at different confining pressures of 0.01, 0.1, and 1 GPa. Different confining pressures were used to simulate the several levels of geological and laboratory compaction pressures.
- FIG. 44 A comparison of the maximum density achievement at different pressures is shown in FIG. 44 .
- the simulations were run to 30 ps or more at an interval of 0.5 fs to achieve the maximum density.
- Berendsen thermostat was used as in Sorption module, while Berendsen barostat was replaced by Parrinello barostat.
- Berendsen barostat applies pressure in all the directions in such a way to keep the unit cell dimensions equal, the corresponding reduction of volume on all the faces of the periodic boundary cell remains uniform.
- Berendsen barostat does not simulate the real compaction process in which stresses vary along the faces under a uniform pressure compaction process.
- the dynamics compaction simulation was continued until a maximum density is achieved.
- a 3-D view of several combined unit cells in FIG. 45 provide a clear visualization of the created fabric.
- the compacted unit cell and the corresponding compaction curve is shown in FIGS. 46 and 47 .
- Expansive clay deposits present at shallow subsurface level have suffered a stress relief due to removal of high geological pressures initially responsible for the creation of highly compacted soil structure. This process causes overconsolidation in the compacted expansive clay layers.
- dynamics through Forcite module of the software was used at a confining pressure of 0.001 GPa. Due to a representative overconsolidation pressure in most of the expansive clay deposits in the area, a confining pressure of 0.001 GPa has been selected as the confining pressure for the relaxation simulation.
- the relaxed structure of the unit cell after the dynamics simulation and the corresponding relaxation curve is shown in FIGS. 48 and 49 .
- the stress relaxed unit cell is now ready to be simulated for the water intake and the corresponding simulation of the swell/volume change behavior. The details of water sorption in the pores of the unit cell and the volume change behavior simulation is provided below.
- the stress relaxed unit cell was sorbed with water molecules in the intra and interlayer of the crystallites/particles using sorption module of the software. A maximum number of 25000 steps for the sorption of water molecules were used to apply the energy cutoff.
- FIG. 50 shows the sorbed water molecules in the stress relaxed cell.
- gypsum, calcite, and other salts are also responsible for the cementation/cohesion among the clay particles.
- individual atoms/molecules such as Ca 2+ , SO 4 2 ⁇ , K + , Cl ⁇ , and CO 3 2 ⁇ were sorbed in the water bearing montmorillonite crystallites.
- 10% water was sorbed onto the montmorillonite crystallite with a CEC of 90 meq/100 g. Sorption of 10% water was performed in order to create a media in which other minerals can get dissolved.
- the cohesive energy density concept is used first time in the present disclosure in relating the swelling behavior of expansive clay minerals to the various variants such as moisture, density, CEC, type, and proportion of exchangeable and total cations etc.
- Cohesive energy is indicative of how strongly the molecules/crystallites are coherent with each other due to the inherent CEC or cementation effects.
- the higher the cohesive energy density of the expansive clay structure the lesser the swelling potential of the clay minerals.
- a swell cutoff selected for these cases is the quantity of water adsorbed in any single step. Water sorption as low as 2.0 to 4.0% is indicative of extremely small size of pores and the corresponding extremely low permeability. Therefore, such low values of water adsorption are practically not possible in such highly densified/cemented mass of expansive clay structure.
- swell cutoff for these cases also derives from the fact that swell will take place for the cohesive energy density corresponding to its original counterpart (without cementation and with Na cations only). Using these both concepts, swell potential was evaluated for these cases.
- Cohesive energy density was measured for all the simulation cases using Forcite module of the software. Total cohesive energy density was plotted against the moisture content for all the steps in each simulation case as loose mix, compaction, relaxation, and swelling/volume change with water. Typical variation of cohesive energy density for HCEC, MCEC, and LCEC Na-montmorillonite are shown in FIGS. 56, 57, and 58 . See also FIGS. 210 to 226 .
- Forcefield plays a vital role in any molecular simulations study. It provides the relative interaction among the particles by defining the energy relationship for the system. Usually, in studies involved in the simulations of clay minerals, CLAYFF forcefield (Cygan et al.) and some others specifically prepared for the purpose have extensively been used.
- UFF Universal forcefield
- the forcefield embedded in the software consists of universal parameters to cover the entire periodic table and may be used for such scenarios.
- UFF was applied to several scenarios formulated in the present disclosure, several well-known facts could not be verified. Therefore, it was planned to do changes and modifications to the UFF as per the requirements of a typical forcefield applicable to clay minerals interaction with water. So, several forcefield parameters in UFF were modified in the light of the parameters suggested in CLAYFF forcefield.
- This disclosure includes three major activities: macro level testing, micro level imaging and analysis, and molecular level simulation and modeling. These activities have led to the formulation of a volume change behavior model for the molecular/nano level structure of expansive clayey soils.
- the nano level model can be coupled with micro and macro level models to formulate a comprehensive volume change model for the expansive soils.
- the macro level behavior of the expansive soils have been studied through the free swell potential tests on various combinations of clay and non-clay minerals, undisturbed natural samples, compacted at various moisture and density conditions (Table 8). Free swell tests results tabulated in Table 9 and plotted in FIG.
- the aspect of permeability of the fabric should have a special consideration besides density, in the modeling of total swell potential of closed fabrics composed otherwise of high swell potential clay minerals. Relatively lower permeability may not allow the permeation of enough water required for the complete swelling of all the clay mineral particles present in the soil fabric. This phenomenon needs to be translated into a significant factor in the volume change modeling of the expansive clays. Permeability characteristics of the micro fabric should also be coupled with the macro fabric features such as fissures and stress cracks to define the water intake potential of the entire structure of the expansive clayey soils.
- X-Ray Diffraction (XRD) test is primarily used for the mineralogical analysis of crystalline samples.
- XRD X-Ray Diffraction
- Loose mixture of bentonite samples were prepared by mixing the soil with different water contents ranging from 10 to 100%. XRD tests were performed on each of these samples and the resultant d-spacing as a function of water content is shown in FIG. 41 , which is evident that there is an increase in lattice spacing with water content to a spacing of 17.5 ⁇ at 60% water content and remains constant afterwards to a water content of 100%.
- d-spacing of dry bentonite is 10 ⁇ and each water layer occupies an approximate thickness of about 2.5 ⁇ in the interlayer space, 17.5 ⁇ indicates the presence of three water molecules layers in interlayer.
- Each water layer of about 2.5 ⁇ in the interlayer constitutes about 10% water content. This indicates that the maximum water content accommodated in the interlayer space in clay minerals is about 30% and the rest of the water is adsorbed on the ends and edges of the clay mineral crystallites. This fact constitutes a significant aspect in the molecular level simulation and modeling.
- FIGS. 62, 63, 64, and 65 indicate that d-spacing of about 15 ⁇ (equivalent to two water layers or 20% water content) exists in the clay crystallites on the dry side of OMC while d-spacing of 17.5 ⁇ occurs (equivalent to three water layers or 30% water content) on wet side of OMC.
- the molding water content is respectively 30 and 40% for the dry and wet side of OMC, it is established that rest of the 10% water content for both the cases is adsorbed on the edges and ends of the crystallites. This fact has played a key role in the assessment of the fundamental size of the crystallite in the molecular level simulation.
- EDS Energy Dispersive Spectroscopy
- FTIR Fourier Transform Infrared Spectroscopy
- Both the vibration bands under stable/dry form are 1694 cm ⁇ 1 and 3634 cm 1 , respectively (Katti and Katti, 2010).
- H—O—H bending band shifts to lower energy levels depending on the water content.
- FIG. 146 it can be noticed that there is a reduction in H—O—H bending band from 1694 to 1650 cm ⁇ 1 in bentonite loose mixed samples with moisture content from 40 to 60% and remains same at higher moisture contents. This confirms the trend as observed in the XRD analysis of the bentonite samples mixed with varying percentages of water.
- O—H stretching band achieves higher energy from 3634 to 3650 cm-1 as a result of the addition of water.
- a similar trend of reduction in the H—O—H bending band and O—H stretching band have been observed in all the post swell specimens.
- FTIR have proven to be a complementary technique for the investigations of nano level changes in the clay structure due to the interaction with water.
- non-clay minerals and constituents in any natural or compacted expansive soils play a vital role towards the total swell potential.
- Most of the non-clay minerals such as calcite, gypsum, and other compounds or salts of sodium and potassium exist in cations and anions form when present in pore solution of these deposits.
- Part of the cations such as Na ⁇ , K + , Ca 2+ , and Mg 2+ get adsorbed on the surfaces and interlayer of the charged clay mineral crystallites, while others exist either as isolated fabric or associated with the individual or group of clay crystallites by covering them on the surfaces, ends, and edges.
- Results of the total and exchangeable cations summarized in Table 5 provide an estimate of the non-exchangeable cations present in the samples. Comparison of the percentage of non-exchangeable cations with the percent of expansive clay minerals may provide a very close estimate of the swell retardation percent.
- Micro Computed Tomography is limited in its use for the nano/molecular level studies.
- micro CT has been used only to visualize and evaluate the micron level fabric of the pre and post swell samples using the contrasting attenuation property of the clay particles before and after the swell test. This concludes that CT could be used as a general tool for the assessment of the factors contributing to the swell potential of any compacted or natural clay matrix.
- Micro CT results indicate the agglomeration of the fine grained clay particles in the pre swell state while these become more dispersed in their post swell state ( FIGS. 203A to 209B ).
- Molecular level modeling and simulations performed in the present disclosure are divided into various steps.
- Molecular level modeling techniques such as molecular mechanics (MM), molecular dynamics (MD), and Monte Carlo (MC) simulations have been used to study the processes and interactions occurring at the molecular level in the natural and compacted fabrics of the expansive clayey soils. These simulation techniques were used to study the interactions between clay and non-clay particles with various combinations of CEC, interlayer and intra layer cations, anions, and water under various fabric and structure conditions.
- Basic clay mineral was represented by a montmorillonite crystallite of 54 ⁇ 26 ⁇ 20 ⁇ size.
- Cohesive energy density (CED) concept has been used to explain various molecular level processes and interactions occurring at different levels of the volume change in expansive clayey soils.
- CED has been found sensitive to all the possible changes in the clay structure due to variation in CEC, interlayer and intra layer cations, anions, water, and density conditions.
- Total CED of any combination of molecules is contributed from two components, i.e., electrostatic and van der Waals forces. Contribution from van der Waals could either be repulsion or attraction in nature, while it is always attraction in nature from electrostatic forces. The results of each step are discussed and interpreted in the light of the CED concept.
- the parameters selected in the Sorption and Forcite modules including the modified Universal forcefield are confirmed.
- a comparison of the swelling results from the original and the modified Universal forcefields is shown in FIG. 59 .
- the comparative plots clearly indicate the disability of the original Universal forcefield to predict the real swell behavior of single montmorillonite crystallite.
- the concept of using 25,000 steps as threshold for the water molecules sorption and other parameters in Sorption Monte Carlo simulation have also proven to be accurate.
- same process of water sorption was adopted for the pyrophyllite crystallite.
- the procedure and parameters further confirms as no water molecule could be sorbed in pyrophyllite crystallite of the same size (54 ⁇ 26 ⁇ 20 ⁇ ) during the 25,000 steps of Monte Carlo simulation.
- Sorption module was used to simulate the assemblages of water sorbed crystallites when mixed together in the loose form before the compaction process.
- four crystallites were randomly sorbed in a 125 ⁇ 125 ⁇ 125 ⁇ cubic unit cell ( FIG. 43 ).
- Several cubic unit cells sizes ranging from 100 ⁇ to 200 ⁇ were experimented and 125 ⁇ was finally selected. Bigger unit cells resulted in distances larger than the crystallite themselves and smaller ones caused overlapping of the crystallites.
- these four crystallites occupy relative positions in the cubic space ( FIGS. 42 and 43 ).
- the relative positions are taken up by the crystallites either parallel to faces, edge to edge, edge to the face, or an intermediate form depending on the charge distribution on each crystallite and the moisture content.
- Typical fabric formation in loose mix form are shown in FIGS. 74 and 75 . It could be noted that crystallite arrangement at lower water contents is more random and generally follows the face to edge/end configuration, while it becomes more oriented and adopts parallel configuration at higher water contents.
- CED have been considered as a good indicator of the interaction of the soil structure to the water sorption and the consequent volume change.
- Simulated loose mixes of the soil were determined through the Forcite module of the software and plotted in the corresponding graphs in FIGS. 76 to 81 .
- Total CED of the loose mixes varies from 1 ⁇ 10 8 to 8 ⁇ 10 8 J/m 3 .
- a general trend observed is that low CEC crystallites produce lesser cohesive energy while higher CEC and the crystallites sorbed with other compounds showed higher numbers.
- unit cells consisting of the loose clay crystallites created in the previous step were compressed to the required density using Forcite molecular dynamics module.
- barostats provided in the software for the control of applied pressure on the unit cell; Berendsen and Parrinello are two that could be considered suitable for the compaction simulation of naturally or manually compacted soil samples.
- Berendsen thermostat was used as in the simulation of single crystallite, while Berendsen barostat was replaced by Parrinello barostat.
- Berendsen barostat applies pressure in all the directions in a way to keep the unit cell dimensions equal, the corresponding reduction of volume on all the faces of the periodic boundary cell remains uniform.
- Berendsen barostat does not simulate the real compaction process in which stresses vary along the faces under a uniform compaction pressure process.
- a comparison of the compressed/compacted unit cells using Berendsen and Parrinello is shown in FIGS. 82 and 83 .
- Parrinello barostat has resulted in more realistic way of compaction by varying the stresses on the faces depending on the shear stresses generated in the unit cell.
- the resulting fabric is also more random and face to edge fabric on lower moisture content while more oriented and parallel fabric is created on higher moisture contents.
- the variation in relative positioning or configurations of the crystallites with water content is a well-established fact in compacted clays.
- FIG. 45 provides a 3-D view of the repetition of the unit cell in three dimensions in space.
- unit cell provides the continuity of the crystallites to form soil particles. Since formulation of compacted crystallites/particles resemble the actual fabrics schematically visualized, it further confirms the selected parameters and procedures for the formulation and simulation of compacted fabric of soil particles.
- Different confining or compaction pressures were used to simulate the several levels of geological and laboratory compaction pressures. Different pressures have resulted in different maximum densities of the unit cells ( FIG. 44 ). It is evident from FIG. 44 , high pressures of an order of 1 GPa causes quick compaction and may be closely representative of dynamic and static quick type of compaction using the laboratory and field equipment. On the other hand, low confining pressures of an order of 0.01 to 0.1 GPa result in slow compaction and hence may be simulating more closely slow compaction/consolidation pressures for the geological deposits. It could be noted from the plots that densities are also closely representative of the general range of field and laboratory densities.
- total CED has been found to be increasing with increase in CEC, density, cementation, and bivalent cations and decreasing with water content, while van der Waals cohesive energy density reduces and becomes repulsion in nature with the same variation of the above parameters.
- Natural expansive clay deposits usually form at deeper depths under consolidation pressures from the overlying geological formations. Once these clay layers are exposed closer to the ground surface due to removal of overlying layers, these layers become overconsolidated in nature as a result of this stress relief. Moreover, fabric and structure of these clay deposits also change as a result of the stress relief and several other features, such as fissures and voids, develop in the structure of these overconsolidated layers.
- compressed/compacted unit cells at higher pressures were dynamically run in the Forcite module using Parrinello barostat under a stress level of 1000 kPa. The pressure of 1000 kPa is a very close representation of the generally measured preconsolidation pressures of such deposits in the shallow subsurface.
- FIGS. 84 and 85 show typical unit cells before and after the stress relief simulation. Comparing the fabric before and after the stress relief shows not only an increase in pore space, but also an increase in the d-spacing of the crystallites. CED results in FIGS. 76 to 83 and Table 13 show a drop in cohesive energy as the structure relaxed. There is also a decrease in the repulsion forces due to van der Waals. This drop is indicative of the elastic recovery of the soil structure upon overburden stress relief.
- FIG. 86 shows that water molecules have occupied both inter and intra crystallite space.
- 25,000 steps were adopted to sorb the maximum number of water molecules.
- density, and other factors such as cementation and exchangeable cations
- water sorption for a single step varied from as low as 2% to maximum of 10%.
- Very low water content is indicative of structure with very small pore space created either due to high density or cementation.
- Higher water content sorption indicates an open pore space fabric and high interlayer deficiency.
- the unit cell of crystallites were dynamically stabilized using Forcite module. Sorption steps were repeated in steps followed by stabilization through molecular dynamics until the swell cutoff was reached. Swell cutoffs have been defined based on the cohesive energy concept and are explained below on swelling of water sorbed various forms of crystallites.
- Each unit cell consisting of four crystallites and sorbed with the maximum number of water molecules in 25,000 steps in the Sorption module was subjected to molecular dynamics using Forcite module.
- the dynamics module causes the movement of molecules to stable positions and result in a stable expanded structure under a pressure of 1000 kPa ( FIGS. 87 and 88 ). It could be noted from FIGS. 87 and 88 that the volume change occurs both in the interlayer and intracrystallite space.
- the maximum expansion occurs in the intracrystallite space while the interlayer space continues to expand at slow pace until it reaches a maximum value of about 17.5 ⁇ .
- each swelling phase causes reduction in cohesive energy density at a uniform rate for each CEC of Na-montmorillonite except for HCEC at 10% water content. All the cases, except those with cementation and exchangeable cations other than Na + , a straight line plot between CED and water content is continued until it reaches a swell cutoff or terminal point. Swell cutoff points for all such cases were found to be terminating at a cohesive energy density of an order of 300 to 500 J/cm 3 . By looking at the swell potential test results, terminal dry densities were found to be about 0.45 to 0.55 g/cm 3 for 100% bentonite samples.
- this density range has been found equivalent to the cohesive energy density range of 300 to 400 J/cm 3 .
- all the swell lines terminate at a cohesive energy density of 400 J/cm 3 .
- the termination points also indicate the terminal or post swell moisture content. For the other cases, terminal or swell cutoffs are discussed later herein.
- FIGS. 80 and 81 show the typical curved plots and the corresponding terminal or swell cutoff points and the corresponding swell potentials are summarized in Table 13.
- FIG. 81 provides the corresponding cohesive energy plots for these various combinations.
- Replacing 60% of exchangeable Na + cation with K + cation causes a reduction in swell by about 15%, while 60% replacement with Ca 2+ and Mg 2+ cations result in a reduction by 50% and 45% respectively.
- Bivalent cations such as Ca 2+ and Mg 2+ result in extra binding to the crystallite layers and hence cause a reduction in swell potential.
- monovalent K + cation does not provide binding forces enough to cause substantial reduction in swell potential.
- LCEC with 60% Ca+40% Na could be considered as a close representative of the bentonite used in this study.
- Swell potential results of this combination very closely match the values obtained from swell potential tests.
- the terminal moisture contents as assessed from simulations are also very close to the ones determined experimentally.
- FIGS. 90 to 93 show a general trend of decreasing CED with the water content until 30% and afterwards it remains almost constant. Any change in parameters like CEC, cementations, and cations, causes a shift in total CED and the shift remains constant throughout the moisture content range. To avoid cluttering of the data and for better visualization, several plots have been omitted in these figures. Development of an incremental form of constitutive relations is detailed later herein.
- d v and d wc are change in volume and water content respectively
- IDD initial dry density
- FDD final dry density
- FWC final water content
- IWC initial water content
- TCED total cohesive energy density
- TCEDm modified TCED
- C Calcite
- G Gypsum
- KCl Potassium chloride
- Ca Calcium exchangeable cation
- Mg Magnesium exchangeable cation
- K Potassium exchangeable cation
- IDD ⁇ 2E-15(TCED) 4 +5E-11(TCED) 3 ⁇ 5E-07(TCED) 2 +0.0023(TCED) ⁇ 1.5378 ⁇ *1.85*(ABS(CEC ⁇ 90)/90) 4-4
- FDD ⁇ 2E-22(TCED) 6 +5E-18(TCED) 5 ⁇ 6E-14(TCED) 4 +3E-10(TCED) 3 ⁇ 7E-07(TCED) 2 +0.0005(TCED)+0.3747 4-5
- FWC (1E-13(TCED) 4 ⁇ 4E-09(TCED) 3 +4E-05(TCED) 2 ⁇ 0.2037TCED+369.54)*ABS(CEC2 ⁇ 90)/
- swell potential was determined for all the samples tested using swell potential tests in the present disclosure and are tabulated in Table 14. Similarly, swell potential was also assessed for the undisturbed samples from the Eastern region of KSA tested by Hameed and the results are tabulated in Table 15 and plotted in FIG. 100 . See Hameed, R. A. (1991), “Characterization of Expansive Soils in the Eastern province of Saudi Arabia”, MS Thesis, KFUPM, Dhahran, Saudi Arabia, July 1991, incorporated herein by reference in its entirety.
- nano model to the natural soils requires a knowledge of the quantity and distribution of the non-clay minerals in the matrix. This knowledge can be acquired from the XRD results and total cations analysis of these samples. Based on this close confirmation of swell potential for undisturbed samples by nano model, it can also quite effectively be used for the assessment of swell potential of natural expansive clay deposits.
- FIG. 101 typically represents the swell behavior of Na-montmorillonite without any other constraint and it shows a complete separation of particles at higher water contents.
- FIGS. 102 and 103 depict the volume change response of expansive clay minerals restrained by other factors such as additional binding from very high CEC, cementation from non-clay salts, and/or exchangeable cations other than sodium. These typical behaviors also mark the validity of the developed model and the constitutive relationships.
- powder XRD has provided vital information on the crystallite size and the relationship of the lattice (d-spacing) expansion with water content.
- Results from CT, FTIR, and ESEM are more qualitative in nature and provide complementary information to XRD results.
- micro CT testing is limited in its use for the nano/molecular level studies. Therefore, in the present disclosure, micro CT has been used to visualize and evaluate only the micron level fabric of the pre and post swell samples using the contrasting attenuation property of the clay particles before and after the swell test.
- an equivalent static pressure has been determined as 1500 kPa.
- a static pressure of 1500 kPa could be used to compact the specimens in two layers in the Odometer rings of 70 mm diameter and 19 mm height.
- CED cohesive energy density
- a general trend observed in the present disclosure is that low CEC crystallites produced lesser CED, while higher CEC and the crystallites sorbed with other compounds showed higher values.
- Total CED has been found to be increasing with increase in CEC, density, cementation, and bivalent cations and decreasing with water content, while van der Waals CED reduces and becomes repulsion in nature with the same variation of the above parameters.
- all the swell lines terminate at a cohesive energy density of 400 J/cm 3 .
- the termination points also indicate the terminal or post swell moisture content.
- plots between CED and moisture content is not a straight line.
- the plot has an initial straight portion followed by a curvature and a straight line to the terminal or swell cutoff.
- Swell cutoff for these cases have been determined to be the point up to CED equivalent to 4 ⁇ 10 8 J/m 3 plus CED difference between the specific case and its Na-montmorillonite counterpart.
- Terminal moisture content for high swell cases for each CEC is lesser than their low swell counterparts. For instance, swell line for 30% initial water content LCEC terminates at 113% while the one for 40% initial water content LCEC falls at 138%. A similar observation was also made during the swell potential tests; terminal moisture content for initial moisture contents of 30% and 40% are 136% and 174%, respectively.
- This anomalous phenomenon can be explained using the contribution of additional expansion caused by the repulsion van der Waals forces.
- the repulsion van der Waal forces result in an additional expansion. As swelling progresses, the repulsion force due to van der Waals result in pushing the particles apart. Since these forces are higher in case of highly compacted specimens or lesser moisture contents, relatively higher swelling takes place at lower water content for such cases.
Abstract
Description
| TABLE 1 |
| Mineralogical analysis of expansive clay deposits in the Kingdom of Saudi Arabia |
| (Hameed, 1991). |
| Sample No. | Location | BH/TP No. | Depth (m) | Mineral type (% composition) |
| 1 | Al-Khars, Al-Hasa | BH-9 | 2.5-2.7 | C(50), Q(10), P(8), K(5), I(9), S(7) |
| 2 | Mahasen-Aramco, Al-Hasa | BH-13 | 2.0-2.25 | C(34), Q(16), P(8), K(3), I(31), S(4), St(4) |
| 3 | Al-Hamadiya | BH-11 | 1.0-1.3 | C(35), Q(10), P(8), K(3), I(30), S(8), St(5) |
| 4 | Al- Salehiya | BH-12 | 2.4-2.7 | C(19), Q(19), P(4), K(4), I(47), D(1), S(8) |
| 5 | Al-Khasr, Al-Hasa | TP-7 | 1.1 | C(39), Q(11), P(10), K(11), I(19), S(6), St(4) |
| 6 | Al-Naathel, Al-Hasa | TP-11 | 2.0-2 2 | C(61), Q(24), P(6), K(3), S(6) |
| 7 | Mahasen-Aramco, Al-Hasa | TP-11 | 2.0-2.2 | C(27), Q(19), P(10), K(5), I(32), S(4), St(3) |
| 8 | Housing Area | BH-1 | 3.8 | Q(9), P(9), S(30), St(12), T, I(40) |
| 9 | Housing Area | BH-3 | 1.8-2.1 | Q(7), K(<1), S(25), St(10), D(32), I |
| 10 | Umm Al-Sahek | BH-6 | 0.45-0.6 | Q(4), K(<1), P(2), S(13), G(11), D(48), I(22) |
| 11 | Umm Al-Hammam | BH-8 | 5.6-5.75 | C(<1), Q(10), P(11), D(<1), S(39), I(39) |
| C = Calcite | ||||
| Q = Quartz | ||||
| P = Palygorskite | ||||
| St = Sepiohite | ||||
| S = Smectite | ||||
| K = Kaolinite | ||||
| I = Illite | ||||
| D = Dolomite | ||||
| G = Gypsum | ||||
| T = Talc | ||||
| TABLE 2 |
| Geotechnical properties of the expansive clay deposits in Qatif area, |
| Kingdom of Saudi Arabia (Dafalla and Shamrani, 2012). |
| Brown calcareous green and | Property range for |
| brown clay, symbol (USCS): | Al Qatif soils |
| CH and MH | Avg. min. | Avg. max. |
| Dry unit weight, gd, kN/ |
10 | 14 |
| Water content, wn, % | 15 | 40 |
| Liquid limit, LL, % | 120 | 160 |
| Plastic limit, PL, % | 30 | 60 |
| Plasticity index, PI, % | 90 | 100 |
| Shrinkage limit, SL, % | 9 | 15 |
| Percent sand, % | 0 | 5 |
| Percent silt, % | 15 | 50 |
| Percent clay, % | 50 | 90 |
| Specific gravity, Gs | 2.5 | 2.6 |
| Selling pressure, kN/ |
200 | 1000 |
| |
2 | 20 |
| TABLE 3 |
| Comparison of swelling potential based on the results from the laboratory |
| and field tests (Abduljauwad and Al-Sulaimani, 1993). |
| Percentage of | Swelling | Heave, | |
| Method | Swell, % | Pressure, kPa | mm |
| Oedometer | |||
| Improved |
36 | 3100 | 63.9 |
| Constant volume | — | 800 | 47.5 |
| Reverse curve | 8.8 | 2000 | 58.6 |
| Suction | — | — | 36.8 |
| Triaxial | 14.3 | 420 | 39.6 |
| Simulation swelling test | 15.0 | — | 37.4 |
| Field | 15.4 | 180 | 38.4 |
E Total =Et conl +E VDH +E Bond Stretch +E Angle Bend +E Torsion 2-1
U(r)=∈└e 2β(p-r)−2e β(p-r)┘. (Morse potential) 2-5
-
- More effort and emphasis has been directed to the development and enhancement of the unsaturated non-expansive soils models, while much lesser effort has been made towards expansive clay modeling.
- Almost all the researchers involved in the unsaturated soils research have considered expansive soils as an extreme case of the unsaturated soils; rather it should be considered both as a special case of saturated soils and unsaturated soils under the complete moisture regime.
- Micro and nano level fabrics, believed to have a central role in the overall behavior of expansive clays, are only partially considered in the modeling concepts. Even the partial consideration of the micro and nano level fabric is for the clays compacted/constructed under highly controlled conditions; natural clay fabrics with multiple clay minerals, silt and sand inclusions, micro fissures, cementation, over-consolidation, induration, and other such features have never been considered.
- The boundary between expansive and non-expansive soils is not well defined, and more consideration is needed to better understand the behavior of slightly expansive clay soils such as broadly graded soils with small Smectite (and Illite) contents and soil dominated by non-swelling clays such as Kaolinite.
- Molecular level research, at present, has just concentrated mostly on one mineral only; interaction with other minerals and macro particles is lacking.
- It has been observed that the macroscopic behavior of clay mass may differ considerably from their nano-scale response, which is the major motivation for characterizing and modeling these materials using multiscale simulations.
TCEDm=0.0625(IWC)3−3.575(IWC)2+10.5(IWC)+2830+7100(C/0.1)+5050(G/0.2)+3010(KCl/0.1)+Ca(500)+Mg(300)+K(100) (6)
where TCEDm=modified TCED, C=Proportion of calcite weight relative to the total weight of the first swelling reduction agent incorporated expansive clayey soil×PECM, G=Proportion of gypsum weight relative to the total weight of the first swelling reduction agent incorporated expansive clayey soil×PECM, KCl=Proportion of potassium chloride weight relative to the total weight of the first swelling reduction agent incorporated expansive clayey soil×PECM, Ca=Proportion of the number of calcium exchangeable cation relative to the total number of exchangeable cations in the first swelling reduction agent incorporated expansive clayey soil, Mg=Proportion of the number of magnesium exchangeable cation relative to the total number of exchangeable cations in the first swelling reduction agent incorporated expansive clayey soil, K=Proportion of the number of potassium exchangeable cation relative to the total number of exchangeable cations in the first swelling reduction agent incorporated expansive clayey soil, IWC=initial water content, wherein the TCEDm of the first swelling reduction agent incorporated at least one expansive clay mineral results in S1i(ECM) calculated according to Equations (2), (3), and (5):
IDD={−2E-15(TCEDm)4+5E-11(TCEDm)3−5E-07(TCEDm)2+0.0023(TCEDm)−1.5378}*1.85*(ABS(CEC−90)/90) (2)
where IDD is initial dry density of the first swelling reduction agent incorporated at least one expansive clay mineral,
FDD=−2E-22(TCEDm)6+5E-18(TCEDm)5−6E-14(TCEDm)4+3E-10(TCEDm)3−7E-07(TCEDm)2+0.0005(TCEDm)+0.3747 (3)
where FDD is final dry density of the first swelling reduction agent incorporated at least one expansive clay mineral when the first swelling reduction agent incorporated at least one expansive clay mineral reaches the swell potential S1i(ECM),
S 1i(ECM)(%)=(FDD−IDD)/FDD*100 (5);
and wherein the reduced swell potential of the first swelling reduction agent incorporated expansive clayey soil S1i(soil) equals S1i(ECM)×PECM, and (b) incorporating the first amount of the swelling reduction agent into the expansive clayey soil to form the first swelling reduction agent incorporated expansive clayey soil.
TCEDm=0.0625(IWC)3−3.575(IWC)2+10.5(IWC)+2830+7100(C/0.1)+5050(G/0.2)+3010(KCl/0.1)+Ca(500)+Mg(300)+K(100) (6)
where TCEDm=modified TCED, C=Proportion of calcite weight relative to the total weight of the expansive clayey soil×PECM, G=Proportion of gypsum weight relative to the total weight of the expansive clayey soil×PECM, KCl=Proportion of potassium chloride weight relative to the total weight of the expansive clayey soil×PECM, Ca=Proportion of the number of calcium exchangeable cation relative to the total number of exchangeable cations in the expansive clayey soil, Mg=Proportion of the number of magnesium exchangeable cation relative to the total number of exchangeable cations in the expansive clayey soil, K=Proportion of the number of potassium exchangeable cation relative to the total number of exchangeable cations in the expansive clayey soil, IWC=initial water content, wherein the TCEDm of the at least one expansive clay mineral results in SECM calculated according to Equations (2), (3), and (5):
IDD={−2E-15(TCEDm)4+5E-11(TCEDm)3−5E-07(TCEDm)2+0.0023(TCEDm)−1.5378}*1.85*(ABS(CEC−90)/90) (2)
where IDD is initial dry density of the at least one expansive clay mineral,
FDD=−2E-22(TCEDm)6+5E-18(TCEDm)5−6E-14(TCEDm)4+3E-10(TCEDm)3−7E-07(TCEDm)2+0.0005(TCEDm)+0.3747 (3)
where FDD is final dry density of the at least one expansive clay mineral when the at least one expansive clay mineral reaches the swell potential SECM,
S ECM (%)=(FDD−IDD)/FDD*100 (5),
and wherein the swell potential of the expansive clayey soil Ssoil equals SECM×PECM.
TCEDm=0.0625(IWC)3−3.575(IWC)2+10.5(IWC)+2830+7100(C/0.1)+5050(G/0.2)+3010(KCl/0.1)+Ca(500)+Mg(300)+K(100) (6)
where TCEDm=modified TCED, C=Proportion of calcite weight relative to the total weight of the second swelling reduction agent incorporated expansive clayey soil×PECM, G=Proportion of gypsum weight relative to the total weight of the second swelling reduction agent incorporated expansive clayey soil×PECM, KCl=Proportion of potassium chloride weight relative to the total weight of the second swelling reduction agent incorporated expansive clayey soil×PECM, Ca=Proportion of the number of calcium exchangeable cation relative to the total number of exchangeable cations in the second swelling reduction agent incorporated expansive clayey soil, Mg=Proportion of the number of magnesium exchangeable cation relative to the total number of exchangeable cations in the second swelling reduction agent incorporated expansive clayey soil, K=Proportion of the number of potassium exchangeable cation relative to the total number of exchangeable cations in the second swelling reduction agent incorporated expansive clayey soil, IWC=initial water content, wherein the TCEDm of the second swelling reduction agent incorporated at least one expansive clay mineral results in S2i(ECM) calculated according to Equations (2), (3), and (5):
IDD={−2E-15(TCEDm)4+5E-11(TCEDm)3−5E-07(TCEDm)2+0.0023(TCEDm)−1.5378}*1.85*(ABS(CEC−90)/90) (2)
where IDD is initial dry density of the second swelling reduction agent incorporated at least one expansive clay mineral,
FDD=−2E-22(TCEDm)6+5E-18(TCEDm)5−6E-14(TCEDm)4+3E-10(TCEDm)3−7E-07(TCEDm)2+0.0005(TCEDm)+0.3747 (3)
where FDD is final dry density of the second swelling reduction agent incorporated at least one expansive clay mineral when the second swelling reduction agent incorporated at least one expansive clay mineral reaches the swell potential S2i(ECM),
S 2i(ECM) (%)=(FDD−IDD)/FDD*100 (5);
and wherein the further reduced swell potential of the second swelling reduction agent incorporated expansive clayey soil S2i(soil) equals S2i(ECM)×PECM, and (c) incorporating the second amount of the swelling reduction agent into the first swelling reduction agent incorporated expansive clayey soil to form the second swelling reduction agent incorporated expansive clayey soil.
TCEDm=0.0625(IWC)3−3.575(IWC)2+10.5(IWC)+2830+7100(C/0.1)+5050(G/0.2)+3010(KCl/0.1)+Ca(500)+Mg(300)+K(100) (6)
where TCEDm=modified TCED, C=Proportion of calcite weight relative to the total weight of the expansive clayey soil×PECM, G=Proportion of gypsum weight relative to the total weight of the expansive clayey soil×PECM, KCl=Proportion of potassium chloride weight relative to the total weight of the expansive clayey soil×PECM, Ca=Proportion of the number of calcium exchangeable cation relative to the total number of exchangeable cations in the expansive clayey soil, Mg=Proportion of the number of magnesium exchangeable cation relative to the total number of exchangeable cations in the expansive clayey soil, K=Proportion of the number of potassium exchangeable cation relative to the total number of exchangeable cations in the expansive clayey soil, IWC=initial water content, wherein the TCEDm of the wetted at least one expansive clay mineral results in Sw(ECM) calculated according to Equations (2), (3), and (5):
IDD={−2E-15(TCEDm)4+5E-11(TCEDm)3−5E-07(TCEDm)2+0.0023(TCEDm)−1.5378}*1.85*(ABS(CEC−90)190) (2)
where IDD is initial dry density of the wetted at least one expansive clay mineral,
FDD=−2E-22(TCEDm)6+5E-18(TCEDm)5−6E-14(TCEDm)4+3E-10(TCEDm)3−7E-07(TCEDm)2+0.0005(TCEDm)+0.3747 (3)
where FDD is final dry density of the wetted at least one expansive clay mineral when the wetted at least one expansive clay mineral reaches the swell potential Sw(ECM),
S w(ECM) (%)=(FDD−IDD)/FDD*100 (5);
and wherein the reduced swell potential of the wetted expansive clayey soil Sw(soil) equals Sw(ECM)×PECM, and (b) wetting the expansive clayey soil with water to form the wetted expansive clayey soil having the second water content.
TCEDm=0.0625(IWC)3−3.575(IWC)2+10.5(IWC)+2830+7100(C/0.1)+5050(G/0.2)+3010(KCl/0.1)+Ca(500)+Mg(300)+K(100) (6)
where TCEDm=modified TCED, C=Proportion of calcite weight relative to the total weight of the expansive clayey soil×PECM, G=Proportion of gypsum weight relative to the total weight of the expansive clayey soil×PECM, KCl=Proportion of potassium chloride weight relative to the total weight of the expansive clayey soil×PECM, Ca=Proportion of the number of calcium exchangeable cation relative to the total number of exchangeable cations in the expansive clayey soil, Mg=Proportion of the number of magnesium exchangeable cation relative to the total number of exchangeable cations in the expansive clayey soil, K=Proportion of the number of potassium exchangeable cation relative to the total number of exchangeable cations in the expansive clayey soil, IWC=initial water content, and wherein the TCEDm of the at least one expansive clay mineral results in the final water content (FWC) of the at least one expansive clay mineral when the at least one expansive clay mineral reaches the swell potential according to Equation (4):
FWC={1E-13(TCEDm)4−4E-09(TCEDm)3+4E-05(TCEDm)2−0.2037TCEDm+369.54}*ABS(CEC2−90)/CEC2*0.82 (4)
TCEDm=0.0625(IWC)3−3.575(IWC)2+10.5(IWC)+2830+7100(C/0.1)+5050(G/0.2)+3010(KCl/0.1)+Ca(500)+Mg(300)+K(100) (6)
where TCEDm=modified TCED, C=Proportion of calcite weight relative to the total weight of the first swelling reduction agent incorporated expansive clayey soil×PECM, G=Proportion of gypsum weight relative to the total weight of the first swelling reduction agent incorporated expansive clayey soil×PECM, KCl=Proportion of potassium chloride weight relative to the total weight of the first swelling reduction agent incorporated expansive clayey soil×PECM, Ca=Proportion of the number of calcium exchangeable cation relative to the total number of exchangeable cations in the first swelling reduction agent incorporated expansive clayey soil, Mg=Proportion of the number of magnesium exchangeable cation relative to the total number of exchangeable cations in the first swelling reduction agent incorporated expansive clayey soil, K=Proportion of the number of potassium exchangeable cation relative to the total number of exchangeable cations in the first swelling reduction agent incorporated expansive clayey soil, IWC=initial water content, wherein the TCEDm of the first swelling reduction agent incorporated at least one expansive clay mineral results in S1i(ECM) calculated according to Equations (2), (3), and (5):
IDD={−2E-15(TCEDm)4+5E-11(TCEDm)3−5E-07(TCEDm)2+0.0023(TCEDm)−1.5378}*1.85*(ABS(CEC−90)/90) (2)
where IDD is initial dry density of the first swelling reduction agent incorporated at least one expansive clay mineral,
FDD=−2E-22(TCEDm)6+5E-18(TCEDm)5−6E-14(TCEDm)4+3E-10(TCEDm)3−7E-07(TCEDm)2+0.0005(TCEDm)+0.3747 (3)
where FDD is final dry density of the first swelling reduction agent incorporated at least one expansive clay mineral when the first swelling reduction agent incorporated at least one expansive clay mineral reaches the swell potential S1i(ECM),
S 1i(ECM)(%)=(FDD−IDD)/FDD*100 (5);
and wherein the reduced swell potential of the first swelling reduction agent incorporated expansive clayey soil S1i(soil) equals S1i(ECM)×PECM, and (b) incorporating the first amount of the swelling reduction agent into the expansive clayey soil at the site to form the first swelling reduction agent incorporated expansive clayey soil.
TCEDm=0.0625(IWC)3−3.575(IWC)2+10.5(IWC)+2830+7100(C/0.1)+5050(G/0.2)+3010(KCl/0.1)+Ca(500)+Mg(300)+K(100) (6)
where TCEDm=modified TCED, C=Proportion of calcite weight relative to the total weight of the first swelling reduction agent incorporated expansive clayey soil×PECM, G=Proportion of gypsum weight relative to the total weight of the first swelling reduction agent incorporated expansive clayey soil×PECM, KCl=Proportion of potassium chloride weight relative to the total weight of the first swelling reduction agent incorporated expansive clayey soil×PECM, Ca=Proportion of the number of calcium exchangeable cation relative to the total number of exchangeable cations in the first swelling reduction agent incorporated expansive clayey soil, Mg=Proportion of the number of magnesium exchangeable cation relative to the total number of exchangeable cations in the first swelling reduction agent incorporated expansive clayey soil, K=Proportion of the number of potassium exchangeable cation relative to the total number of exchangeable cations in the first swelling reduction agent incorporated expansive clayey soil, IWC=initial water content, wherein the TCEDm of the first swelling reduction agent incorporated at least one expansive clay mineral results in S1i(ECM) calculated according to Equations (2), (3), and (5):
IDD={−2E-15(TCEDm)4+5E-11(TCEDm)3−5E-07(TCEDm)2+0.0023(TCEDm)−1.5378}*1.85*(ABS(CEC−90)/90) (2)
where IDD is initial dry density of the first swelling reduction agent incorporated at least one expansive clay mineral,
FDD=−2E-22(TCEDm)6+5E-18(TCEDm)5−6E-14(TCEDm)4+3E-10(TCEDm)3−7E-07(TCEDm)2+0.0005(TCEDm)+0.3747 (3)
where FDD is final dry density of the first swelling reduction agent incorporated at least one expansive clay mineral when the first swelling reduction agent incorporated at least one expansive clay mineral reaches the swell potential S1i(ECM),
S 1i(ECM)(%)=(FDD−IDD)/FDD*100 (5);
and wherein the reduced swell potential of the first swelling reduction agent incorporated expansive clayey soil S1i(soil) equals S1i(ECM)×PECM, and (b) incorporating the first amount of the swelling reduction agent into the expansive clayey soil to form the first swelling reduction agent incorporated expansive clayey soil.
where Ms is the mass of soil solids and Ms=Mcds−Mc; and Mw is the mass of pore water and Mw=Mcms−Mcds.
TCED=0.0625(IWC)3−3.575(IWC)2+10.5(IWC)+2830 (1)
where TCED is total cohesive energy density in J/cm3 of the expansive clay mineral(s) and IWC is the initial water content of the expansive clayey soil (and the expansive clay mineral(s) the expansive clayey soil comprises).
TCEDm=0.0625(IWC)3−3.575(IWC)2+10.5(IWC)+2830+7100(C/0.1)+5050(G/0.2)+3010(KCl/0.1)+Ca(500)+Mg(300)+K(100) (6)
where TCEDm=modified TCED, C=Proportion of calcite weight relative to the total weight of the (swelling reduction agent incorporated) expansive clayey soil×PECM, G=Proportion of gypsum weight relative to the total weight of the (swelling reduction agent incorporated) expansive clayey soil×PECM, KCl=Proportion of potassium chloride weight relative to the total weight of the (swelling reduction agent incorporated) expansive clayey soil×PECM, Ca=Proportion of the number of calcium exchangeable cation relative to the total number of exchangeable cations in the (swelling reduction agent incorporated) expansive clayey soil, Mg=Proportion of the number of magnesium exchangeable cation relative to the total number of exchangeable cations in the (swelling reduction agent incorporated) expansive clayey soil, K=Proportion of the number of potassium exchangeable cation relative to the total number of exchangeable cations in the (swelling reduction agent incorporated) expansive clayey soil, IWC=initial water content. For example, if calcite is present in an expansive clayey soil at 30% of the total weight of the expansive clayey soil, and the proportion PECM or weight percent of the expansive clay minerals is 20% of the total weight of the expansive clayey soil, then C in Equation (6) will be 0.3×0.2=0.06. As another example, if calcium exchangeable cation constitutes 50% of the total number of exchangeable cations and potassium exchangeable cation constitutes 30% of the total number of exchangeable cations in addition to Na+ exchangeable cation, then Ca and K in Equation (6) will be 0.5 and 0.3, respectively. Since Equation (6) incorporates Equation (1) entirely, i.e. Equation (6) is the same as Equation (1) when the expansive clayey soil or the expansive clay mineral(s) do not comprise any of the swelling reduction agents listed above, Equation (6) and the corresponding TCEDm supersede Equation (1) and TCED, respectively, hereafter in the “Detailed Description of the Embodiments” when calculations of total cohesive energy density of expansive clay mineral(s) are described and discussed.
IDD={−2E-15(TCEDm)4+5E-11(TCEDm)3−5E-07(TCEDm)2+0.0023(TCEDm)−1.5378}*1.85*(ABS(CEC−90)/90) (2)
FDD=−2E-22(TCEDm)6+5E-18(TCEDm)5−6E-14(TCEDm)4+3E-10(TCEDm)3−7E-07(TCEDm)2+0.0005(TCEDm)+0.3747 (3)
FWC={1E-13(TCEDm)4−4E-09(TCEDm)3+4E-05(TCEDm)2−0.2037TCEDm+369.54}*ABS(CEC2−90)/CEC2*0.82 (4)
S ECM (%)=(FDD−IDD)/FDD*100 (5)
TCEDm=0.0625(IWC)3−3.575(IWC)2+10.5(IWC)+2830+7100(C/0.1)+5050(G/0.2)+3010(KCl/0.1)+Ca(500)+Mg(300)+K(100) (6)
where TCEDm=modified TCED, C=Proportion of calcite weight relative to the total weight of the expansive clayey soil×PECM, G=Proportion of gypsum weight relative to the total weight of the expansive clayey soil×PECM, KCl=Proportion of potassium chloride weight relative to the total weight of the expansive clayey soil×PECM, Ca=Proportion of the number of calcium exchangeable cation relative to the total number of exchangeable cations in the expansive clayey soil, Mg=Proportion of the number of magnesium exchangeable cation relative to the total number of exchangeable cations in the expansive clayey soil, K=Proportion of the number of potassium exchangeable cation relative to the total number of exchangeable cations in the expansive clayey soil, IWC=initial water content, wherein the TCEDm of the at least one expansive clay mineral results in SECM calculated according to Equations (2), (3), and (5):
IDD={−2E-15(TCEDm)4+5E-11(TCEDm)3−5E-07(TCEDm)2+0.0023(TCEDm)−1.5378}*1.85*(ABS(CEC−90)/90) (2)
where IDD is initial dry density of the at least one expansive clay mineral,
FDD=−2E-22(TCEDm)6+5E-18(TCEDm)5−6E-14(TCEDm)4+3E-10(TCEDm)3−7E-07(TCEDm)2+0.0005(TCEDm)+0.3747 (3)
where FDD is final dry density of the at least one expansive clay mineral when the at least one expansive clay mineral reaches the swell potential S(ECM),
S (ECM)(%)=(FDD−IDD)/FDD*100 (5),
and wherein the swell potential of the expansive clayey soil S(soil) equals S(ECM)×PECM.
TCEDm=0.0625(IWC)3−3.575(IWC)2+10.5(IWC)+2830+7100(C/0.1)+5050(G/0.2)+3010(KCl/0.1)+Ca(500)+Mg(300)+K(100) (6)
where TCEDm=modified TCED, C=Proportion of calcite weight relative to the total weight of the second swelling reduction agent incorporated expansive clayey soil×PECM, G=Proportion of gypsum weight relative to the total weight of the second swelling reduction agent incorporated expansive clayey soil×PECM, KCl=Proportion of potassium chloride weight relative to the total weight of the second swelling reduction agent incorporated expansive clayey soil×PECM, Ca=Proportion of the number of calcium exchangeable cation relative to the total number of exchangeable cations in the second swelling reduction agent incorporated expansive clayey soil, Mg=Proportion of the number of magnesium exchangeable cation relative to the total number of exchangeable cations in the second swelling reduction agent incorporated expansive clayey soil, K=Proportion of the number of potassium exchangeable cation relative to the total number of exchangeable cations in the second swelling reduction agent incorporated expansive clayey soil, IWC=initial water content, wherein the TCEDm of the second swelling reduction agent incorporated at least one expansive clay mineral results in S2i(ECM) calculated according to Equations (2), (3), and (5):
IDD={−2E-15(TCEDm)4+5E-11(TCEDm)3−5E-07(TCEDm)2+0.0023(TCEDm)−1.5378}*1.85*(ABS(CEC−90)/90) (2)
where IDD is initial dry density of the second swelling reduction agent incorporated at least one expansive clay mineral,
FDD=−2E-22(TCEDm)6+5E-18(TCEDm)5−6E-14(TCEDm)4+3E-10(TCEDm)3−7E-07(TCEDm)2+0.0005(TCEDm)+0.3747 (3)
where FDD is final dry density of the second swelling reduction agent incorporated at least one expansive clay mineral when the second swelling reduction agent incorporated at least one expansive clay mineral reaches the swell potential S1i(ECM),
S 1i(ECM)(%)=(FDD−IDD)/FDD*100 (5);
and wherein the further reduced swell potential of the second swelling reduction agent incorporated expansive clayey soil S2i(soil) equals S2i(ECM)×PECM, and (c) incorporating the second amount of the swelling reduction agent into the first swelling reduction agent incorporated expansive clayey soil to form the second swelling reduction agent incorporated expansive clayey soil.
TCEDm=0.0625(IWC)3−3.575(IWC)2+10.5(IWC)+2830+7100(C/0.1)+5050(G/0.2)+3010(KCl/0.1)+Ca(500)+Mg(300)+K(100) (6)
where TCEDm=modified TCED, C=Proportion of calcite weight relative to the total weight of the expansive clayey soil×PECM, G=Proportion of gypsum weight relative to the total weight of the expansive clayey soil×PECM, KCl=Proportion of potassium chloride weight relative to the total weight of the expansive clayey soil×PECM, Ca=Proportion of the number of calcium exchangeable cation relative to the total number of exchangeable cations in the expansive clayey soil, Mg=Proportion of the number of magnesium exchangeable cation relative to the total number of exchangeable cations in the expansive clayey soil, K=Proportion of the number of potassium exchangeable cation relative to the total number of exchangeable cations in the expansive clayey soil, IWC=initial water content, wherein the TCEDm of the wetted at least one expansive clay mineral results in Sw(ECM) calculated according to Equations (2), (3), and (5):
IDD={−2E-15(TCEDm)4+5E-11(TCEDm)3−5E-07(TCEDm)2+0.0023(TCEDm)−1.5378}*1.85*(ABS(CEC−90)/90) (2)
where IDD is initial dry density of the wetted at least one expansive clay mineral,
FDD=−2E-22(TCEDm)6+5E-18(TCEDm)5−6E-14(TCEDm)4+3E-10(TCEDm)3−7E-07(TCEDm)2+0.0005(TCEDm)+0.3747 (3)
where FDD is final dry density of the wetted at least one expansive clay mineral when the wetted at least one expansive clay mineral reaches the swell potential S1i(ECM),
S 1i(ECM)(%)=(FDD−IDD)/FDD*100 (5);
and wherein the reduced swell potential of the wetted expansive clayey soil Sw(soil) equals Sw(ECM)×PECM, and (b) wetting the expansive clayey soil with water to form the wetted expansive clayey soil having the second water content.
TCEDm=0.0625(IWC)3−3.575(IWC)2+10.5(IWC)+2830+7100(C/0.1)+5050(G/0.2)+3010(KCl/0.1)+Ca(500)+Mg(300)+K(100) (6)
where TCEDm=modified TCED, C=Proportion of calcite weight relative to the total weight of the expansive clayey soil×PECM, G=Proportion of gypsum weight relative to the total weight of the expansive clayey soil×PECM, KCl=Proportion of potassium chloride weight relative to the total weight of the expansive clayey soil×PECM, Ca=Proportion of the number of calcium exchangeable cation relative to the total number of exchangeable cations in the expansive clayey soil, Mg=Proportion of the number of magnesium exchangeable cation relative to the total number of exchangeable cations in the expansive clayey soil, K=Proportion of the number of potassium exchangeable cation relative to the total number of exchangeable cations in the expansive clayey soil, IWC=initial water content, and wherein the TCEDm of the at least one expansive clay mineral results in the final water content (FWC) of the at least one expansive clay mineral when the at least one expansive clay mineral reaches the swell potential according to Equation (4):
FWC={1E-13(TCEDm)4−4E-09(TCEDm)3+4E-05(TCEDm)2−0.2037TCEDm+369.54}*ABS(CEC2−90)/CEC2*0.82 (4)
TCEDm=0.0625(IWC)3−3.575(IWC)2+10.5(IWC)+2830+7100(C/0.1)+5050(G/0.2)+3010(KCl/0.1)+Ca(500)+Mg(300)+K(100) (6)
where TCEDm=modified TCED, C=Proportion of calcite weight relative to the total weight of the first swelling reduction agent incorporated expansive clayey soil×PECM, G=Proportion of gypsum weight relative to the total weight of the first swelling reduction agent incorporated expansive clayey soil×PECM, KCl=Proportion of potassium chloride weight relative to the total weight of the first swelling reduction agent incorporated expansive clayey soil×PECM, Ca=Proportion of the number of calcium exchangeable cation relative to the total number of exchangeable cations in the first swelling reduction agent incorporated expansive clayey soil, Mg=Proportion of the number of magnesium exchangeable cation relative to the total number of exchangeable cations in the first swelling reduction agent incorporated expansive clayey soil, K=Proportion of the number of potassium exchangeable cation relative to the total number of exchangeable cations in the first swelling reduction agent incorporated expansive clayey soil, IWC=initial water content, wherein the TCEDm of the first swelling reduction agent incorporated at least one expansive clay mineral results in S1i(ECM) calculated according to Equations (2), (3), and (5):
IDD={−2E-15(TCEDm)4+5E-11(TCEDm)3−5E-07(TCEDm)2+0.0023(TCEDm)−1.5378}*1.85*(ABS(CEC−90)/90) (2)
where IDD is initial dry density of the first swelling reduction agent incorporated at least one expansive clay mineral,
FDD=−2E-22(TCEDm)6+5E-18(TCEDm)5−6E-14(TCEDm)4+3E-10(TCEDm)3−7E-07(TCEDm)2+0.0005(TCEDm)+0.3747 (3)
where FDD is final dry density of the first swelling reduction agent incorporated at least one expansive clay mineral when the first swelling reduction agent incorporated at least one expansive clay mineral reaches the swell potential S1i(ECM),
S 1i(ECM)(%)=(FDD−IDD)/FDD*100 (5);
and wherein the reduced swell potential of the first swelling reduction agent incorporated expansive clayey soil S1i(soil) equals S1i(ECM)×PECM, and (b) incorporating the first amount of the swelling reduction agent into the expansive clayey soil at the site to form the first swelling reduction agent incorporated expansive clayey soil.
TCEDm=0.0625(IWC)3−3.575(IWC)2+10.5(IWC)+2830+7100(C/0.1)+5050(G/0.2)+3010(KCl/0.1)+Ca(500)+Mg(300)+K(100) (6)
where TCEDm=modified TCED, C=Proportion of calcite weight relative to the total weight of the second swelling reduction agent incorporated expansive clayey soil×PECM, G=Proportion of gypsum weight relative to the total weight of the second swelling reduction agent incorporated expansive clayey soil×PECM, KCl=Proportion of potassium chloride weight relative to the total weight of the second swelling reduction agent incorporated expansive clayey soil×PECM, Ca=Proportion of the number of calcium exchangeable cation relative to the total number of exchangeable cations in the second swelling reduction agent incorporated expansive clayey soil, Mg=Proportion of the number of magnesium exchangeable cation relative to the total number of exchangeable cations in the second swelling reduction agent incorporated expansive clayey soil, K=Proportion of the number of potassium exchangeable cation relative to the total number of exchangeable cations in the second swelling reduction agent incorporated expansive clayey soil, IWC=initial water content, wherein the TCEDm of the second swelling reduction agent incorporated at least one expansive clay mineral results in S2i(ECM) calculated according to Equations (2), (3), and (5):
IDD={−2E-15(TCEDm)4+5E-11(TCEDm)3−5E-07(TCEDm)2+0.0023(TCEDm)−1.5378}*1.85*(ABS(CEC−90)/90) (2)
where IDD is initial dry density of the second swelling reduction agent incorporated at least one expansive clay mineral,
FDD=−2E-22(TCEDm)6+5E-18(TCEDm)5−6E-14(TCEDm)4+3E-10(TCEDm)3−7E-07(TCEDm)2+0.0005(TCEDm)+0.3747 (3)
where FDD is final dry density of the second swelling reduction agent incorporated at least one expansive clay mineral when the second swelling reduction agent incorporated at least one expansive clay mineral reaches the swell potential S2i(ECM),
S 1i(ECM)(%)=(FDD−IDD)/FDD*100 (5);
and wherein the further reduced swell potential of the second swelling reduction agent incorporated expansive clayey soil S2i(soil) equals S2i(ECM)×PECM, and (c) incorporating the second amount of the swelling reduction agent into the first swelling reduction agent incorporated expansive clayey soil to form the second swelling reduction agent incorporated expansive clayey soil.
- CEC: Cation Exchange Capacity
- CED: Cohesive Energy Density
- CT Computed Tomography
- EDS: Energy Dispersive Spectroscopy
- ESEM: Environmental Scanning Electron Microscope
- FTIR: Fourier Transform Infrared Spectroscopy
- LJ: Lennard Jones
- LL: Liquid Limit
- MC: Monte Carlo
- MD: Molecular Dynamics
- MM: Molecular Mechanics
- NPT: Constant Number of Particles, Pressure, and Temperature Ensemble
- PI: Plasticity Index
- PL: Plastic Limit
- OMC: Optimum Moisture Content
- XRD: X-Ray Diffraction
| TABLE 4 |
| Summary of index tests on the acquired samples and materials |
| Atterberg Limits | Specific Surface | CEC |
| Material | Designation | Source | Classification | LL | PL | PI | Area (m2/g) | (meq/100 g) |
| Na-Montmorillonite (SWy-1) | NaM | The Clay Mineral Society, US | CH | 312 | 36 | 576 | 31.82 | 76.4 |
| Ca-Montmorillonite (SAz-1) | CaM | The Clay Mineral Society, US | MH | 129 | 55 | 74 | 97.42 | 120.0 |
| Kaolinite (KGa-1) | K | The Clay Mineral Society, US | MH | 58 | 36 | 22 | 10.05 | 2.0 |
| Bentonite | B | Kanoo Est., KSA | CH | 480 | 44 | 436 | — | 54.8 |
| Qatif Clay - Source 1 | Q-1 | Qatif, KSA | CH | 155 | 53 | 102 | — | 51.0 |
| Qatif Clay - Source 2 | Q-2 | Qatif, KSA | CH | 69 | 29 | 40 | — | 20.7 |
| Hofuf Clay | H-1 | Hofuf, KSA | CH | 70 | 27 | 43 | — | 12.7 |
| Calcium Carbonite | Ca | Techno Pharmchem, India | — | — | — | — | — | — |
| Gypsum | G | Phosphate Plant, RIC, KSA | — | — | — | — | — | — |
| Sand | S | Jubail, KSA | SP | NP | NP | NP | — | — |
| CH: High Plastic CLAY | ||||||||
| MH: ELastic SILT | ||||||||
| SP: Poorly graded SAND | ||||||||
| NP: Noo Plastic | ||||||||
| RIC: Ras al-Khair Industrial City | ||||||||
| KSA Kingdom of Saudi Arabia | ||||||||
| Atterberg Limits methodology: ASTM D 4318 | ||||||||
| Specific Surface Area methodology: Brunauer, Emmell and Teller (BET) Method | ||||||||
| CEC methodology: Rayment and Higginson (1992) | ||||||||
| TABLE 5 |
| Exchangeable and total cations analysis of the Clay samples |
| CEC | Exhangeable Cations | Total Cations |
| Soil | Designation | (meq/100 g) | Type | meq/100 g | mg/kg | % of CEC | Type | mg/kg | % of Fixed Cations |
| Bentonite | B | 54.8 | Ca | 35.2 | 7054 | 64 | Ca | 16300 | 22 |
| Mg | 2.4 | 292 | 4 | Mg | 869 | 1 | |||
| K | 2.0 | 782 | 4 | K | 1200 | 1 | |||
| Na | 15.2 | 3496 | 28 | Na | 24300 | 49 | |||
| Qatif Clay - Source 1 | Q-1 | 51.0 | Ca | 25.0 | 5004 | 49 | Ca | 101000 | 68 |
| Mg | 17.0 | 2002 | 33 | Mg | 32400 | 22 | |||
| K | 7.0 | 2963 | 14 | K | 6280 | 2 | |||
| Na | 2.0 | 496 | 4 | Na | 840 | 0 | |||
| Qatif Clay - Source 2 | Q-2 | 20.7 | Ca | 10.0 | 2004 | 48 | Ca | 118000 | 54 |
| Mg | 7.0 | 851 | 34 | Mg | 89600 | 41 | |||
| K | 3.0 | 1173 | 14 | K | 6920 | 3 | |||
| Na | 0.7 | 161 | 3 | Na | 1540 | 1 | |||
| Hofuf Clay | H-1 | 12.7 | Ca | 7.2 | 1443 | 57 | Ca | 28000 | 54 |
| Mg | 4.1 | 510 | 32 | Mg | 8900 | 17 | |||
| K | 1.2 | 469 | 9 | K | 6880 | 13 | |||
| Na | 0.2 | 46 | 2 | Na | 5790 | 12 | |||
| Total Cations methodology: |
|||||||||
| TABLE 6 |
| Mineralogical analysis of Clay samples |
| Soil | Designation | Smectite | Kaolinite | Illite | Palygorskite | Quartz | Calcite | Dolomite | Gypsum |
| Na-Montmorillonite (SWy-1) | NaM | 97 | — | — | — | 3 | — | — | — |
| Ca-Montmorillonite (SAz-1) | CaM | 95 | — | — | — | 5 | — | — | — |
| Bentonite | B | 95 | — | — | — | 5 | — | — | — |
| Qatif Clay - Source 1 | Q-1 | 32 | — | 21 | 7 | 9 | 22 | — | 9 |
| Qatif Clay - Source 2 | Q-2 | 15 | — | 25 | 9 | 15 | — | 24 | 12 |
| Hofuf Clay | H-1 | — | 5 | 35 | 5 | 15 | 40 | — | — |
| TABLE 7 |
| Standard gradation for the Sand sample |
| ASTM Sieve No. | 10 | 20 | 40 | 60 | 100 | 200 | ||
| % passing | 100 | 92 | 58 | 35 | 19 | 2 | ||
| TABLE 8 |
| List of control samples with the details of the respective compositions |
| of various constituents |
| Moisture | ||||||||
| Sample | Content | |||||||
| No | State | NaM | CaM | Bentonite | Sand | Gypsum | Calcite | Kaolinite |
| 1 | Dry of OMC | — | — | 100 | — | — | — | — |
| 2 | Wet of OMC | — | — | 100 | — | — | — | — |
| 3 | Dry of OMC | — | — | 60 | 40 | — | — | — |
| 4 | Wet of OMC | — | — | 60 | 40 | — | — | — |
| 5 | Dry of OMC | — | — | 30 | 70 | — | — | — |
| 6 | Wet of OMC | — | — | 30 | 70 | — | — | — |
| 7 | Dry of OMC | — | — | 10 | 90 | — | — | — |
| 8 | Wet of OMC | — | — | 10 | 90 | — | — | — |
| 9 | Dry of OMC* | — | — | 30 | 70 | — | — | — |
| 10 | Dry of OMC* | — | — | 30 | 60 | 10 | — | — |
| 11 | Dry of OMC* | — | — | 30 | 40 | 30 | — | — |
| 12 | Dry of OMC* | — | — | 30 | 20 | 50 | — | — |
| 13 | Dry of OMC* | — | — | 30 | 40 | — | 30 | — |
| 14 | Dry of OMC* | — | — | 30 | 20 | — | 50 | — |
| 15 | Dry of OMC* | — | — | 30 | 40 | — | — | 30 |
| 16 | Dry of OMC* | — | — | — | — | — | — | 100 |
| 17 | Dry of OMC* | — | — | — | 40 | — | — | 60 |
| 18 | Dry of OMC* | — | — | — | 70 | — | — | 30 |
| 19 | Dry of OMC* | 100 | — | — | — | — | — | — |
| 20 | Dry of OMC* | 60 | — | — | 40 | — | — | — |
| 21 | Dry of OMC* | 30 | — | — | 70 | — | — | — |
| 22 | Dry of OMC* | — | 100 | — | — | — | — | |
| 23 | Dry of OMC* | — | 60 | — | 40 | — | — | — |
| 24 | Dry of OMC* | — | 30 | — | 70 | — | — | — |
| *Static Compaction | ||||||||
| TABLE 9 |
| Summary of swell potential test results |
| Initial | Initial | Final | Final | ||||||||||||
| Moisture | Dry | Wet | Dry | Wet | |||||||||||
| Sample | Content | Ben- | Density | IMC | Density | FMC | Density | Density | |||||||
| No | State | NaM | CaM | tonite | Sand | Gypsum | Calcite | Kaolinite | Swell (%) | (g/cm3) | (%) | (g/cm3) | (%) | (g/cm3) | (g/cm3) |
| 1 | Dry of OMC | — | — | 100 | — | — | — | — | 184 | 1.290 | 29.5 | 1.67 | 136.0 | 0.45 | 1.07 |
| 2 | Wet of OMC | — | — | 100 | — | — | — | — | 132 | 1.290 | 39.0 | 1.79 | 174.0 | 0.56 | 1.52 |
| 3 | Dry of OMC | — | — | 60 | 40 | — | — | — | 153 | 1.577 | 19.5 | 1.88 | 93.0 | 0.62 | 1.20 |
| 4 | Wet of OMC | — | — | 60 | 40 | — | — | — | 111 | 1.577 | 26.0 | 1.99 | 103.0 | 0.75 | 1.52 |
| 5 | Dry of OMC | — | — | 30 | 70 | — | — | — | 89 | 1.750 | 11.3 | 1.95 | 72.0 | 0.93 | 1.59 |
| 6 | Wet of OMC | — | — | 30 | 70 | — | — | — | 53 | 1.750 | 18.8 | 2.08 | 82.0 | 1.14 | 2.08 |
| 7 | Dry of OMC | — | — | 10 | 90 | — | — | — | 32 | 1.917 | 5.2 | 2.02 | 18.0 | 1.45 | 1.71 |
| 8 | Wet of OMC | — | — | 10 | 90 | — | — | — | 3 | 1.917 | 13.4 | 2.17 | 22.0 | 1.83 | 2.23 |
| 9 | Dry of OMC* | — | — | 30 | 70 | — | — | — | 121 | 1.750 | 12.0 | 1.96 | 108.0 | 0.79 | 1.65 |
| 10 | Dry of OMC* | — | — | 30 | 60 | 10 | — | — | 21 | 1.750 | 12.0 | 1.96 | 56.0 | 1.45 | 2.26 |
| 11 | Dry of OMC* | — | — | 30 | 40 | 30 | — | — | 11 | 1.750 | 12.0 | 1.96 | 27.0 | 1.58 | 2.00 |
| 12 | Dry of OMC* | — | — | 30 | 20 | 50 | — | — | 6 | 1.750 | 12.0 | 1.96 | 19.0 | 1.65 | 1.96 |
| 13 | Dry of OMC* | — | — | 30 | 40 | — | 30 | — | 74 | 1.750 | 12.0 | 1.96 | 80.0 | 1.01 | 1.81 |
| 14 | Dry of OMC* | — | — | 30 | 20 | — | 50 | — | 68 | 1.750 | 12.0 | 1.96 | 66.0 | 1.04 | 1.73 |
| 15 | Dry of OMC* | — | — | 30 | 40 | — | — | 30 | 95 | 1.750 | 12.0 | 1.96 | 115.0 | 0.90 | 1.93 |
| 16 | Dry of OMC* | — | — | — | — | — | — | 100 | 4 | 1.512 | 23.1 | 1.86 | 27.0 | 1.45 | 1.84 |
| 17 | Dry of OMC* | — | — | — | 40 | — | — | 60 | 3 | 1.828 | 13.3 | 2.07 | 16.0 | 1.77 | 2.06 |
| 18 | Dry of OMC* | — | — | — | 70 | — | — | 30 | 1 | 1.845 | 8.1 | 1.99 | 11.0 | 1.83 | 2.03 |
| 19 | Dry of OMC* | 100 | — | — | — | — | — | — | 96 | 1.436 | 3.8 | 1.49 | 87.0 | 0.73 | 1.37 |
| 20 | Dry of OMC* | 60 | — | — | 40 | — | — | — | 59 | 1.673 | 10.0 | 1.84 | 50.0 | 1.05 | 1.58 |
| 21 | Dry of OMC* | 30 | — | — | 70 | — | — | — | 25 | 1.889 | 8.0 | 2.04 | 25.0 | 1.51 | 1.89 |
| 22 | Dry of OMC* | — | 100 | — | — | — | — | 49 | 1.298 | 1.5 | 1.32 | 90.0 | 0.87 | 1.66 | |
| 23 | Dry of OMC* | — | 60 | — | 40 | — | — | — | 18 | 1.597 | 16.3 | 1.82 | 42.0 | 1.33 | 1.89 |
| 24 | Dry of OMC* | — | 30 | — | 70 | — | — | — | 9 | 1.591 | 11.5 | 1.77 | 33.7 | 1.46 | 1.95 |
| 25 | NMC | Qatif (Q-1) | 29 | 1.367 | 7.2 | 1.47 | 55.6 | 1.06 | 1.65 |
| 26 | NMC | Qatif (Q-2) | 8 | 1.557 | 5.2 | 1.61 | 40.0 | 1.44 | 2.02 |
| 27 | NMC | Hofuf (H-1) | 3 | 1.507 | 3.9 | 1.57 | 29.3 | 1.44 | 1.86 |
| *Static Compaciton | |||||||||
| NMC: Natural Moisture Content | |||||||||
| IMC: Initial Moisture Content | |||||||||
| FMC: Final Moisture Content | |||||||||
B2=BM2−BS2 3-1
D=0.9λ/(B cos θB) 3-2
| TABLE 10 |
| Summary of various variations and combinations used |
| in simulations for Na-montmorillonite |
| (Na as 100% exchangeable cation). |
| CEC | Desig- | Moisture | |
| (meq/100 g) | nation | Density conditions* | conditions |
| 54 | LCEC | Stress relieved at 1000 |
10, 20, 30, and 40% |
| 90 | MCEC | Stress relieved at 1000 |
10, 20, 30, and 40% |
| 144 | HCEC | Stress relieved at 1000 |
10, 20, 30, and 40% |
| *compacted at 1, 0.1, and 0.01 GPa | |||
| TABLE 11 |
| Simulation permutations of cementation agents for |
| MCEC Na-montmorillonite. |
| Cementation | Moisture | |||
| Agent | Percentage | Density conditions | | |
| Gypsum | Max | |||
| 20 | Stress relieved at 1000 kPa | 10 and 30% | ||
| (CaSO4•2H2O) | ||||
| | Max | 10 | Stress relieved at 1000 kPa | 10% |
| (CaCO3) | ||||
| | Max | 10 | Stress relieved at 1000 kPa | 10% |
| Chloride (KCl) | ||||
| TABLE 12 |
| Simulation permutations for various combinations of |
| exchangeable cations for LCEC montmorillonite. |
| Exchangeable Cations |
| Combinations | Na+ | K+ | Mg+2 | Ca−2 | |
| 1 | 40 | 60 | — | — | |
| 2 | 40 | — | 60 | — | |
| 3 | 40 | — | — | 60 | |
| 4 | 40 | 20 | 40 | — | |
| 5 | 40 | 20 | — | 40 | |
| 6 | 40 | 20 | 20 | 20 | |
| Original Universal Forcefield |
| Atom Types |
| Na | Na | 22.99000 | 0 | 0 | 0 | 0 | ! sodium |
| Mg3+2 | Mg | 24.31000 | 0 | 3 | 0 | 0 | ! magnesium, tetrahedral, +2 oxidation state |
| Al3 | Al | 26.98150 | 0 | 3 | 0 | 0 | ! aluminium, tetrahedral |
| Si3 | Si | 28.08600 | 0 | 3 | 0 | 0 | ! silicon, tetrahedral |
| K | K | 39.94800 | 0 | 0 | 0 | 0 | ! potassium |
| Ca6+2 | Ca | 40.08000 | 0 | 6 | 0 | 0 | ! calcium, octahedral, +2 oxidation state |
| Diagonal vdw |
| Na | LJ_6_12 | 2.9830 | 0.3000E−01 |
| Mg3+2 | LJ_6_12 | 3.0210 | 0.1110E+00 |
| Al3 | LJ_6_12 | 4.4990 | 0.5050E+00 |
| Si3 | LJ_6_12 | 4.2950 | 0.4020E+00 |
| K_ | LJ_6_12 | 3.8120 | 0.3500E−01 |
| Ca6+2 | LJ_6_12 | 3.3990 | 0.2380E+00 |
| Atom typing rules |
| Mg3+2 | |
0 | 0 | 0 | 1 | |
| | Al | 3 | 0 | 0 | 1 | |
| | Si | 3 | 0 | 0 | 1 |
| Generators |
| Na | 1.5390 | 180.0000 | 1.0809 | 0.0000 | 0.0000 | 0.0000 | 3 | −1 | 0.0000 | 2.84300 |
| |
1.4210 | 109.4712 | 1.7866 | 0.0000 | 0.0000 | 0.0000 | 3 | −1 | 0.0000 | 3.95100 |
| Al3 | 1.2440 | 109.4712 | 1.7924 | 0.0000 | 0.0000 | 0.0000 | 3 | −1 | 0.0000 | 3.04100 |
| Si3 | 1.1170 | 109.4712 | 2.3232 | 0.0000 | 0.0000 | 0.0000 | 3 | −1 | 1.2250 | 4.16800 |
| Modified Universal Forcefield |
| Atom Types |
| Na | Na | 22.99000 | 0.0000 | 0 | 0 | 0 | ! sodium |
| Mg6+2 | Mg | 24.31000 | 0.0000 | 6 | 0 | 0 | ! magnesium, octahedral, +2 oxidation state |
| Al6 | Al | 26.98150 | 0.0000 | 6 | 0 | 0 | ! aluminium, octahedral |
| Si3 | Si | 28.08600 | 0.0000 | 3 | 0 | 0 | ! silicon, tetrahedral |
| K_ | K | 39.94800 | 0.0000 | 0 | 0 | 0 | ! potassium |
| Ca6+2 | Ca | 40.08000 | 0.0000 | 6 | 0 | 0 | ! calcium, octahedral, +2 oxidation state |
| Diagonal vdw |
| Na | LJ_6_12 | 2.6378 | 0.1301E+00 |
| Mg6+2 | LJ_6_12 | 5.9090 | 0.9029E−06 |
| Al6 | LJ_6_12 | 4.7943 | 0.1329E−05 |
| Si3 | LJ_6_12 | 3.7064 | 0.1841E−05 |
| K_ | LJ_6_12 | 3.7423 | 0.1000E+00 |
| Ca6+2 | LJ_6_12 | 3.3990 | 0.2380E+00 |
| Atom typing rules |
| Mg6+2 | |
0 | 0 | 0 | 1 | |
| | Al | 3 | 0 | 0 | 1 | |
| | Si | 3 | 0 | 0 | 1 |
| Generators |
| Na | 1.5390 | 180.0000 | 1.0809 | 0.0000 | 0.0000 | 0.0000 | 3 | −1 | 0.0000 | 2.84300 |
| |
1.4210 | 109.4712 | 1.7866 | 0.0000 | 0.0000 | 0.0000 | 3 | −1 | 0.0000 | 3.95100 |
| Al6 | 1.2440 | 109.4712 | 1.7924 | 0.0000 | 0.0000 | 0.0000 | 3 | −1 | 0.0000 | 3.04100 |
| Si3 | 1.1170 | 109.4712 | 2.3232 | 0.0000 | 0.0000 | 0.0000 | 3 | −1 | 1.2250 | 4.16800 |
| TABLE 13 |
| Summary of well potential results for all the simulation cases |
| Maximum Density | Relaxed Density |
| van der | van der | ||||||||||
| Total | Waals | Total | Waals | ||||||||
| Initial | cohesive | cohesive | cohesive | cohesive | Final | Maximum | Relaxed | Terminal | |||
| water | energy | energy | energy | energy | water | Density | Density | Density | |||
| Case | content | density | density | density | density | content | (g/cm3) | (g/cm3) | (g/cm3) | Swell |
| no | Case | (%) | (J/cm3) | (J/cm3) | (J/cm3) | (J/cm3) | (%) | Wet | Dry | Wet | Dry | Wet | Dry | (%) |
| 1 | HCEC | Na100 | — | 10 | 6636 | −145 | 5890 | −98 | 68 | 2.432 | 2.221 | 2.132 | 1.938 | 0.571 | 0.340 | 470 |
| 2 | 20 | 5379 | −80 | 4500 | −33 | 87 | 2.112 | 1.760 | 1.762 | 1.468 | 0.617 | 0.330 | 345 | |||
| 3 | 30 | 4360 | −35 | 3250 | 2 | 105 | 1.831 | 1.408 | 1.382 | 1.063 | 0.656 | 0.320 | 232 | |||
| 4 | 40 | 3988 | −11 | 2945 | 20 | 110 | 1.731 | 1.236 | 1.309 | 0.935 | 0.651 | 0.310 | 202 | |||
| 5 | MCEC | Na100 | — | 10 | 3213 | −102 | 2640 | −62 | 77 | 2.359 | 2.145 | 1.903 | 1.730 | 0.602 | 0.340 | 409 |
| 6 | 20 | 2750 | −50 | 2110 | −18 | 95 | 2.226 | 1.855 | 1.600 | 1.333 | 0.663 | 0.340 | 292 | |||
| 7 | 30 | 2206 | 5 | 1615 | 28 | 140 | 1.683 | 1.295 | 1.260 | 0.969 | 0.792 | 0.330 | 194 | |||
| 8 | 40 | 2212 | 5 | 1530 | 39 | 150 | 1.686 | 1.204 | 1.204 | 0.860 | 0.800 | 0.320 | 169 | |||
| 9 | LCEC | Na100 | — | 10 | 1828 | −77 | 1612 | −49 | 74 | 2.441 | 2.219 | 2.073 | 1.885 | 0.592 | 0.340 | 454 |
| 10 | 20 | 1634 | −15 | 1333 | −1 | 105 | 1.967 | 1.639 | 1.677 | 1.398 | 0.697 | 0.340 | 311 | |||
| 11 | 30 | 1650 | −13 | 1180 | 45 | 115 | 2.000 | 1.538 | 1.444 | 1.111 | 0.710 | 0.330 | 237 | |||
| 12 | 40 | 1386 | −10 | 1130 | 59 | 140 | 1.700 | 1.214 | 1.290 | 0.921 | 0.768 | 0.320 | 118 | |||
| 13 | MCEC | Na100 | G20 | 10 | 8385 | −305 | 7336 | −224 | 33 | 2.510 | 2.282 | 2.195 | 1.995 | 1.820 | 1.368 | 49 |
| 14 | MCEC | Na100 | C10 | 10 | 10507 | −497 | 9476 | −125 | 26 | 2.636 | 2.396 | 2.367 | 2.152 | 2.050 | 1.630 | 32 |
| 15 | MCEC | Na100 | G20 | 20 | 7200 | −245 | 6437 | −162 | 39 | 2.218 | 1.848 | 1.955 | 1.629 | 1.700 | 1.223 | 33 |
| 16 | HCEC | Na100 | G20 | 10 | 11808 | −348 | 10586 | −260 | 29 | 2.588 | 2.352 | 2.459 | 2.236 | 1.727 | 1.368 | 53 |
| 17 | LCEC | Na100 | G20 | 10 | 7000 | −280 | 6308 | −211 | 32 | 2.597 | 2.361 | 2.391 | 2.174 | 1.789 | 1.368 | 51 |
| 18 | LCEC | Ca60Na40 | G20 | 12 | 3909 | −151 | 3363 | −105 | 60 | 2.294 | 2.048 | 1.947 | 1.738 | 2.168 | 1.355 | 28 |
| 19 | MCEC | Na100 | KCl10 | 10 | 6210 | −125 | 5450 | −79 | 29 | 2.225 | 2.023 | 1.923 | 1.748 | 1.790 | 1.355 | 20 |
| 20 | MCEC | Ca60Na40 | — | 10 | 3593 | −118 | 3138 | −87 | 80 | 2.422 | 2.202 | 2.075 | 1.886 | 0.915 | 0.610 | 209 |
| 21 | MCEC | K60Na40 | — | 10 | 3246 | −100 | 2748 | −64 | 40 | 2.454 | 2.231 | 2.037 | 1.852 | 0.574 | 0.410 | 352 |
| 22 | MCEC | Mg60Na40 | — | 10 | 3750 | −164 | 2930 | −121 | 55 | 2.408 | 2.189 | 1.815 | 1.650 | 0.791 | 0.510 | 224 |
| 23 | HCEC | Ca50Na40 | — | 10 | 7016 | −161 | 6288 | −123 | 44 | 2.497 | 2.70 | 2.325 | 2.113 | 0.868 | 0.610 | 240 |
| 24 | LCEC | Ca50Na40 | — | 30 | 1791 | −31 | 1320 | −4 | 113 | 1.969 | 1.515 | 1.480 | 1.138 | 0.843 | 0.396 | 187 |
| 25 | LCEC | Ca50Na40 | — | 40 | 1658 | −7 | 1207 | 18 | 138 | 1.798 | 1.284 | 1.343 | 0.959 | 0.935 | 0.393 | 144 |
| Na: Sodium | ||||||||||||||||
| Ca: Calcium | ||||||||||||||||
| K: Potassium | ||||||||||||||||
| Mg: Magnesium | ||||||||||||||||
| G: Gypsum | ||||||||||||||||
| C: Calcite | ||||||||||||||||
| KCl: Potassium Chloride | ||||||||||||||||
d v=(slope for straight line or hyperbolic for curved plots)d wc 4-1
TCED=0.0625(IWC)3−3.575(IWC)2+10.5(IWC)+2830 4-2
TCEDm=0.0625(IWC)3−3.575(IWC)2+10.5(IWC)+2830+7100(C/0.1)+5050(G/0.2)+3010(KCl/0.1)+Ca(500)+Mg(300)+K(100) 4-3
IDD={−2E-15(TCED)4+5E-11(TCED)3−5E-07(TCED)2+0.0023(TCED)−1.5378}*1.85*(ABS(CEC−90)/90) 4-4
FDD=−2E-22(TCED)6+5E-18(TCED)5−6E-14(TCED)4+3E-10(TCED)3−7E-07(TCED)2+0.0005(TCED)+0.3747 4-5
FWC=(1E-13(TCED)4−4E-09(TCED)3+4E-05(TCED)2−0.2037TCED+369.54)*ABS(CEC2−90)/CEC2*0.82 4-6
Swell (%)=(FDD−IDD)/FDD*100 4-7
| TABLE 14 |
| Summary of comparison of swell potential tests results in the current study and nano/molecular model predictions |
| Nano Model | ||||||||||
| Swell Test | Prediction |
| Mois- | Initial | Initial | Final | Final | Final | |||||||||||||
| ture | Dry | Wet | Dry | Wet | Dry | |||||||||||||
| Sam- | Con- | Den- | Den- | Den- | Den- | Den- | ||||||||||||
| ple | tent | Ben- | Gyp- | Cal- | Kao- | Swell | sity | IMC | sity | FMC | sity | sity | Swell | sity | FMC | |||
| No | State | NaM | CaM | tonite | Sand | sum | cite | linite | (%) | (g/cm3) | (%) | (g/cm3) | (%) | (g/cm3) | (g/cm3) | (%) | (g/cm3) | (%) |
| 1 | Dry of | — | — | 100 | — | — | — | — | 184 | 1.290 | 29.5 | 1.67 | 136.0 | 0.45 | 1.07 | 187 | 0.396 | 113 |
| OMC | ||||||||||||||||||
| 2 | Wet of | — | — | 100 | — | — | — | — | 132 | 1.290 | 39.0 | 1.79 | 174.0 | 0.56 | 1.52 | 144 | 0.393 | 138 |
| OMC | ||||||||||||||||||
| 3 | Dry of | — | — | 60 | 40 | — | — | — | 153 | 1.577 | 19.5 | 1.88 | 93.0 | 0.62 | 1.20 | 155 | — | — |
| OMC | ||||||||||||||||||
| 4 | Wet of | — | — | 60 | 40 | — | — | — | 111 | 1.577 | 26.0 | 1.99 | 103.0 | 0.75 | 1.52 | 121 | — | — |
| OMC | ||||||||||||||||||
| 5 | Dry of | — | — | 30 | 70 | — | — | — | 89 | 1.750 | 11.3 | 1.95 | 72.0 | 0.93 | 1.59 | 90 | — | — |
| OMC | ||||||||||||||||||
| 6 | Wet of | — | — | 30 | 70 | — | — | — | 53 | 1.750 | 18.8 | 2.08 | 82.0 | 1.14 | 2.08 | 58 | — | — |
| OMC | ||||||||||||||||||
| 7 | Dry of | — | — | 10 | 90 | — | — | — | 32 | 1.917 | 5.2 | 2.02 | 18.0 | 1.45 | 1.71 | 33 | — | — |
| OMC | ||||||||||||||||||
| 8 | Wet of | — | — | 10 | 90 | — | — | — | 3 | 1.917 | 13.4 | 2.17 | 22.0 | 1.83 | 2.23 | 5 | — | — |
| OMC | ||||||||||||||||||
| 10 | Dry of | — | — | 30 | 60 | 10 | — | — | 21 | 1.750 | 12.0 | 1.96 | 56.0 | 1.45 | 2.26 | 28 | 1.355 | 60 |
| OMC* | ||||||||||||||||||
| 11 | Dry of | — | — | 30 | 40 | 30 | — | — | 11 | 1.750 | 12.0 | 1.96 | 27.0 | 1.58 | 2.00 | 9 | — | — |
| OMC* | ||||||||||||||||||
| 12 | Dry of | — | — | 30 | 20 | 50 | — | — | 6 | 1.750 | 12.0 | 1.96 | 19.0 | 1.65 | 1.96 | 6 | — | — |
| OMC* | ||||||||||||||||||
| 13 | Dry of | — | — | 30 | 40 | — | 30 | — | 74 | 1.750 | 12.0 | 1.96 | 80.0 | 1.01 | 1.81 | 32 | 1.63 | 26 |
| OMC* | ||||||||||||||||||
| 14 | Dry of | — | — | 30 | 20 | — | 50 | — | 68 | 1.750 | 12.0 | 1.96 | 66.0 | 1.04 | 1.73 | 29 | — | — |
| OMC* |
| 25 | NMC | Qatif (Q-1) | 29 | 1.367 | 7.2 | 1.47 | 55.6 | 1.06 | 1.65 | 28 | 1.355 | 60 |
| *Static Compaciton | ||||||||||||
| NMC: Natural Moisture Content | ||||||||||||
| IMC: Initial Moisture Content | ||||||||||||
| FMC: Final Moisture Content | ||||||||||||
| TABLE 15 |
| Summary of comparison of swell potential tests results from Hameed (1991) and nano/molecular model predictions |
| Non-swell | Non-swell | |||||||
| cementitious | cementitious | Swell (%) | Swell (%) | |||||
| Sample | BH/TP | Depth | Smectite | minerals | associated | from Swell | from Nano | |
| No. | Location | No. | (m) | (%) | (%) | (%) | tests* | Model** |
| 1 | Al-Klars, Al-Hasa | BH-9 | 2.5-2.7 | 7 | 50 | 3.5 | 2.2 | 4.7 |
| 2 | Mahasen-Aramco Al-Hasa | BH-13 | 2.0-2.25 | 4 | 34 | 1.4 | 6.28 | 10.3 |
| 3 | Al-Hamadiya | BH-11 | 1.0-1.3 | 8 | 35 | 2.8 | 7.16 | 11.0 |
| 4 | Al-Salehiya | BH-12 | 2.4-2.7 | 6 | 64 | 3.8 | 4.84 | 3.9 |
| 5 | Al-Khars, Al-Hasa | TP-7 | 1.1 | 6 | 39 | 2.3 | 8.4 | 8.4 |
| 6 | Al-Naathel, Al-Hasa | TP-11 | 2.0-2.2 | 6 | 27 | 1.6 | 16.38 | 18.0 |
| 7 | Mahasen-Arainco, Al-Hasa | TP-11 | 2.0-2.2 | 4 | 32 | 1.3 | 13.11 | 14.2 |
| 8 | Housing Area | BH-1 | 3.8 | 30 | 40 | 12.0 | 29 | 24.5 |
| 9 | Housing Area | BH-3 | 1.8-2.1 | 13 | 48 | 6.2 | 4.06 | 4.6 |
| 10 | Umm Al-Sahek | BH-6 | 0.45-0.6 | 25 | 32 | 8.0 | 14.35 | 13.0 |
| 11 | Umm Al-Hameed | BH-8 | 5.6-5.75 | 39 | 39 | 15.2 | 12.88 | 13.9 |
| *Hameed (1991) | ||||||||
| **Current Study | ||||||||
Claims (20)
TCEDm=0.0625(IWC)3−3.575(IWC)2+10.5(IWC)+2830+7100(C/0.1)+5050(G/0.2)+3010(KCl/0.1)+Ca(500)+Mg(300)+K(100) (6)
IDD={−2E-15(TCEDm)4+5E-11(TCEDm)3−5E-07(TCEDm)2+0.0023(TCEDm)−1.5378}*1.85*(ABS(CEC−90)/90) (2)
FDD=−2E-22(TCEDm)6+5E-18(TCEDm)5−6E-14(TCEDm)4+3E-10(TCEDm)3−7E-07(TCEDm)2+0.0005(TCEDm)+0.3747 (3)
S 1i(ECM)(%)=(FDD−IDD)/FDD*100 (5); and
TCEDm=0.0625(IWC)3−3.575(IWC)2+10.5(IWC)+2830+7100(C/0.1)+5050(G/0.2)+3010(KCl/0.1)+Ca(500)+Mg(300)+K(100) (6)
IDD={−2E-15(TCEDm)4+5E-11(TCEDm)3−5E-07(TCEDm)2+0.0023(TCEDm)−1.5378}*1.85*(ABS(CEC−90)/90) (2)
FDD=−2E-22(TCEDm)6+5E-18(TCEDm)5−6E-14(TCEDm)4+3E-10(TCEDm)3−7E-07(TCEDm)2+0.0005(TCEDm)+0.3747 (3)
S 1i(ECM)(%)=(FDD−IDD)/FDD*100 (5), and
TCEDm=0.0625(IWC)3−3.575(IWC)2+10.5(IWC)+2830+7100(C/0.1)+5050(G/0.2)+3010(KCl/0.1)+Ca(500)+Mg(300)+K(100) (6)
IDD={−2E-15(TCEDm)4+5E-11(TCEDm)3−5E-07(TCEDm)2+0.0023(TCEDm)−1.5378}*1.85*(ABS(CEC−90)/90) (2)
FDD=−2E-22(TCEDm)6+5E-18(TCEDm)5−6E-14(TCEDm)4+3E-10(TCEDm)3−7E-07(TCEDm)2+0.0005(TCEDm)+0.3747 (3)
S 1i(ECM)(%)=(FDD−IDD)/FDD*100 (5); and
TCEDm=0.0625(IWC)3−3.575(IWC)2+10.5(IWC)+2830+7100(C/0.1)+5050(G/0.2)+3010(KCl/0.1)+Ca(500)+Mg(300)+K(100) (6)
IDD={−2E-15(TCEDm)4+5E-11(TCEDm)3−5E-07(TCEDm)2+0.0023(TCEDm)−1.5378}*1.85*(ABS(CEC−90)/90) (2)
FDD=−2E-22(TCEDm)6+5E-18(TCEDm)5−6E-14(TCEDm)4+3E-10(TCEDm)3−7E-07(TCEDm)2+0.0005(TCEDm)+0.3747 (3)
S 1i(ECM)(%)=(FDD−IDD)/FDD*100 (5); and
TCEDm=0.0625(IWC)3−3.575(IWC)2+10.5(IWC)+2830+7100(C/0.1)+5050(G/0.2)+3010(KCl/0.1)+Ca(500)+Mg(300)+K(100) (6)
FWC={1E-13(TCEDm)4−4E-09(TCEDm)3+4E-05(TCEDm)2−0.2037TCEDm+369.54}*ABS(CEC2−90)/CEC2*0.82 (4).
TCEDm=0.0625(IWC)3−3.575(IWC)2+10.5(IWC)+2830+7100(C/0.1)+5050(G/0.2)+3010(KCl/0.1)+Ca(500)+Mg(300)+K(100) (6)
IDD={−2E-15(TCEDm)4+5E-11(TCEDm)3−5E-07(TCEDm)2+0.0023(TCEDm)−1.5378}*1.85*(ABS(CEC−90)/90) (2)
FDD=−2E-22(TCEDm)6+5E-18(TCEDm)5−6E-14(TCEDm)4+3E-10(TCEDm)3−7E-07(TCEDm)2+0.0005(TCEDm)+0.3747 (3)
S 1i(ECM)(%)=(FDD−IDD)/FDD*100 (5); and
Priority Applications (3)
| Application Number | Priority Date | Filing Date | Title |
|---|---|---|---|
| US15/134,474 US9670409B1 (en) | 2015-12-23 | 2016-04-21 | Method for reducing swell potential of expansive clayey soil with nano-level constitutive modeling |
| US15/487,153 US10040996B2 (en) | 2015-12-23 | 2017-04-13 | Clay soil site preparation for building structures |
| US15/939,658 US10294622B2 (en) | 2015-12-23 | 2018-03-29 | Subgrade irrigation for site preparation having clayey expansive soil |
Applications Claiming Priority (2)
| Application Number | Priority Date | Filing Date | Title |
|---|---|---|---|
| US201562387166P | 2015-12-23 | 2015-12-23 | |
| US15/134,474 US9670409B1 (en) | 2015-12-23 | 2016-04-21 | Method for reducing swell potential of expansive clayey soil with nano-level constitutive modeling |
Related Child Applications (1)
| Application Number | Title | Priority Date | Filing Date |
|---|---|---|---|
| US15/487,153 Continuation US10040996B2 (en) | 2015-12-23 | 2017-04-13 | Clay soil site preparation for building structures |
Publications (2)
| Publication Number | Publication Date |
|---|---|
| US9670409B1 true US9670409B1 (en) | 2017-06-06 |
| US20170183568A1 US20170183568A1 (en) | 2017-06-29 |
Family
ID=58778702
Family Applications (7)
| Application Number | Title | Priority Date | Filing Date |
|---|---|---|---|
| US15/134,474 Expired - Fee Related US9670409B1 (en) | 2015-12-23 | 2016-04-21 | Method for reducing swell potential of expansive clayey soil with nano-level constitutive modeling |
| US15/177,872 Expired - Fee Related US10024016B2 (en) | 2015-12-23 | 2016-06-09 | Method for reducing swell potential of expansive clay mineral and expansive clayey soil with molecular level simulation |
| US15/487,153 Expired - Fee Related US10040996B2 (en) | 2015-12-23 | 2017-04-13 | Clay soil site preparation for building structures |
| US15/933,060 Expired - Fee Related US10094086B2 (en) | 2015-12-23 | 2018-03-22 | Method for modifying clay soils with gypsum |
| US15/939,658 Expired - Fee Related US10294622B2 (en) | 2015-12-23 | 2018-03-29 | Subgrade irrigation for site preparation having clayey expansive soil |
| US16/007,573 Expired - Fee Related US10174251B2 (en) | 2015-12-23 | 2018-06-13 | Exchangeable cation (Mg) swell potential reduction method |
| US16/007,478 Expired - Fee Related US10150915B1 (en) | 2015-12-23 | 2018-06-13 | Clay soil modification with Ca2+ exchangeable cation |
Family Applications After (6)
| Application Number | Title | Priority Date | Filing Date |
|---|---|---|---|
| US15/177,872 Expired - Fee Related US10024016B2 (en) | 2015-12-23 | 2016-06-09 | Method for reducing swell potential of expansive clay mineral and expansive clayey soil with molecular level simulation |
| US15/487,153 Expired - Fee Related US10040996B2 (en) | 2015-12-23 | 2017-04-13 | Clay soil site preparation for building structures |
| US15/933,060 Expired - Fee Related US10094086B2 (en) | 2015-12-23 | 2018-03-22 | Method for modifying clay soils with gypsum |
| US15/939,658 Expired - Fee Related US10294622B2 (en) | 2015-12-23 | 2018-03-29 | Subgrade irrigation for site preparation having clayey expansive soil |
| US16/007,573 Expired - Fee Related US10174251B2 (en) | 2015-12-23 | 2018-06-13 | Exchangeable cation (Mg) swell potential reduction method |
| US16/007,478 Expired - Fee Related US10150915B1 (en) | 2015-12-23 | 2018-06-13 | Clay soil modification with Ca2+ exchangeable cation |
Country Status (1)
| Country | Link |
|---|---|
| US (7) | US9670409B1 (en) |
Cited By (9)
| Publication number | Priority date | Publication date | Assignee | Title |
|---|---|---|---|---|
| US10024016B2 (en) * | 2015-12-23 | 2018-07-17 | King Fahd University Of Petroleum And Minerals | Method for reducing swell potential of expansive clay mineral and expansive clayey soil with molecular level simulation |
| CN111044366A (en) * | 2019-12-30 | 2020-04-21 | 华北水利水电大学 | Test device for real-time measurement of tensile stress and crack in unsaturated soil in full-suction range |
| CN111250037A (en) * | 2020-01-19 | 2020-06-09 | 招商局生态环保科技有限公司 | Preparation method of bentonite for soil remediation |
| CN111672457A (en) * | 2020-06-17 | 2020-09-18 | 中国计量大学 | Molecular dynamics simulation and water treatment based modified montmorillonite adsorption performance prediction method |
| CN113123185A (en) * | 2021-04-15 | 2021-07-16 | 安徽省城建基础工程有限公司 | Toughness inflation dirt road bed structure based on nanometer silica and carbon fiber |
| CN113295563A (en) * | 2021-05-27 | 2021-08-24 | 水利部交通运输部国家能源局南京水利科学研究院 | Method for treating cold region expansive soil channel based on phase change material temperature control composite |
| CN113722929A (en) * | 2021-09-09 | 2021-11-30 | 四川省建筑科学研究院有限公司 | Calculation method for shear strength of unsaturated expansive soil |
| CN114396038A (en) * | 2022-01-21 | 2022-04-26 | 中煤航测遥感集团有限公司 | Method for reinforcing soil strength by using microorganism induced calcium carbonate deposition |
| CN114737557A (en) * | 2022-02-18 | 2022-07-12 | 长江水利委员会长江科学院 | Microbial ecological modification method of expansive soil |
Families Citing this family (8)
| Publication number | Priority date | Publication date | Assignee | Title |
|---|---|---|---|---|
| WO2018085340A1 (en) * | 2016-11-01 | 2018-05-11 | University Of Florida Research Foundation, Inc. | Bioinspired mineralization for geotechnical substructures |
| US11475310B1 (en) * | 2016-11-29 | 2022-10-18 | Perceive Corporation | Training network to minimize worst-case error |
| CN107891057A (en) * | 2017-11-15 | 2018-04-10 | 江苏隆昌化工有限公司 | A kind of method that ecological park is built in heavy metal pollution place |
| EP3914666A4 (en) * | 2019-01-25 | 2023-03-01 | Hayward Baker, Inc. | Method of reducing the swelling capacity of clay-containing soil |
| CN109912265A (en) * | 2019-02-13 | 2019-06-21 | 君子津环境技术(北京)有限公司 | A kind of desert soil remodeling method |
| CN110904949B (en) * | 2019-11-01 | 2021-04-06 | 重庆大学 | Method for reinforcing sand gravel foundation by bentonite-assisted microorganisms |
| CN113122336B (en) * | 2019-12-31 | 2022-03-08 | 中国石油化工股份有限公司 | Method and system for preparing hydrogen by thermal conversion of biomass |
| CN113123353A (en) * | 2021-04-16 | 2021-07-16 | 合肥工业大学 | Method for solidifying redbed slope surface soil by microbial preparation |
Citations (7)
| Publication number | Priority date | Publication date | Assignee | Title |
|---|---|---|---|---|
| US3980490A (en) * | 1972-12-29 | 1976-09-14 | Schneider Gordon L | Soil stabilizing agent comprising a sulfuric acid source-calcium source reaction product and method |
| US5122012A (en) * | 1991-02-05 | 1992-06-16 | Chemical Lime Company | Method for improving the characteristics of sulfate bearing soils |
| US5228808A (en) * | 1991-11-27 | 1993-07-20 | Chemical Lime Company | Method for preventing the adverse effects of swell in sulfate bearing, expansive clay soils |
| US5336022A (en) * | 1991-11-27 | 1994-08-09 | Chemical Lime Company | Method for producing enhanced soil stabilization reactions between lime and clay soils due to the effect of silica addition |
| US20040195182A1 (en) * | 2002-06-18 | 2004-10-07 | Curtis Elliott | Compositions and methods for adsorption and retention of solvated compounds and ions |
| JP2014085177A (en) | 2012-10-22 | 2014-05-12 | Shimizu Corp | Method for performing measurement test of water-absorptive expansion characteristics |
| US20160289559A1 (en) * | 2015-04-03 | 2016-10-06 | Hppe Llc | Compositions and Methods for the Stabilization of Clay Containing Soils |
Family Cites Families (4)
| Publication number | Priority date | Publication date | Assignee | Title |
|---|---|---|---|---|
| US4655076A (en) * | 1984-01-23 | 1987-04-07 | Raychem Corporation | Moisture measuring apparatus |
| WO2003070657A1 (en) | 2002-02-21 | 2003-08-28 | Tioxide Group Services Limited | Red gypsum in civil engineering applications |
| JP2005529158A (en) * | 2002-05-28 | 2005-09-29 | ザ・トラスティーズ・オブ・ザ・ユニバーシティ・オブ・ペンシルベニア | Method, system and computer program product for computer analysis and design of amphiphilic polymers |
| US9670409B1 (en) * | 2015-12-23 | 2017-06-06 | King Fahd University Of Petroleum And Minerals | Method for reducing swell potential of expansive clayey soil with nano-level constitutive modeling |
-
2016
- 2016-04-21 US US15/134,474 patent/US9670409B1/en not_active Expired - Fee Related
- 2016-06-09 US US15/177,872 patent/US10024016B2/en not_active Expired - Fee Related
-
2017
- 2017-04-13 US US15/487,153 patent/US10040996B2/en not_active Expired - Fee Related
-
2018
- 2018-03-22 US US15/933,060 patent/US10094086B2/en not_active Expired - Fee Related
- 2018-03-29 US US15/939,658 patent/US10294622B2/en not_active Expired - Fee Related
- 2018-06-13 US US16/007,573 patent/US10174251B2/en not_active Expired - Fee Related
- 2018-06-13 US US16/007,478 patent/US10150915B1/en not_active Expired - Fee Related
Patent Citations (7)
| Publication number | Priority date | Publication date | Assignee | Title |
|---|---|---|---|---|
| US3980490A (en) * | 1972-12-29 | 1976-09-14 | Schneider Gordon L | Soil stabilizing agent comprising a sulfuric acid source-calcium source reaction product and method |
| US5122012A (en) * | 1991-02-05 | 1992-06-16 | Chemical Lime Company | Method for improving the characteristics of sulfate bearing soils |
| US5228808A (en) * | 1991-11-27 | 1993-07-20 | Chemical Lime Company | Method for preventing the adverse effects of swell in sulfate bearing, expansive clay soils |
| US5336022A (en) * | 1991-11-27 | 1994-08-09 | Chemical Lime Company | Method for producing enhanced soil stabilization reactions between lime and clay soils due to the effect of silica addition |
| US20040195182A1 (en) * | 2002-06-18 | 2004-10-07 | Curtis Elliott | Compositions and methods for adsorption and retention of solvated compounds and ions |
| JP2014085177A (en) | 2012-10-22 | 2014-05-12 | Shimizu Corp | Method for performing measurement test of water-absorptive expansion characteristics |
| US20160289559A1 (en) * | 2015-04-03 | 2016-10-06 | Hppe Llc | Compositions and Methods for the Stabilization of Clay Containing Soils |
Non-Patent Citations (9)
| Title |
|---|
| E. E. Alonso, et al., "A constitutive model for partially saturated soils", Geotechnique, vol. 40, No. 3, (1990), pp. 405-430. |
| E. E. Alonso, et al., "Groundwater Effects in Geotechnical Engineering,General Report", Proceedings 9th European Conference on Soil Mechanics and Foundation Engineering, vol. 3, (1987), pp. 1087-1146. |
| E. E. Alonso, et al., "Modeling the mechanical behavior of expansive Clays", Engineering Geology, vol. 54, (1999), pp. 173-183. |
| E.S. Boek et al., "Monte Carlo Molecular Modeling Studies of Hydrated Li-, Na-, and K-Smectites: Understanding the Role of Potassium as a Clay Swelling Inhibitor", http://pubs.acs.org/doi/abs/10.1021/ja00155a025, Dec. 1995, pp. 12608-12617. |
| L. Guimarães, et al., "A chemo-mechanical constitutive model accounting for cation exchange in expansive clays", Geotechnique, vol. 63, No. 3, (2013), pp. 221-234. |
| M. Sanchez, et al., "A double structure generalized plasticity model for expansive materials", International Journal for Numerical and Analytical Methods in Geomechanics, vol. 29, Issue 8, (2005), pp. 751-787. |
| P. Mignon et al., "Ab initio molecular dynamics study of the hydration of Li+, Na+ and K+ in a montmorillonite model. Influence of isomorphic substitution", http://pubs.rsc.org/en/Content/ArticleLanding/2010/CP/b915689e#!divAbstract, 2010, pp. 688-697. |
| R. J. Arnott, "Particle sizes of clay minerals by small-angle x-ray scattering", The American Mineralogist, vol. 50, (1965), pp. 1563-1575. |
| W. Sun, et al., "Coupled modeling of hydro-mechanical behavior of unsaturated compacted expansive soils", International Journal of Numerical and Analytical Methods in Geomechanics, vol. 36, No. 8, (2011), pp. 1002-1022. |
Cited By (17)
| Publication number | Priority date | Publication date | Assignee | Title |
|---|---|---|---|---|
| US10040996B2 (en) * | 2015-12-23 | 2018-08-07 | King Fahd University Of Petroleum And Minerals | Clay soil site preparation for building structures |
| US10094086B2 (en) | 2015-12-23 | 2018-10-09 | King Fahd University Of Petroleum And Minerals | Method for modifying clay soils with gypsum |
| US10150915B1 (en) | 2015-12-23 | 2018-12-11 | King Fahd University Of Petroleum And Minerals | Clay soil modification with Ca2+ exchangeable cation |
| US10174251B2 (en) | 2015-12-23 | 2019-01-08 | King Fahd University Of Petroleum And Minerals | Exchangeable cation (Mg) swell potential reduction method |
| US10294622B2 (en) * | 2015-12-23 | 2019-05-21 | King Fahd University Of Petroleum And Minerals | Subgrade irrigation for site preparation having clayey expansive soil |
| US10024016B2 (en) * | 2015-12-23 | 2018-07-17 | King Fahd University Of Petroleum And Minerals | Method for reducing swell potential of expansive clay mineral and expansive clayey soil with molecular level simulation |
| CN111044366B (en) * | 2019-12-30 | 2022-06-07 | 华北水利水电大学 | Test device for real-time measurement of tensile stress and crack in unsaturated soil in full-suction range |
| CN111044366A (en) * | 2019-12-30 | 2020-04-21 | 华北水利水电大学 | Test device for real-time measurement of tensile stress and crack in unsaturated soil in full-suction range |
| CN111250037A (en) * | 2020-01-19 | 2020-06-09 | 招商局生态环保科技有限公司 | Preparation method of bentonite for soil remediation |
| CN111672457A (en) * | 2020-06-17 | 2020-09-18 | 中国计量大学 | Molecular dynamics simulation and water treatment based modified montmorillonite adsorption performance prediction method |
| CN113123185A (en) * | 2021-04-15 | 2021-07-16 | 安徽省城建基础工程有限公司 | Toughness inflation dirt road bed structure based on nanometer silica and carbon fiber |
| CN113295563A (en) * | 2021-05-27 | 2021-08-24 | 水利部交通运输部国家能源局南京水利科学研究院 | Method for treating cold region expansive soil channel based on phase change material temperature control composite |
| CN113722929A (en) * | 2021-09-09 | 2021-11-30 | 四川省建筑科学研究院有限公司 | Calculation method for shear strength of unsaturated expansive soil |
| CN113722929B (en) * | 2021-09-09 | 2024-04-05 | 四川省建筑科学研究院有限公司 | Calculation method of shear strength of unsaturated expansive soil |
| CN114396038A (en) * | 2022-01-21 | 2022-04-26 | 中煤航测遥感集团有限公司 | Method for reinforcing soil strength by using microorganism induced calcium carbonate deposition |
| CN114737557A (en) * | 2022-02-18 | 2022-07-12 | 长江水利委员会长江科学院 | Microbial ecological modification method of expansive soil |
| CN114737557B (en) * | 2022-02-18 | 2023-08-25 | 长江水利委员会长江科学院 | Microbial ecological modification method of expansive soil |
Also Published As
| Publication number | Publication date |
|---|---|
| US20180355247A1 (en) | 2018-12-13 |
| US20170260450A1 (en) | 2017-09-14 |
| US10040996B2 (en) | 2018-08-07 |
| US20180209112A1 (en) | 2018-07-26 |
| US10294622B2 (en) | 2019-05-21 |
| US20170183836A1 (en) | 2017-06-29 |
| US20170183568A1 (en) | 2017-06-29 |
| US20180265783A1 (en) | 2018-09-20 |
| US10150915B1 (en) | 2018-12-11 |
| US10174251B2 (en) | 2019-01-08 |
| US20180346812A1 (en) | 2018-12-06 |
| US10024016B2 (en) | 2018-07-17 |
| US10094086B2 (en) | 2018-10-09 |
Similar Documents
| Publication | Publication Date | Title |
|---|---|---|
| US10294622B2 (en) | Subgrade irrigation for site preparation having clayey expansive soil | |
| Wen et al. | Influence of structure on shear characteristics of the unsaturated loess in Lanzhou, China | |
| Pusch | The microstructure of MX-80 clay with respect to its bulk physical properties under different environmental conditions | |
| Ouhadi et al. | Ettringite formation and behaviour in clayey soils | |
| Gratchev et al. | Compressibility of soils containing kaolinite in acidic environments | |
| Sasanian | The behaviour of cement stabilized clay at high water contents | |
| Langroudi et al. | Collapsibility in calcareous clayey loess: a factor of stress-hydraulic history | |
| Assadi Langroudi | Micromechanics of collapse in loess | |
| Jamsawang et al. | The free swell potential of expansive clays stabilized with the shallow bottom ash mixing method | |
| Zeng et al. | Effect of water chemistry on the hydro-mechanical behaviour of compacted mixtures of claystone and Na/Ca-bentonites for deep geological repositories | |
| Assadi Langroudi et al. | Lime cake as an alternative stabiliser for loose clayey loams | |
| Khan | Influence of moisture content distribution in soil on pavement and geothermal energy | |
| Batool et al. | Improvement of CBR and compaction characteristics of bauxite rich dispersive soils available in pakistan: A case study of khushab soil | |
| Pathivada | Effects of water-cement ratio on deep mixing treated expansive clay characteristics | |
| Chaudhry | Evaluation of grouting as a strengthening technique for earthen structures in seismic areas: Case study Chiripa | |
| HABIB-UR-REHMAN | je. i: r~~~:: frL= kL4cl: kl:: fr! 4. l~ l: tr.!: kl: tr. l~ i414r~ l:! fi4lfdtcl: ki: IE~~ l | |
| Çağlar | Stabilization of expansive soils by using red mud | |
| Damane | An investigation into the volume change characteristics of loess like soil in Mount Moorosi Village in Lesotho | |
| Swart | Mechanical and hydraulic properties of residual dolomite and wad found in the Malmani Subgroup in South Africa | |
| Abduljauwad et al. | Molecular level fabric and structure simulations of expansive clays | |
| Rix | Stabilisation of a highly plastic clay soil for the production of compressed earth blocks | |
| Tian et al. | Engineering properties of fine-grained red mud | |
| Al-Khashab et al. | Treatment of Expansive Clayey Soil with Crushed Limestone | |
| Fityus et al. | The development of expansive potential in a clay soil of residual origin | |
| Jiang | Soil suction and swell behavior of chemically treated expansive clays |
Legal Events
| Date | Code | Title | Description |
|---|---|---|---|
| AS | Assignment |
Owner name: KING FAHD UNIVERSITY OF PETROLEUM AND MINERALS, SA Free format text: ASSIGNMENT OF ASSIGNORS INTEREST;ASSIGNORS:AHMED, HABIB UR-REHMAN;ABDULJAUWAD, SAHEL NISHAT;SIGNING DATES FROM 20160326 TO 20160327;REEL/FRAME:038338/0923 |
|
| STCF | Information on status: patent grant |
Free format text: PATENTED CASE |
|
| LAPS | Lapse for failure to pay maintenance fees |
Free format text: PATENT EXPIRED FOR FAILURE TO PAY MAINTENANCE FEES (ORIGINAL EVENT CODE: EXP.); ENTITY STATUS OF PATENT OWNER: SMALL ENTITY |
|
| FEPP | Fee payment procedure |
Free format text: MAINTENANCE FEE REMINDER MAILED (ORIGINAL EVENT CODE: REM.); ENTITY STATUS OF PATENT OWNER: SMALL ENTITY |
|
| STCH | Information on status: patent discontinuation |
Free format text: PATENT EXPIRED DUE TO NONPAYMENT OF MAINTENANCE FEES UNDER 37 CFR 1.362 |
|
| FP | Lapsed due to failure to pay maintenance fee |
Effective date: 20210606 |