US9501751B1 - Virtual interactive taskboard for tracking agile software development - Google Patents
Virtual interactive taskboard for tracking agile software development Download PDFInfo
- Publication number
- US9501751B1 US9501751B1 US12/101,089 US10108908A US9501751B1 US 9501751 B1 US9501751 B1 US 9501751B1 US 10108908 A US10108908 A US 10108908A US 9501751 B1 US9501751 B1 US 9501751B1
- Authority
- US
- United States
- Prior art keywords
- assets
- status
- display
- tasks
- task
- Prior art date
- Legal status (The legal status is an assumption and is not a legal conclusion. Google has not performed a legal analysis and makes no representation as to the accuracy of the status listed.)
- Active, expires
Links
- 230000002452 interceptive effect Effects 0.000 title description 7
- 238000000034 method Methods 0.000 claims abstract description 56
- 230000004044 response Effects 0.000 claims abstract description 44
- 230000009471 action Effects 0.000 claims abstract description 20
- 230000007547 defect Effects 0.000 claims description 49
- 238000012360 testing method Methods 0.000 claims description 38
- 238000011161 development Methods 0.000 description 35
- 238000004891 communication Methods 0.000 description 14
- 238000007726 management method Methods 0.000 description 14
- 230000008569 process Effects 0.000 description 13
- 238000010586 diagram Methods 0.000 description 12
- 238000009434 installation Methods 0.000 description 7
- 230000008859 change Effects 0.000 description 5
- 230000006870 function Effects 0.000 description 4
- 239000007787 solid Substances 0.000 description 4
- 230000003993 interaction Effects 0.000 description 3
- 238000013515 script Methods 0.000 description 3
- 230000001419 dependent effect Effects 0.000 description 2
- 238000012986 modification Methods 0.000 description 2
- 230000004048 modification Effects 0.000 description 2
- 230000003287 optical effect Effects 0.000 description 2
- 238000012545 processing Methods 0.000 description 2
- 238000009877 rendering Methods 0.000 description 2
- 230000001413 cellular effect Effects 0.000 description 1
- 239000003086 colorant Substances 0.000 description 1
- 238000012217 deletion Methods 0.000 description 1
- 230000037430 deletion Effects 0.000 description 1
- 230000008520 organization Effects 0.000 description 1
- 238000012552 review Methods 0.000 description 1
Images


Classifications
-
- G—PHYSICS
- G06—COMPUTING; CALCULATING OR COUNTING
- G06Q—INFORMATION AND COMMUNICATION TECHNOLOGY [ICT] SPECIALLY ADAPTED FOR ADMINISTRATIVE, COMMERCIAL, FINANCIAL, MANAGERIAL OR SUPERVISORY PURPOSES; SYSTEMS OR METHODS SPECIALLY ADAPTED FOR ADMINISTRATIVE, COMMERCIAL, FINANCIAL, MANAGERIAL OR SUPERVISORY PURPOSES, NOT OTHERWISE PROVIDED FOR
- G06Q10/00—Administration; Management
- G06Q10/06—Resources, workflows, human or project management; Enterprise or organisation planning; Enterprise or organisation modelling
-
- G—PHYSICS
- G06—COMPUTING; CALCULATING OR COUNTING
- G06F—ELECTRIC DIGITAL DATA PROCESSING
- G06F8/00—Arrangements for software engineering
- G06F8/70—Software maintenance or management
- G06F8/71—Version control; Configuration management
-
- G—PHYSICS
- G06—COMPUTING; CALCULATING OR COUNTING
- G06Q—INFORMATION AND COMMUNICATION TECHNOLOGY [ICT] SPECIALLY ADAPTED FOR ADMINISTRATIVE, COMMERCIAL, FINANCIAL, MANAGERIAL OR SUPERVISORY PURPOSES; SYSTEMS OR METHODS SPECIALLY ADAPTED FOR ADMINISTRATIVE, COMMERCIAL, FINANCIAL, MANAGERIAL OR SUPERVISORY PURPOSES, NOT OTHERWISE PROVIDED FOR
- G06Q10/00—Administration; Management
- G06Q10/06—Resources, workflows, human or project management; Enterprise or organisation planning; Enterprise or organisation modelling
- G06Q10/063—Operations research, analysis or management
- G06Q10/0631—Resource planning, allocation, distributing or scheduling for enterprises or organisations
- G06Q10/06311—Scheduling, planning or task assignment for a person or group
-
- G—PHYSICS
- G06—COMPUTING; CALCULATING OR COUNTING
- G06F—ELECTRIC DIGITAL DATA PROCESSING
- G06F8/00—Arrangements for software engineering
- G06F8/10—Requirements analysis; Specification techniques
Definitions
- the disclosed embodiments relate generally to managing agile software development, and more particularly, to tracking agile software development with a virtual interactive taskboard.
- Agile software development refers to software development methodologies in which software is developed incrementally in steps referred to as iterations. Iterations typically are measured in weeks and may vary in length from one week or less to one month or more.
- Agile software development methodologies include Scrum, Extreme Programming (XP), Crystal, Lean Development, AgileUP, and Dynamic Systems Development Method (DSDM).
- Agile software development methods also have been referred to as lightweight methods. Methodologies may have their own vocabulary. For example, an iteration may be referred to as a sprint or a timebox, depending on the methodology.
- Agile software development is distinguishable from the “waterfall” model of sequential software development.
- a method of managing tasks during agile software development includes detecting selection of a level in a project hierarchy.
- a table is displayed listing a plurality of assets associated with the level and showing tasks associated with respective assets of the plurality of assets.
- the table indicates a status of each task.
- a user action to update the status of a particular task is detected; in response, display of the particular task is updated to indicate an updated status of the particular task.
- Selection of one or more filter criteria is detected; in response, display of the table is updated based on the one or more filter criteria.
- a system for managing tasks during agile software development includes memory, a display, one or more processors, and one or more programs stored in the memory and configured for execution by the one or more processors.
- the one or more programs include instructions to detect selection of a level in a project hierarchy and instructions to display, in response to said selection of the level, a table listing a plurality of assets associated with the level and showing tasks associated with respective assets of the plurality of assets. The table indicates a status of each task.
- the one or more programs also include instructions to detect a user action to update the status of a particular task and instructions to update, in response to the user action, display of the particular task to indicate an updated status of the particular task.
- the one or more programs further include instructions to detect selection of one or more filter criteria and instructions to update, in response to said selection of the one or more filter criteria, display of the table based on the one or more filter criteria.
- a computer readable storage medium stores one or more programs configured to be executed by a computer system to manage tasks during agile software development.
- the one or more programs include instructions to detect selection of a level in a project hierarchy and instructions to display, in response to said selection of the level, a table listing a plurality of assets associated with the level and showing tasks associated with respective assets of the plurality of assets. The table indicates a status of each task.
- the one or more programs also include instructions to detect a user action to update the status of a particular task and instructions to update, in response to the user action, display of the particular task to indicate an updated status of the particular task.
- the one or more programs further include instructions to detect selection of one or more filter criteria and instructions to update, in response to said selection of the one or more filter criteria, display of the table based on the one or more filter criteria.
- a graphical user interface includes: a menu of levels in a project hierarchy, a table listing a plurality of assets associated with a level in the project hierarchy and showing tasks associated with respective assets of the plurality of assets, and one or more menus of available filter criteria.
- the table indicates a status of each task.
- the table is displayed in response to detecting selection of the level in the project hierarchy from the menu of levels.
- display of the particular task is updated to indicate an updated status of the particular task.
- display of the table is updated based on the one or more filter criteria.
- FIG. 1 is a flow diagram illustrating an agile software development process flow 100 in accordance with some embodiments.
- FIGS. 2A, 2D, and 2E are schematic screenshots of a user interface displaying assets associated with an agile software development process in accordance with some embodiments.
- FIGS. 2B and 2C are schematic screenshots of a customization user interface displaying available attributes associates with assets in accordance with some embodiments.
- FIGS. 2F and 2G are schematic screenshots of a user interface for viewing an asset's attributes and related assets in accordance with some embodiments.
- FIGS. 2H-2J are schematic screenshots of user interfaces relating to asset templates in accordance with some embodiments.
- FIG. 2K is a schematic screenshot of a user interface displaying a parking lot report in accordance with some embodiments.
- FIGS. 3A-3E are schematic screenshots of a user interface displaying a virtual interactive taskboard in accordance with some embodiments.
- FIG. 3F is a schematic screenshot of a user interface displaying a virtual interactive taskboard and graphical reports in accordance with some embodiments.
- FIG. 3G is a flow diagram illustrating a method of managing tasks during agile software development in accordance with some embodiments.
- FIG. 4 is a block diagram illustrating an agile development management system in accordance with some embodiments.
- FIG. 5 is a block diagram illustrating a client computer in accordance with some embodiments.
- FIG. 6 is a block diagram illustrating a server computer in accordance with some embodiments.
- FIGS. 7A-7C are diagrams illustrating data structures for assets, customized settings, and asset templates in accordance with some embodiments.
- FIG. 1 is a flow diagram illustrating an agile software development process flow 100 in accordance with some embodiments. Support for performing operations in the process flow 100 can be provided by agile development management software.
- Work item planning ( 102 ) includes identifying work to be performed during the software development process. For example, features to be included in the software being developed are specified and software defects to be fixed during development are identified. Depending on the agile methodology being used, features also may be referred to as stories, backlog items, or requirements. In general, a work item is any item for which the agile development management software platform can track progress, such as time spent working on the item.
- Release planning ( 104 ) includes assigning identified work items (e.g., features and defects) to particular planned software releases. For example, certain features may be included in an initial release, with additional features to be added in subsequent releases. Similarly, fixing various defects may be scheduled across multiple releases. More generally, release planning may include assigning identified work items to levels or nodes in a project hierarchy.
- the project hierarchy may include projects, sub-projects, releases, teams and other internal organizations, clients or customers, and vendors.
- Iteration planning ( 106 ) includes assigning work items to iterations. There may be multiple iterations performed to prepare a particular software release; iteration planning thus involves specifying what work will be performed in which iterations. For example, features and defects are assigned to particular iterations. Within each iteration, tasks and tests corresponding to the features and defects are defined. A task is a unit of work performed as part of delivering a feature or fixing a defect. In some embodiments, a task is defined such that it takes no more than 3 days to perform. A test is an acceptance criterion that a feature or fixed defect must satisfy. Estimates for the time required to complete tests and tasks may be entered and a status may be associated with each task and test.
- the actual time spent working on the work items (e.g., on the features and defects and their corresponding tasks and tests) during an iteration is tracked ( 108 ) and compared against the estimates.
- Progress and status reports may be displayed graphically.
- a “dashboard” user interface may display multiple graphical reports.
- Possible graphical reports include burndown charts, velocity charts, burn-up charts, Gantt charts, parking lot reports, scope change, defect trending, test case status, and defect actuals.
- a burndown chart illustrates remaining work vs. time.
- Velocity refers to the estimated work per iteration on a project.
- Scope change refers to a change in requirements, such as the addition or deletion of features and defects. Parking lot reports are described below with regard to FIG. 2K .
- a “taskboard” user interface may display and enable updating of the status of work items, such as tasks and tests. Reports may be generated for a specified level or node in the project hierarchy (e.g., for a specified project, sub-project, release, team or other internal organization, client or customer, and/or vendor.)
- the operations in the development process flow 100 are presented sequentially in FIG. 1 for purposes of illustration. However, the operations need not be performed sequentially.
- the planning operations 102 , 104 , and 106 may be updated dynamically throughout the agile development process.
- tracking 108 may be performed dynamically, and may prompt subsequent planning changes.
- multiple operations may be combined into a single operation and additional operations may be added to the flow 100 .
- the agile software development process has various assets associated with it.
- Nodes in the project hierarchy such as projects, sub-projects, releases, teams, clients, and vendors, can be considered assets, as can iterations.
- Work items such as features and defects are assets, as are tasks and tests. Assets may be associated with other assets.
- tasks and tests are associated with (i.e., are related to) corresponding features and defects, which in turn may be associated with corresponding iterations.
- An asset includes various attributes.
- each kind of asset e.g., project, feature, task, etc.
- Types of attributes include text strings, numerical values, values calculated according to a formula (“synthetic attributes”), and associated assets.
- a first asset associated with a second asset thus is considered an attribute of the second asset.
- An attribute may be automatically included (e.g., hard-coded or created for a particular installation) in agile development management software or may be customized (i.e., user-defined).
- user interfaces are shown in a browser window.
- user interfaces are shown by a stand-alone application.
- Agile development management software can display groups of assets of a particular type. For example, groups of assets associated with work item planning, release planning, or iteration planning may be displayed.
- FIG. 2A is a schematic screenshot of a user interface 200 displaying a group 201 of assets associated with an agile software development process, in accordance with some embodiments.
- the particular type of group is determined by selecting a tab, selection box, radio button icon, or item in a drop-down menu. For example, in FIG. 2A a “workitem planning” tab 202 has been selected, indicating that the group 201 is a work item planning group.
- a group of a particular type may include multiple kinds of assets.
- the work item planning group 201 includes features (e.g., “Multi-Select Goal Assignment” 208 ) and defects (e.g., “Grid Filter Loses Plus/Minus State” 210 ), as indicated by features icons 209 and defects icons 211 .
- features e.g., “Multi-Select Goal Assignment” 208
- defects e.g., “Grid Filter Loses Plus/Minus State” 210
- the displayed assets in the group 201 are associated with a particular project hierarchy node 204 , displayed for example in a project selection window 206 .
- Assets may be added to the group 201 , for example, by selecting an “add story” (i.e., add feature) link 232 or an “add defect” link 234 .
- a user interface for displaying a group of assets may include multiple links or icons for adding multiple respective kinds of assets, or may include a single link or icon for adding assets.
- selection of a link or icon for adding assets results in the display of a separate user interface for adding assets (not shown).
- Assets displayed in the group 201 also may be edited, for example, by selecting an “edit” link (e.g., 236 ) corresponding to a respective asset.
- selection of an edit link or corresponding icon results in the display of a separate user interface for editing assets, as described below with regard to FIGS. 2E-2G .
- the displayed assets include a set of attributes selected for display, such as title 212 , ID 214 , owner 216 , status 218 , priority 220 , estimate 222 , and project 224 . Some of the attributes are also assets, such as project 224 . Some of the values for the attributes are blank: for example, no owner 216 , status 218 , priority 220 , or estimate 222 is shown for a number of assets, including feature 208 .
- Assets to be displayed in the group 201 may be filtered according to one or more attributes using filters 238 .
- a subset of the displayed attributes includes user input fields to accept edits to attribute values. For example, a user may select a priority from a drop-down box 228 and may enter a work or size estimate (e.g., an estimate of time) in a text input box 230 .
- a work or size estimate e.g., an estimate of time
- a customization user interface 240 is displayed that shows a group of available attributes 242 , as illustrated in FIG. 2B in accordance with some embodiments.
- the group 242 is shown as a list.
- the available attributes include the set of attributes selected for display and may include additional attributes that are not currently selected for display.
- the group of available attributes may be viewed directly from the user interface 200 , for example via a drop-down menu, instead of through the customization user interface 240 .
- the customization user interface 240 allows a user to select or de-select attributes for display.
- “Display selection boxes” e.g., 244 and 246
- respective attributes e.g., “project” 224 and “attachment count” 248
- the checked display selection boxes in FIG. 2B correspond to the set of attributes displayed for the group 201 of assets in user interface 200 ( FIG. 2A ).
- the user may select an attribute (i.e., add the attribute to the set selected for display) or de-select an attribute (i.e., remove the attribute from the set selected for display) by clicking on the corresponding display selection box (e.g., with a mouse or other selection device).
- clicking on display selection box 244 deselects the “project” attribute 224 , as illustrated in FIG. 2C .
- clicking on display selection box 246 selects the “attachment count” attribute 248 for display.
- Alternate means of selecting and deselecting attributes are possible, such as clicking on a radio button associated with the attribute or clicking on the attribute itself.
- Changes to the set of selected attributes may be applied by selecting an “apply” icon 254 or may be canceled by selecting a “cancel” icon 256 .
- the updated set of selected attributes is included in displays of groups of assets of the same type as the group 201 .
- the “work item planning” group 270 is displayed subsequent to de-selection of the “project” attribute 224 , the “project” attribute 224 is not included in the display, as illustrated in FIG. 2D in accordance with some embodiments. If the “attachment count” attribute 248 had been selected, the “attachment count” attribute would be included in subsequent display of the group 270 .
- the customization user interface 240 also allows a user to specify whether to permit particular attributes to be edited.
- “Editing selection boxes” e.g., 250 and 252
- respective attributes e.g., “status” 218 and “priority” 220
- the checked editing selection boxes 252 and 253 in FIG. 2B correspond to the subset of attributes (i.e., attributes 220 and 222 ) with user input fields in user interface 200 ( FIG. 2A ).
- the user may select an attribute for editing (i.e., add the attribute to the subset) or de-select an attribute for editing (i.e., remove the attribute from the subset) by clicking on the corresponding editing selection box (e.g., with a mouse or other selection device).
- adding “status” 218 to the subset e.g., by clicking on box 250
- Removing “priority” 220 from the subset e.g., by clicking on box 252
- Customized settings entered in the user interface 240 regarding the display of attributes and the ability to edit attributes may apply only to a particular user or may apply to multiple users.
- a customized setting may be created as a system default for all users viewing a particular type of group of assets (e.g., a work item planning group, a release planning group, or an iteration planning group).
- a user must have particular privileges, such as system administrator privileges, to create a system default customized setting.
- customized settings may be created that serve as a default for all users at or below a particular node in the project hierarchy.
- a customized setting may serve as a default for all users on a particular team or on a group of teams, or for all users working on a particular project, sub-project, or release.
- a user creating a particular default setting must have appropriate corresponding privileges. For example, authority to create a customized default for a particular team could be limited to the team leader.
- the level of application of the customized setting is specified using a drop-down menu 258 .
- the “system defaults” level shown as selected in the drop-down menu 258 indicates that the customized setting applies to all users viewing groups of the corresponding type. In some embodiments, the “system defaults” option will not be displayed in the drop-down menu 258 unless the user has already logged on as a system administrator or with other appropriate privileges.
- a user can override a default customized setting (e.g., a system default) by creating a user-specific customized setting, also known as a personalized setting.
- a user-specific customized setting also known as a personalized setting.
- the user may use the drop-down menu 258 to specify that a customized setting created via user interface 240 is specific to that user.
- This personalized setting then will control the display and ability to edit attributes for assets in a group of a particular type. If a user does not have a personalized setting, the default customized setting will control the display and ability to edit attributes associated with the group.
- a system administrator or other user with appropriate privileges may specify, for a particular default customized setting, whether individual users are permitted to override the default.
- individual users are permitted to override the default with regard to attributes to be displayed, but not with regard to attributes to be edited.
- FIG. 2E is a schematic screenshot of a user interface displaying a group of assets associated with an agile software development process in accordance with some embodiments.
- the user interface 251 of FIG. 2E displays a group 262 of assets associated with iteration planning, as indicated by selection of an “iteration planning” tab 263 .
- the iteration planning group 262 includes features (e.g., “Enter RMA” 264 ) and defects (e.g., “Inventory Levels Off in Warehouse” 265 ), as indicated by features icons 209 and defects icons 211 .
- the displayed assets in the group 262 are associated with a particular iteration 255 .
- the displayed assets in the group 262 also are associated with a particular project hierarchy node 261 , displayed for example in the project selection window 206 .
- the project hierarchy node 261 corresponds to a project entitled “Call Center,” which includes multiple software releases (e.g., “Release 1.0” and “Release 2.0”) and has multiple teams (e.g., “Team A” and “Team B”) working on releases. Each release and each team may be selected as a project hierarchy node in the project selection window 206 .
- the displayed group of assets in response to selection of a particular project hierarchy node, is updated to display assets associated with the selected project hierarchy node.
- the displayed group 262 of assets is updated to display assets associated with iteration planning for the selected release or team.
- Assets to be displayed in the group 262 may be filtered according to one or more attributes using filters 266 .
- Assets may be added to the group 262 by, for example, selecting an “add backlog item” link 267 or an “add defect” link 234 .
- the displayed assets in the group 262 include a set of attributes, such as title 212 , ID 214 , owner 216 , status 218 , estimate 222 , detail estimate 268 , and “to do” 269 .
- the “estimate” 222 and “detail estimate” 268 attributes provide estimates of quantities of work associated with assets, while the “to do” 269 attribute provides estimates of quantities of work remaining to be done for assets.
- some of the attributes may be assets associated with a displayed asset in the group 262 (i.e., may be related assets).
- an asset displayed in the group 262 may be edited by selecting a link corresponding to the asset, which results in display of a separate user interface (UI) for editing the asset.
- UI user interface
- selection of the “plan backlog item” link 271 for the “enter RMA” asset 264 results in display of a window 290 ( FIG. 2F ).
- the window 290 displays attributes 272 of the “enter RMA” asset 264 , such as ID, title, project, iteration, feature group, description, and estimate.
- the attributes are displayed in a list.
- the window 290 also displays related assets 273 associated with the “enter RMA” asset 264 .
- the related assets 273 include tasks and tests associated with the “enter RMA” asset 264 , which is a feature. Attributes of the related assets 273 (e.g., title 212 , ID 214 , owner 216 , and detail estimate 268 ) are displayed.
- the related assets 273 may be edited by selecting a corresponding link.
- related asset 274 (“Enter RMA Using Order Number”) may be edited by selecting an “edit” link 277 .
- a UI 278 ( FIG. 2G ) for editing the related asset 274 is displayed in the window 290 along with the attributes 272 and related assets 273 .
- the UI 278 includes user input fields (e.g., 279 , 281 , 283 , and 284 ) to display and receive edits to attributes of the related asset 274 .
- the UI 278 includes drop-down menus (e.g., 280 , 282 ) to select values for attributes of the related asset 274 .
- the user may enter values directly into the user input fields. Edits may be applied by selecting the “OK” link 285 or canceled by selecting the “cancel” link 286 .
- display of the UI 278 is ceased and displayed attribute values for the edited related asset 274 are updated in response to the edits.
- the user then may select another edit link associated with another related asset, resulting in display of another UI 278 within the window 290 for displaying and editing the newly selected related asset.
- multiple UI's for displaying and editing multiple respective related assets may be open simultaneously within the window 290 and may be accessed simply by scrolling within the window 290 .
- a new related asset may be added via the window 290 .
- a new task or test for the “enter RMA” asset 264 may be added by selecting the “add task” link 275 or “add test” link 276 .
- selection of the “add task” link 275 or “add test” link 276 results in display, within the window 290 , of a user interface analogous to UI 278 for which the user input fields (e.g., 279 , 281 , 283 , and 284 ) are blank.
- the user may enter attribute values for the new task or test through the user input fields.
- the user may specify attribute values via drop-down menus (e.g., 280 , 282 ).
- creation of the new task or test is completed by selecting the “OK” icon 285 or canceled by selecting the “cancel” icon 286 .
- display of the UI for creating the new related asset is ceased and the new related asset is displayed among the related assets 273 .
- the drop-down menu 280 displays asset templates from which a related asset 273 may be created. Asset templates are discussed below with regard to FIGS. 2H-2J .
- the window 290 thus provides a single integrated interface through which a user may view multiple levels of information for an asset in addition to performing edits. For example, the user may view attributes of the asset itself and of related assets, and may edit or create related assets.
- the integrated interface allows the user to perform these tasks without having to browse through a succession of windows.
- FIG. 2H is a schematic screenshot of a user interface 2002 displaying available asset templates in accordance with some embodiments.
- the UI 2002 may be accessed, for example, by selecting one or more links, icons or tabs (e.g., “planning” link 2004 , “setup” tab 2006 , and “templates” tab 2008 ).
- asset templates displayed in the UI 2002 are separated by asset type: backlog item templates 2010 , for example, are listed separately from defect templates 2012 .
- Asset templates displayed in the UI 2002 also may be associated with a particular project hierarchy node, such as the “Call Center” project hierarchy node 261 . In the UI 2002 one defect template 2026 (“My High Priority Defects”) and no backlog item templates have been defined for the “Call Center” project.
- an asset template includes identifying attributes such as a title 212 and/or an ID 214 , and also includes values for one or more additional attributes, such as status 218 , priority 220 , estimate 222 , or project 224 .
- additional attributes include any of the attributes in the group 242 ( FIG. 2B ).
- the values for these additional attributes serve as default values for assets generated from the template.
- attributes for the template 2026 include a “High” priority 2020 and the “Call Center” project 2022 .
- An asset that is created from the template 2026 will have a “High” priority 2020 and will be associated with the “Call Center” project 2022 , unless otherwise edited. This template thus enables users to create “High” priority defects for the “Call Center” project without having to enter the priority and project for each defect.
- FIG. 2I is a schematic screenshot of a user interface 2030 displaying an asset template in accordance with some embodiments.
- the UI 2030 may be accessed by selecting the asset template, for example, by clicking on the title 2018 in UI 2002 ( FIG. 2H ).
- the UI 2030 displays attributes 2032 of the selected template. In some embodiments, the displayed attributes 2032 are separated into different groups, such as “main” attributes 2032 -A and “extended” attributes 2032 -B.
- the template 2026 displayed in the UI 2030 has attribute values including an owner “Jeff” 2038 , a “High” priority 2020 , and the “Call Center” project 2022 .
- Other attributes for the template 2026 are blank. Values for blank attributes may be entered by a user when creating an asset from the template.
- an asset template includes related assets 2040 to be associated with an asset created from the asset template.
- a template for a feature e.g., a backlog item
- defect may include one or more related tasks (e.g., “Verify Defect” 2042 ) or tests to be associated with the feature or defect created from the template.
- the template defines values for attributes of the related assets.
- the task 2042 has an owner “Jeff” 2043 . Creation of an asset from a template with a related asset results in creation of the related asset as well: the related asset specified in the template is automatically created and associated with the asset created from the template. The related asset created in this manner includes attribute values as specified in the template.
- a related asset 2040 may be added to the template 2026 by selecting the “add” link 2044 and may be edited by selecting a corresponding “edit” link 2045 .
- Inclusion of related assets in an asset template spares users from having to create related assets for each newly created asset.
- the user selects the “edit” button 2034 .
- the user selects the close button 2036 .
- FIG. 2J is a schematic screenshot of a user interface 2050 for editing or creating an asset template 2026 or for creating an asset from the asset template 2026 in accordance with some embodiments.
- the UI 2050 is accessed by selecting the “edit” button 2034 ( FIG. 2I ), the “add defect template” link 2016 ( FIG. 2H ), or the “generate defect” link 2024 ( FIG. 2H ), or by otherwise selecting an asset template to be edited.
- the UI 2050 includes user input fields (e.g., 2056 , 2058 , 2062 , and 2066 ) to specify values for attributes 2032 . In some embodiments, the user may enter attribute values directly into the user input fields.
- attribute values may be selected through drop-down menus (e.g., 2060 and 2068 ) or through a separate user interface (e.g., a list of possible values, such as a list of possible owners 2038 ) accessed through a search icon 2064 .
- the “save new defect” button 2052 may be selected to create an asset having the attribute values for the template 2026 as well as other attribute values entered through UI 2050 .
- the user may edit the attribute values associated with the template. For example, the user may assign a different owner 2038 than “Jeff” or may assign a different priority 2020 than “High.”
- the “save template” button 2054 may be selected to save the attribute values associated with the template.
- the saved attribute values become default values for future assets created from the template.
- parking lot reports display degrees of completion for multiple groups of assets in an agile software development project.
- the assets are grouped by function or by various topics, which may be user-defined.
- the assets may be features that are grouped into feature sets.
- Feature sets sometimes referred to as themes, may be grouped in turn into parent feature sets, or parent themes.
- FIG. 2K is a schematic screenshot of a user interface 2080 for displaying a parking lot report in accordance with some embodiments.
- the UI 2080 may be accessed, for example, by selecting one or more links, icons or tabs (e.g., “reports” link 2084 , “dashboard” tab 2086 , and “parking lot” tab 2088 ).
- data presented in the parking lot report of UI 2080 is filtered according to a particular project hierarchy node (e.g., node 2082 , “Release 1.3”).
- the presented data may be filtered according to one or more additional filter criteria 2090 , such as “parent theme” 2092 , iteration 2098 , team 2102 , and workitem 2104 .
- the filter criteria may include any available attributes.
- values for the filter criteria may be entered directly into user input fields (e.g., 2094 ).
- values for the filter criteria may be selected through drop-down menus (e.g., 2096 ). Selecting the “go” button 2100 results in display of a parking lot report generated in accordance with the specified filter criteria: only data for assets that fall within the specified filter criteria are displayed. Selecting the “reset” button 2106 restores the filter criteria to default values (e.g., “all” for team 2102 and “none” for parent theme 2092 ).
- the parking lot report displays blocks 2108 corresponding to respective groups of assets that satisfy the filter criteria.
- a respective block 2108 displays a title 2110 of the respective group of assets and a graphic 2116 showing a degree of completion of assets within the group.
- the graphic 2116 shows a degree of completion of features within the feature set.
- the graphic 2116 is shown as a bar chart; in other embodiments another graphic showing a degree of completion may be displayed, such as a gauge or line chart.
- the bar charts 2116 indicate that the “Engineering” group of block 2108 - 2 is 40% complete, the “Feature Enhancements” group of block 2108 - 3 is 75% complete, the “Performance” group of block 2108 - 4 is 0% complete, the “Strategic Features” group of block 2108 - 6 is 80% complete, and the “Usability” group of block 2108 - 7 is 0% complete.
- a completion percentage 2118 is shown along with or in place of the graphic 2116 .
- additional information regarding a respective group is displayed in the respective block 2108 , such as an owner 2112 , a number of assets 2114 in the group, and a count of work units 2115 (e.g., an estimate of man-hours).
- each block 2108 is displayed with a background color corresponding to a degree of completion of the respective group of assets. For example, the block 2108 of a group that is 100% complete may be displayed in green, the block 2108 of a group that is 0% complete may be displayed in red, and blocks 2108 of groups that are partially complete may be displayed in other colors corresponding to ranges of completion percentages. In some embodiments, each block 2108 is displayed with a background color corresponding to a comparison of the degree of completion to a schedule (e.g., a comparison of the degree of completion to a planned degree of completion for the group at the time when the report is generated).
- a schedule e.g., a comparison of the degree of completion to a planned degree of completion for the group at the time when the report is generated.
- the block 2108 of a group that is on schedule may be displayed in green
- the block 2108 of a group that is slightly behind schedule may be displayed in yellow
- the block 2108 of a group that is significantly behind schedule may be displayed in red.
- a group is on schedule if its degree of completion equals or exceeds the planned degree of completion
- a group is slightly behind schedule if its degree of completion is less than the planned degree of completion by no more than a specified amount
- a group is significantly behind schedule if its degree of completion is less than the planned degree of completion by more than the specified amount.
- the UI 2080 enables on-the-fly generation of customized parking lot reports.
- a user may view a parking lot report for a particular project and then drill down on the report by generating subsequent parking lot reports filtered by user-specified attributes. For example, the user may generate parking lot reports for particular teams, releases, iterations, and/or parent themes within the project. Multiple parking lot reports with distinct filter criteria may be generated in quick succession. The user also may quickly and easily generate successive parking lot reports for different projects. For example, a manager may use the UI 2080 to review the status of multiple projects by successively selecting various projects in the project selection window 206 .
- a virtual interactive taskboard is used to display and update the status of tasks associated with various assets (e.g., features and defects) for an agile software development project. While the taskboard described below with regard to FIGS. 3A-3F displays the status of various tasks, in some embodiments a similar user interface is implemented for displaying and updating the status of tests or other related assets.
- assets e.g., features and defects
- FIG. 3A is a schematic screenshot of a user interface (UI) 300 A displaying a virtual interactive taskboard 312 in accordance with some embodiments.
- the UI 300 A may be accessed, for example, by selecting one or more links, icons, or tabs (e.g., “planning” link 2004 , “iteration tracking” tab 302 , and “taskboard” tab 304 ).
- the displayed taskboard 312 corresponds to a project hierarchy node or level 261 selected in the project selection window 206 .
- the project hierarchy level 261 corresponds to the “Call Center” project.
- the taskboard 312 further corresponds to a particular iteration 255 (“Month C 1st Half”), as specified in a text input field or drop-down menu 306 .
- a first column 314 in the taskboard 312 lists assets associated with the selected project level 261 and iteration 255 .
- the listed assets in the first column 314 may include features (e.g., “Enter RMA” 264 ) and defects (e.g., “Inventory Levels Off in Warehouse” 265 ).
- the type of a particular listed asset is indicated by an icon, such as a features icon 209 or a defects icon 211 .
- Tasks associated with each listed asset are displayed in the row for the asset and in columns indicating the status of respective tasks.
- tasks 326 , 328 , and 330 which are associated with the “Enter RMA” feature 264 , are listed in the row 346 for the “Enter RMA” feature 264 .
- Tasks 328 and 330 are displayed in the “In Progress” column 318 , indicating that work on those tasks has begun but has not been completed.
- Task 326 is displayed in the “None” column 316 , indicating that no work has begun and that the task 326 has not been assigned a status.
- No tasks are displayed in the row 348 for the defect 265 , indicating that no tasks are associated with the defect 265 .
- tasks are displayed along with one or more task owners (e.g., 332 ) and a work estimate for the task (e.g., 334 ).
- a user may interact with the taskboard 312 to move the location of a task and thereby to change the status of the task. For example, in response to a user clicking on the task 328 and dragging the task 328 from the “In Progress” column 318 to the “Completed” column 320 , as illustrated by dashed arrow 340 , the status of the task 328 is updated from “In Progress” to “Completed,” as illustrated in UI 300 B ( FIG. 3B ). In some embodiments, a status value stored as an attribute 720 in a table 700 ( FIG. 7A ) is updated in response to the user interaction 340 with the taskboard 312 .
- display of the taskboard 312 may be modified by selecting one or more filter criteria. For example, in response to selecting a task owner from the “Highlight Owner” drop-down menu 308 , the name of the selected task owner (“Tammy Coder” or “TC”) is highlighted on the taskboard, as shown in UI 300 C ( FIG. 3C ) (illustrating highlighting by displaying the name in bold with a bold border). Highlighting the name of the selected task owner allows easy identification of the owner's tasks. In response to selecting a type of asset (e.g., feature or defect) from the drop-down menu 310 , only assets of the selected type are listed in taskboard 312 . For example, in response to selection of “feature” from the drop-down menu 310 , only features are displayed in the taskboard 312 , as shown in UI 300 D ( FIG. 3D ).
- a type of asset e.g., feature or defect
- the status values shown for the columns in FIGS. 3A-3F (“None” 316 , “In Progress” 318 , “Completed” 320 , and “On Hold” 322 ) are merely examples of possible status values.
- the names, definitions, and/or number of status values and corresponding columns are user-configurable. For example, instead of a single “In Progress” status, multiple status values corresponding to specified ranges of degrees of completion may be defined, and respective tasks will be displayed in corresponding columns based on respective degrees of completion of the tasks.
- degree of completion corresponds to a completion percentage, which may be defined as the ratio of work done to the work estimate for the task.
- a “Summary” column 324 displays summary information for assets listed in the taskboard 312 .
- the summary information includes an indication 336 of test results for a particular asset.
- the indication 336 may include display of a color corresponding to the test results, such as red if any tests are failing and green if all tests are passing.
- the indication 336 may display symbols corresponding to the test results, such as an “X” if any tests are failing and a check if all tests are passing.
- the summary information includes a work estimate 338 , such as an estimated time to completion.
- the estimated time to completion includes the estimated time to complete all tasks and tests associated with a particular asset.
- the summary information includes one or more of a number of tasks associated with a particular asset, a number of tests associated with a particular asset, and an amount of time recorded as spent working on a particular asset.
- selecting an icon 329 ( FIG. 3A ) for a task results in display of a menu 350 ( FIG. 3E ).
- Items in the menu 350 include “assign” 352 , “track” 354 , “close task” 356 , and “reopen task” 358 .
- Selection of “assign” 352 results in display of a window with text fields for assigning an owner and a status value for the task.
- Selection of “track” 354 results in display of a window with text fields for recording time spent working on the task.
- Selection of “close task” 354 changes the status value of the task to “completed,” such that the task will subsequently be displayed in the “Completed” column 320 .
- Selection of “reopen task” 358 restores the status of the task to its status value prior to selection of “close task” 354 .
- selecting an icon 331 ( FIG. 3A ) for a listed asset results in display of a menu 360 ( FIG. 3E ).
- Items in the menu 360 include “add task” 362 , “add test” 364 , “plan feature” (or “plan defect”) 366 , and “close feature” (or “close defect”) 368 .
- Selection of “add task” 362 or “add test” 364 results in display of a UI (e.g. a UI analogous to UI 278 , FIG. 2G ) for adding a task or test associated with the listed asset.
- Selection of “plan feature” 366 results in display of a UI such as UI 290 ( FIGS. 2F-2G ).
- selection of “close feature” 368 changes the status of each task associated with the feature to “completed,” such that the tasks will subsequently be displayed in the “Completed” column 320 .
- widths of columns in the taskboard 312 are adjustable. For example, by clicking and dragging a column separator, as illustrated by the dashed arrow 342 ( FIG. 3A ), the width of a column may be adjusted, as shown for the “In Progress” column 318 in UI 300 B ( FIG. 3B ).
- positioning a cursor on a task (e.g., 326 , 328 , or 330 ) on the taskboard 312 results in display of a text box (not shown) containing a detailed description of the task.
- selection of a “standup dashboard” link 344 results in display of UI 300 F ( FIG. 3F ), which includes the taskboard 312 and graphical reports (e.g., burndown chart 370 and trend chart 372 ) that display status information for the selected project level 261 and iteration 255 .
- graphical reports e.g., burndown chart 370 and trend chart 372
- charts Examples of charts that may be displayed in the UI 300 F include burndown charts, velocity charts, burn-up charts, Gantt charts, parking lot reports, scope change, defect trending, test case status, and defect actuals.
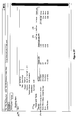
- FIG. 3G is a flow diagram illustrating a method 3000 of managing tasks during agile software development in accordance with some embodiments.
- selection of a level e.g., “Call Center” 261 , FIG. 3A
- the selected level includes ( 3004 ) a specified iteration (e.g., “Month C 1st Half” 255 , FIG. 3A ).
- a table (e.g., taskboard 312 , FIG. 3A ) is displayed ( 3006 ) listing a plurality of assets associated with the level and showing tasks (e.g., 326 , 328 , and 330 ) associated with respective assets of the plurality of assets.
- the table indicates a status of each task.
- the plurality of assets is associated ( 3008 ) with the specified iteration.
- the plurality of assets includes multiple types of assets, such as features (e.g., 264 ) and defects (e.g., 265 ) associated with the specified iteration.
- respective tasks are displayed in rows (e.g., 346 and 348 , FIG. 3A ) corresponding to the respective assets with which the respective tasks are associated and in columns (e.g., 316 , 318 , 320 , and 322 ) corresponding to the status of the respective tasks.
- the columns have labels corresponding to status values.
- the status values are user-definable.
- names of task owners e.g., 332 ) are displayed along with the respective tasks.
- displaying the table includes showing summary information for at least a subset of the listed assets.
- the summary information includes a result (e.g., indication 336 , FIG. 3A ) of one or more tests corresponding to a respective listed asset.
- the summary information for a respective listed asset includes one or more of an estimated time to completion (e.g., work estimate 338 , FIG. 3A ), a number of tasks, a number of tests, and an amount of time recorded as spent working on the asset.
- a user action is detected ( 3010 ) to update the status of a particular task.
- a drag-and-drop action (e.g., 340 , FIG. 3A ) is detected ( 3012 ).
- display of the particular task is updated ( 3014 ) to indicate an updated status of the particular task.
- display of the particular task in a first column is ceased ( 3016 ) and the particular task is displayed in a second column.
- display of the task 328 in column 318 is ceased and the task 328 is displayed in column 320 , as shown in FIG. 3B .
- Selection of one or more filter criteria is detected ( 3018 ).
- display of the table is updated ( 3020 ) based on the one or more filter criteria.
- the one or more filter criteria include a name of a task owner (e.g., selected from the menu 308 , FIG. 3A ).
- display of the table is updated to highlight tasks owned by the task owner, as illustrated in FIG. 3C .
- display of the table is updated to show only those tasks owned by the task owner.
- the one or more filter criteria include a specified type of asset (e.g., feature or defect, as specified in the menu 310 , FIG. 3A ).
- display of the table is updated to cease display of assets having types that are different from the specified type, as illustrated for features in FIG. 3D .
- the method 3000 further includes displaying a graphical report (e.g., burndown chart 370 or trend chart 372 , FIG. 3F ) in a common window (e.g., UI 300 F) with the table.
- a graphical report e.g., burndown chart 370 or trend chart 372 , FIG. 3F
- the graphical report displays status information associated with the selected level in the project hierarchy.
- display of the graphical report is updated based on the one or more filter criteria. For example, in response to selection of a task owner or a type of asset, the graphical report is updated to display data corresponding to status information associated with the selected task owner or asset type.
- columns in the table have user-definable widths.
- the width of a column may be modified in response to a user action 342 ( FIGS. 3A-3B ).
- the method 3000 further includes displaying for a respective task a link (e.g., icon 329 , FIG. 3A ) to a menu for modifying attributes of the respective task.
- a link e.g., icon 329 , FIG. 3A
- the method 3000 includes a number of operations that appear to occur in a specific order, it should be apparent that the method 3000 can include more or fewer operations. An order of two or more operations may be changed and two or more operations may be combined into a single operation. For example, operations 3018 and 3020 may be performed prior to operations 3010 and 3014 .
- the method 3000 thus provides an efficient and intuitive user-interface for viewing and updating status information in a user-configurable manner. Instead of using layers of menus to update status information, a user may update status information for multiple tasks in a single user interface and may filter the status information as desired.
- FIG. 4 is a block diagram illustrating an agile development management system 400 in accordance with some embodiments.
- the agile development management system 400 includes a server system 404 coupled to one or more client systems 402 by a network 406 .
- the client systems 402 may include client systems associated with respective users such as software developers, testers, managers, clients, customers, vendors, and any other parties involved in agile software development.
- the network 406 may be any suitable wired and/or wireless network and may include a local area network (LAN), wide area network (WAN), virtual private network (VPN), the Internet, metropolitan area network (MAN), or any combination of such networks.
- LAN local area network
- WAN wide area network
- VPN virtual private network
- MAN metropolitan area network
- the server system 404 includes a server 408 and a database 410 .
- Server 408 serves as a front-end for the server system 404 .
- Server 408 sometimes called a front end server, provides an interface between the server system 404 and the client systems 402 .
- the functions of server 408 may be divided or allocated among two or more servers.
- the server system 404 stores data relating to the agile development process, including asset data 412 , asset template data 413 , and customization data 414 .
- Asset data 412 includes attributes for respective assets.
- An exemplary data structure 700 for asset data 412 is illustrated in FIG. 7A , described below.
- Asset template data 413 includes attributes for respective asset templates.
- An exemplary data structure 760 for asset template data 413 is illustrated in FIG. 7C , described below.
- Customization data 414 includes the level of the customization (e.g. system default or personalized), the type of asset group to which the customization applies, and data indicating which available assets are selected for display and for editing via user input fields.
- An exemplary data structure 730 for customization data 414 is illustrated in FIG. 7B , described below.
- server system 404 may be implemented as a distributed system of multiple computers. However, for convenience of explanation, the server system 404 is described herein as being implemented on a single computer, which can be considered a single logical system.
- the client system 402 includes a computer 424 or computer controlled device, such as a personal digital assistant (PDA), cellular telephone or the like.
- the computer 424 typically includes one or more processors (not shown); memory, which may include volatile memory (not shown) and non-volatile memory such as a hard disk drive 426 ; and a display 420 .
- the computer 424 may also have input devices such as a keyboard and a mouse (not shown).
- a user may interact with the server system 404 via an agile development user interface 422 presented on the display 420 .
- Examples of user interfaces 422 are illustrated in FIGS. 2A-2K and FIGS. 3A-3F .
- the agile development user interface 422 may be a web-based user interface. That is, the user interface 422 includes one or more web pages. It is noted that a single web page can contain multiple frames, each of which may appear (when displayed by a browser application) to be a distinct web page.
- the web page(s) may be written in the Hypertext Markup Language (HTML), Extensible Markup Language (XML), or any other suitable language for preparing web pages, and may include one or more scripts for interfacing with the server system 404 .
- the web page(s) may include a JavaScript application that interfaces with the server system 404 via an application programming interface (API).
- API application programming interface
- the JavaScript application receives asset data, customization data, asset template data, and reporting data from the server system 404 , manages the rendering of that data at the client, and also performs the client-side aspects of other tasks, such as marking attributes as selected or de-selected, updating attribute values according to data entered in user input fields or in response to user interaction with a taskboard 312 , and transmitting user requests to the server system 404 .
- the agile development user interface 422 may be a part of a stand-alone application that is run on the client system 402 .
- the standalone application may interface with the server system 404 via an application programming interface (API).
- API application programming interface
- the agile development management software may be installed and used on a single computer combining the functionalities of the server system 404 and client system 402 .
- FIG. 5 is a block diagram illustrating a client computer in accordance with some embodiments.
- the client computer 500 which may be used as a client system 402 ( FIG. 4 ), typically includes one or more processing units (CPUs) 502 , one or more network or other communications interfaces 506 , memory 504 , and one or more communication buses 514 for interconnecting these components.
- the communication buses 514 may include circuitry (sometimes called a chipset) that interconnects and controls communications between system components.
- the client computer 500 may also include a user interface 508 comprising a display device 510 and a keyboard and/or mouse (or other pointing device) 512 .
- the memory 504 includes high-speed random access memory, such as DRAM, SRAM, DDR RAM or other random access solid state memory devices; and may include non-volatile memory, such as one or more magnetic disk storage devices, optical disk storage devices, flash memory devices, or other non-volatile solid state storage devices.
- the memory 504 or alternately the non-volatile memory device(s) within the memory 504 , comprises a computer readable storage medium.
- the memory 504 may optionally include one or more storage devices remotely located from the CPU(s) 502 .
- the memory 504 stores the following programs, modules and data structures, or a subset thereof:
- the agile development management module 520 includes a local database 522 for storing data sent by the server (e.g., asset data, customization data, asset template data, and reporting data), an asset display module 524 for displaying groups of assets (e.g., via UI 200 , FIG. 2A ; UI 251 , FIG. 2E ; or UI 300 , FIGS. 3A-3F ) and for displaying an asset's attributes and related assets (e.g., via window 290 , FIGS.
- data sent by the server e.g., asset data, customization data, asset template data, and reporting data
- an asset display module 524 for displaying groups of assets (e.g., via UI 200 , FIG. 2A ; UI 251 , FIG. 2E ; or UI 300 , FIGS. 3A-3F ) and for displaying an asset's attributes and related assets (e.g., via window 290 , FIGS.
- an asset editing module for updating attribute values (e.g., in accordance with data entered via user input fields or in response to user interaction with a taskboard 312 ), an asset template module 527 for creating, displaying, and editing templates and for creating assets from templates (e.g., via UIs 2002 , 2030 , and 2050 , FIGS. 2H-2J ), a customization module 528 for enabling creation of customized settings (e.g., via customization user interface 240 , FIG. 2B ), a reporting module 529 for displaying reporting (e.g., via UI 2080 , FIG. 2K or UI 300 F, FIG. 3F ), and a server interface module 530 for interfacing with server computer 500 .
- the server interface module 530 includes a cache for storing data to be transmitted to the server.
- the agile development management module 520 may be a script-based module, embedded in a web page served from the server system 404 ( FIG. 4 ).
- the web page may be rendered by a client application 532 , such as a web browser, at the client computer 500 .
- the agile development management module 520 is executed, thereby providing a web-based interface to the server system 404 .
- the script-based agile development management module may be written in JavaScript, AJAX, ECMAScript, Perl, or any other suitable scripting language.
- the agile development management module 520 may be a standalone application stored in the memory 504 of the client computer 500 .
- Each of the above identified elements in FIG. 5 may be stored in one or more of the previously mentioned memory devices.
- Each of the above identified modules corresponds to a set of instructions for performing a function described above.
- the above identified modules or programs i.e., sets of instructions
- the memory 504 may store a subset of the modules and data structures identified above.
- the memory 504 may store additional modules and data structures not described above.
- FIG. 6 is a block diagram illustrating a server computer 600 in accordance with some embodiments.
- the server computer 600 which may be used as a server system 404 ( FIG. 4 ), typically includes one or more processing units (CPUs) 602 , one or more network or other communications interfaces 606 , memory 604 , and one or more communication buses 610 for interconnecting these components.
- the communication buses 610 may include circuitry (sometimes called a chipset) that interconnects and controls communications between system components.
- the server system 600 optionally may include a user interface 608 , which may include a display device (not shown), and a keyboard and/or a mouse (not shown).
- the memory 604 includes high-speed random access memory, such as DRAM, SRAM, DDR RAM or other random access solid state memory devices; and may include non-volatile memory, such as one or more magnetic disk storage devices, optical disk storage devices, flash memory devices, or other non-volatile solid state storage devices.
- the memory 604 or alternately the non-volatile memory device(s) within the memory 604 , comprises a computer readable storage medium.
- the memory 604 may optionally include one or more storage devices remotely located from the CPU(s) 602 .
- the memory 604 stores the following programs, modules and data structures, or a subset thereof:
- the application interface 622 includes a presentation layer 624 for rendering user interfaces (e.g., FIGS. 2A-2K and FIGS. 3A-3F ) accessed by a client system 402 .
- a presentation layer 624 for rendering user interfaces (e.g., FIGS. 2A-2K and FIGS. 3A-3F ) accessed by a client system 402 .
- the customization data 620 includes three levels of customization settings used by the presentation layer 624 to render user interfaces.
- a base level includes settings that are always included in the agile development management software.
- An installation level includes settings that are created for a particular installation of the agile development management software.
- the installation level may include customization settings created via user interface 240 .
- a user level includes personalized settings. Additional levels are possible, such as levels corresponding to a particular project hierarchy node (e.g., to a particular team).
- settings at a given level override settings at lower levels. For example, installation settings override base settings, and user settings override both installation and base settings.
- the presentation layer 624 first applies base-level settings, then overlays any installation-level overrides, and finally overlays any user-level overrides.
- Each of the above identified elements in FIG. 6 may be stored in one or more of the previously mentioned memory devices.
- Each of the above identified modules corresponds to a set of instructions for performing a function described above.
- the above identified modules or programs i.e., sets of instructions
- the memory 604 may store a subset of the modules and data structures identified above.
- the memory 604 may store additional modules and data structures not described above.
- FIG. 6 shows a “server computer,” FIG. 6 is intended more as a functional description of the various features which may be present in a set of servers than as a structural schematic of the embodiments described herein.
- items shown separately could be combined and some items could be separated.
- some items shown separately in FIG. 6 could be implemented on single servers and single items could be implemented by one or more servers.
- the agile development management database 616 stores data in various tables.
- an “Asset Type” table includes an entry for each kind of asset, such as feature, defect, task, or test.
- An “Attribute Definition” table defines the attributes associated with each kind of asset listed in the “Asset Type” table.
- a “Synthetic Attribute” table references formulas used to calculate synthetic attributes.
- An “Attribute Security Check” table contains references to operations used to determine whether a user may access or modify particular attributes.
- a “Relation Definition” table defines relationships between assets.
- a “Many to Many Relation Definition” table may contain relationship information for assets in many-to-many relationship with other assets. Other tables may specify business rules for various assets.
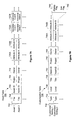
- Attribute values for particular assets are stored in asset tables 700 , as illustrated in FIG. 7A in accordance with some embodiments.
- a table 700 corresponds to a particular kind of asset, such as feature, defect, task, or test.
- the asset table 700 includes a row 702 for each respective asset stored in the table.
- Each row includes fields that contain values for attributes of the respective asset, as defined in the “Attribute Definition” table.
- the attribute fields include title 704 , asset ID 706 , project 708 , owner 710 , and various other attributes 720 .
- Other possible attribute fields include, without limitation, the attributes listed in group 242 ( FIG. 2B ), such as status, priority, estimate, and attachment counts.
- the asset table 700 also includes fields 722 to specify attributes that are associated assets. For example, if a respective asset is a feature or defect, fields 722 may specify tasks and tests associated with the feature or defect, for example by providing the asset IDs of the tasks and tests. In another example, a field 722 may specify an iteration to which an asset is assigned.
- values for user-defined customized attributes are stored in separate tables for specific types of custom attributes. For example, numeric customized attributes are stored in a first table, text customized attributes are stored in a second table, boolean customized attributes are stored in a third table, and so on.
- Customization data 620 such as the three levels of settings used by the presentation layer 624 , also may be stored in tables in the database 616 .
- FIG. 7B is a diagram illustrating a customization table 730 for customized settings in accordance with some embodiments.
- Each row 732 in the table 730 corresponds to a customized setting.
- Each row 732 includes a field 734 that specifies the type of asset group, such as work item planning, release planning, or iteration planning, to which the customized setting applies.
- Each row also includes a field 736 specifying the level of the customized setting, such as system default or personalized setting.
- each row includes fields corresponding to available attributes, such as title 738 , asset ID 740 , project 742 , owner 744 , and various other attributes 746 .
- a field corresponding to an available attribute includes a display flag 748 and an edit flag 750 .
- the display flag 748 indicates whether the attribute is selected for display.
- the edit flag 750 indicates whether to display user input fields to permit
- Tables 700 and 730 thus include information to allow the agile development management application interface 622 to respond to a request from a client computer 500 when a user seeks to display an asset group of a particular type.
- the interface 622 can query asset tables 700 to identify the assets in the group and can query the customization table 730 to determine which customized setting, if any, applies.
- attribute values for asset templates are stored in asset template tables 760 , as illustrated in FIG. 7C in accordance with some embodiments.
- a table 760 corresponds to a particular type of asset template (i.e., to templates for a particular type of asset).
- the asset template table 760 includes a row 762 for each respective asset template stored in the table.
- Each row includes fields that contain values for attributes of the respective asset template, as defined in the “Attribute Definition” table for the type of asset to which the template corresponds. Examples of attribute fields are described above with regard to FIG. 7A , and may include fields 722 for associated (i.e., related) assets.
Abstract
Description
-
- an
operating system 516 that includes procedures for handling various basic system services and for performing hardware dependent tasks; - a
network communication module 518 that is used for connecting theclient system 500 to other computers via the one or more communication network interfaces 506 and one or more communication networks, such as the Internet, other wide area networks, local area networks, metropolitan area networks, and so on; - an agile
development management module 520 for handling data relating to the agile development process; and - a
client application 532, such as a web browser.
- an
-
- an
operating system 612 that includes procedures for handling various basic system services and for performing hardware dependent tasks; - a
network communication module 614 that is used for connecting theserver system 600 to other computers via the one or more communication network interfaces 606 and one or more communication networks, such as the Internet, other wide area networks, local area networks, metropolitan area networks, and so on; - an agile
development management database 616 for storing data relating to the agile development process, includingasset data 618,customization data 620, andasset template data 621; and - an agile development management application programming interface (API) 622 for exchanging information with the agile
development management modules 520 in one ormore client computers 500.
- an
Claims (18)
Priority Applications (1)
| Application Number | Priority Date | Filing Date | Title |
|---|---|---|---|
| US12/101,089 US9501751B1 (en) | 2008-04-10 | 2008-04-10 | Virtual interactive taskboard for tracking agile software development |
Applications Claiming Priority (1)
| Application Number | Priority Date | Filing Date | Title |
|---|---|---|---|
| US12/101,089 US9501751B1 (en) | 2008-04-10 | 2008-04-10 | Virtual interactive taskboard for tracking agile software development |
Publications (1)
| Publication Number | Publication Date |
|---|---|
| US9501751B1 true US9501751B1 (en) | 2016-11-22 |
Family
ID=57287754
Family Applications (1)
| Application Number | Title | Priority Date | Filing Date |
|---|---|---|---|
| US12/101,089 Active 2029-12-29 US9501751B1 (en) | 2008-04-10 | 2008-04-10 | Virtual interactive taskboard for tracking agile software development |
Country Status (1)
| Country | Link |
|---|---|
| US (1) | US9501751B1 (en) |
Cited By (11)
| Publication number | Priority date | Publication date | Assignee | Title |
|---|---|---|---|---|
| US20150156232A1 (en) * | 2013-12-02 | 2015-06-04 | Pankaj Sharma | System and method for generating and merging activity-entry reports utilizing activity-entry hierarchy and hierarchical information of the activity-entries |
| US20160085520A1 (en) * | 2013-05-31 | 2016-03-24 | Huawei Technologies Co., Ltd. | Application Creation Method and Apparatus |
| US20160299757A1 (en) * | 2012-08-17 | 2016-10-13 | Hartford Fire Insurance Company | System and method for monitoring software development and program flow |
| CN108345988A (en) * | 2018-01-22 | 2018-07-31 | 广州欧赛斯信息科技有限公司 | A kind of agile software co-development management system based on container platform |
| US20180322468A1 (en) * | 2017-05-05 | 2018-11-08 | Servicenow, Inc. | User interface for timesheet reporting |
| US10127017B2 (en) * | 2016-11-17 | 2018-11-13 | Vmware, Inc. | Devops management |
| US10180900B2 (en) * | 2016-04-15 | 2019-01-15 | Red Hat Israel, Ltd. | Recordation of user interface events for script generation |
| AU2018217244A1 (en) * | 2017-08-14 | 2019-02-28 | Accenture Global Solutions Limited | Artificial intelligence and machine learning based product development |
| US10930086B2 (en) * | 2016-11-01 | 2021-02-23 | Dg Holdings, Inc. | Comparative virtual asset adjustment systems and methods |
| US11494180B2 (en) * | 2013-06-07 | 2022-11-08 | Capital One Services, Llc | Systems and methods for providing predictive quality analysis |
| US11693702B2 (en) | 2020-04-01 | 2023-07-04 | The Toronto-Dominion Bank | Systems and methods for managing usage of computing resources |
Citations (86)
| Publication number | Priority date | Publication date | Assignee | Title |
|---|---|---|---|---|
| US5544300A (en) | 1993-11-12 | 1996-08-06 | Intel Corporation | User interface for dynamically converting between a single top level window and multiple top level windows |
| US5714971A (en) | 1993-04-20 | 1998-02-03 | Apple Computer, Inc. | Split bar and input/output window control icons for interactive user interface |
| US5874958A (en) | 1997-03-31 | 1999-02-23 | Sun Microsystems, Inc. | Method and apparatus for accessing information and items across workspaces |
| US5943053A (en) | 1997-04-01 | 1999-08-24 | Sun Microsystems, Inc. | Method and apparatus for expanding and contracting a window panel |
| US5956030A (en) | 1993-06-11 | 1999-09-21 | Apple Computer, Inc. | Computer system with graphical user interface including windows having an identifier within a control region on the display |
| US6175364B1 (en) | 1997-04-01 | 2001-01-16 | Sun Microsystems, Inc. | Framework and method for interfacing a GUI, container with a GUI component |
| US6211874B1 (en) | 1998-05-15 | 2001-04-03 | International Business Machines Corporation | Method for parallel selection of URL's |
| US6239798B1 (en) | 1998-05-28 | 2001-05-29 | Sun Microsystems, Inc. | Methods and apparatus for a window access panel |
| US20020062367A1 (en) | 2000-01-26 | 2002-05-23 | Debber J. Dale | Opportunity tracking information system |
| US20020091732A1 (en) | 2000-12-29 | 2002-07-11 | Pedro Justin E. | Displaying forms and content in a browser |
| US20020089526A1 (en) | 1998-01-26 | 2002-07-11 | Jeffrey J. Buxton | Infocenter user interface for applets and components |
| US20020138636A1 (en) | 2001-03-23 | 2002-09-26 | Mark Buttner | Method for automatically mass generating personalized data report outputs |
| US20030033589A1 (en) | 2001-03-01 | 2003-02-13 | David Reyna | System and method for utilization of a command structure representation |
| US20030046282A1 (en) | 2001-07-06 | 2003-03-06 | Carlson Brent A. | Managing reusable software assets |
| US20030061330A1 (en) | 2000-09-29 | 2003-03-27 | Frisco Lynn A. | Web-based collaborative project and process management solution |
| US20030103079A1 (en) | 1999-06-14 | 2003-06-05 | Lycos, Inc., A Virginia Corporation | Media resource manager/player |
| US20030158845A1 (en) | 2001-12-13 | 2003-08-21 | Gary Braley | Integrated management database |
| US20030160815A1 (en) | 2002-02-28 | 2003-08-28 | Muschetto James Edward | Method and apparatus for accessing information, computer programs and electronic communications across multiple computing devices using a graphical user interface |
| US20030163404A1 (en) | 2002-02-22 | 2003-08-28 | Kenneth Hu | Method of evaluating security trading capacity |
| US20030172020A1 (en) | 2001-11-19 | 2003-09-11 | Davies Nigel Paul | Integrated intellectual asset management system and method |
| US20030182470A1 (en) | 2002-03-18 | 2003-09-25 | Carlson Brent A. | Generating reusable software assets from distributed artifacts |
| US20030182652A1 (en) | 2001-12-21 | 2003-09-25 | Custodio Gabriel T. | Software building and deployment system and method |
| US20030188290A1 (en) | 2001-08-29 | 2003-10-02 | International Business Machines Corporation | Method and system for a quality software management process |
| US20030204644A1 (en) | 2002-04-29 | 2003-10-30 | International Business Machines Corporation | System and method for developing, deploying, and debugging software agents |
| US6694009B1 (en) | 1999-06-15 | 2004-02-17 | Avaya Technology Corp. | Estimation of a work item's wait-time from the present stages of processing of preceding work items |
| US6698013B1 (en) | 2000-10-04 | 2004-02-24 | Mintaka Technology Group | Real time monitoring system for tracking and documenting changes made by programmer's during maintenance or development of computer readable code on a line by line basis and/or by point of focus |
| US20040081951A1 (en) | 2000-06-09 | 2004-04-29 | Michael Vigue | Work/training using an electronic infrastructure |
| US20040186762A1 (en) | 1999-05-07 | 2004-09-23 | Agility Management Partners, Inc. | System for performing collaborative tasks |
| US20040243968A1 (en) | 2003-05-27 | 2004-12-02 | Sun Microsystems, Inc. | System and method for software methodology evaluation and selection |
| US20040243457A1 (en) | 2003-05-28 | 2004-12-02 | International Business Machines Corporation | Project estimating system and method |
| US20040268246A1 (en) | 2003-06-16 | 2004-12-30 | Microsoft Corporation | Systems and methods for processing collateral content associated with an electronic message |
| US20050004825A1 (en) | 2003-07-01 | 2005-01-06 | Stefan Ehrler | Managing resources for projects |
| US20050065951A1 (en) | 2002-08-30 | 2005-03-24 | Kathleen Liston | Visualization of commonalities in data from different sources |
| US20050086239A1 (en) | 1999-11-16 | 2005-04-21 | Eric Swann | System or method for analyzing information organized in a configurable manner |
| US20050086638A1 (en) | 2003-10-17 | 2005-04-21 | International Business Machines Corporation | Method and system for editing column oriented programming language statements |
| US20050114829A1 (en) | 2003-10-30 | 2005-05-26 | Microsoft Corporation | Facilitating the process of designing and developing a project |
| US20050114830A1 (en) * | 2003-11-24 | 2005-05-26 | Qwest Communications International Inc. | System development planning tool |
| US20050125771A1 (en) | 2003-09-17 | 2005-06-09 | Kamen Vitanov | System and method for dynamic generation and customization of web service client applications for terminals |
| US20050132048A1 (en) | 2003-12-12 | 2005-06-16 | International Business Machines Corporation | Role-based views access to a workflow weblog |
| US20050198615A1 (en) | 2004-03-02 | 2005-09-08 | Choi Elliot M. | Portlet template based on a state design pattern |
| US20050216879A1 (en) | 2004-03-24 | 2005-09-29 | University Technologies International Inc. | Release planning |
| US20050229157A1 (en) | 2004-04-08 | 2005-10-13 | Johnson Matthew A | Dynamic layout system and method for graphical user interfaces |
| US20060036973A1 (en) | 2004-08-13 | 2006-02-16 | Kenneth Ogami | Method and an apparatus to design a processing system using a graphical user interface |
| US20060069604A1 (en) | 2004-09-30 | 2006-03-30 | Microsoft Corporation | User interface for providing task management and calendar information |
| US7051038B1 (en) | 2002-06-28 | 2006-05-23 | Microsoft Corporation | Method and system for a reporting information services architecture |
| US20060123389A1 (en) | 2004-11-18 | 2006-06-08 | Kolawa Adam K | System and method for global group reporting |
| US20060212327A1 (en) | 2005-03-01 | 2006-09-21 | Lucent Technologies, Inc. | Methods and apparatus for associating and displaying project planning and management information in conjunction with geographic information |
| US7117447B2 (en) | 2001-06-08 | 2006-10-03 | Mci, Llc | Graphical user interface (GUI) based call application system |
| US20060236261A1 (en) | 2005-04-13 | 2006-10-19 | Forstall Scott J | Multiple-panel scrolling |
| US20060235771A1 (en) | 2003-09-10 | 2006-10-19 | Agile Software Corporation | System and method for managing item interchange and identification in an extended enterprise |
| US7210093B1 (en) | 2000-03-09 | 2007-04-24 | International Business Machines Corporation | Method, system, and program for displaying pages downloaded from over a network in an application window |
| US20070094609A1 (en) | 2005-09-30 | 2007-04-26 | Sap Portals Israel Ltd. | Executable and declarative specification for graphical user interfaces |
| US20070124682A1 (en) | 2005-08-03 | 2007-05-31 | Pioneer Corporation | Conference support system, conference support method and program product for managing progress of conference |
| US7236966B1 (en) | 2002-03-08 | 2007-06-26 | Cisco Technology | Method and system for providing a user-customized electronic book |
| US20070168918A1 (en) * | 2005-11-10 | 2007-07-19 | Siemens Medical Solutions Health Services Corporation | Software Development Planning and Management System |
| US7272815B1 (en) | 1999-05-17 | 2007-09-18 | Invensys Systems, Inc. | Methods and apparatus for control configuration with versioning, security, composite blocks, edit selection, object swapping, formulaic values and other aspects |
| US20070288292A1 (en) * | 2000-10-24 | 2007-12-13 | Gauger Derek K | Network based, interactive project management apparatus and method |
| US20080077530A1 (en) * | 2006-09-25 | 2008-03-27 | John Banas | System and method for project process and workflow optimization |
| US20080077416A1 (en) | 2006-09-26 | 2008-03-27 | Hetrick William A | Method and apparatus for managing virtual team collaboration meetings |
| US20080097734A1 (en) | 2004-06-16 | 2008-04-24 | State Of Oregan Acting By And Through The State Bo | System And Method For Simulating Global Product Development |
| US7376891B2 (en) | 1998-06-04 | 2008-05-20 | Collegenet, Inc. | Universal forms engine |
| US20080154749A1 (en) | 2006-12-23 | 2008-06-26 | Agile Software Corporation | Integrated System and Method for Improved Product Substance Compliance |
| US20080172625A1 (en) | 2007-01-16 | 2008-07-17 | Microsoft Corporation | Virtual workspace for project management coordination |
| US7415677B2 (en) | 2002-06-05 | 2008-08-19 | Sap Aktiengesellschaft | Temporary communication areas for a computer user interface |
| US7421648B1 (en) * | 1999-05-21 | 2008-09-02 | E-Numerate Solutions, Inc. | Reusable data markup language |
| US20080282228A1 (en) | 2007-05-09 | 2008-11-13 | Subramanyam V | Quality management framework for a software lifecycle |
| US20080301296A1 (en) | 2007-05-30 | 2008-12-04 | Jeremy Dwayne York | System and method for creating, tracking and analyzing tasks |
| US7478338B2 (en) | 2001-07-12 | 2009-01-13 | Autodesk, Inc. | Palette-based graphical user interface |
| US20090024647A1 (en) | 2007-07-17 | 2009-01-22 | Agile Softw Are Corporation | Product network management system and method |
| US7490314B2 (en) | 2004-01-30 | 2009-02-10 | Microsoft Corporation | System and method for exposing tasks in a development environment |
| US20090204465A1 (en) | 2008-02-08 | 2009-08-13 | Santosh Pradhan | Process and system for facilitating communication and intergrating communication with the project management activities in a collaborative environment |
| US20090271760A1 (en) | 2008-04-24 | 2009-10-29 | Robert Stephen Ellinger | Method for application development |
| US20090300580A1 (en) | 2007-12-20 | 2009-12-03 | Hsbc Technologies Inc. | Automated methods and systems for developing and deploying projects in parallel |
| US7640496B1 (en) | 2003-10-31 | 2009-12-29 | Emc Corporation | Method and apparatus for generating report views |
| US7644390B2 (en) | 2006-08-14 | 2010-01-05 | Payman Khodabandehloo | Design tool and methodology for enterprise software applications |
| US20100088664A1 (en) | 2006-08-14 | 2010-04-08 | Payman Khodabandehloo | Design tool and methodology for enterprise software applications |
| US20100218092A1 (en) | 2009-02-24 | 2010-08-26 | Sap Ag | Method and system for generating a personalized report with reusable parameters |
| US20100306730A9 (en) | 2002-03-18 | 2010-12-02 | Logiclibrary, Inc. | Customizable asset governance for a distributed reusable software library |
| US7899694B1 (en) | 2006-06-30 | 2011-03-01 | Amazon Technologies, Inc. | Generating solutions to problems via interactions with human responders |
| US7930201B1 (en) | 2002-08-19 | 2011-04-19 | Sprint Communications Company L.P. | EDP portal cross-process integrated view |
| US8042063B1 (en) | 1999-04-19 | 2011-10-18 | Catherine Lin-Hendel | Dynamic array presentation and multiple selection of digitally stored objects and corresponding link tokens for simultaneous presentation |
| US8370803B1 (en) | 2008-01-17 | 2013-02-05 | Versionone, Inc. | Asset templates for agile software development |
| US8561012B1 (en) | 2008-10-08 | 2013-10-15 | Versionone, Inc. | Transitioning between iterations in agile software development |
| US8751491B2 (en) | 2008-10-28 | 2014-06-10 | Autodesk, Inc. | System and method for recommending next commands when using a software application |
| US8863107B2 (en) | 2007-08-08 | 2014-10-14 | Innopath Software, Inc. | Workflow-based user interface system for mobile devices management |
| US20150089448A1 (en) | 2013-09-20 | 2015-03-26 | Oracle International Corporation | Enterprise applications navigation using tile characteristics that change with applications data |
-
2008
- 2008-04-10 US US12/101,089 patent/US9501751B1/en active Active
Patent Citations (89)
| Publication number | Priority date | Publication date | Assignee | Title |
|---|---|---|---|---|
| US5714971A (en) | 1993-04-20 | 1998-02-03 | Apple Computer, Inc. | Split bar and input/output window control icons for interactive user interface |
| US5956030A (en) | 1993-06-11 | 1999-09-21 | Apple Computer, Inc. | Computer system with graphical user interface including windows having an identifier within a control region on the display |
| US5544300A (en) | 1993-11-12 | 1996-08-06 | Intel Corporation | User interface for dynamically converting between a single top level window and multiple top level windows |
| US5874958A (en) | 1997-03-31 | 1999-02-23 | Sun Microsystems, Inc. | Method and apparatus for accessing information and items across workspaces |
| US5943053A (en) | 1997-04-01 | 1999-08-24 | Sun Microsystems, Inc. | Method and apparatus for expanding and contracting a window panel |
| US6175364B1 (en) | 1997-04-01 | 2001-01-16 | Sun Microsystems, Inc. | Framework and method for interfacing a GUI, container with a GUI component |
| US20020089526A1 (en) | 1998-01-26 | 2002-07-11 | Jeffrey J. Buxton | Infocenter user interface for applets and components |
| US6211874B1 (en) | 1998-05-15 | 2001-04-03 | International Business Machines Corporation | Method for parallel selection of URL's |
| US6239798B1 (en) | 1998-05-28 | 2001-05-29 | Sun Microsystems, Inc. | Methods and apparatus for a window access panel |
| US7376891B2 (en) | 1998-06-04 | 2008-05-20 | Collegenet, Inc. | Universal forms engine |
| US8042063B1 (en) | 1999-04-19 | 2011-10-18 | Catherine Lin-Hendel | Dynamic array presentation and multiple selection of digitally stored objects and corresponding link tokens for simultaneous presentation |
| US20040186762A1 (en) | 1999-05-07 | 2004-09-23 | Agility Management Partners, Inc. | System for performing collaborative tasks |
| US7272815B1 (en) | 1999-05-17 | 2007-09-18 | Invensys Systems, Inc. | Methods and apparatus for control configuration with versioning, security, composite blocks, edit selection, object swapping, formulaic values and other aspects |
| US7421648B1 (en) * | 1999-05-21 | 2008-09-02 | E-Numerate Solutions, Inc. | Reusable data markup language |
| US20030103079A1 (en) | 1999-06-14 | 2003-06-05 | Lycos, Inc., A Virginia Corporation | Media resource manager/player |
| US6694009B1 (en) | 1999-06-15 | 2004-02-17 | Avaya Technology Corp. | Estimation of a work item's wait-time from the present stages of processing of preceding work items |
| US20050086239A1 (en) | 1999-11-16 | 2005-04-21 | Eric Swann | System or method for analyzing information organized in a configurable manner |
| US20020062367A1 (en) | 2000-01-26 | 2002-05-23 | Debber J. Dale | Opportunity tracking information system |
| US7210093B1 (en) | 2000-03-09 | 2007-04-24 | International Business Machines Corporation | Method, system, and program for displaying pages downloaded from over a network in an application window |
| US20040081951A1 (en) | 2000-06-09 | 2004-04-29 | Michael Vigue | Work/training using an electronic infrastructure |
| US20030061330A1 (en) | 2000-09-29 | 2003-03-27 | Frisco Lynn A. | Web-based collaborative project and process management solution |
| US6698013B1 (en) | 2000-10-04 | 2004-02-24 | Mintaka Technology Group | Real time monitoring system for tracking and documenting changes made by programmer's during maintenance or development of computer readable code on a line by line basis and/or by point of focus |
| US20070288292A1 (en) * | 2000-10-24 | 2007-12-13 | Gauger Derek K | Network based, interactive project management apparatus and method |
| US20020091732A1 (en) | 2000-12-29 | 2002-07-11 | Pedro Justin E. | Displaying forms and content in a browser |
| US20030033589A1 (en) | 2001-03-01 | 2003-02-13 | David Reyna | System and method for utilization of a command structure representation |
| US20020138636A1 (en) | 2001-03-23 | 2002-09-26 | Mark Buttner | Method for automatically mass generating personalized data report outputs |
| US7117447B2 (en) | 2001-06-08 | 2006-10-03 | Mci, Llc | Graphical user interface (GUI) based call application system |
| US20070033567A1 (en) | 2001-07-06 | 2007-02-08 | Logiclibrary, Inc. | Managing reusable software assets |
| US20030046282A1 (en) | 2001-07-06 | 2003-03-06 | Carlson Brent A. | Managing reusable software assets |
| US7478338B2 (en) | 2001-07-12 | 2009-01-13 | Autodesk, Inc. | Palette-based graphical user interface |
| US20030188290A1 (en) | 2001-08-29 | 2003-10-02 | International Business Machines Corporation | Method and system for a quality software management process |
| US20030172020A1 (en) | 2001-11-19 | 2003-09-11 | Davies Nigel Paul | Integrated intellectual asset management system and method |
| US20030158845A1 (en) | 2001-12-13 | 2003-08-21 | Gary Braley | Integrated management database |
| US20030182652A1 (en) | 2001-12-21 | 2003-09-25 | Custodio Gabriel T. | Software building and deployment system and method |
| US20030163404A1 (en) | 2002-02-22 | 2003-08-28 | Kenneth Hu | Method of evaluating security trading capacity |
| US6850255B2 (en) | 2002-02-28 | 2005-02-01 | James Edward Muschetto | Method and apparatus for accessing information, computer programs and electronic communications across multiple computing devices using a graphical user interface |
| US20030160815A1 (en) | 2002-02-28 | 2003-08-28 | Muschetto James Edward | Method and apparatus for accessing information, computer programs and electronic communications across multiple computing devices using a graphical user interface |
| US7236966B1 (en) | 2002-03-08 | 2007-06-26 | Cisco Technology | Method and system for providing a user-customized electronic book |
| US20100306730A9 (en) | 2002-03-18 | 2010-12-02 | Logiclibrary, Inc. | Customizable asset governance for a distributed reusable software library |
| US20030182470A1 (en) | 2002-03-18 | 2003-09-25 | Carlson Brent A. | Generating reusable software assets from distributed artifacts |
| US20030204644A1 (en) | 2002-04-29 | 2003-10-30 | International Business Machines Corporation | System and method for developing, deploying, and debugging software agents |
| US7415677B2 (en) | 2002-06-05 | 2008-08-19 | Sap Aktiengesellschaft | Temporary communication areas for a computer user interface |
| US7051038B1 (en) | 2002-06-28 | 2006-05-23 | Microsoft Corporation | Method and system for a reporting information services architecture |
| US7930201B1 (en) | 2002-08-19 | 2011-04-19 | Sprint Communications Company L.P. | EDP portal cross-process integrated view |
| US20050065951A1 (en) | 2002-08-30 | 2005-03-24 | Kathleen Liston | Visualization of commonalities in data from different sources |
| US20040243968A1 (en) | 2003-05-27 | 2004-12-02 | Sun Microsystems, Inc. | System and method for software methodology evaluation and selection |
| US20040243457A1 (en) | 2003-05-28 | 2004-12-02 | International Business Machines Corporation | Project estimating system and method |
| US20040268246A1 (en) | 2003-06-16 | 2004-12-30 | Microsoft Corporation | Systems and methods for processing collateral content associated with an electronic message |
| US20050004825A1 (en) | 2003-07-01 | 2005-01-06 | Stefan Ehrler | Managing resources for projects |
| US20060235771A1 (en) | 2003-09-10 | 2006-10-19 | Agile Software Corporation | System and method for managing item interchange and identification in an extended enterprise |
| US20050125771A1 (en) | 2003-09-17 | 2005-06-09 | Kamen Vitanov | System and method for dynamic generation and customization of web service client applications for terminals |
| US20050086638A1 (en) | 2003-10-17 | 2005-04-21 | International Business Machines Corporation | Method and system for editing column oriented programming language statements |
| US20050114829A1 (en) | 2003-10-30 | 2005-05-26 | Microsoft Corporation | Facilitating the process of designing and developing a project |
| US7640496B1 (en) | 2003-10-31 | 2009-12-29 | Emc Corporation | Method and apparatus for generating report views |
| US20050114830A1 (en) * | 2003-11-24 | 2005-05-26 | Qwest Communications International Inc. | System development planning tool |
| US20050132048A1 (en) | 2003-12-12 | 2005-06-16 | International Business Machines Corporation | Role-based views access to a workflow weblog |
| US7490314B2 (en) | 2004-01-30 | 2009-02-10 | Microsoft Corporation | System and method for exposing tasks in a development environment |
| US20050198615A1 (en) | 2004-03-02 | 2005-09-08 | Choi Elliot M. | Portlet template based on a state design pattern |
| US20050216879A1 (en) | 2004-03-24 | 2005-09-29 | University Technologies International Inc. | Release planning |
| US20050229157A1 (en) | 2004-04-08 | 2005-10-13 | Johnson Matthew A | Dynamic layout system and method for graphical user interfaces |
| US20080097734A1 (en) | 2004-06-16 | 2008-04-24 | State Of Oregan Acting By And Through The State Bo | System And Method For Simulating Global Product Development |
| US20060036973A1 (en) | 2004-08-13 | 2006-02-16 | Kenneth Ogami | Method and an apparatus to design a processing system using a graphical user interface |
| US20060069604A1 (en) | 2004-09-30 | 2006-03-30 | Microsoft Corporation | User interface for providing task management and calendar information |
| US20060123389A1 (en) | 2004-11-18 | 2006-06-08 | Kolawa Adam K | System and method for global group reporting |
| US20060212327A1 (en) | 2005-03-01 | 2006-09-21 | Lucent Technologies, Inc. | Methods and apparatus for associating and displaying project planning and management information in conjunction with geographic information |
| US20060236261A1 (en) | 2005-04-13 | 2006-10-19 | Forstall Scott J | Multiple-panel scrolling |
| US20070124682A1 (en) | 2005-08-03 | 2007-05-31 | Pioneer Corporation | Conference support system, conference support method and program product for managing progress of conference |
| US20070094609A1 (en) | 2005-09-30 | 2007-04-26 | Sap Portals Israel Ltd. | Executable and declarative specification for graphical user interfaces |
| US20070168918A1 (en) * | 2005-11-10 | 2007-07-19 | Siemens Medical Solutions Health Services Corporation | Software Development Planning and Management System |
| US7899694B1 (en) | 2006-06-30 | 2011-03-01 | Amazon Technologies, Inc. | Generating solutions to problems via interactions with human responders |
| US20100088664A1 (en) | 2006-08-14 | 2010-04-08 | Payman Khodabandehloo | Design tool and methodology for enterprise software applications |
| US7644390B2 (en) | 2006-08-14 | 2010-01-05 | Payman Khodabandehloo | Design tool and methodology for enterprise software applications |
| US20080077530A1 (en) * | 2006-09-25 | 2008-03-27 | John Banas | System and method for project process and workflow optimization |
| US20080077416A1 (en) | 2006-09-26 | 2008-03-27 | Hetrick William A | Method and apparatus for managing virtual team collaboration meetings |
| US20080154749A1 (en) | 2006-12-23 | 2008-06-26 | Agile Software Corporation | Integrated System and Method for Improved Product Substance Compliance |
| US20080172625A1 (en) | 2007-01-16 | 2008-07-17 | Microsoft Corporation | Virtual workspace for project management coordination |
| US20080282228A1 (en) | 2007-05-09 | 2008-11-13 | Subramanyam V | Quality management framework for a software lifecycle |
| US20080301296A1 (en) | 2007-05-30 | 2008-12-04 | Jeremy Dwayne York | System and method for creating, tracking and analyzing tasks |
| US20090024647A1 (en) | 2007-07-17 | 2009-01-22 | Agile Softw Are Corporation | Product network management system and method |
| US8863107B2 (en) | 2007-08-08 | 2014-10-14 | Innopath Software, Inc. | Workflow-based user interface system for mobile devices management |
| US20090300580A1 (en) | 2007-12-20 | 2009-12-03 | Hsbc Technologies Inc. | Automated methods and systems for developing and deploying projects in parallel |
| US8370803B1 (en) | 2008-01-17 | 2013-02-05 | Versionone, Inc. | Asset templates for agile software development |
| US20090204465A1 (en) | 2008-02-08 | 2009-08-13 | Santosh Pradhan | Process and system for facilitating communication and intergrating communication with the project management activities in a collaborative environment |
| US20090271760A1 (en) | 2008-04-24 | 2009-10-29 | Robert Stephen Ellinger | Method for application development |
| US8561012B1 (en) | 2008-10-08 | 2013-10-15 | Versionone, Inc. | Transitioning between iterations in agile software development |
| US9129240B2 (en) | 2008-10-08 | 2015-09-08 | Versionone, Inc. | Transitioning between iterations in agile software development |
| US8751491B2 (en) | 2008-10-28 | 2014-06-10 | Autodesk, Inc. | System and method for recommending next commands when using a software application |
| US20100218092A1 (en) | 2009-02-24 | 2010-08-26 | Sap Ag | Method and system for generating a personalized report with reusable parameters |
| US20150089448A1 (en) | 2013-09-20 | 2015-03-26 | Oracle International Corporation | Enterprise applications navigation using tile characteristics that change with applications data |
Non-Patent Citations (108)
| Title |
|---|
| "ScrumWorks Pro Desktop Client User Guide", Danube Technologies, Feb. 2007. * |
| Akerman, Using Ontology to Support Development of Software Architectures, 2006, 13 pgs. |
| Almand, Final Office Action, U.S. Appl. No. 14/220,096, Jun. 7, 2016, 9 pgs. |
| Almand, Office Action, U.S. Appl. No. 14/220,096, Nov. 3, 2015, 9 pgs. |
| Ayewah, Evaluating Static Analysis Defect Warnings on Production Software, PASTE '07, Jun. 13-14, 2007, 7 pgs. |
| Barton, B. et al., "Reporting Scrum Project Progress to Executive Management through Metrics," Jan. 2005, 9 pages, http://www.spin-montreal.org/Downloads/Conférences/Saison-2006-2007/Reporting-Scrum-Progress.pdf. |
| Boehm, A View of 20th and 21st Century Software Engineering, ICSE '06, May 20-28, 2006, pp. 12-29. |
| Cause, G., "Delivering Real Business Value Using FDD," Methods and Tools, Winter 2004 (vol. 12-No. 4), pp. 23-35, http://www.methodsandtools.com/PDF/mt200404.pdf. |
| Ceschi, M. et al., "Project Management in Plan-Based and Agile Companies," May/Jun. 2005, 7 pages, IEEE Software, 0740-7459/05. |
| Chou, Redesigning a large and complex website: how to begin and a method for success, ACM, Providence, RI, Nov. 20-23, 2002, pp. 22-28. |
| Cruise Control Overview, downloaded Apr. 9, 2010, 34 pages, http://cruisecontrol.sourceforge.net/overview.html. |
| Cruise Control, downloaded Apr. 9, 2010, 1 page, http://cruisecontrol.sourceforge.net. |
| Danube Technologies, "ScrumWorks Pro Web Client User Guide," 7 pages, archived Feb. 2007, http://web.archive.org/web/20070211221824/danube.com/docs/scrumworks/pro/latest/webuserguide.html. |
| Danube Technologies, "ScrumWorks Quick Start Guide-Version 1.4.2," 10 pages, http://web.archive.org/web/20060117203359/danube.com/docs/scrumworks/latest/quickstart.html, archived Jan. 2006. |
| Danube Technologies, "ScrumWorks Web Client User Guide-Version 1.4.2," 6 pages, http://web.archive.org/web/20060117203638/danube.com/docs/scrumworks/latest/webuserguide.html, archived Jan. 2006. |
| De Luca, J., "FDD Implementations," Nebulon Pty. Ltd., 10 pages, http://www.nebulon.com/articles/fdd/fddimplementations.html and http://web.archive.org/web/20051118103830/nebulon.com/articles/fdd/fddimplementations.html archived Nov. 2005. |
| De Luca, J., "Parking Lot Chart Example 1, Feature Driven Development," http://www.featluredrivendevelopment.com/node/630, Dec. 17, 2003, 2 pages. |
| De Luca, J., "Parking Lot Chart Example 2," Nov. 20, 2003, 1 page, http://www.featured drivendevelopment.com/node/619. |
| De Luca, J., "Parking Lot Chart-Aesthetics," Mar. 16, 2007, 2 pages, http://www.featureddrivendevelopment.com/node/1038. |
| De Luca, J., "Parking Lot Chart-Legend," Feature Driven Development, Mar. 16, 2007, 2 pages, http://www.featuredrivendevelopment.com/node/1037. |
| Derby, E., "Agile Retrospectives," The Pragmatic Bookshelf, 186 pages, Dec. 26, 2007. |
| Fowler, M., "The New Methodology," martinfowler.com Dec. 13, 2005, 19 pages, http://www.martinfowler.com/articles/newMethodology.html. |
| Holler, Final Office Action, U.S. Appl. No. 12/245,566, Nov. 30, 2012, 16 pgs. |
| Holler, Final Office Action, U.S. Appl. No. 12/357,225, Nov. 23, 2012, 30 pgs. |
| Holler, Final Office Action, U.S. Appl. No. 13/890,179, Jan. 21, 2016, 11 pgs. |
| Holler, Final Office Action, U.S. Appl. No. 14/288,317, Jul. 29, 2016, 8 pgs. |
| Holler, Notice of Allowance, U.S. Appl. No. 12/016,191, Jan. 15, 2014, 7 pgs. |
| Holler, Notice of Allowance, U.S. Appl. No. 12/016,192, Sep. 28, 2012, 8 pgs. |
| Holler, Notice of Allowance, U.S. Appl. No. 12/245,566, Nov. 26, 2013, 11 pgs. |
| Holler, Notice of Allowance, U.S. Appl. No. 12/247,963, Jan. 30, 2013, 8 pgs. |
| Holler, Notice of Allowance, U.S. Appl. No. 12/357,225, Jun. 20, 2014, 12 pgs. |
| Holler, Notice of Allowance, U.S. Appl. No. 13/858,819, Apr. 3, 2014, 8 pgs. |
| Holler, Notice of Allowance, U.S. Appl. No. 13/890,179, Jul. 6, 2016, 14 pgs. |
| Holler, Notice of Allowance, U.S. Appl. No. 14/054,733, Apr. 13, 2015, 10 pgs. |
| Holler, Notice of Allowance, U.S. Appl. No. 14/246,019, Nov. 16, 2015, 7 pgs. |
| Holler, Office Action, U.S. Appl. No. 12/016,191, Jul. 19, 2012, 12 pgs. |
| Holler, Office Action, U.S. Appl. No. 12/016,191, Jun. 19, 2013, 13 pgs. |
| Holler, Office Action, U.S. Appl. No. 12/016,192, Apr. 30, 2012, 12 pgs. |
| Holler, Office Action, U.S. Appl. No. 12/016,193, Jan. 30, 2013, 13 pgs. |
| Holler, Office Action, U.S. Appl. No. 12/016,193, Jul. 9, 2012, 10 pgs. |
| Holler, Office Action, U.S. Appl. No. 12/101,084, Jun. 21, 2013, 14 pgs. |
| Holler, Office Action, U.S. Appl. No. 12/101,089, May 23, 2012, 16 pgs. |
| Holler, Office Action, U.S. Appl. No. 12/174,511, Jan. 4, 2013, 23 pgs. |
| Holler, Office Action, U.S. Appl. No. 12/174,511, May 11, 2012, 21 pgs. |
| Holler, Office Action, U.S. Appl. No. 12/245,566, Apr. 24, 2013, 17 pgs. |
| Holler, Office Action, U.S. Appl. No. 12/245,566, May 14, 2012, 15 pgs. |
| Holler, Office Action, U.S. Appl. No. 12/247,939, Apr. 26, 2013, 5 pgs. |
| Holler, Office Action, U.S. Appl. No. 12/247,939, Jun. 7, 2012, 9 pgs. |
| Holler, Office Action, U.S. Appl. No. 12/247,939, Nov. 19, 2012, 9 pgs. |
| Holler, Office Action, U.S. Appl. No. 12/247,963, Jul. 9, 2012, 23 pgs. |
| Holler, Office Action, U.S. Appl. No. 12/247,963, Mar. 15, 2012, 20 pgs. |
| Holler, Office Action, U.S. Appl. No. 12/357,225, Jul. 19, 2012, 28 pgs. |
| Holler, Office Action, U.S. Appl. No. 12/357,225, Jul. 19, 2012, 29 pgs. |
| Holler, Office Action, U.S. Appl. No. 12/357,225, Oct. 3, 2013, 29 pgs. |
| Holler, Office Action, U.S. Appl. No. 13/858,819, Nov. 18, 2013, 10 pgs. |
| Holler, Office Action, U.S. Appl. No. 13/890,179, Jun. 22, 2015, 12 pgs. |
| Holler, Office Action, U.S. Appl. No. 14/054,733, Oct. 24, 2014, 11 pgs. |
| Holler, Office Action, U.S. Appl. No. 14/246,019, Jul. 20, 2015, 30 pgs. |
| Holler, Office Action, U.S. Appl. No. 14/288,317, Dec. 16, 2015, 8 pgs. |
| Holler, Office Action, U.S. Appl. No. 14/848,271, Jun. 16, 2016, 6 pgs. |
| IBM, Cognos Software, "Budgeting and Forecasting Software," Jun. 2, 2009, 3 pages, http://www.cognos.com/performance-management/software-planning-budgeting-forcasting. |
| Jansen, "On the Influence of Test-Driven Development on Software Design," Proceedings of the 19th Conference on Software Engineering Education & Training (CSEET'06) 2006 IEEE, , 8 pgs. |
| Jansen, "On the Influence of Test-Driven Development on Software Design," Proceedings of the 19th Conference on Software Engineering Education & Training (CSEET'06) 2006 IEEE, <http://ieeexplore.ieee.org/stamp/stamp.js?tp=&arnumber=1617340>, 8 pgs. |
| JetBrains, "Distributed Build Management and Continuous Integration Server," Apr. 9, 2010, 3 pages, http://www.jetbrains.com/teamcity/features/index.html. |
| JetBrains, "Distributed Build Management and Continuous Integrations Server: Features," Apr. 9, 2010, 2 pages, http://www.jetbrains.com/teamcity/features/index.html. |
| JetBrains, "TeamCity 3.0-Overview," Jun. 28, 2010, 10 pages, http://www.jetbrains.com/teamcity/documentation/TeamCity3-Overview.pdf. |
| JetBrains, "TeamCity 4.5,"2003-2009, 2 pages, http://www.jetbrains.com/teamcity/documentation/TeamCityData-Sheet.pdf. |
| Kane, David, "Introducing Agile Development into Bioinformatics an Experience Report," 2003 IEEE, http://ieee.org/stamp.jsp?tp+&arnumber+123146., 8 pgs. |
| Kolcz, Using SPEM/UML Profile to Specification of IS Development Process, Oct. 2006, 68 pgs. |
| Li, Empirical Evaluation of Defect Projection Models for Widely-deployed Production Software Systems, 2004, pp. 263-272. |
| Lyu, Software Reliability Engineering: A Roadmap, delivery.acm.org/10.1145/12600000/1254716/28290153.pdf, 2007, 17 pgs. |
| Memmel, T., et al., Agile Methods and Visual Specification in Software Development a Chance to Ensure Universal Access, 2007 springer, pp. 454-462, downloaded from , 10 pgs. |
| Memmel, T., et al., Agile Methods and Visual Specification in Software Development a Chance to Ensure Universal Access, 2007 springer, pp. 454-462, downloaded from <http://link.springer.com/chapter/10.1007/978-3-540-73279-2-51>, 10 pgs. |
| Microsoft Office Online Demo: Base sales Forecasts and Trendlines on Data, Jun. 2, 2009, 3 pages, http://office.microsoft.com/en-us/excel/HA010929231033.aspx?mode=print. |
| Microsoft Office Online, Demo: Check That Hunch with Excel "What-If" Scenarios, Jun. 2, 2009, 1 page. |
| Microsoft Office Online, Show Trends and Forecast Sales with Charts, Jun. 2, 2009, 7 pages, http://office.microsoft.com/en-us/excel/HA010877851033.aspx?mode=print. |
| Microsoft Office Online, Understanding Scheduling in Microsoft Project 2002, Jun. 2, 2009, 7 pages, http://office.microsoft.com/en-us/project/HA010563061033.aspx?mode=print. |
| Mountain Goat Software, "Training for Scrum Task Board Use," © 1998-2010 Mountain Goat Software, 5 pages, http://www.mountaingoatsoftware.com/scrum/task-boards. |
| Netsuite Sales Forecasting Software-NetSuite SFA Software, Netsuite Inc., 1998-2009, 6 pages. |
| Odenwelder, Notice of Allowance, U.S. Appl. No. 12/463,299, Dec. 4, 2012, 13 pgs. |
| Odenwelder, Office Action, U.S. Appl. No. 12/463,299, Apr. 25, 2012, 18 pgs. |
| Ouimet, SERT: Software Tool for Generating Student Engagement Reports, IEEE, ITNG'07, 2007, 8 pgs. |
| Phan et al., Progressive Multiples for Communication-Minded Visualization, ACM, Montreal, Canada, May 28-30, 2007, pp. 225-232. |
| Ribarsky et al., Glyphmaker: Creating Customized Visualizations of Complex Data, IEEE, Jul. 1994, pp. 57-64. |
| Robbins, Adopting Open Source Software Engineering (OSSE) Practices by Adopting OSSE Tools, www.ics.uci.edu/~wscacchi/Papers/New/Robbins-msotb-OSSE-Aug03.pdf, 2005, pp. 1-16. |
| Robbins, Adopting Open Source Software Engineering (OSSE) Practices by Adopting OSSE Tools, www.ics.uci.edu/˜wscacchi/Papers/New/Robbins-msotb-OSSE-Aug03.pdf, 2005, pp. 1-16. |
| Sandler, D., "Source Control in Ten Minutes: a Subversion Tutorial," Jan. 24, 2006, 6 pages, http://www.owlnet.rice.edu/~comp314/svn.html. |
| Sandler, D., "Source Control in Ten Minutes: a Subversion Tutorial," Jan. 24, 2006, 6 pages, http://www.owlnet.rice.edu/˜comp314/svn.html. |
| Scacchi, Walt, Modeling Simulating and Enacting Complex Orgnizational Processes a Life Cycle Approach1, 1996 MIT, 21 pgs., . |
| Scacchi, Walt, Modeling Simulating and Enacting Complex Orgnizational Processes a Life Cycle Approach1, 1996 MIT, 21 pgs., <http//citeseerx.ist.psu.edu/viewdoc/download?doi=10.1.1.48.8110&rep=rep1&type=pdf>. |
| Screenshots of Xplanner, May 10, 2005, 1 page. |
| Shih et al., Using URLs and Table Layout for Web Classification Tasks, ACM, New York, NY, May 17-22, 2004, pp. 193-202. |
| Sneed, Reengineering Reports, IEEE, WRCE'4, 2004, 10 pgs. |
| Sugarcrm, Sugarsuite Screenshot, Apr. 8, 2010, 1 page, http://www.sugarcrm.com/crm/screenshot.php?i=/crm/images/content-images/screens/scree. |
| Trask, Bruce, "Using Model-Driven Engineering to Complement Software Product Line Enginering in Developing Software Defined Radion Components and Applications," OOPSLA'06, Oct. 22-26, Portland, Oregon, , 8 pgs. |
| Trask, Bruce, "Using Model-Driven Engineering to Complement Software Product Line Enginering in Developing Software Defined Radion Components and Applications," OOPSLA'06, Oct. 22-26, Portland, Oregon, <http://dl.acm.org/citation.cfm?id=1176733>, 8 pgs. |
| Vanguard Software, Forecasting Software, Jun. 2, 2009, 4 pages, http://www.vanguardsw.com/solutions/application/forecasting/default.htm?gclid=CLHZpPP. |
| VersionOne, "Frequently Asked Questions," © 2005 VersionOne, LLC, 4 pages. |
| VersionOne, "Frequently Asked Questions," 2005, 4 pages, www.versionone.com. |
| VersionOne, "Simplify the Rollout of Agile Development within Your Organization," © 2007 VersionOne, LLC, 2 pages. |
| VersionOne, "Simplify the Rollout of Agile Development within Your Organization," 2006, 2 pages, www.versionone.com. |
| VersionOne, "Simplifying Software Delivery," © 2006 VersionOne, LLC, 1 page. |
| VersionOne, "Simplifying Software Delivery," 2006, 1 page, www.versionone.com. |
| VersionOne, Exhibit A and B, Figures 1 and 2, Oct. 19, 2006, 2 pages, http://www.versionone.com//product-planning.asp. |
| Xie, Qing, Developing cost-effective Model-Based Techniques for GUI Testing, 2006 ACM, pp. 997-1000, , 4 pgs. |
| Xie, Qing, Developing cost-effective Model-Based Techniques for GUI Testing, 2006 ACM, pp. 997-1000, <http://d1.acm.org/citation.cfm?id+1134473>, 4 pgs. |
| XPlanner How to Notes, May 10, 2005, 9 pages, http://www.xplanner.org. |
| Yu, A Versatile Development Process for Small to Large Projects Using IBM CMVC, delivery.acm.org/10.1145/790000/782260/p75-yu.pdf, 1994, 9 pgs. |
Cited By (21)
| Publication number | Priority date | Publication date | Assignee | Title |
|---|---|---|---|---|
| US10255066B2 (en) | 2012-08-17 | 2019-04-09 | Hartford Fire Insurance Company | System and method for monitoring software development and program flow |
| US20160299757A1 (en) * | 2012-08-17 | 2016-10-13 | Hartford Fire Insurance Company | System and method for monitoring software development and program flow |
| US9965272B2 (en) * | 2012-08-17 | 2018-05-08 | Hartford Fire Insurance Company | System and method for monitoring software development and program flow |
| US20160085520A1 (en) * | 2013-05-31 | 2016-03-24 | Huawei Technologies Co., Ltd. | Application Creation Method and Apparatus |
| US9720658B2 (en) * | 2013-05-31 | 2017-08-01 | Huawei Technologies, Co., Ltd. | Application creation method and apparatus |
| US11494180B2 (en) * | 2013-06-07 | 2022-11-08 | Capital One Services, Llc | Systems and methods for providing predictive quality analysis |
| US11068505B2 (en) * | 2013-12-02 | 2021-07-20 | Pankaj Sharma | System and method for generating and merging activity-entry reports utilizing activity-entry hierarchy and hierarchical information of the activity-entries |
| US10592533B2 (en) * | 2013-12-02 | 2020-03-17 | Pankaj Sharma | System and method for generating and merging activity-entry reports utilizing activity-entry hierarchy and hierarchical information of the activity-entries |
| US20150156232A1 (en) * | 2013-12-02 | 2015-06-04 | Pankaj Sharma | System and method for generating and merging activity-entry reports utilizing activity-entry hierarchy and hierarchical information of the activity-entries |
| US9954911B2 (en) * | 2013-12-02 | 2018-04-24 | Pankaj Sharma | System and method for generating and merging activity-entry reports utilizing activity-entry hierarchy and hierarchical information of the activity-entries |
| US10180900B2 (en) * | 2016-04-15 | 2019-01-15 | Red Hat Israel, Ltd. | Recordation of user interface events for script generation |
| US11354877B2 (en) | 2016-11-01 | 2022-06-07 | Dg Holdings, Inc. | Comparative virtual asset adjustment systems and methods |
| US11631229B2 (en) | 2016-11-01 | 2023-04-18 | Dg Holdings, Inc. | Comparative virtual asset adjustment systems and methods |
| US10930086B2 (en) * | 2016-11-01 | 2021-02-23 | Dg Holdings, Inc. | Comparative virtual asset adjustment systems and methods |
| US10127017B2 (en) * | 2016-11-17 | 2018-11-13 | Vmware, Inc. | Devops management |
| US20180322468A1 (en) * | 2017-05-05 | 2018-11-08 | Servicenow, Inc. | User interface for timesheet reporting |
| US10789575B2 (en) * | 2017-05-05 | 2020-09-29 | Servicenow, Inc. | User interface for timesheet reporting |
| AU2018217244A1 (en) * | 2017-08-14 | 2019-02-28 | Accenture Global Solutions Limited | Artificial intelligence and machine learning based product development |
| US11341439B2 (en) | 2017-08-14 | 2022-05-24 | Accenture Global Solutions Limited | Artificial intelligence and machine learning based product development |
| CN108345988A (en) * | 2018-01-22 | 2018-07-31 | 广州欧赛斯信息科技有限公司 | A kind of agile software co-development management system based on container platform |
| US11693702B2 (en) | 2020-04-01 | 2023-07-04 | The Toronto-Dominion Bank | Systems and methods for managing usage of computing resources |
Similar Documents
| Publication | Publication Date | Title |
|---|---|---|
| US9690461B2 (en) | Integrated planning environment for agile software development | |
| US8370803B1 (en) | Asset templates for agile software development | |
| US9501751B1 (en) | Virtual interactive taskboard for tracking agile software development | |
| US9858069B2 (en) | Transitioning between iterations in agile software development | |
| US9292809B2 (en) | Customized settings for viewing and editing assets in agile software development | |
| US8813040B2 (en) | Methods and systems for reporting on build runs in software development | |
| US8875088B1 (en) | Methods and systems for performing project schedule forecasting | |
| US9092575B2 (en) | System and method for providing access to data in a plurality of software development systems | |
| US6678671B1 (en) | System for linking a resource management system with an event of a project in a project management system and a method therefor | |
| US8296170B2 (en) | Process management system and method | |
| US7143100B2 (en) | Method, system and program product for viewing and manipulating graphical objects representing hierarchically arranged elements of a modeled environment | |
| CA2620730C (en) | Method and system for managing a plurality of processes or tasks | |
| US9576263B2 (en) | Contextualized report building | |
| US8914267B2 (en) | Systems and methods for diagnosing production problems in oil field operations | |
| US20090288030A1 (en) | System and method for task management | |
| CA2776586C (en) | User interface for defining account dimension combinations | |
| CN101110025A (en) | Method and system for enabling and rendering business components in an interactive data visualization tool | |
| US20140278703A1 (en) | Enterprise resource management system and method | |
| US20100299170A1 (en) | Stages, Phases in a Project Workflow | |
| US20130006688A1 (en) | Creating a 3rd party team project story board | |
| US20130007694A1 (en) | Project story board to board communication tools | |
| US10025460B1 (en) | Systems and methods for displaying menu items | |
| Li | Jira Software Essentials: Plan, track, and release great applications with Jira Software | |
| CA2323268A1 (en) | A system for linking a booking of a resource with events of a project and a method therefor | |
| US20130006687A1 (en) | Creating a sub-story for a project story board |
Legal Events
| Date | Code | Title | Description |
|---|---|---|---|
| AS | Assignment |
Owner name: VERSIONONE, INC., GEORGIA Free format text: ASSIGNMENT OF ASSIGNORS INTEREST;ASSIGNORS:HOLLER, ROBERT, MR.;CULLING, IAN, MR.;DELWADIA, RAJIV, MR.;AND OTHERS;SIGNING DATES FROM 20080613 TO 20080627;REEL/FRAME:021179/0246 |
|
| AS | Assignment |
Owner name: SILICON VALLEY BANK, CALIFORNIA Free format text: SECURITY AGREEMENT;ASSIGNOR:VERSIONONE, INC.;REEL/FRAME:025940/0376 Effective date: 20101220 |
|
| STCF | Information on status: patent grant |
Free format text: PATENTED CASE |
|
| AS | Assignment |
Owner name: WELLS FARGO BANK, NATIONAL ASSOCIATION, AS AGENT, Free format text: SECURITY INTEREST;ASSIGNORS:COLLABNET, INC.;VERSIONONE, INC.;REEL/FRAME:043187/0691 Effective date: 20170803 |
|
| AS | Assignment |
Owner name: VERSIONONE, INC., GEORGIA Free format text: RELEASE BY SECURED PARTY;ASSIGNOR:SILICON VALLEY BANK;REEL/FRAME:043194/0989 Effective date: 20170803 |
|
| AS | Assignment |
Owner name: VERSIONONE, INC., GEORGIA Free format text: RELEASE BY SECURED PARTY;ASSIGNOR:WELLS FARGO BANK, NATIONAL ASSOCIATION, AS AGENT;REEL/FRAME:050626/0164 Effective date: 20191004 Owner name: COLLABNET, INC., CALIFORNIA Free format text: RELEASE BY SECURED PARTY;ASSIGNOR:WELLS FARGO BANK, NATIONAL ASSOCIATION, AS AGENT;REEL/FRAME:050626/0164 Effective date: 20191004 |
|
| MAFP | Maintenance fee payment |
Free format text: PAYMENT OF MAINTENANCE FEE, 4TH YR, SMALL ENTITY (ORIGINAL EVENT CODE: M2551); ENTITY STATUS OF PATENT OWNER: SMALL ENTITY Year of fee payment: 4 |
|
| AS | Assignment |
Owner name: MIDCAP FINANCIAL TRUST, MARYLAND Free format text: SECURITY INTEREST;ASSIGNORS:VERSIONONE, INC.;DIGITAL.AI SOFTWARE, INC.;ARXAN TECHNOLOGIES, INC.;AND OTHERS;REEL/FRAME:055277/0043 Effective date: 20210210 |
|
| AS | Assignment |
Owner name: DIGITAL.AI SOFTWARE, INC., TEXAS Free format text: ASSIGNMENT OF ASSIGNORS INTEREST;ASSIGNOR:VERSIONONE, INC.;REEL/FRAME:055909/0209 Effective date: 20010407 |
|
| FEPP | Fee payment procedure |
Free format text: ENTITY STATUS SET TO UNDISCOUNTED (ORIGINAL EVENT CODE: BIG.); ENTITY STATUS OF PATENT OWNER: LARGE ENTITY |
|
| MAFP | Maintenance fee payment |
Free format text: PAYMENT OF MAINTENANCE FEE, 8TH YEAR, LARGE ENTITY (ORIGINAL EVENT CODE: M1552); ENTITY STATUS OF PATENT OWNER: LARGE ENTITY Year of fee payment: 8 |