CROSS-REFERENCE TO RELATED APPLICATIONS
This application is a divisional of U.S. patent application Ser. No. 13/391,858, filed Feb. 23, 2012, which in turn is a 371 of PCT/JP2010/063122, filed Aug. 3, 2010, which claims the benefit of Japanese Patent Application No. 2009-193702, filed Aug. 24, 2009, the contents of each of which are incorporated herein by reference.
FIELD OF THE INVENTION
The present invention relates to detection and diagnosis of digestive organ cancer, gastric cancer, colorectal cancer, pancreatic cancer, and biliary tract cancer via gene expression analysis using peripheral blood as a material.
BACKGROUND OF THE INVENTION
Digestive organ cancer is the most common form of malignant tumor among the Japanese. According to a survey by the Ministry of Health, Labour and Welfare, 177,000 patients die annually. Early detection and treatment can result in complete healing. The earlier the stage of the lesions, the fewer clinical symptoms are presented. Hence, some digestive organ cancer cases are detected in an advanced state, resulting in a poor prognostic outcome.
Gastric cancer is the most common form of digestive system malignant tumor among the Japanese. According to a survey by the Ministry of Health, Labour and Welfare, 50,000 patients die annually. Also, colorectal cancer is the form of digestive system malignant tumor that ranks 3rd highest number in terms of deaths due to site-specific cancer (including both males and females) among the Japanese. According to a survey by the Ministry of Health, Labour and Welfare, 41,000 patients die annually. Both gastric cancer and colorectal cancer can be cured by early detection and treatment. The earlier the stage of the lesions, the fewer clinical symptoms are presented. Hence, some cases are detected in an advanced state, resulting in a poor prognostic outcome. Opportunities for early detection include many incidental detections by endoscopic examination and/or imaging studies upon examination and many detections during investigation of symptoms that are not directly associated with cancer. Currently, no hemodiagnosis marker useful for early detection of digestive organ cancer exists. It is extremely important to establish a system capable of diagnosing the presence of digestive organ cancer at as early a stage as possible.
In particular, pancreatic cancer is a form of digestive system malignant tumor that ranks the 5th highest in terms of the number of deaths due to site-specific cancer (including both males and females) among the Japanese. According to a survey by the Ministry of Health, Labour and Welfare, 23,000 patients die annually. Cancer detection is very difficult and early cancer detection is rare. 75% of cases diagnosed with pancreatic cancer are already inoperable cases. Pancreatic cancer is a digestive organ cancer resulting in extremely poor prognosis such that the patients die within 1 to 2 years after detection (According a survey by the Center for Cancer Control and Information Services, National Cancer Center, http, colon, forward slash, forward slash, ganjoho, dot, jp, forward slash, public, forward slash, cancer, forward slash, data, forward slash, pancreas, dot, html). Although an advanced diagnostic technique for pancreatic cancer has long been desired, no useful early diagnosis method has been established.
Furthermore, biliary tract cancer is a form of malignant tumor that ranks 6th highest in terms of the number of deaths due to site-specific cancer (including both males and females) among the Japanese. According to a survey by the Ministry of Health, Labour and Welfare, 15,000 patients die annually. In most cases, early detection is difficult because of the lack of subjective symptoms.
Recent development in DNA microarray techniques and human genome sequencing have enabled extensive gene expression analysis of all genes. Accordingly, new types of cancer diagnosis, prognostic prediction, prediction of recurrence rate after treatment, and the like have become possible. The present inventors have analyzed the pathological conditions of various diseases and developed for the purpose of developing a diagnostic tool through application of gene expression analysis such as analysis of gene expression profiles in chronic hepatitis patients (see non-patent documents 1 to 3) and gene expression analysis of liver tissue in diabetes mellitus patients. However, these forms of analysis are problematic in terms of their excessive invasiveness, and hospitalization and tissue (organ tissue such as liver tissue) sampling are required. Thereafter, a method requiring less invasiveness has been reported, wherein a gene group capable of distinguishing type C cirrhosis from type C liver cancer and peripheral blood mononuclear cells are used (see patent document 1 and non-patent document 4). This method is advantageous for patients because blood is used in this method and thus it offers a low degree of invasiveness for patients. However, the method is problematic in that collection of peripheral blood mononuclear cells requires several separation processes, the method is complicated as an actual test method, and the method requires much time for the test results to be obtained.
PRIOR ART DOCUMENTS
Patent Document
- Patent document 1 JP Patent Publication (Kokai) No. 2008-126 A
Non-Patent Documents
- Non-patent document 1 MASAO HONDA et al., GASTROENTEROLOGY 2001; 120:955-966
- Non-patent document 2 MASAO HONDA et al., Am J Gastroenterol 2005; 100: 2019-2030
- Non-patent document 3 YUKIHIRO SHIROTA et al., HEPATOLOGY Vol. 33, No. 4, 2001, 832-840
- Non-patent document 4 YOSHIO SAKAI et al., Cancer Research; 68 (24) 2008. 10267-10279
SUMMARY OF THE INVENTION
Problem to be Solved by the Invention
An object of the present invention is to provide:
a method for detecting digestive organ cancer, gastric cancer, colorectal cancer, pancreatic cancer, and biliary tract cancer by analyzing genes with expression levels that vary in association with digestive organ cancer, gastric cancer, colorectal cancer, pancreatic cancer, and biliary tract cancer, whereby invasiveness to patients is low and genes can be easily extracted from patients; and
an in vitro diagnostic.
Means for Solving the Problem
The present inventors have initiated clinical trials to verify if digestive organ cancer, gastric cancer, colorectal cancer, pancreatic cancer, and biliary tract cancer can be diagnosed by gene expression analysis using peripheral blood, and thus found that such diagnosis is possible.
Peripheral blood can be collected in a manner that requires a relatively low degree of invasiveness, and thus its practicality and usefulness in clinical examination are extremely high. Peripheral blood is composed of cell components including, in addition to erythrocytes and blood platelets, leukocytes containing lymphocytes, monocytes, and granulocytes. These cell components are thought to vary their phenotypes and functions depending on lesions in an in vivo environment.
The present inventors have conducted gene expression analysis of peripheral blood from 24 digestive organ cancer patients and 8 normal healthy subjects. Specifically, they have found that digestive organ cancer cases can be distinguished from normal healthy subjects by clustering analysis conducted using data from analysis with about 23,000 probes on DNA microarrays. Through comparison of the gene expression of a group of digestive organ cancer cases with that of a group of normal healthy subjects, 868 probes corresponding to genes with expression levels that differ significantly between the groups were found. With the use of the probe set, hierarchical clustering was performed for the above digestive organ cancer case group and the above normal healthy subject group, so that 2 clusters were formed. Thus the present inventors have found that the digestive organ cancer cases can be distinguished from the normal healthy subjects. Also, a prediction model was applied to 40 cancer cases and 13 normal healthy subject cases (differing from the cancer cases and the normal healthy subjects used for extraction of 868 probes), so that cancer cases and normal healthy subjects were determined. As a result, 39 out of 40 previously diagnosed cancer cases were determined to be actually cancer cases, and the probability that such cases had been properly diagnosed was 97.5%. Moreover, 9 out of 13 previously diagnosed normal healthy subject cases were determined to be normal healthy subject cases, and the probability that such cases had been properly diagnosed was 69.2%. The percentage of cases correctly determined was 90.6% (48/53).
Furthermore, the present inventors have conducted gene expression analysis of peripheral blood from 39 digestive organ cancer patients and peripheral blood from 15 normal healthy subjects. Specifically, they have found that digestive organ cancer cases can be distinguished from normal healthy subjects by clustering analysis conducted using data from analysis with about 23,000 probes on DNA microarrays. Through comparison of the gene expression of a group of digestive organ cancer cases with that of a group of normal healthy subjects, 25 probes corresponding to genes with expression levels that differ significantly between the groups were found. With the use of the probe set, hierarchical clustering was performed for the above digestive organ cancer case group and the above normal healthy subject group, so that 2 clusters were formed. Thus the present inventors have found that the digestive organ cancer cases can be distinguished from the normal healthy subjects.
As a result of the use of the above probes, the percentage of cases correctly determined was 92.3%.
Also, the present inventors have conducted gene expression analysis of peripheral blood from 8 gastric cancer patients and 8 normal healthy subjects. Specifically, they have found that gastric cancer cases can be distinguished from normal healthy subjects by clustering analysis conducted using data from analysis with about 22,000 probes on DNA microarrays. Through comparison of the gene expression of a group of gastric cancer cases with that of a group of normal healthy subjects, 713 probes corresponding to genes with expression levels that differ significantly between the groups were found. With the use of the probe set, hierarchical clustering was performed for the above gastric cancer case group and the above normal healthy subject group, so that 2 clusters were formed. Thus the present inventors have found that the gastric cancer cases can be distinguished from the normal healthy subjects. Also, a prediction model was applied to 10 cancer cases and 13 normal healthy subject cases (differing from the cancer cases and the normal healthy subjects used for extraction of 713 probes), so that cancer cases and normal healthy subjects were determined. As a result, 7 out of 10 previously diagnosed cancer cases were determined to be actually cancer cases, and the probability that such cases had been properly diagnosed was 70%. Moreover, 13 out of 13 previously diagnosed normal healthy subject cases were determined to be normal healthy subject cases, and the probability that such cases had been properly diagnosed was 100%. The percentage of cases correctly determined was 87.0% (20/23).
The present inventors have conducted gene expression analysis of peripheral blood from 8 colorectal cancer patients and 8 normal healthy subjects. Specifically, they have found that colorectal cancer cases can be distinguished from normal healthy subjects by clustering analysis conducted using data from analysis with about 22,000 probes on DNA microarrays. Through comparison of the gene expression of a group of colorectal cancer cases with that of a group of normal healthy subjects, 771 probes corresponding to genes with expression levels that differ significantly between the groups were found. With the use of the probe set, hierarchical clustering was performed for the above colorectal cancer case group and the above normal healthy subject group, so that 2 clusters were formed. Thus, colorectal cancer cases were distinguished from the normal healthy subjects. Also, a prediction model was applied to 10 cancer cases and 13 normal healthy subject cases (differing from the cancer cases and the normal healthy subjects used for extraction of 771 probes), so that cancer cases and normal healthy subjects are determined. As a result, 9 out of 10 previously diagnosed cancer cases were determined to be actually cancer cases, and the probability that such cases had been properly diagnosed was 90%. Moreover, 13 out of 13 previously diagnosed normal healthy subject cases were determined to be normal healthy subject cases, and the probability that such cases had been properly diagnosed was 100%. The percentage of cases correctly determined was 95.7% (22/23).
The present inventors have conducted gene expression analysis of peripheral blood from 8 pancreatic cancer patients and 8 normal healthy subjects. Specifically, they have found that pancreatic cancer cases can be distinguished from normal healthy subjects by clustering analysis conducted using data from analysis with about 22,000 probes on DNA microarrays. Through comparison of the gene expression of a group of pancreatic cancer cases with that of a group of normal healthy subjects, 677 probes corresponding to genes with expression levels that differ significantly between the groups were found. With the use of the probe set, hierarchical clustering was performed for the above pancreatic cancer case group and the above normal healthy subject group, so that 2 clusters were formed. Thus the present inventors have found that pancreatic cancer cases can be distinguished from the normal healthy subjects. Also, a prediction model was applied to 20 cancer cases and 13 normal healthy subject cases (differing from the cancer cases and the normal healthy subjects used for extraction of 677 probes), so that cancer cases and normal healthy subjects were determined. As a result, 15 out of 20 previously diagnosed cancer cases were determined to be actually cancer cases, and the probability that such cases had been properly diagnosed was 75%. Moreover, 13 out of 13 previously diagnosed normal healthy subject cases were determined to be normal healthy subject cases, and the probability that such cases had been properly diagnosed was 100%. The percentage of cases correctly determined was 84.8% (28/33).
The present inventors have conducted gene expression analysis of peripheral blood from 8 biliary tract cancer patients and 8 normal healthy subjects. Specifically, they have found that biliary tract cancer cases can be distinguished from normal healthy subjects by clustering analysis conducted (to form 3 clusters) using data from analysis with about 22,000 probes on DNA microarrays. Through comparison of the gene expression of a group of biliary tract cancer cases with that of a group of normal healthy subjects, 363 probes corresponding to genes with expression levels that differ significantly between the groups were found. With the use of the probe set, hierarchical clustering was performed for the above biliary tract cancer case group and the above normal healthy subject group, so that 2 clusters were formed. Thus the present inventors have found that the biliary tract cancer cases can be distinguished from the normal healthy subjects. Also, a prediction model was applied to 8 cancer cases and 13 normal healthy subject cases (differing from the cancer cases and the normal healthy subjects used for extraction of 363 probes), so that cancer cases and normal healthy subjects were determined. As a result, 8 out of 8 previously diagnosed cancer cases were determined to be actually cancer cases, and the probability that such cases had been properly diagnosed was 100%. Moreover, 13 out of 13 previously diagnosed normal healthy subject cases were determined to be normal healthy subject cases, and the probability that such cases had been properly diagnosed was 100%. The percentage of cases correctly determined was 100% (21/21).
Based on these results, it was found that examination of changes in expression of the gene set in peripheral blood enables diagnosis of digestive organ cancer, gastric cancer, colorectal cancer, pancreatic cancer, and biliary tract cancer. Thus, the present invention was completed. The method of the present invention enables preparation of a new practical diagnostic kit for diagnosis of digestive organ cancer by applying a DNA microarray developmental technique, a real-time PCR method, and an ELISA method.
Currently, general tumor markers covered by health insurance are not always useful for all digestive organ cancer patients. However, the detection sensitivity of the gene expression analysis of the present invention is 90.6%, allowing digestive organ cancer to be specified with very high detection sensitivity through convenient blood collection.
Specifically, the present invention is as follows.
[1] A reagent for detecting digestive organ cancer by measuring the expression of genes corresponding to probes consisting of nucleotide sequences shown in SEQ ID NO: 220, 506, 508, 523, 538, 554, 570, 589, 597, 602, 618, 654, 689, 701, 726, 744, 762, 763, 781, 795, and 849 in peripheral blood, wherein the reagent contains all probes consisting of the nucleotide sequences shown in SEQ ID NOs: 220, 506, 508, 523, 538, 554, 570, 589, 597, 602, 618, 654, 689, 701, 726, 744, 762, 763, 781, 795, and 849; or
a reagent for detecting digestive organ cancer by measuring the expression of genes corresponding to probes consisting of the nucleotide sequences shown in SEQ ID NOs: 3030 to 3054 in peripheral blood, wherein the reagent contains all probes consisting of the nucleotide sequences shown in SEQ ID NOs: 3030 to 3054.
[2] The reagent for detecting digestive organ cancer according to [1], containing a DNA microarray in which the probes of [1] bind to a substrate.
[3] A method for detecting digestive organ cancer, comprising obtaining the gene expression profiles of all genes corresponding to probes consisting of the nucleotide sequences shown in SEQ ID NOs: 220, 506, 508, 523, 538, 554, 570, 589, 597, 602, 618, 654, 689, 701, 726, 744, 762, 763, 781, 795, and 849 in peripheral blood from a subject, or all genes corresponding to probes consisting of the nucleotide sequences shown in SEQ ID NOs: 3030 to 3054 in peripheral blood from a subject and then detecting digestive organ cancer based on the expression profiles.
[4] A reagent for detecting gastric cancer by measuring the expression of genes corresponding to probes consisting of the nucleotide sequences shown in SEQ ID NOs: 923, 927, 929, 932, 946, 952, 986, 998, 1000, 1006, 1007, 1013, 1019, 1020, 1022, 1027, 1039, 1046, 1073, 1090, 1107, 1108, 1117, 1121, 1132, 1134, 1154, 1162, 1179, 1183, 1191, 1205, 1207, 1211, 1216, 1217, 1224, 1239, 1244, 1251, 1254, 1255, 1283, 1285, 1301, 1304, 1316, 1317, 1327, 1328, 1331, 1332, 1345, 1359, 1365, 1366, 1372, 1373, 1375, 1379, 1380, 1382, 1383, 1393, 1394, 1396, 1397, 1404, 1405, 1406, 1407, 1421, 1423, 1426, 1430, 1440, 1441, 1442, 1448, 1450, 1454, 1455, 1456, 1459, 1466, 1467, 1491, 1497, 1500, 1502, 1504, 1508, 1513, 1514, 1519, 1531, 1534, 1544, 1546, 1549, 1551, 1560, 1563, 1566, 1570, 1571, and 1578 in peripheral blood, wherein the reagent contains all probes consisting of the nucleotide sequences shown in SEQ ID NO: 923, 927, 929, 932, 946, 952, 986, 998, 1000, 1006, 1007, 1013, 1019, 1020, 1022, 1027, 1039, 1046, 1073, 1090, 1107, 1108, 1117, 1121, 1132, 1134, 1154, 1162, 1179, 1183, 1191, 1205, 1207, 1211, 1216, 1217, 1224, 1239, 1244, 1251, 1254, 1255, 1283, 1285, 1301, 1304, 1316, 1317, 1327, 1328, 1331, 1332, 1345, 1359, 1365, 1366, 1372, 1373, 1375, 1379, 1380, 1382, 1383, 1393, 1394, 1396, 1397, 1404, 1405, 1406, 1407, 1421, 1423, 1426, 1430, 1440, 1441, 1442, 1448, 1450, 1454, 1455, 1456, 1459, 1466, 1467, 1491, 1497, 1500, 1502, 1504, 1508, 1513, 1514, 1519, 1531, 1534, 1544, 1546, 1549, 1551, 1560, 1563, 1566, 1570, 1571, and 1578.
[5] The reagent for detecting gastric cancer according to [4], containing a DNA microarray in which the probes of [4] bind to a substrate.
[6] A method for detecting gastric cancer, comprising obtaining the gene expression profiles of all genes corresponding to probes consisting of the nucleotide sequences shown in SEQ ID NOs: 923, 927, 929, 932, 946, 952, 986, 998, 1000, 1006, 1007, 1013, 1019, 1020, 1022, 1027, 1039, 1046, 1073, 1090, 1107, 1108, 1117, 1121, 1132, 1134, 1154, 1162, 1179, 1183, 1191, 1205, 1207, 1211, 1216, 1217, 1224, 1239, 1244, 1251, 1254, 1255, 1283, 1285, 1301, 1304, 1316, 1317, 1327, 1328, 1331, 1332, 1345, 1359, 1365, 1366, 1372, 1373, 1375, 1379, 1380, 1382, 1383, 1393, 1394, 1396, 1397, 1404, 1405, 1406, 1407, 1421, 1423, 1426, 1430, 1440, 1441, 1442, 1448, 1450, 1454, 1455, 1456, 1459, 1466, 1467, 1491, 1497, 1500, 1502, 1504, 1508, 1513, 1514, 1519, 1531, 1534, 1544, 1546, 1549, 1551, 1560, 1563, 1566, 1570, 1571, and 1578 in peripheral blood from a subject and then detecting gastric cancer based on the expression profiles.
[7] A reagent for detecting colorectal cancer by measuring the expression of genes corresponding to probes consisting of the nucleotide sequences shown in SEQ ID NOs: 1583, 1601, 1611, 1614, 1644, 1651, 1678, 1680, 1684, 1737, 1746, 1750, 1751, 1757, 1760, 1765, 1766, 1773, 1778, 1779, 1780, 1782, 1787, 1794, 1795, 1798, 1802, 1831, 1836, 1837, 1853, 1854, 1869, 1871, 1873, 1876, 1880, 1890, 1892, 1896, 1925, 1942, 1950, 1953, 1962, 1970, 1977, 1978, 1985, 1990, 1991, 2000, 2004, 2007, 2011, 2018, 2019, 2023, 2032, 2046, 2050, 2054, 2077, 2085, 2088, 2095, 2105, 2126, 2128, 2132, 2138, 2140, 2143, 2144, 2145, 2147, 2158, 2160, 2161, 2173, 2175, 2176, 2180, 2191, 2193, 2198, 2207, 2209, 2213, 2217, 2218, 2223, 2227, 2233, 2247, 2255, 2257, 2258, 2261, 2266, 2268, 2269, 2273, 2280, 2286, 2296, 2306, 2317, 2320, 2322, 2325, 2332, 2334, 2336, 2339, and 2340, wherein the reagent contains all probes consisting of the nucleotide sequences shown in SEQ ID NOs: 1583, 1601, 1611, 1614, 1644, 1651, 1678, 1680, 1684, 1737, 1746, 1750, 1751, 1757, 1760, 1765, 1766, 1773, 1778, 1779, 1780, 1782, 1787, 1794, 1795, 1798, 1802, 1831, 1836, 1837, 1853, 1854, 1869, 1871, 1873, 1876, 1880, 1890, 1892, 1896, 1925, 1942, 1950, 1953, 1962, 1970, 1977, 1978, 1985, 1990, 1991, 2000, 2004, 2007, 2011, 2018, 2019, 2023, 2032, 2046, 2050, 2054, 2077, 2085, 2088, 2095, 2105, 2126, 2128, 2132, 2138, 2140, 2143, 2144, 2145, 2147, 2158, 2160, 2161, 2173, 2175, 2176, 2180, 2191, 2193, 2198, 2207, 2209, 2213, 2217, 2218, 2223, 2227, 2233, 2247, 2255, 2257, 2258, 2261, 2266, 2268, 2269, 2273, 2280, 2286, 2296, 2306, 2317, 2320, 2322, 2325, 2332, 2334, 2336, 2339, and 2340.
[8] The reagent for detecting colorectal cancer according to [7], containing a DNA microarray in which the probes of [7] bind to a substrate.
[9] A method for detecting colorectal cancer, comprising obtaining the gene expression profiles of all genes corresponding to probes consisting of the nucleotide sequences shown in SEQ ID NOs: 1583, 1601, 1611, 1614, 1644, 1651, 1678, 1680, 1684, 1737, 1746, 1750, 1751, 1757, 1760, 1765, 1766, 1773, 1778, 1779, 1780, 1782, 1787, 1794, 1795, 1798, 1802, 1831, 1836, 1837, 1853, 1854, 1869, 1871, 1873, 1876, 1880, 1890, 1892, 1896, 1925, 1942, 1950, 1953, 1962, 1970, 1977, 1978, 1985, 1990, 1991, 2000, 2004, 2007, 2011, 2018, 2019, 2023, 2032, 2046, 2050, 2054, 2077, 2085, 2088, 2095, 2105, 2126, 2128, 2132, 2138, 2140, 2143, 2144, 2145, 2147, 2158, 2160, 2161, 2173, 2175, 2176, 2180, 2191, 2193, 2198, 2207, 2209, 2213, 2217, 2218, 2223, 2227, 2233, 2247, 2255, 2257, 2258, 2261, 2266, 2268, 2269, 2273, 2280, 2286, 2296, 2306, 2317, 2320, 2322, 2325, 2332, 2334, 2336, 2339, and 2340 in peripheral blood from a subject and then detecting colorectal cancer based on the gene expression profiles.
[10] A reagent for detecting pancreatic cancer by measuring the expression of genes corresponding to probes consisting of the nucleotide sequences shown in SEQ ID NOs: 2373, 2404, 2418, 2419, 2426, 2430, 2459, 2461, 2469, 2475, 2507, 2514, 2515, 2525, 2543, 2600, 2602, 2621, 2628, 2634, 2640, 2651, 2652, 2674, 2677, 2680, 2681, 2691, 2692, 2700, 2714, 2715, 2719, 2723, 2724, 2738, 2740, 2746, 2748, 2763, 2778, 2781, 2815, 2818, 2823, 2842, 2857, 2861, 2885, 2898, 2902, 2903, 2932, 2934, 2972, 2975, 2982, 2985, 2999, 3001, and 3003, wherein the reagent contains all probes consisting of the nucleotide sequences shown in SEQ ID NO: 2373, 2404, 2418, 2419, 2426, 2430, 2459, 2461, 2469, 2475, 2507, 2514, 2515, 2525, 2543, 2600, 2602, 2621, 2628, 2634, 2640, 2651, 2652, 2674, 2677, 2680, 2681, 2691, 2692, 2700, 2714, 2715, 2719, 2723, 2724, 2738, 2740, 2746, 2748, 2763, 2778, 2781, 2815, 2818, 2823, 2842, 2857, 2861, 2885, 2898, 2902, 2903, 2932, 2934, 2972, 2975, 2982, 2985, 2999, 3001, and 3003.
[11] The reagent for detecting pancreatic cancer according to [10], containing a DNA microarray in which the probes of [10] bind to a substrate.
[12] A method for detecting pancreatic cancer, comprising obtaining the gene expression profiles of all genes corresponding to probes consisting of the nucleotide sequences shown in SEQ ID NOs: 2373, 2404, 2418, 2419, 2426, 2430, 2459, 2461, 2469, 2475, 2507, 2514, 2515, 2525, 2543, 2600, 2602, 2621, 2628, 2634, 2640, 2651, 2652, 2674, 2677, 2680, 2681, 2691, 2692, 2700, 2714, 2715, 2719, 2723, 2724, 2738, 2740, 2746, 2748, 2763, 2778, 2781, 2815, 2818, 2823, 2842, 2857, 2861, 2885, 2898, 2902, 2903, 2932, 2934, 2972, 2975, 2982, 2985, 2999, 3001, and 3003 in peripheral blood from a subject and detecting pancreatic cancer based on the expression profiles.
[13] A reagent for detecting biliary tract cancer by measuring the expression of genes corresponding to probes consisting of the nucleotide sequences shown in SEQ ID NOs: 3055 to 3417, which contains all probes consisting of the nucleotide sequences shown in SEQ ID NOs: 3055 to 3417.
[14] The reagent for detecting biliary tract cancer according to [13], containing a DNA microarray in which the probes of [13] bind to a substrate.
[15] A method for detecting biliary tract cancer, comprising obtaining the gene expression profiles of all genes corresponding to probes consisting of the nucleotide sequences shown in SEQ ID NOs: 3055 to 3417 in peripheral blood from a subject, and then detecting biliary tract cancer based on the expression profiles.
This description includes the disclosure of the description and drawings of Japanese Patent Application No. 2009-193702, from which the present application claims priority.
Effects of the Invention
The expression levels of the genes corresponding to the probes of the present invention vary among digestive organ cancer, gastric cancer, colorectal cancer, pancreatic cancer, and biliary tract cancer. Through analysis of the expression profiles of these genes, digestive organ cancer, gastric cancer, colorectal cancer, pancreatic cancer, or biliary tract cancer can be detected. Furthermore, a risk of developing digestive organ cancer, gastric cancer, colorectal cancer, pancreatic cancer, or biliary tract cancer can be predicted, for example.
BRIEF DESCRIPTION OF THE DRAWINGS
FIG. 1-1 shows 868 probes of a 1st probe group that can be used for detection of digestive organ cancer.
FIG. 1-2 shows 868 probes that can be used for detection of digestive organ cancer (continuation).
FIG. 1-3 shows 868 probes that can be used for detection of digestive organ cancer (continuation).
FIG. 1-4 shows 868 probes that can be used for detection of digestive organ cancer (continuation).
FIG. 1-5 shows 868 probes that can be used for detection of digestive organ cancer (continuation).
FIG. 1-6 shows 868 probes that can be used for detection of digestive organ cancer (continuation).
FIG. 1-7 shows 868 probes that can be used for detection of digestive organ cancer (continuation).
FIG. 1-8 shows 868 probes that can be used for detection of digestive organ cancer (continuation).
FIG. 1-9 shows 868 probes that can be used for detection of digestive organ cancer (continuation).
FIG. 1-10 shows 868 probes that can be used for detection of digestive organ cancer (continuation).
FIG. 1-11 shows 868 probes that can be used for detection of digestive organ cancer (continuation).
FIG. 1-12 shows 868 probes that can be used for detection of digestive organ cancer (continuation).
FIG. 1-13 shows 868 probes that can be used for detection of digestive organ cancer (continuation).
FIG. 1-14 shows 868 probes that can be used for detection of digestive organ cancer (continuation).
FIG. 1-15 shows 868 probes that can be used for detection of digestive organ cancer (continuation).
FIG. 1-16 shows 868 probes that can be used for detection of digestive organ cancer (continuation).
FIG. 1-17 shows 868 probes that can be used for detection of digestive organ cancer (continuation).
FIG. 1-18 shows 868 probes that can be used for detection of digestive organ cancer (continuation).
FIG. 1-19 shows 868 probes that can be used for detection of digestive organ cancer (continuation).
FIG. 1-20 shows 868 probes that can be used for detection of digestive organ cancer (continuation).
FIG. 1-21 shows 868 probes that can be used for detection of digestive organ cancer (continuation).
FIG. 1-22 shows 868 probes that can be used for detection of digestive organ cancer (continuation).
FIG. 1-23 shows 868 probes that can be used for detection of digestive organ cancer (continuation).
FIG. 1-24 shows 868 probes that can be used for detection of digestive organ cancer (continuation).
FIG. 1-25 shows 868 probes that can be used for detection of digestive organ cancer (continuation).
FIG. 1-26 shows 868 probes that can be used for detection of digestive organ cancer (continuation).
FIG. 1-27 shows 868 probes that can be used for detection of digestive organ cancer (continuation).
FIG. 1-28 shows 868 probes that can be used for detection of digestive organ cancer (continuation).
FIG. 1-29 shows 868 probes that can be used for detection of digestive organ cancer (continuation).
FIG. 1-30 shows 868 probes that can be used for detection of digestive organ cancer (continuation).
FIG. 1-31 shows 868 probes that can be used for detection of digestive organ cancer (continuation).
FIG. 1-32 shows 868 probes that can be used for detection of digestive organ cancer (continuation).
FIG. 1-33 shows 868 probes that can be used for detection of digestive organ cancer (continuation).
FIG. 1-34 shows 868 probes that can be used for detection of digestive organ cancer (continuation).
FIG. 1-35 shows 868 probes that can be used for detection of digestive organ cancer (continuation).
FIG. 1-36 shows 868 probes that can be used for detection of digestive organ cancer (continuation).
FIG. 1-37 shows 868 probes that can be used for detection of digestive organ cancer (continuation).
FIG. 1-38 shows 868 probes that can be used for detection of digestive organ cancer (continuation).
FIG. 1-39 shows 868 probes that can be used for detection of digestive organ cancer (continuation).
FIG. 1-40 shows 868 probes that can be used for detection of digestive organ cancer (continuation).
FIG. 1-41 shows 868 probes that can be used for detection of digestive organ cancer (continuation).
FIG. 1-42 shows 868 probes that can be used for detection of digestive organ cancer (continuation).
FIG. 1-43 shows 868 probes that can be used for detection of digestive organ cancer (continuation).
FIG. 1-44 shows 868 probes that can be used for detection of digestive organ cancer (continuation).
FIG. 1-45 shows 868 probes that can be used for detection of digestive organ cancer (continuation).
FIG. 1-46 shows 868 probes that can be used for detection of digestive organ cancer (continuation).
FIG. 1-47 shows 868 probes that can be used for detection of digestive organ cancer (continuation).
FIG. 1-48 shows 868 probes that can be used for detection of digestive organ cancer (continuation).
FIG. 2 shows 21 probes with expression levels that differed significantly particularly between digestive organ cancer patients and normal healthy subjects, from among the 868 probes shown in FIG. 1.
FIG. 3-1 shows 713 probes that can be used for detection of gastric cancer.
FIG. 3-2 shows 713 probes that can be used for detection of gastric cancer (continuation).
FIG. 3-3 shows 713 probes that can be used for detection of gastric cancer (continuation).
FIG. 3-4 shows 713 probes that can be used for detection of gastric cancer (continuation).
FIG. 3-5 shows 713 probes that can be used for detection of gastric cancer (continuation).
FIG. 3-6 shows 713 probes that can be used for detection of gastric cancer (continuation).
FIG. 3-7 shows 713 probes that can be used for detection of gastric cancer (continuation).
FIG. 3-8 shows 713 probes that can be used for detection of gastric cancer (continuation).
FIG. 3-9 shows 713 probes that can be used for detection of gastric cancer (continuation).
FIG. 3-10 shows 713 probes that can be used for detection of gastric cancer (continuation).
FIG. 3-11 shows 713 probes that can be used for detection of gastric cancer (continuation).
FIG. 3-12 shows 713 probes that can be used for detection of gastric cancer (continuation).
FIG. 3-13 shows 713 probes that can be used for detection of gastric cancer (continuation).
FIG. 3-14 shows 713 probes that can be used for detection of gastric cancer (continuation).
FIG. 3-15 shows 713 probes that can be used for detection of gastric cancer (continuation).
FIG. 3-16 shows 713 probes that can be used for detection of gastric cancer (continuation).
FIG. 3-17 shows 713 probes that can be used for detection of gastric cancer (continuation).
FIG. 3-18 shows 713 probes that can be used for detection of gastric cancer (continuation).
FIG. 3-19 shows 713 probes that can be used for detection of gastric cancer (continuation).
FIG. 3-20 shows 713 probes that can be used for detection of gastric cancer (continuation).
FIG. 3-21 shows 713 probes that can be used for detection of gastric cancer (continuation).
FIG. 3-22 shows 713 probes that can be used for detection of gastric cancer (continuation).
FIG. 3-23 shows 713 probes that can be used for detection of gastric cancer (continuation).
FIG. 3-24 shows 713 probes that can be used for detection of gastric cancer (continuation).
FIG. 3-25 shows 713 probes that can be used for detection of gastric cancer (continuation).
FIG. 3-26 shows 713 probes that can be used for detection of gastric cancer (continuation).
FIG. 3-27 shows 713 probes that can be used for detection of gastric cancer (continuation).
FIG. 3-28 shows 713 probes that can be used for detection of gastric cancer (continuation).
FIG. 3-29 shows 713 probes that can be used for detection of gastric cancer (continuation).
FIG. 3-30 shows 713 probes that can be used for detection of gastric cancer (continuation).
FIG. 3-31 shows 713 probes that can be used for detection of gastric cancer (continuation).
FIG. 3-32 shows 713 probes that can be used for detection of gastric cancer (continuation).
FIG. 3-33 shows 713 probes that can be used for detection of gastric cancer (continuation).
FIG. 3-34 shows 713 probes that can be used for detection of gastric cancer (continuation).
FIG. 3-35 shows 713 probes that can be used for detection of gastric cancer (continuation).
FIG. 3-36 shows 713 probes that can be used for detection of gastric cancer (continuation).
FIG. 3-37 shows 713 probes that can be used for detection of gastric cancer (continuation).
FIG. 3-38 shows 713 probes that can be used for detection of gastric cancer (continuation).
FIG. 3-39 shows 713 probes that can be used for detection of gastric cancer (continuation).
FIG. 4-1 shows 107 probes with expression levels that differed significantly particularly between gastric cancer patients and normal healthy subjects, from among 713 probes shown in FIG. 3.
FIG. 4-2 shows 107 probes with expression levels that differed significantly particularly between gastric cancer patients and normal healthy subjects, from among the 713 probes shown in FIG. 3 (continuation).
FIG. 4-3 shows 107 probes with expression levels that differed significantly particularly between gastric cancer patients and normal healthy subjects, from among the 713 probes shown in FIG. 3 (continuation).
FIG. 4-4 shows 107 probes with expression levels that differed significantly particularly between gastric cancer patients and normal healthy subjects, from among the 713 probes shown in FIG. 3 (continuation).
FIG. 4-5 shows 107 probes with expression levels that differed significantly particularly between gastric cancer patients and normal healthy subjects, from among the 713 probes shown in FIG. 3 (continuation).
FIG. 4-6 shows 107 probes with expression levels that differed significantly particularly between gastric cancer patients and normal healthy subjects, from among the 713 probes shown in FIG. 3 (continuation).
FIG. 5-1 shows 771 probes that can be used for detection of colorectal cancer.
FIG. 5-2 shows 771 probes that can be used for detection of colorectal cancer (continuation).
FIG. 5-3 shows 771 probes that can be used for detection of colorectal cancer (continuation).
FIG. 5-4 shows 771 probes that can be used for detection of colorectal cancer (continuation).
FIG. 5-5 shows 771 probes that can be used for detection of colorectal cancer (continuation).
FIG. 5-6 shows 771 probes that can be used for detection of colorectal cancer (continuation).
FIG. 5-7 shows 771 probes that can be used for detection of colorectal cancer (continuation).
FIG. 5-8 shows 771 probes that can be used for detection of colorectal cancer (continuation).
FIG. 5-9 shows 771 probes that can be used for detection of colorectal cancer (continuation).
FIG. 5-10 shows 771 probes that can be used for detection of colorectal cancer (continuation).
FIG. 5-11 shows 771 probes that can be used for detection of colorectal cancer (continuation).
FIG. 5-12 shows 771 probes that can be used for detection of colorectal cancer (continuation).
FIG. 5-13 shows 771 probes that can be used for detection of colorectal cancer (continuation).
FIG. 5-14 shows 771 probes that can be used for detection of colorectal cancer (continuation).
FIG. 5-15 shows 771 probes that can be used for detection of colorectal cancer (continuation).
FIG. 5-16 shows 771 probes that can be used for detection of colorectal cancer (continuation).
FIG. 5-17 shows 771 probes that can be used for detection of colorectal cancer (continuation).
FIG. 5-18 shows 771 probes that can be used for detection of colorectal cancer (continuation).
FIG. 5-19 shows 771 probes that can be used for detection of colorectal cancer (continuation).
FIG. 5-20 shows 771 probes that can be used for detection of colorectal cancer (continuation).
FIG. 5-21 shows 771 probes that can be used for detection of colorectal cancer (continuation).
FIG. 5-22 shows 771 probes that can be used for detection of colorectal cancer (continuation).
FIG. 5-23 shows 771 probes that can be used for detection of colorectal cancer (continuation).
FIG. 5-24 shows 771 probes that can be used for detection of colorectal cancer (continuation).
FIG. 5-25 shows 771 probes that can be used for detection of colorectal cancer (continuation).
FIG. 5-26 shows 771 probes that can be used for detection of colorectal cancer (continuation).
FIG. 5-27 shows 771 probes that can be used for detection of colorectal cancer (continuation).
FIG. 5-28 shows 771 probes that can be used for detection of colorectal cancer (continuation).
FIG. 5-29 shows 771 probes that can be used for detection of colorectal cancer (continuation).
FIG. 5-30 shows 771 probes that can be used for detection of colorectal cancer (continuation).
FIG. 5-31 shows 771 probes that can be used for detection of colorectal cancer (continuation).
FIG. 5-32 shows 771 probes that can be used for detection of colorectal cancer (continuation).
FIG. 5-33 shows 771 probes that can be used for detection of colorectal cancer (continuation).
FIG. 5-34 shows 771 probes that can be used for detection of colorectal cancer (continuation).
FIG. 5-35 shows 771 probes that can be used for detection of colorectal cancer (continuation).
FIG. 5-36 shows 771 probes that can be used for detection of colorectal cancer (continuation).
FIG. 5-37 shows 771 probes that can be used for detection of colorectal cancer (continuation).
FIG. 5-38 shows 771 probes that can be used for detection of colorectal cancer (continuation).
FIG. 5-39 shows 771 probes that can be used for detection of colorectal cancer (continuation).
FIG. 5-40 shows 771 probes that can be used for detection of colorectal cancer (continuation).
FIG. 5-41 shows 771 probes that can be used for detection of colorectal cancer (continuation).
FIG. 6-1 shows 116 probes with expression levels that differed significantly particularly between colorectal cancer patients and normal healthy subjects, from among the 771 probes shown in FIG. 5.
FIG. 6-2 shows 116 probes with expression levels that differed significantly particularly between colorectal cancer patients and normal healthy subjects, from among the 771 probes shown in FIG. 5 (continuation).
FIG. 6-3 shows 116 probes with expression levels that differed significantly particularly between colorectal cancer patients and normal healthy subjects, from among the 771 probes shown in FIG. 5 (continuation).
FIG. 6-4 shows 116 probes with expression levels differed significantly particularly between colorectal cancer patients and normal healthy subjects, from among the 771 probes shown in FIG. 5 (continuation).
FIG. 6-5 shows 116 probes with expression levels differed significantly particularly between colorectal cancer patients and normal healthy subjects, from among the 771 probes shown in FIG. 5 (continuation).
FIG. 6-6 shows 116 probes with expression levels differed significantly particularly between colorectal cancer patients and normal healthy subjects, from among the 771 probes shown in FIG. 5 (continuation).
FIG. 6-7 shows 116 probes with expression levels differed significantly particularly between colorectal cancer patients and normal healthy subjects, from among the 771 probes shown in FIG. 5 (continuation).
FIG. 7-1 shows 677 probes that can be used for detection of pancreatic cancer.
FIG. 7-2 shows 677 probes that can be used for detection of pancreatic cancer (continuation).
FIG. 7-3 shows 677 probes that can be used for detection of pancreatic cancer (continuation).
FIG. 7-4 shows 677 probes that can be used for detection of pancreatic cancer (continuation).
FIG. 7-5 shows 677 probes that can be used for detection of pancreatic cancer (continuation).
FIG. 7-6 shows 677 probes that can be used for detection of pancreatic cancer (continuation).
FIG. 7-7 shows 677 probes that can be used for detection of pancreatic cancer (continuation).
FIG. 7-8 shows 677 probes that can be used for detection of pancreatic cancer (continuation).
FIG. 7-9 shows 677 probes that can be used for detection of pancreatic cancer (continuation).
FIG. 7-10 shows 677 probes that can be used for detection of pancreatic cancer (continuation).
FIG. 7-11 shows 677 probes that can be used for detection of pancreatic cancer (continuation).
FIG. 7-12 shows 677 probes that can be used for detection of pancreatic cancer (continuation).
FIG. 7-13 shows 677 probes that can be used for detection of pancreatic cancer (continuation).
FIG. 7-14 shows 677 probes that can be used for detection of pancreatic cancer (continuation).
FIG. 7-15 shows 677 probes that can be used for detection of pancreatic cancer (continuation).
FIG. 7-16 shows 677 probes that can be used for detection of pancreatic cancer (continuation).
FIG. 7-17 shows 677 probes that can be used for detection of pancreatic cancer (continuation).
FIG. 7-18 shows 677 probes that can be used for detection of pancreatic cancer (continuation).
FIG. 7-19 shows 677 probes that can be used for detection of pancreatic cancer (continuation).
FIG. 7-20 shows 677 probes that can be used for detection of pancreatic cancer (continuation).
FIG. 7-21 shows 677 probes that can be used for detection of pancreatic cancer (continuation).
FIG. 7-22 shows 677 probes that can be used for detection of pancreatic cancer (continuation).
FIG. 7-23 shows 677 probes that can be used for detection of pancreatic cancer (continuation).
FIG. 7-24 shows 677 probes that can be used for detection of pancreatic cancer (continuation).
FIG. 7-25 shows 677 probes that can be used for detection of pancreatic cancer (continuation).
FIG. 7-26 shows 677 probes that can be used for detection of pancreatic cancer (continuation).
FIG. 7-27 shows 677 probes that can be used for detection of pancreatic cancer (continuation).
FIG. 7-28 shows 677 probes that can be used for detection of pancreatic cancer (continuation).
FIG. 7-29 shows 677 probes that can be used for detection of pancreatic cancer (continuation).
FIG. 7-30 shows 677 probes that can be used for detection of pancreatic cancer (continuation).
FIG. 7-31 shows 677 probes that can be used for detection of pancreatic cancer (continuation).
FIG. 7-32 shows 677 probes that can be used for detection of pancreatic cancer (continuation).
FIG. 7-33 shows 677 probes that can be used for detection of pancreatic cancer (continuation).
FIG. 7-34 shows 677 probes that can be used for detection of pancreatic cancer (continuation).
FIG. 7-35 shows 677 probes that can be used for detection of pancreatic cancer (continuation).
FIG. 7-36 shows 677 probes that can be used for detection of pancreatic cancer (continuation).
FIG. 7-37 shows 677 probes that can be used for detection of pancreatic cancer (continuation).
FIG. 8-1 shows 61 probes with expression levels that differed significantly particularly between pancreatic cancer patients and normal healthy subjects, from among the 677 probes shown in FIG. 7.
FIG. 8-2 shows 61 probes with expression levels that differed significantly particularly between pancreatic cancer patients and normal healthy subjects, from among the 677 probes shown in FIG. 7 (continuation).
FIG. 8-3 shows 61 probes with expression levels that differed significantly particularly between pancreatic cancer patients and normal healthy subjects, from among the 677 probes shown in FIG. 7 (continuation).
FIG. 8-4 shows 61 probes with expression levels that differed significantly particularly between pancreatic cancer patients and normal healthy subjects, from among the 677 probes shown in FIG. 7 (continuation).
FIG. 9 shows the results of hierarchical clustering using 23352 probes for digestive organ cancer cases and normal healthy subjects.
FIG. 10 shows the results of hierarchical clustering using 868 probes corresponding to genes with expression levels that were observed to be attenuated or enhanced in digestive organ cancer cases compared with normal healthy subjects.
FIG. 11 shows the results of hierarchical clustering using 21 probes corresponding to genes with expression levels that were observed to be attenuated in digestive organ cancer cases at levels 0.4 times or less or enhanced in the same at levels 2.5 times or more than normal healthy subjects.
FIG. 12 shows the results of hierarchical clustering using 22155 probes for gastric cancer cases and normal healthy subjects.
FIG. 13 shows the results of hierarchical clustering using 713 probes corresponding to genes with expression levels that were observed to be attenuated in gastric cancer cases at levels 0.5 times or less or enhanced in the same at levels 2.0 times or more than normal healthy subjects.
FIG. 14 shows the results of hierarchical clustering using 107 probes corresponding to genes with expression levels that were observed to be attenuated in gastric cancer cases at levels 0.33 times or less or enhanced in the same at levels 3 times or more than normal healthy subjects.
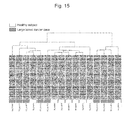
FIG. 15 shows the results of hierarchical clustering using 22181 probes for gastric cancer cases and normal healthy subjects.
FIG. 16 shows the results of hierarchical clustering using 771 probes corresponding to genes with expression levels that were observed to be attenuated in colorectal cancer cases at levels 0.5 times or less or enhanced in the same at levels 2 times or more than normal healthy subjects.
FIG. 17 shows the results of hierarchical clustering using 116 probes corresponding to genes with expression levels that were observed to be attenuated in colorectal cancer cases at levels 0.33 times or less or enhanced in the same at levels 3 times or more than normal healthy subjects.
FIG. 18 shows the results of hierarchical clustering using 22149 probes for pancreatic cancer cases and normal healthy subjects.
FIG. 19 shows the results of hierarchical clustering using 677 probes corresponding to genes with expression levels that were observed to be attenuated in pancreatic cancer cases at levels 0.5 times or less or enhanced in the same at levels 2 times or more than normal healthy subjects.
FIG. 20 shows the results of hierarchical clustering using 61 probes corresponding to genes with expression levels that were observed to be attenuated in pancreatic cancer cases at levels 0.33 times or less or enhanced in the same at levels 3 times or more than normal healthy subjects.
FIG. 21-1 shows 25 probes of a 2nd probe group that can be used for detection of digestive organ cancer.
FIG. 21-2 shows 25 probes of a 2nd probe group that can be used for detection of digestive organ cancer (continuation).
FIG. 22 shows the results of hierarchical clustering using 23278 probes for digestive organ cancer cases and normal healthy subjects.
FIG. 23 shows the results of hierarchical clustering using 25 probes corresponding to genes with expression levels that were observed to be attenuated or enhanced in digestive organ cancer cases compared with normal healthy subjects.
FIG. 24-1 shows 363 probes that can be used for detection of biliary tract cancer.
FIG. 24-2 shows 363 probes that can be used for detection of biliary tract cancer (continuation).
FIG. 24-3 shows 363 probes that can be used for detection of biliary tract cancer (continuation).
FIG. 24-4 shows 363 probes that can be used for detection of biliary tract cancer (continuation).
FIG. 24-5 shows 363 probes that can be used for detection of biliary tract cancer (continuation).
FIG. 24-6 shows 363 probes that can be used for detection of biliary tract cancer (continuation).
FIG. 24-7 shows 363 probes that can be used for detection of biliary tract cancer (continuation).
FIG. 24-8 shows 363 probes that can be used for detection of biliary tract cancer (continuation).
FIG. 24-9 shows 363 probes that can be used for detection of biliary tract cancer (continuation).
FIG. 24-10 shows 363 probes that can be used for detection of biliary tract cancer (continuation).
FIG. 24-11 shows 363 probes that can be used for detection of biliary tract cancer (continuation).
FIG. 24-12 shows 363 probes that can be used for detection of biliary tract cancer (continuation).
FIG. 24-13 shows 363 probes that can be used for detection of biliary tract cancer (continuation).
FIG. 24-14 shows 363 probes that can be used for detection of biliary tract cancer (continuation).
FIG. 24-15 shows 363 probes that can be used for detection of biliary tract cancer (continuation).
FIG. 24-16 shows 363 probes that can be used for detection of biliary tract cancer (continuation).
FIG. 24-17 shows 363 probes that can be used for detection of biliary tract cancer (continuation).
FIG. 24-18 shows 363 probes that can be used for detection of biliary tract cancer (continuation).
FIG. 24-19 shows 363 probes that can be used for detection of biliary tract cancer (continuation).
FIG. 25 shows the results of hierarchical clustering using 22066 probes for biliary tract cancer cases and normal healthy subjects.
FIG. 26 shows the results of hierarchical clustering using 363 probes corresponding to genes with expression levels that were observed to be attenuated in biliary tract cancer cases at levels 0.33 times or less or enhanced in the same at levels 3 times or more than normal healthy subjects.
DETAILED DESCRIPTION OF THE INVENTION
In the present invention, examples of digestive organ cancer include gastric cancer, colorectal cancer, pancreatic cancer, and biliary tract cancer. All of these types of digestive organ cancer can be detected by the method for detecting digestive organ cancer of the present invention. Moreover, gastric cancer, colorectal cancer, pancreatic cancer, or biliary tract cancer can be specifically detected by the method for detecting gastric cancer, colorectal cancer, pancreatic cancer, or biliary tract cancer of the present invention.
The method of the present invention comprises measuring the expression in peripheral blood of:
a gene group with an expression level that varies in digestive organ cancer patients compared with normal healthy subjects;
a gene group with an expression level that varies in gastric cancer patients compared with normal healthy subjects;
a gene group with an expression level that varies in colorectal cancer patients compared with normal healthy subjects;
a gene group with an expression level that varies in pancreatic cancer patients compared with normal healthy subjects; or
a gene group with an expression level that varies in biliary tract cancer patients compared with normal healthy subjects, so as to obtain the expression profile of each gene group, and then detecting digestive organ cancer, gastric cancer, colorectal cancer, pancreatic cancer, or biliary tract cancer. Here, examples of such variation in expression include attenuated expression and enhanced expression.
Gene expression in peripheral blood is measured by extracting and isolating mRNA from peripheral blood and then measuring mRNA. mRNA can be extracted and isolated from peripheral blood by a known method. Examples of mRNA that can be extracted and isolated from peripheral blood include mRNAs derived from, in addition to erythrocytes and blood platelets, leukocytes including lymphocytes, monocytes, and granulocytes in peripheral blood, for example.
In the method of the present invention, the expression levels of the above genes are measured.
In the present invention, the term “gene expression level” refers to a gene expression amount, expression intensity, or expression frequency. Such a gene expression level can be generally analyzed based on the production amount of a transcript corresponding to a gene, or the production amount of the translation product therefrom, activity, and the like. Also, the term “expression profiles” refers to information concerning the expression level of each gene. A gene expression level may be expressed with an absolute value or a relative value. In addition, expression profiles may also be referred to as expression patterns.
Expression levels may be measured by measuring gene transcripts (that is, mRNA) or measuring gene translation products (that is, proteins). Preferably, gene expression levels are measured by measuring gene transcripts. An example of a gene transcript is cDNA obtained from mRNA via reverse transcription.
A gene transcript can be measured by measuring the degree of gene expression using nucleotides containing the full-length nucleotide sequences or partial nucleotide sequences of the above genes, or sequences complementary thereto, specifically, nucleotides consisting of the nucleotide sequences consisting of the nucleotide sequences of the genes or partial sequences of the genes, or sequences complementary thereto, as probes or primers. These nucleotides are nucleotides capable of hybridizing to the genes, nucleotides capable of binding to the genes, or nucleotides for detection, which can be used for detection of the genes. The degree of gene expression can be measured by a method using a microarray (microchip), a Northern blot method, or a quantitative PCR method using a gene to be quantitatively determined or a fragment thereof as a target, for example. Examples of a quantitative PCR method include an agarose gel electrophoresis method, a fluorescent probe method, an RT-PCR method, a real-time PCR method, an ATAC-PCR method (Kato, K. et al., Nucl. Acids Res., 25, 4694-4696, 1997), a Taqman PCR method (SYBR (trademark) Green method) (Schmittgen T D, Methods 25, 383-385, 2001), Body Map method (Gene, 174, 151-158 (1996)), a serial analysis of gene expression (SAGE) method (U.S. Pat. Nos. 527,154 and 544,861, EP Publication No. 0761822), and a MAGE method (Micro-analysis of Gene Expression) (JP Patent Publication (Kokai) No. 2000-232888 A). All methods listed herein can be performed by known techniques. The amount of messenger RNA (mRNA) transcribed from the full-length sequence or a partial sequence of the above gene may be measured using these methods. Specifically, the amount of mRNA can be measured using nucleotide probes or primers hybridizing to the mRNA. The base length of a probe or a primer to be used for measurement ranges from 10 bp to 100 bp, preferably ranges from 20 bp to 80 bp, and further preferably ranges from 50 bp to 70 bp.
A DNA microarray (DNA chip) can be prepared by immobilizing nucleotides consisting of the nucleotide sequences of the above genes or partial sequences thereof, or nucleotides containing complementary sequences thereof on an appropriate substrate.
Examples of a substrate for immobilization include glass plates, quartz plates, silicon wafers. Examples of the size of such a substrate include 3.5 mm×5.5 mm, 18 mm×18 mm, and 22 mm×75 mm. The size thereof can be set variously depending on the number of spots for probes or the size of the spots on a substrate. Polynucleotides or fragments thereof can be immobilized by the following methods. Polynucleotides or fragments thereof can be electrostatically bound to a solid-phase support surface-treated with a polycation such as polylysine, polyethylene imine, or polyalkylamine with the use of the electric charge of nucleotides. Alternatively, nucleotides, into which a functional group such as an amino group, an aldehyde group, an SH group, or biotin has been introduced, are covalently bound to the surface of a solid phase to which a functional group such as an amino group, an aldehyde group, or an epoxy group has been introduced. Immobilization may be performed using an array system. A DNA microarray is prepared by immobilizing at least one of genes corresponding to the above 868 probes or a fragment thereof to a substrate, the DNA microarray is brought into contact with subject-derived mRNA or cDNA labeled with a fluorescent substance for hybridization, and then fluorescence intensity on the DNA microarray is measured, so that the type and the amount of the mRNA can be determined. As a result, a gene(s) with expression levels that vary in a subject, can be detected, so that the gene expression profile can be obtained. A fluorescent substance for labeling subject-derived mRNA is not limited and any commercially available fluorescent substance can be used. For example, Cy3 and Cy5 may be used. mRNA can be labeled by a known method.
In the present invention, the term “probe” refers to the sequence of a nucleotide arranged on a DNA microarray. One nucleotide sequence is designated for one probe ID No. There is a single gene that corresponds to a plurality of probes comprising different nucleotide sequences. The expression “a probe(s) correspond(ing) to a gene(s)” means that the sequence of the probe is complementary to a partial nucleotide sequence of the gene or a sequence complementary thereto, so that the gene can hybridize to the probe. The nucleotide sequence of a gene corresponding to a probe contains the nucleotide sequence of the probe or a nucleotide sequence complementary thereto as a partial sequence.
Examples of nucleotides to be used as probes or primers in the present invention include nucleotides containing the sequences of the above genes, nucleotides consisting of the sequences of fragments thereof, and nucleotides consisting of sequences complementary to these sequences. Further examples of nucleotides to be used in the present invention include nucleotides hybridizing under stringent conditions to nucleotides having the above nucleotide sequences and nucleotides consisting of the sequences of the fragments thereof. Specific examples of such a nucleotide include a nucleotide and the like containing the nucleotide sequence having the degree of homology with the above nucleotide sequences, about 80% or more, preferably about 90% or more, and more preferably about 95% or more on an overall average. Hybridization can be performed according to a method known in the art or a method according thereto, such as the methods described in Current Protocols in Molecular Biology (Current protocols in molecular biology (edited by Frederick M. Ausubel et al., 1987)). Also, when a commercially available library is used, hybridization can be performed according to the methods described in the attached instructions. Here, the term “stringent conditions” refers to conditions of about “1×SSC, 0.1% SDS, 37° C.,” more stringent conditions refer to conditions of about “0.5×SSC, 0.1% SDS, and 42° C.,” and even more stringent conditions refer to conditions of about “0.2×SSC, 0.1% SDS, 65° C.” As such, higher stringency of hybridization conditions enables isolation of a nucleotide having high homology with the probe sequence. Here, the above combinations of SSC, SDS, and temperature are merely examples. Persons skilled in the art can realize stringency similar to the above by appropriately combining the above or other factors (e.g., probe concentration, probe length, and reaction time for hybridization) for determination of stringency for hybridization. Moreover, these genes may have variants. Hence, examples of genes to be used in the present invention include variants of the above genes. The nucleotide sequences of variants can be obtained by accessing a gene database. Examples of the nucleotides of the present invention include nucleotides containing the nucleotide sequences of the variants or nucleotides consisting of the sequences of the fragments thereof.
Also, as a nucleotide to be used in the present invention, either a nucleotide consisting of a sense strand of the above gene or a nucleotide consisting of the antisense strand of the same can be used.
FIG. 1 (FIG. 1-1 to FIG. 1-48) shows 868 probes of the 1st probe group that can be used for detection of digestive organ cancer. FIG. 1 shows probe ID numbers, symbols of genes corresponding to the probes, the nucleotide sequences (SEQ ID NOs: 1-868) of the probes, and descriptions of genes corresponding to the probes (gene names and GenBank accession numbers). The full-length sequences of these genes are known. Arbitrary partial sequences can be used as nucleotides for detection of the genes. FIG. 2 shows the nucleotide sequences (SEQ ID NOs: 220, 506, 508, 523, 538, 554, 570, 589, 597, 602, 618, 654, 689, 701, 726, 744, 762, 763, 781, 795, and 849) of 21 probes with expression levels that differ significantly particularly between digestive organ cancer patients and normal healthy subjects, from among the 868 probes shown in FIG. 1. In FIG. 1, genes corresponding to 555 probes (No. 1 to No. 555) (SEQ ID NOs: 1-555) exhibit attenuated expression in digestive organ cancer patients compared with normal healthy subjects. Genes corresponding to 313 probes (No. 556 to No. 868) (SEQ ID NOs: 556-868) exhibit enhanced expression in digestive organ cancer patients compared with normal healthy subjects. Also, in FIG. 2, genes corresponding to probes No. 1 to No. 6 (SEQ ID NOs: 220, 506, 508, 523, 538, and 554) exhibit attenuated expression in digestive organ cancer patients compared with normal healthy subjects. Genes corresponding to probes No. 7 to No. 21 (SEQ ID NOs: 570, 589, 597, 602, 618, 654, 689, 701, 726, 744, 762, 763, 781, 795, and 849) exhibit enhanced expression in digestive organ cancer patients compared with normal healthy subjects.
Furthermore, FIG. 21 (FIG. 21-1 and FIG. 21-2) shows 25 probes of the 2nd probe group that can be used for detection of digestive organ cancer. FIG. 21 shows probe ID numbers, symbols of genes corresponding to the probes, the nucleotide sequences (SEQ ID NOs: 3030-3054) of the probes, and descriptions of genes corresponding to the probes (gene names and GenBank accession numbers). The full-length sequences of these genes are known. Arbitrary partial sequences can be used as nucleotides for detection of the genes.
FIG. 3 (FIG. 3-1 to FIG. 3-39) shows 713 probes that can be used for detection of gastric cancer. FIG. 3 shows probe ID numbers, symbols of genes corresponding to the probes, the nucleotide sequences (SEQ ID NOs: 869-1581) of the probes, and descriptions of genes corresponding to the probes (gene names and GenBank accession numbers). The full-length sequences of these genes are known. Arbitrary partial sequences can be used as nucleotides for detection of the genes. FIG. 4 (FIG. 4-1 to FIG. 4-6) shows the nucleotide sequences (SEQ ID NO: 923, 927, 929, 932, 946, 952, 986, 998, 1000, 1006, 1007, 1013, 1019, 1020, 1022, 1027, 1039, 1046, 1073, 1090, 1107, 1108, 1117, 1121, 1132, 1134, 1154, 1162, 1179, 1183, 1191, 1205, 1207, 1211, 1216, 1217, 1224, 1239, 1244, 1251, 1254, 1255, 1283, 1285, 1301, 1304, 1316, 1317, 1327, 1328, 1331, 1332, 1345, 1359, 1365, 1366, 1372, 1373, 1375, 1379, 1380, 1382, 1383, 1393, 1394, 1396, 1397, 1404, 1405, 1406, 1407, 1421, 1423, 1426, 1430, 1440, 1441, 1442, 1448, 1450, 1454, 1455, 1456, 1459, 1466, 1467, 1491, 1497, 1500, 1502, 1504, 1508, 1513, 1514, 1519, 1531, 1534, 1544, 1546, 1549, 1551, 1560, 1563, 1566, 1570, 1571, and 1578) of 107 probes with expression levels that differ significantly particularly between gastric cancer patients and normal healthy subjects, from among the 713 probes shown in FIG. 3. In FIG. 3, genes corresponding to 84 probes (No. 1 to No. 84) (SEQ ID NOs: 869-952) exhibit attenuated expression in gastric cancer patients compared with normal healthy subjects. Genes corresponding to 629 probes (No. 85 to No. 713) (SEQ ID NOs: 953-1581) exhibit enhanced expression in gastric cancer patients compared with normal healthy subjects. Also, in FIG. 4, genes corresponding to probes No. 1 to No. 6 (SEQ ID NOs: 923, 927, 929, 932, 946, and 952) exhibit attenuated expression in gastric cancer patients compared with normal healthy subjects. Genes corresponding to probes No. 7 to No. 107 (SEQ ID NOs: 986, 998, 1000, 1006, 1007, 1013, 1019, 1020, 1022, 1027, 1039, 1046, 1073, 1090, 1107, 1108, 1117, 1121, 1132, 1134, 1154, 1162, 1179, 1183, 1191, 1205, 1207, 1211, 1216, 1217, 1224, 1239, 1244, 1251, 1254, 1255, 1283, 1285, 1301, 1304, 1316, 1317, 1327, 1328, 1331, 1332, 1345, 1359, 1365, 1366, 1372, 1373, 1375, 1379, 1380, 1382, 1383, 1393, 1394, 1396, 1397, 1404, 1405, 1406, 1407, 1421, 1423, 1426, 1430, 1440, 1441, 1442, 1448, 1450, 1454, 1455, 1456, 1459, 1466, 1467, 1491, 1497, 1500, 1502, 1504, 1508, 1513, 1514, 1519, 1531, 1534, 1544, 1546, 1549, 1551, 1560, 1563, 1566, 1570, 1571, and 1578) exhibit enhanced expression in gastric cancer patients compared with normal healthy subjects.
FIG. 5 (FIG. 5-1 to FIG. 5-41) shows 771 probes that can be used for detection of colorectal cancer. FIG. 5 shows probe ID numbers, symbols of genes corresponding to the probes, the nucleotide sequences (SEQ ID NOs: 1582-2352) of the probes, and descriptions of genes corresponding to the probes (gene names and GenBank accession numbers). The full-length sequences of these genes are known. Arbitrary partial sequences can be used as nucleotides for detection of the genes. FIG. 6 (FIG. 6-1 to FIG. 6-6) shows 116 probes (SEQ ID NO: 1583, 1601, 1611, 1614, 1644, 1651, 1678, 1680, 1684, 1737, 1746, 1750, 1751, 1757, 1760, 1765, 1766, 1773, 1778, 1779, 1780, 1782, 1787, 1794, 1795, 1798, 1802, 1831, 1836, 1837, 1853, 1854, 1869, 1871, 1873, 1876, 1880, 1890, 1892, 1896, 1925, 1942, 1950, 1953, 1962, 1970, 1977, 1978, 1985, 1990, 1991, 2000, 2004, 2007, 2011, 2018, 2019, 2023, 2032, 2046, 2050, 2054, 2077, 2085, 2088, 2095, 2105, 2126, 2128, 2132, 2138, 2140, 2143, 2144, 2145, 2147, 2158, 2160, 2161, 2173, 2175, 2176, 2180, 2191, 2193, 2198, 2207, 2209, 2213, 2217, 2218, 2223, 2227, 2233, 2247, 2255, 2257, 2258, 2261, 2266, 2268, 2269, 2273, 2280, 2286, 2296, 2306, 2317, 2320, 2322, 2325, 2332, 2334, 2336, 2339, and 2340) with expression levels that differ significantly particularly between colorectal cancer patients and normal healthy subjects, from among 771 probes shown in FIG. 5. In FIG. 5, genes corresponding to 125 probes (No. 1 to No. 125) (SEQ ID NOs: 1582-1706) exhibit attenuated expression in colorectal cancer patients compared with normal healthy subjects. Genes corresponding to 646 probes (No. 126 to No. 771) (SEQ ID NOs: 1707-2352) exhibit enhanced expression in colorectal cancer patients compared with normal healthy subjects. Also, in FIG. 6, genes corresponding to probes No. 1 to No. 9 (SEQ ID NOs: 1583, 1601, 1611, 1614, 1644, 1651, 1678, 1680, and 1684) exhibit attenuated expression in colorectal cancer patients compared with normal healthy subjects. Genes corresponding to probes No. 10 to No. 116 (SEQ ID NOs: 1737, 1746, 1750, 1751, 1757, 1760, 1765, 1766, 1773, 1778, 1779, 1780, 1782, 1787, 1794, 1795, 1798, 1802, 1831, 1836, 1837, 1853, 1854, 1869, 1871, 1873, 1876, 1880, 1890, 1892, 1896, 1925, 1942, 1950, 1953, 1962, 1970, 1977, 1978, 1985, 1990, 1991, 2000, 2004, 2007, 2011, 2018, 2019, 2023, 2032, 2046, 2050, 2054, 2077, 2085, 2088, 2095, 2105, 2126, 2128, 2132, 2138, 2140, 2143, 2144, 2145, 2147, 2158, 2160, 2161, 2173, 2175, 2176, 2180, 2191, 2193, 2198, 2207, 2209, 2213, 2217, 2218, 2223, 2227, 2233, 2247, 2255, 2257, 2258, 2261, 2266, 2268, 2269, 2273, 2280, 2286, 2296, 2306, 2317, 2320, 2322, 2325, 2332, 2334, 2336, 2339, and 2340) exhibit enhanced expression in colorectal cancer patients compared with normal healthy subjects. FIG. 7 (FIG. 7-1 to FIG. 7-37) shows 677 probes that can be used for detection of pancreatic cancer.
FIG. 7 shows probe ID numbers, symbols of genes corresponding to the probes, the nucleotide sequences (SEQ ID NOs: 2353-3029) of the probes, and descriptions of genes corresponding to the probes (gene names and GenBank accession numbers). The full-length sequences of these genes are known. Arbitrary partial sequences can be used as nucleotides for detection of the genes. FIG. 8 (FIG. 8-1 to FIG. 8-3) shows 61 probes (SEQ ID NOs: 2373, 2404, 2418, 2419, 2426, 2430, 2459, 2461, 2469, 2475, 2507, 2514, 2515, 2525, 2543, 2600, 2602, 2621, 2628, 2634, 2640, 2651, 2652, 2674, 2677, 2680, 2681, 2691, 2692, 2700, 2714, 2715, 2719, 2723, 2724, 2738, 2740, 2746, 2748, 2763, 2778, 2781, 2815, 2818, 2823, 2842, 2857, 2861, 2885, 2898, 2902, 2903, 2932, 2934, 2972, 2975, 2982, 2985, 2999, 3001, and 3003) with expression levels that differ significantly particularly between pancreatic cancer patients and normal healthy subjects, from among 677 probes. In FIG. 7, genes corresponding to 96 probes (No. 1 to No. 96) (SEQ ID NOs: 2353-2448) exhibit attenuated expression in pancreatic cancer patients compared with normal healthy subjects. Genes corresponding to 581 probes (No. 97 to No. 677) (SEQ ID NO: 2449 to 3029) exhibit enhanced expression in pancreatic cancer patients compared with normal healthy subjects. Also, in FIG. 8, genes corresponding to probes No. 1 to No. 6 (SEQ ID NOs: 2373, 2404, 2418, 2419, 2426, and 2430) exhibit attenuated expression in pancreatic cancer patients compared with normal healthy subjects. Genes corresponding to probes No. 7 to No. 61 (SEQ ID NOs: 2459, 2461, 2469, 2475, 2507, 2514, 2515, 2525, 2543, 2600, 2602, 2621, 2628, 2634, 2640, 2651, 2652, 2674, 2677, 2680, 2681, 2691, 2692, 2700, 2714, 2715, 2719, 2723, 2724, 2738, 2740, 2746, 2748, 2763, 2778, 2781, 2815, 2818, 2823, 2842, 2857, 2861, 2885, 2898, 2902, 2903, 2932, 2934, 2972, 2975, 2982, 2985, 2999, 3001, and 3003) exhibit enhanced expression in pancreatic cancer patients compared with normal healthy subjects.
FIG. 24 (FIG. 24-1 to FIG. 24-19) shows 363 probes that can be used for detection of biliary tract cancer. FIG. 24 shows probe ID numbers, symbols of genes corresponding to the probes, the nucleotide sequences (SEQ ID NOs: 3055-3417) of the probes, and descriptions of genes corresponding to the probes (gene names and GenBank accession numbers). The full-length sequences of these genes are known. Arbitrary partial sequences can be used as nucleotides for detection of the genes. In FIG. 24, genes corresponding to 98 probes (No. 1 to No. 98) (SEQ ID NOs: 3055-3152) exhibit attenuated expression in biliary tract cancer patients compared with normal healthy subjects. Genes corresponding to 265 probes (No. 99 to No. 363) (SEQ ID NOs: 3153-3417) exhibit enhanced expression in biliary tract cancer patients compared with normal healthy subjects.
The method for detecting digestive organ cancer of the present invention comprises measuring the expression levels of genes (described in the rightmost column in FIG. 1) in peripheral blood of a subject using at least one of 868 probes shown in FIG. 1, wherein the genes correspond to the 868 probes. At this time, with the use of at least 1 to 867 probes from among the 868 probes shown in FIG. 1, specifically at least 1, 2, 3, 4, 5, 6, 7, 8, 9, 10, 50, 100, 150, 200, 250, 300, 350, 400, 450, 500, 550, 600, 650, 700, 750, 800, 850, 867, or 868 probes, the expression levels of the genes corresponding thereto are measured. Also, with the use of at least one of probes corresponding to genes that exhibit attenuated expression in a group of digestive organ cancer patients, the expression level of the gene corresponding thereto may be measured. Also, with the use of at least one of probes corresponding to genes that exhibit enhanced expression in a group of digestive organ cancer patients, the expression level of the gene corresponding to the probe may be measured. Furthermore, with the use of a combination of at least one of probes corresponding to genes that exhibit attenuated expression in a group of digestive organ cancer patients and at least one of probes corresponding to genes that exhibit enhanced expression in the group of digestive organ cancer patients, the expression levels of the genes corresponding to the probes may be measured. Specifically, with the use of at least one of 555 probes (No. 1 to No. 555) (SEQ ID NOs: 1-555) shown in FIG. 1, the expression level of at least one of the genes corresponding to the probes may be measured. At this time, with the use of at least 1 to 554 probes from among the 555 probes, specifically at least 1, 2, 3, 4, 5, 6, 7, 8, 9, 10, 50, 100, 150, 200, 250, 300, 350, 400, 450, 500, 550, 554, or 555 probes, the expression levels of the genes corresponding thereto may be measured. Also, with the use of at least one of 313 probes (No. 556 to No. 868) (SEQ ID NOs: 556-868) shown in FIG. 1, the expression level of the gene corresponding thereto may be measured. At this time, with the use of at least 1 to 312 probes from among the 313 probes, specifically at least 1, 2, 3, 4, 5, 6, 7, 8, 9, 10, 50, 100, 150, 200, 250, 300, 312, or 313 probes, the expression levels of the genes corresponding thereto may be measured. Furthermore, with the use of a combination of at least one of the 555 probes (No. 1 to No. 555) (SEQ ID NOs: 1-555) shown in FIG. 1 and at least one of the 313 probes (No. 556 to No. 868) (SEQ ID NOs: 556-868) shown in FIG. 1, the expression levels of the genes corresponding thereto may be measured.
Furthermore, with the use of at least one of 21 probes shown in FIG. 2 corresponding particularly to genes with expression levels that vary significantly from among genes corresponding to the above 868 probes, the expression levels of the genes (described in the rightmost column in FIG. 2) corresponding to the probes may be measured. At this time, with the use of the 21 probes, specifically 1, 2, 3, 4, 5, 6, 7, 8, 9, 10, 11, 12, 13, 14, 15, 16, 17, 18, 19, 20, or 21 probes, the expression levels of the genes corresponding to the probes may be measured. Also, with the use of at least one of probes No. 1 to No. 6 (from among the 21 probes shown in FIG. 2) corresponding to genes that exhibit attenuated expression in digestive organ cancer patients compared with normal healthy subjects, the expression levels of the genes may be measured. With the use of, from among the 21 probes shown in FIG. 2, at least one of probes No. 7 to No. 21 corresponding to genes that exhibit enhanced expression in digestive organ cancer patients compared with normal healthy subjects, the expression levels of the genes may be measured. Furthermore, with the use of a combination of at least one of the probes No. 1 to No. 6 and at least one of the probes No. 7 to No. 21, the expression levels of the genes may be measured. At this time, 1, 2, 3, 4, 5, or 6 probes of the probes No. 1 to No. 6 may be used and 1, 2, 3, 4, 5, 6, 7, 8, 9, 10, 11, 12, 13, 14, or 15 probes of the probes No. 7 to No. 21 may be used.
The method for detecting digestive organ cancer of the present invention comprises measuring the expression levels of genes (described in the rightmost column in FIG. 1A) in peripheral blood of a subject using at least one of 25 probes shown in FIG. 21, wherein the genes correspond to the 25 probes. At this time, with the use 1, 2, 3, 4, 5, 6, 7, 8, 9, 10, 11, 12, 13, 14, 15, 16, 17, 18, 19, 20, 21, 22, 23, 24, or probes shown in FIG. 1A, the expression levels of the genes corresponding thereto may be measured. Also, with the use of at least one of probes corresponding to genes that exhibit attenuated expression in a group of digestive organ cancer patients, the expression level of the gene corresponding thereto may be measured. Also, with the use of at least one of probes corresponding to genes that exhibit enhanced expression in a group of digestive organ cancer patients, the expression level of the gene corresponding thereto may be measured. Furthermore, with the use of a combination of at least one of probes corresponding to genes that exhibit attenuated expression in a group of digestive organ cancer patients and at least one of probes corresponding to genes that exhibit enhanced expression in the group of digestive organ cancer patients, the expression levels of the genes corresponding to the probes may be measured. Specifically, with the use of at least one of 14 probes (No. 1 to No. 14) (SEQ ID NOs: 3030-3043) shown in FIG. 21, the expression level of at least one of the genes corresponding to the probes may be measured. At this time, with the use of 14 probes, specifically, 1, 2, 3, 4, 5, 6, 7, 8, 9, 10, 11, 12, 13, or 14 probes, the expression levels of the genes corresponding thereto may be measured. Also, with the use of at least one of 11 probes (No. 15 to No. 25) (SEQ ID NOs: 3044-3054) shown in FIG. 21, the expression level of the gene corresponding to the probe may be measured. At this time, with the use of 11 probes, specifically, 1, 2, 3, 4, 5, 6, 7, 8, 9, 10, or 11 probes, the expression levels of the genes corresponding thereto may be measured. Furthermore, with the use of a combination of at least one of 14 probes (No. 1 to No. 14) (SEQ ID NOs: 3030-3043) shown in FIG. 21 and at least one of 11 probes (No. 15 to No. 25) (SEQ ID NOs: 3044-3054) shown in FIG. 21, the expression levels of the genes corresponding thereto may be measured.
The method for detecting gastric cancer of the present invention comprises measuring the expression levels of genes in peripheral blood of a subject (described in the rightmost column in FIG. 3) using at least one of 713 probes shown in FIG. 3, wherein the genes correspond to the 713 probes. At this time, with the use of at least 1 to 712 probes from among the 713 probes shown in FIG. 3, specifically at least 1, 2, 3, 4, 5, 6, 7, 8, 9, 10, 50, 100, 150, 200, 250, 300, 350, 400, 450, 500, 550, 600, 650, 700, 712, or 713 probes, the expression levels of the genes corresponding thereto may be measured. Also, with the use of at least one of probes corresponding to genes that exhibit attenuated expression in a group of gastric cancer patients, the expression level of the gene corresponding thereto may be measured. Also, with the use of at least one of probes corresponding to genes that exhibit enhanced expression in a group of gastric cancer patients, the expression level of the gene corresponding to the probe may be measured. Furthermore, with the use of a combination of at least one of probes corresponding to genes that exhibit attenuated expression in a group of gastric cancer patients and at least one of probes corresponding to genes that exhibit enhanced expression in the group of gastric cancer patients, the expression levels of the genes corresponding to the probes may be measured. Specifically, with the use of at least one of 84 probes (No. 1 to No. 84) (SEQ ID NOs: 869-952) shown in FIG. 1, the expression level of at least one of the genes corresponding to the probes may be measured. At this time, with the use of at least 1 to 83 probes from among the 84 probes, specifically at least 1, 2, 3, 4, 5, 6, 7, 8, 9, 10, 20, 30, 40, 50, 60, 70, 80, 83, or 84 probes, the expression levels of the genes corresponding thereto may be measured. Also, with the use of at least one of 629 probes (No. 85 to No. 713) (SEQ ID NOs: 953-1581) shown in FIG. 3, the expression levels of the genes corresponding to the probes may be measured. At this time, with the use of at least 1 to 628 probes from among the 629 probes, specifically at least 1, 2, 3, 4, 5, 6, 7, 8, 9, 10, 50, 100, 150, 200, 250, 300, 350, 400, 450, 500, 550, 600, 628, or 629 probes, the expression levels of the genes corresponding thereto may be measured. Furthermore, with the use of a combination of at least one of the 84 probes (No. 1 to No. 84) (SEQ ID NOs: 869-952) shown in FIG. 3 and at least one of the 629 probes (No. 85 to No. 713) (SEQ ID NOs: 953-1581) shown in FIG. 3, the expression levels of the genes corresponding to the probes may be measured.
Furthermore, with the use of at least one of 107 probes shown in FIG. 4 corresponding particularly to genes with expression levels that vary significantly from among the genes corresponding to the above 713 probes, the expression levels of the genes (described in the rightmost column in FIG. 4) corresponding to the probes may be measured. At this time, with the use of the 107 probes, specifically at least 1, 2, 3, 4, 5, 6, 7, 8, 9, 10, 20, 30, 40, 50, 60, 70, 80, 90, 100, 106, or 107 probes, the expression levels of the genes corresponding to the probes may be measured. Also, with the use of at least one of probes No. 1 to No. 6 (from among the 107 probes shown in FIG. 4) corresponding to genes that exhibit attenuated expression in gastric cancer patients compared with normal healthy subjects, the expression levels of the genes may be measured. With the use of, from among the 107 probes shown in FIG. 4, at least one of probes No. 7 to No. 107 corresponding to genes that exhibit enhanced expression in gastric cancer patients compared with normal healthy subjects, the expression levels of the genes may be measured. Furthermore, with the use of a combination of at least one of the probes No. 1 to No. 6 and at least one of the probes No. 7 to No. 107, the expression levels of the genes may be measured. At this time, 1, 2, 3, 4, 5, or 6 probes of the probes No. 1 to No. 6 may be used and at least 1, 2, 3, 4, 5, 6, 7, 8, 9, 10, 20, 30, 40, 50, 60, 70, 80, 90, or 100, or 101 probes of the probes No. 7 to No. 107 may be used.
The method for detecting colorectal cancer of the present invention comprises measuring the expression levels of genes in peripheral blood of a subject (described in the rightmost column in FIG. 5) using at least one of 771 probes shown in FIG. 5, wherein the genes correspond to the 771 probes. At this time, with the use of at least 1 to 770 probes from among the 771 probes shown in FIG. 5, specifically at least 1, 2, 3, 4, 5, 6, 7, 8, 9, 10, 50, 100, 150, 200, 250, 300, 350, 400, 450, 500, 550, 600, 650, 700, 750, 770, or 771 probes, the expression levels of the genes corresponding thereto may be measured. Also, with the use of at least one of probes corresponding to genes that exhibit attenuated expression in a group of colorectal cancer patients, the expression level of the gene corresponding thereto may be measured. Also, with the use of at least one of probes corresponding to genes that exhibit enhanced expression in a group of colorectal cancer patients, the expression level of the gene corresponding to the probe may be measured. Furthermore, with the use of a combination of at least one of probes corresponding to genes that exhibit attenuated expression in a group of colorectal cancer patients and at least one of probes corresponding to genes that exhibit enhanced expression in the group of colorectal cancer patients, the expression levels of the genes corresponding to the probes may be measured. Specifically, with the use of at least one of 125 probes (No. 1 to No. 125) (SEQ ID NOs: 1582-1706) shown in FIG. 5, the expression level of at least one of the genes corresponding to the probes may be measured. At this time, with the use of at least 1 to 124 probes from among the 125 probes, specifically at least 1, 2, 3, 4, 5, 6, 7, 8, 9, 10, 20, 30, 40, 50, 60, 70, 80, 90, 100, 110, 120, 124, or 125 probes, the expression levels of the genes corresponding thereto may be measured. Also, with the use of at least one of 646 probes (No. 126 to No. 771) (SEQ ID NOs: 1707-2352) shown in FIG. 5, the expression levels of the genes corresponding thereto may be measured. At this time, with the use of at least 1 to 645 probes from among the 646 probes, specifically at least 1, 2, 3, 4, 5, 6, 7, 8, 9, 10, 50, 100, 150, 200, 250, 300, 350, 400, 450, 500, 550, 600, 645, or 646 probes, the expression levels of the genes corresponding thereto may be measured. Furthermore, with the use of a combination of at least one of the 125 probes (No. 1 to No. 125) (SEQ ID NOs: 1582-1706) shown in FIG. 5 and at least one of the 646 probes (No. 126 to No. 771) (SEQ ID NOs: 1707-2352) shown in FIG. 5, the expression levels of the genes corresponding thereto may be measured.
Furthermore, with the use of at least one of 116 probes shown in FIG. 6 corresponding particularly to genes with expression levels that vary significantly from among the genes corresponding to the above 771 probes, the expression levels of the genes (described in the rightmost column in FIG. 6) corresponding to the probes may be measured. At this time, with the use of the 116 probes, specifically 1, 2, 3, 4, 5, 6, 7, 8, 9, 10, 20, 30, 40, 50, 60, 70, 80, 90, 100, 110, or 115, or 116 probes, the expression levels of the genes corresponding to the probes may be measured. Also, with the use of at least one of probes No. 1 to No. 9 (from among the 116 probes shown in FIG. 6) corresponding to genes that exhibit attenuated expression in colorectal cancer patients compared with normal healthy subjects, the expression levels of the genes may be measured. With the use of, from among the 116 probes shown in FIG. 6, at least one of probes No. 10 to No. 116 corresponding to genes that exhibit enhanced expression in colorectal cancer patients compared with normal healthy subjects, the expression levels of the genes may be measured. Furthermore, with the use of a combination of at least one of the probes No. 1 to No. 9 and at least one of the probes No. 10 to No. 116, the expression levels of the genes may be measured. At this time, 1, 2, 3, 4, 5, 6, 7, 8, or 9 probes of the probes No. 1 to No. 9 may be used and at least 1, 2, 3, 4, 5, 6, 7, 8, 9, 10, 20, 30, 40, 50, 60, 70, 80, 90, 100, or 109, or 110 probes of the probes No. 10 to No. 116 may be used.
The method for detecting pancreatic cancer of the present invention comprises measuring the expression levels of genes in peripheral blood of a subject (described in the rightmost column in FIG. 7) using at least one of 677 probes shown in FIG. 7, wherein the genes correspond to the 677 probes. At this time, with the use of at least 1 to 676 probes from among the 677 probes shown in FIG. 7, specifically at least 1, 2, 3, 4, 5, 6, 7, 8, 9, 10, 50, 100, 150, 200, 250, 300, 350, 400, 450, 500, 550, 600, 650, 676, or 677 probes, the expression levels of the genes corresponding thereto may be measured. Also, with the use of at least one of probes corresponding to genes that exhibit attenuated expression in a group of pancreatic cancer patients, the expression level of the gene corresponding thereto may be measured. Also, with the use of at least one of probes corresponding to genes that exhibit enhanced expression in a group of pancreatic cancer patients, the expression level of the gene corresponding to the probe may be measured. Furthermore, with the use of a combination of at least one of probes corresponding to genes that exhibit attenuated expression in a group of pancreatic cancer patients and at least one of probes corresponding to genes that exhibit enhanced expression in the group of pancreatic cancer patients, the expression levels of the genes corresponding to the probes may be measured. Specifically, with the use of at least one of 96 probes (No. 1 to No. 96) (SEQ ID NOs: 2353-2448) shown in FIG. 7, the expression level of at least one of the genes corresponding to the probes may be measured. At this time, with the use of at least 1 to 95 probes from among the 96 probes, specifically at least 1, 2, 3, 4, 5, 6, 7, 8, 9, 10, 20, 30, 40, 50, 60, 70, 80, 90, or 95, or 96 probes, the expression levels of the genes corresponding thereto may be measured. Also, with the use of at least one of 581 probes (No. 97 to No. 677) (SEQ ID NOs: 2449-3029) shown in FIG. 7, the expression levels of the genes corresponding thereto may be measured. At this time, with the use of at least 1 to 580 probes from among the 581 probes, specifically at least 1, 2, 3, 4, 5, 6, 7, 8, 9, 10, 50, 100, 150, 200, 250, 300, 350, 400, 450, 500, 550, or 580, or 581 probes, the expression levels of the genes corresponding thereto may be measured. Furthermore, with the use of a combination of at least one of the 96 probes (No. 1 to No. 96) (SEQ ID NOs: 2353-2448) shown in FIG. 7 and at least one of the 581 probes (No. 97 to No. 677) (SEQ ID NOs: 2449-3029) shown in FIG. 7, the expression levels of the genes corresponding thereto may be measured.
Furthermore, with the use of at least one of 61 probes shown in FIG. 8 corresponding particularly to genes with expression levels that vary significantly (from among the genes corresponding to the above 677 probes), the expression levels of the genes (described in the rightmost column in FIG. 8) corresponding to the probes may be measured. At this time, with the use of the 61 probes, specifically at least 1, 2, 3, 4, 5, 6, 7, 8, 9, 10, 20, 30, 40, 50, or 60, or 61 probes, the expression levels of the genes corresponding to the probes may be measured. Also, with the use of at least one of probes No. 1 to No. 6 (from among the 61 probes shown in FIG. 8) corresponding to genes that exhibit attenuated expression in pancreatic cancer patients compared with normal healthy subjects, the expression levels of the genes may be measured. With the use of, from among the 61 probes shown in FIG. 8, at least one of probes No. 7 to No. 61 corresponding to genes that exhibit enhanced expression in pancreatic cancer patients compared with normal healthy subjects, the expression levels of the genes may be measured. Furthermore, with the use of a combination of at least one of the probes No. 1 to No. 6 and at least one of the probes No. 7 to No. 61, the expression levels of the genes may be measured. At this time, 1, 2, 3, 4, 5, or 6 probes of the probes No. 1 to No. 6 may be used and 1, 2, 3, 4, 5, 6, 7, 8, 9, 10, 20, 30, 40, 50, or 54, or 55 probes of the probes No. 7 to No. 61 may be used.
The method for detecting biliary tract cancer of the present invention comprises measuring the expression levels of genes in peripheral blood of a subject (described in the rightmost column in FIG. 24) using at least one of 363 probes shown in FIG. 24 (FIG. 24-1 to FIG. 24-19), wherein the genes correspond to the 363 probes. At this time, with the use of at least 1 to 362 probes from among the 363 probes shown in FIG. 24, specifically at least 1, 2, 3, 4, 5, 6, 7, 8, 9, 10, 50, 100, 150, 200, 250, 300, 350, or 362, or 363 probes, the expression levels of the genes corresponding thereto may be measured. Also, with the use of at least one of probes corresponding to genes that exhibit attenuated expression in a group of biliary tract cancer patients, the expression level of the gene corresponding thereto may be measured. Also, with the use of at least one of probes corresponding to genes that exhibit enhanced expression in a group of biliary tract cancer patients, the expression level of the gene corresponding to the probe may be measured. Furthermore, with the use of a combination of at least one of probes corresponding to genes that exhibit attenuated expression in a group of biliary tract cancer patients and at least one of probes corresponding to genes that exhibit enhanced expression in the group of biliary tract cancer patients, the expression levels of the genes corresponding to the probes may be measured. Specifically, with the use of at least one of 98 probes (No. 1 to No. 98) (SEQ ID NOs: 3055-3152) shown in FIG. 24, the expression level of at least one of the genes corresponding to the probes may be measured. At this time, with the use of at least 1 to 97 probes from among the 98 probes, specifically at least 1, 2, 3, 4, 5, 6, 7, 8, 9, 10, 20, 30, 40, 50, 60, 70, 80, 90, or 97, or 98 probes, the expression levels of the genes corresponding thereto may be measured. Also, with the use of at least one of 265 probes (No. 99 to No. 363) (SEQ ID NOs: 3153-3417) shown in FIG. 24, the expression levels of the genes corresponding thereto may be measured. At this time, with the use of at least 1 to 264 probes from among the 265 probes, specifically at least 1, 2, 3, 4, 5, 6, 7, 8, 9, 10, 50, 100, 150, 200, 250, 264, or 265 probes, the expression levels of the genes corresponding thereto may be measured. Furthermore, with the use of a combination of at least one of the 98 probes (No. 1 to No. 98) (SEQ ID NOs: 3055-3152) shown in FIG. 24 and at least one of the 265 probes (No. 99 to No. 363) (SEQ ID NOs: 3153-3417) shown in FIG. 24, the expression levels of the genes corresponding thereto may be measured.
The method of the present invention enables identification of a patient with digestive organ cancer, gastric cancer, colorectal cancer, pancreatic cancer, or biliary tract cancer. Specifically, the presence of digestive organ cancer, gastric cancer, colorectal cancer, pancreatic cancer, or biliary tract cancer can be detected.
Subjects may exhibit unknown pathological conditions. When such a subject with unknown pathological conditions is used, whether the subject is normal or affected with digestive organ cancer, gastric cancer, colorectal cancer, pancreatic cancer, or biliary tract cancer can be determined and diagnosed.
In the present invention, the above determination of the pathological conditions of digestive organ cancer, gastric cancer, colorectal cancer, pancreatic cancer, or biliary tract cancer, prognostic prediction, and the like are broadly referred to as detection of digestive organ cancer, gastric cancer, colorectal cancer, pancreatic cancer, or biliary tract cancer.
Furthermore, the pathological conditions of a subject can be determined by obtaining the expression profiles of one or more genes corresponding to the above probes (specifically, 868 probes or 25 probes for digestive organ cancer, 713 probes for gastric cancer, 771 probes for colorectal cancer, 677 probes for pancreatic cancer, and 363 probes for biliary tract cancer) and then analyzing the expression profiles. If expression profiles obtained from a subject are analogous to expression profiles obtained from a digestive organ cancer, gastric cancer, colorectal cancer, pancreatic cancer, or biliary tract cancer patient, the subject can be determined as having digestive organ cancer, gastric cancer, colorectal cancer, pancreatic cancer, or biliary tract cancer. Also, expression profiles obtained from a subject are compared with expression profiles obtained from a normal subject and then evaluation and determination can be made based on a difference in expression profiles between the subject and the normal subject.
Gene expression profiling comprises recording the patterns of expression signals such as fluorescence intensities in the form of digital numerical values or color images. Gene expression profiles can be compared using pattern comparison software. Cox hazard analysis, discriminant analysis, and the like can be used herein. A discriminant analysis model is constructed in advance for evaluation and determination of pathological conditions, prediction of pathological conditions, or prognostic prediction, data concerning gene expression profiles obtained from a subject are input into the discriminant analysis model, and thus determination of pathological conditions, prediction of pathological conditions, or prognostic prediction can also be performed. For example, pathological conditions, prediction of pathological conditions, or prognostic prediction can be evaluated and determined by obtaining a discriminant via discriminant analysis, relating fluorescence intensities to pathological conditions, predicting pathological conditions, or conducting prognostic prediction, and then substituting the numerical value representing the expression signal of the subject into the discriminant.
The present invention encompasses an in vitro diagnostic or a kit for detecting digestive organ cancer, gastric cancer, colorectal cancer, pancreatic cancer, or biliary tract cancer, which contains: nucleotides consisting of the nucleotide sequences of
genes with expression levels that vary in digestive organ cancer patients compared with normal healthy subjects,
genes with expression levels that vary in gastric cancer patients compared with normal healthy subjects,
genes with expression levels that vary in colorectal cancer patients compared with normal healthy subjects,
genes with expression levels that vary in pancreatic cancer patients compared with normal healthy subjects, or
genes with expression levels that vary in biliary tract cancer patients compared with normal healthy subjects for measurement of the expression levels of these genes, or
nucleotides containing partial sequences thereof.
The reagent contains nucleotides consisting of the nucleotide sequences of the above genes or nucleotides containing partial sequences thereof as probes or primers. The reagent is also a substrate such as a microarray on which nucleotides consisting of the nucleotide sequences of the above genes or nucleotides containing partial sequences thereof have been immobilized.
For example, a reagent or a kit for detecting digestive organ cancer contains at least one of the above 868 or 25 probes that can be used for detection of digestive organ cancer and is capable of measuring the expression level of at least one of genes corresponding to the probes. Also, a reagent or a kit for detecting gastric cancer contains at least one of the above 713 probes that can be used for detection of gastric cancer and is capable of measuring the expression level of at least one of genes corresponding to the probes. Also, a reagent or a kit for detecting colorectal cancer contains at least one of the above 771 probes that can be used for detection of colorectal cancer and is capable of measuring the expression level of at least one of genes corresponding to the probes. Moreover, a reagent or a kit for detecting pancreatic cancer contains at least one of 677 probes that can be used for detection of pancreatic cancer, and is capable of measuring the expression level of at least one of genes corresponding to the probes. Furthermore, a reagent or a kit for detecting biliary tract cancer contains at least one of 363 probes that can be used for detection of biliary tract cancer and is capable of measuring the expression level of at least one of genes corresponding to the probes.
The present invention encompasses a system for detecting digestive organ cancer, gastric cancer, colorectal cancer, pancreatic cancer, or biliary tract cancer of a subject by the method for detecting digestive organ cancer, gastric cancer, colorectal cancer, pancreatic cancer, or biliary tract cancer of the present invention.
The system for detecting digestive organ cancer, gastric cancer, colorectal cancer, pancreatic cancer, or biliary tract cancer of the present invention comprises:
(a) a data input means for inputting data concerning the gene expression profiles of a subject (here, the “data concerning gene expression profiles to be input” refers to data representing the expression level of each gene, such as a numerical value for signals in each gene;
(b) a memory means for storing the thus constructed discriminant model;
(c) a data processing means for applying data input using the input means (a) to the discriminant model stored in the memory means (b), and then determining the pathological conditions of digestive organ cancer, gastric cancer, colorectal cancer, pancreatic cancer, or biliary tract cancer; and
(d) a data output means for outputting data concerning the determination of predicted pathological conditions of digestive organ cancer, gastric cancer, colorectal cancer, pancreatic cancer, or biliary tract cancer, prediction of the pathological conditions, and prognostic prediction.
The data input means (a) contains a key board or an external memory device storing data, for example. The memory means (b) contains a hard disk, for example. The data processing means receives a discriminant model from the memory means and processing the input data, sends the processing result to the data output means, and then displaying the processing result with the data output means. The data processing means contains a central processing unit (CPU) and the like for processing data. Also, the output means contains a monitor, a printer, and the like for displaying the results.
The system of the present invention can be constructed using a commercially available personal computer and the like.
Examples
The present invention will be specifically described using the following examples, but the present invention is not limited to these examples.
Materials and experimental methods employed in the examples are as follows.
Object
Blood samples collected from patients diagnosed by a doctor as having digestive organ cancer, gastric cancer, colorectal cancer, pancreatic cancer, or biliary tract cancer were designated as a digestive organ cancer case, a gastric cancer case, a colorectal cancer case, a pancreatic cancer case, and a biliary tract cancer case, respectively. Regarding a control group, blood samples provided with the consent of patients who had received health checkups for residents held by local governments and consented to provide their blood were used herein. Blood samples were examined through a search for the following test items, and patients who exhibited normal values were designated as normal healthy subjects.
Test items: systolic blood pressure, diastolic blood pressure, number of erythrocytes, number of leukocytes, hemoglobin value, hematocrit value, liver functions (GOT, GPT, γ-GTP), renal functions (creatinine value), lipid metabolism (LDL cholesterol value, HDL cholesterol value, total cholesterol value), protein in urine, urinary blood
Collection of Peripheral Blood:
Peripheral blood was collected from patients using PAXgene™ RNA blood collecting tube (Becton, Dickinson and Company, Japan, Medical Device Marketing Authorization No. (Iryo-kiki Seizo Hanbai Ninsho No.): 218AFBZX00014000).
RNA Extraction and Hybridization
RNA was extracted via a PAXgene™ RNA blood collecting tube according to protocols using a PAXgene Blood RNA Kit (QIAGEN GmbH, Hilden, Germany). RNA was amplified based on the thus extracted RNA using a QuickAmp Labeling Kit, 1 color (Agilent Technologies, Santa Clara, Calif.), and at the same time labeled with a Cy3 dye. The thus labeled RNA was mixed using a Gene Expression Hybridization Kit (Agilent Technologies, Santa Clara, Calif.), followed by hybridization to Whole Human Genome oligo DNA microarrays (Agilent Technologies, Santa Clara, Calif.). In addition, the process from RNA amplification to hybridization was performed according to experimental protocols disclosed by Agilent Technologies.
Image Analysis and Data Analysis of DNA Microarrays:
The fluorescence intensity of each spot on the oligo DNA microarrays was acquired using a DNA microarray scanner (Agilent Technologies, Santa Clara, Calif.). The thus acquired images were processed with Feature Extraction software (Agilent Technologies, Santa Clara, Calif.), so that the fluorescence intensity of each spot was quantitated. The fluorescence intensity of a probe at each spot was calculated by quantitation.
The numerical values of the fluorescence intensities of all probes on the microarrays were normalized using GeneSpring GX (Agilent Technologies, Santa Clara, Calif.). A quality check was performed for the fluorescence intensity of each probe based on the thus normalized numerical value representing the enhanced or attenuated expression of each probe. Only probes that had passed the quality check were subjected as analytical objects to hierarchical clustering. Also, similarly, with the use of GeneSpring GX, genes with expression levels that were observed to differ between the digestive organ cancer patient group and the normal healthy subject group, were examined using Welch t-test as a statistic analysis tool. Candidate probes were extracted using the Benjamini and Hochberg False Discovery Rate as a multiple test and p<0.05 as significant value. Furthermore, similarly, with the use of GeneSpring GX, predictive determination was performed to determine if a subject belonged to a cancer case group or a normal healthy subject group (differing from the cancer case group or the normal healthy subject group used for extraction of candidate probes) using a class prediction tool and support vector machines for calculation.
The following results were obtained from the examples
1. Detection of Digestive Organ Cancer (1)
Hierarchical Clustering:
Hierarchical clustering was performed using a GeneSpring GX hierarchical clustering tool and 23352 probes that had passed a quality check. As shown in FIG. 9, 5 clusters were formed. In the 1st cluster, 3 out of 3 cases (100%) were digestive organ cancer cases. In the 2nd cluster, 8 out of 9 cases (88.9%) were digestive organ cancer cases. In the 3rd cluster, 5 out of 6 cases (83.3%) and in the 4th cluster, 9 out of 10 cases (90.0%) were digestive organ cancer cases. In the 5th cluster, 3 out of 4 cases (75.0%) were digestive organ cancer cases. Hence, digestive organ cancer cases and normal healthy subjects were separately clustered.
Genes with expression levels that were observed to differ between a digestive organ cancer case group and a normal healthy subject group:
Similarly, with the use of a GeneSpring GX Statistic Analysis tool, probes capable of discriminating between a digestive organ cancer case group and a normal healthy subject group were examined using the Benjamini and Hochberg false discovery rate for a multiple test and p<0.0005. As a result, the expression of 868 probes was observed to differ between the two groups.
Also, normalized numerical values for fluorescence intensities of the 868 probes were compared using a Fold Change tool between the digestive organ cancer case group and the normal healthy subject group. The expression of 555 probes was observed to be attenuated regardless of multiplying factor, and the expression of 313 probes was observed to be enhanced regardless of multiplying factor, in the digestive organ cancer case group, compared with normal healthy subjects. Also, the expression of 6 probes was observed to be attenuated at levels 0.4 times or less that of the normal healthy subject group and the expression of 15 probes was observed to be enhanced at levels 2.5 times or more that of the normal healthy subject group.
Hierarchical clustering with 868 probes corresponding to genes with expression levels that were observed to be attenuated or enhanced in digestive organ cancer cases compared with normal healthy subjects:
Hierarchical clustering was performed for subject cancer cases and normal healthy subjects using a total of 868 probes including the above 555 probes and 313 probes. As shown in FIG. 10, 3 clusters were formed. In the 1st cluster, 14 out of 14 cases (100%) were digestive organ cancer cases. In the 2nd cluster, 8 out of 8 cases (100%) were digestive organ cancer cases. In the 3rd cluster, 8 out of 10 cases (80%) were normal healthy subject cases. Thus, digestive organ cancer cases and normal healthy subjects were separately clustered.
Predictive determination using 868 probes corresponding to genes with expression levels that were observed to be attenuated or enhanced in digestive organ cancer cases compared with normal healthy subjects:
Similarly with the use of a GeneSpring GX Class Prediction tool, a prediction model was prepared based on 868 probes with expression levels that were observed to differ, using Support Vector Machines. The prediction model was applied to a cancer case group and a normal healthy subject group (separate from the cancer case group and the normal healthy subject group used for probe extraction and preparation of the prediction model) for which image analysis and data analysis had been performed for DNA microarrays by similar procedures. Thus, the probability of determining cancer cases to be cancer cases and the probability of determining normal healthy subjects to be normal healthy subjects were found. As a result, 39 out of 40 separately analyzed cancer cases were determined with the prediction model to be cancer cases and the probability that such cases had been properly diagnosed was 97.5%. Also, 9 out of 13 normal healthy subject cases were determined with prediction model to be normal healthy subjects, and the probability that such cases had been properly diagnosed was 69.2%. Altogether, 48 out of 53 such cases were correct answers. Thus, the percentage of cases determined correctly was 90.6% (48/53).
Hierarchical clustering with 21 probes corresponding to genes with expression levels that were observed to be attenuated at levels 0.4 times or less the normal healthy subject group or enhanced at levels 2.5 times or more the normal healthy subject group:
Hierarchical clustering was performed using a total of 21 probes including the above 6 probes and 15 probes for subject cancer cases and normal healthy subjects. As shown in FIG. 11, 3 clusters were formed. In the 1st cluster, 17 out of 17 cases (100%) were digestive organ cancer cases. In the 2nd cluster, 7 out of 9 cases (77.8%) were digestive organ cancer cases. In the 3rd cluster, 6 out of 6 cases (100%) were normal healthy subject cases. Thus, digestive organ cancer cases and normal healthy subjects were separately clustered.
Predictive determination using 21 probes corresponding to genes with expression levels that were observed to be attenuated at levels 0.4 times or less the normal healthy subject group or enhanced at levels 2.5 times or more the normal healthy subject group:
Similarly, with the use of a GeneSpring GX Class Prediction tool, a prediction model was prepared based on 21 probes observed to exhibit differences in expression, using Support Vector Machines. The prediction model was applied to a cancer case group and a normal healthy subject group (separate from the cancer case group and the normal healthy subject group used for probe extraction and preparation of the prediction model) for which image analysis and data analysis had been performed for DNA microarrays by similar procedures. Thus, the probability of determining cancer cases to be cancer cases and the probability of determining normal healthy subjects to be normal healthy subjects were found. As a result, 37 out of 40 separately analyzed cancer cases were determined with the prediction model to be cancer cases and the probability that such cases had been properly diagnosed was 92.5%. Also, 12 out of 13 normal healthy subjects were determined with the prediction model to be normal healthy subjects, and the probability that such cases had been properly diagnosed was 92.3%. Altogether, 49 out of 53 such cases were correct answers. Thus, the percentage of cases determined correctly was 92.5% (49/53).
1-2. Detection of Digestive Organ Cancer (2)
In a manner similar to that in the above detection of digestive organ cancer (1), 39 cancer cases and 15 normal healthy subject cases were examined using a GeneSpring GX hierarchical clustering tool and 23278 probes that had passed a quality check. As shown in FIG. 22, 5 clusters were formed. In the 1st cluster, 5 out of 5 cases (100%) were digestive organ cancer cases. In the 2nd cluster, 29 out of 30 cases (96.7%) were digestive organ cancer cases. In the 3rd cluster, 1 out of 1 case (100%) and in the 4th cluster, 6 out of 10 cases (60%) were digestive organ cancer cases. In the 5th cluster, 8 out of 8 cases (100%) were normal healthy subject cases. Thus, the digestive organ cancer cases and the normal healthy subjects were separately clustered.
Furthermore, in a manner similar to that in the above detection of digestive organ cancer (1), probes capable of discriminating between a group of 39 digestive organ cancer cases and a group of 15 normal healthy subject cases were examined using a GeneSpring GX Statistic Analysis tool. Probes were extracted using Benjamini and Hochberg False Discovery Rate as a multiple test and p<0.000005. The normalized numerical values of fluorescence intensities of the thus extracted probes were compared between the group of digestive organ cancer cases and the group of normal healthy subjects using a Fold Change tool. Thus, the expression of 14 probes was observed to be attenuated at levels 0.33 times or less that of the normal healthy subject group and the expression of 11 probes was observed to be enhanced at levels 3 times or more that of the normal healthy subject group (FIG. 21, SEQ ID NOs: 3030-3054).
Hierarchical clustering with 25 probes corresponding to genes with expression levels that were observed to be attenuated or enhanced in digestive organ cancer cases compared with normal healthy subjects:
Hierarchical clustering was performed using a total of 25 probes including the above 14 probes and 11 probes for subject cancer cases and normal healthy subjects. As shown in FIG. 23, 3 clusters were formed. In the 1st cluster, 31 out of 31 cases (100%) were digestive organ cancer cases. In the 2nd cluster, 6 out of 6 cases (100%) were digestive organ cancer cases. In the 3rd cluster, 15 out of cases (88.2%) were normal healthy subject cases. Thus, the digestive organ cancer cases and the normal healthy subjects were separately clustered.
Predictive determination using 25 probes corresponding to genes with expression levels that were observed to be attenuated or enhanced in digestive organ cancer cases compared with normal healthy subjects:
Similarly, with the use of a GeneSpring GX Class Prediction tool, a prediction model was prepared based on 25 probes observed to exhibit differences in expression, using Support Vector Machines. The prediction model was applied to cancer case group and a normal healthy subject group (separate from the cancer case group and the normal healthy subject group used for probe extraction and preparation of the prediction model) for which image analysis and data analysis had been performed for DNA microarrays by similar procedures. Thus, the probability of determining cancer cases to be cancer cases and the probability of determining normal healthy subjects to be normal healthy subjects were found. As a result, 37 out of 37 separately analyzed cancer cases were determined with the prediction model to be cancer cases and the probability that such cases had been properly diagnosed was 100%. Also, 11 out of 15 normal healthy subjects were determined with the prediction model to be normal healthy subjects, and the probability that such cases had been properly diagnosed was 73.3%. Altogether, 48 out of 52 such cases were correct answers. Thus, the percentage of cases determined correctly was 92.3% (48/52).
2. Detection of Gastric Cancer
Hierarchical Clustering:
Hierarchical clustering was performed using a GeneSpring GX hierarchical clustering tool and 22155 probes that had passed a quality check. As shown in FIG. 12, 4 clusters were formed. In the 1st cluster, 6 out of 6 cases (100%) were gastric cancer cases. In the 2nd cluster, 3 out of 4 cases (75%) were normal healthy subject cases. In the 3rd cluster, 3 out of 4 cases (75%) and in the 4th cluster, 2 out of 2 cases (100%) were normal healthy subject cases. Hence, gastric cancer cases and normal healthy subjects were separately clustered.
Genes with expression levels that were observed to differ between a gastric cancer case group and a normal healthy subject group:
Similarly, with the use of a GeneSpring GX Statistic Analysis tool, probes capable of discriminating between a gastric cancer case group and a normal healthy subject group were examined using the Benjamini and Hochberg false discovery rate for a multiple test and p<0.05. As a result, the expression of 3453 probes was observed to differ between the two groups.
Also, normalized numerical values for fluorescence intensities of the 3453 probes were compared using a Fold Change tool between the gastric cancer case group and the normal healthy subject group. The expression of 84 probes was observed to be attenuated in the gastric cancer case group at levels 0.5 times or less that of the normal healthy subject group and the expression of 629 probes was observed to be enhanced in the gastric cancer case group at levels 2 times or more that of the normal healthy subject group. Also, the expression of 6 probes was observed to be attenuated in the gastric cancer case group at levels 0.33 times or less that of the normal healthy subject group and the expression of 101 probes was observed to be enhanced in the gastric cancer case group at levels 3 times or more that of the normal healthy subject group.
Hierarchical clustering with 713 probes corresponding to genes with expression levels that were observed to be attenuated at levels 0.5 times or less or enhanced at levels 2 times or more that of the normal healthy subject group:
Hierarchical clustering was performed for subject cancer cases and normal healthy subjects using a total of 713 probes including the above 84 probes and 629 probes. As shown in FIG. 13, 2 clusters were formed, in which a cluster of cancer cases accounting for 100% and a cluster of normal healthy subject cases accounting for 100%.
Predictive determination using 713 probes corresponding to genes with expression levels that were observed to be attenuated at levels 0.5 times or less or enhanced at levels 2 times or more that of the normal healthy subject group:
Similarly with the use of a GeneSpring GX Class Prediction tool, a prediction model was prepared based on 713 probes with expression levels that were observed to differ, using Support Vector Machines. The prediction model was applied to a cancer case group and a normal healthy subject group (separate from the cancer case group and the normal healthy subject group used for probe extraction and preparation of the prediction model) for which image analysis and data analysis had been performed for DNA microarrays by similar procedures. Thus, the probability of determining cancer cases to be cancer cases and the probability of determining normal healthy subjects to be normal healthy subjects were found. As a result, 7 out of 10 separately analyzed cancer cases were determined with the prediction model to be cancer cases and the probability that such cases had been properly diagnosed was 70%. Also, 13 out of 13 normal healthy subject cases were determined with prediction model to be normal healthy subject cases, and the probability that such cases had been properly diagnosed was 100%. Altogether, 20 out of 23 such cases were correct answers. Thus, the percentage of cases determined correctly was 87.0% (20/23).
Hierarchical clustering with 107 probes corresponding to genes with expression levels that were observed to be attenuated at levels 0.33 times or less or enhanced at levels 3 times or more that of the normal healthy subject group:
Hierarchical clustering was performed for subject cancer cases and normal healthy subjects using a total of 107 probes including the above 6 probes and 101 probes. As shown in FIG. 14, 2 clusters were formed, in which a cluster of cancer cases accounting for 100% and a cluster of normal healthy subject cases accounting for 100%.
Predictive determination using 107 probes corresponding to genes with expression levels that were observed to be attenuated at levels 0.33 times or less or enhanced at levels 3 times or more that of the normal healthy subject group:
Similarly with the use of a GeneSpring GX Class Prediction tool, a prediction model was prepared based on 107 probes with expression levels that were observed to differ, using Support Vector Machines. The prediction model was applied to a cancer case group and a normal healthy subject group (separate from the cancer case group and the normal healthy subject group used for probe extraction and preparation of the prediction model) for which image analysis and data analysis had been performed for DNA microarrays by similar procedures. Thus, the probability of determining cancer cases to be cancer cases and the probability of determining normal healthy subjects to be normal healthy subjects were found. As a result, 8 out of 10 separately analyzed cancer cases were determined with the prediction model to be cancer cases and the probability that such cases had been properly diagnosed was 80%. Also, 13 out of 13 normal healthy subject cases were determined with prediction model to be normal healthy subject cases, and the probability that such cases had been properly diagnosed was 100%. Altogether, 21 out of 23 such cases were correct answers. Thus, the percentage of cases determined correctly was 91.3% (21/23).
3. Detection of Colorectal Cancer
Hierarchical Clustering:
Hierarchical clustering was performed using a GeneSpring GX hierarchical clustering tool and 22181 probes that had passed a quality check. As shown in FIG. 15, 3 clusters were formed. In the 1st cluster, 4 out of 5 cases (80%) were colorectal cancer cases. In the 2nd cluster, 6 out of 7 cases (85.7%) were normal healthy subject cases. In the 3rd cluster, 3 out of 4 cases (75%) were colorectal cancer cases. Hence, colorectal cancer cases and normal healthy subjects were separately clustered.
Also, normalized numerical values for fluorescence intensities of the 5267 probes were compared using a Fold Change tool between the colorectal cancer case group and the normal healthy subject group. The expression of 125 probes was observed to be attenuated in the large bowel case group at levels 0.5 times or less that of the normal healthy subject group and the expression of 646 probes was observed to be enhanced in the colorectal cancer case group at levels 2 times or more that of the normal healthy subject group. Also, the expression of 9 probes was observed to be attenuated in the colorectal cancer case group at levels 0.33 times or less that of the normal healthy subject group and the expression of 107 probes was observed to be enhanced in the colorectal cancer case group at levels 3 times or more that of the normal healthy subject group.
Hierarchical clustering with 771 probes corresponding to genes with expression levels that were observed to be attenuated at levels 0.5 times or less or enhanced at levels 2 times or more that of the normal healthy subject group:
Hierarchical clustering was performed for subject cancer cases and normal healthy subjects using a total of 771 probes including the above 125 probes and 646 probes. As shown in FIG. 16, 3 clusters were formed. In the 1st cluster, 5 out of 5 cases (100%) were colorectal cancer cases. In the 2nd cluster, 3 out of 5 cases (60.0%) were colorectal cancer cases. In the 3rd cluster, 7 out of 7 cases (100%) were normal healthy subject cases.
Predictive determination using 771 probes corresponding to genes with expression levels that were observed to be attenuated at levels 0.5 times or less or enhanced at levels 2 times or more that of the normal healthy subject group:
Similarly with the use of a GeneSpring GX Class Prediction tool, a prediction model was prepared based on 771 probes with expression levels that were observed to differ, using Support Vector Machines. The prediction model was applied to a cancer case group and a normal healthy subject group (separate from the cancer case group and the normal healthy subject group used for probe extraction and preparation of the prediction model) for which image analysis and data analysis had been performed for DNA microarrays by similar procedures. Thus, the probability of determining cancer cases to be cancer cases and the probability of determining normal healthy subjects to be normal healthy subjects were found. As a result, 9 out of 10 separately analyzed cancer cases were determined with the prediction model to be cancer cases and the probability that such cases had been properly diagnosed was 90%. Also, 13 out of 13 normal healthy subject cases were determined with prediction model to be normal healthy subject cases, and the probability that such cases had been properly diagnosed was 100%. Altogether, 22 out of 23 such cases were correct answers. Thus, the percentage of cases determined correctly was 95.7% (22/23).
Hierarchical clustering with 116 probes corresponding to genes with expression levels that were observed to be attenuated at levels 0.33 times or less or enhanced at levels 3 times or more that of the normal healthy subject group:
Hierarchical clustering was performed using a total of 116 probes including the above 9 probes and 107 probes for subject cancer cases and normal healthy subjects. As shown in FIG. 17, 3 clusters were formed. In the 1st cluster, 5 out of 5 cases (100%) were colorectal cancer cases. In the 2nd cluster, 3 out of 6 cases (50.0%) were colorectal cancer cases. In the 3rd cluster, 5 out of 5 cases (100%) were normal healthy subject cases.
Predictive determination using 116 probes corresponding to genes with expression levels that were observed to be attenuated at levels 0.33 times or less or enhanced at levels 3 times or more that of the normal healthy subject group:
Similarly with the use of a GeneSpring GX Class Prediction tool, a prediction model was prepared based on 116 probes with expression levels that were observed to differ, using Support Vector Machines. The prediction model was applied to a cancer case group and a normal healthy subject group (separate from the cancer case group and the normal healthy subject group used for probe extraction and preparation of the prediction model) for which image analysis and data analysis had been performed for DNA microarrays by similar procedures. Thus, the probability of determining cancer cases to be cancer cases and the probability of determining normal healthy subjects to be normal healthy subjects were found. As a result, 9 out of 10 separately analyzed cancer cases were determined with the prediction model to be cancer cases and the probability that such cases had been properly diagnosed was 90%. Also, 13 out of 13 normal healthy subject cases were determined with prediction model to be normal healthy subject cases, and the probability that such cases had been properly diagnosed was 100%. Altogether, 22 out of 23 such cases were correct answers. Thus, the percentage of cases determined correctly was 95.7% (22/23).
4. Detection of Pancreatic Cancer
Hierarchical Clustering:
Hierarchical clustering was performed using a GeneSpring GX hierarchical clustering tool and 22149 probes that had passed a quality check. As shown in FIG. 18, 3 clusters were formed. In the 1st cluster, 7 out of 7 cases (100%) were normal healthy subject cases. In the 2nd cluster, 4 out of 5 cases (80%) were pancreatic cancer cases. In the 3rd cluster, 4 out of 4 cases (100%) were pancreatic cancer cases. Hence, pancreatic cancer cases and normal healthy subjects were separately clustered.
Genes with expression levels that were observed to differ between a pancreatic cancer case group and a normal healthy subject group:
Similarly, with the use of a GeneSpring GX Statistic Analysis tool, probes capable of discriminating between a pancreatic cancer case group and a normal healthy subject group were examined using the Benjamini and Hochberg false discovery rate for a multiple test and p<0.05. As a result, the expression of 3301 probes was observed to differ between the two groups.
Also, normalized numerical values for fluorescence intensities of the 3301 probes were compared using a Fold Change tool between the pancreatic cancer case group and the normal healthy subject group. The expression of 96 probes was observed to be attenuated in the pancreatic cancer case group at levels 0.5 times or less that of the normal healthy subject group and the expression of 581 probes was observed to be enhanced in the pancreatic cancer case group at levels 2 times or more that of the normal healthy subject group. Also, the expression of 6 probes was observed to be attenuated in the pancreatic cancer case group at levels 0.33 times or less that of the normal healthy subject group and the expression of 55 probes was observed to be enhanced in the pancreatic cancer case group at levels 3 times or more that of the normal healthy subject group.
Hierarchical clustering with 677 probes corresponding to genes with expression levels that were observed to be attenuated at levels 0.5 times or less or enhanced at levels 2 times or more that of the normal healthy subject group:
Hierarchical clustering was performed for subject cancer cases and normal healthy subjects using a total of 677 probes including the above 96 probes and 581 probes. As shown in FIG. 19, 2 clusters were formed. In the 1st cluster, 8 out of 9 cases (88.9%) were normal healthy subject cases. In the 2nd cluster, 7 out of 7 cases (100%) were pancreatic cancer cases.
Predictive determination using 677 probes corresponding to genes with expression levels that were observed to be attenuated at levels 0.5 times or less or enhanced at levels 2 times or more that of the normal healthy subjects:
Similarly with the use of a GeneSpring GX Class Prediction tool, a prediction model was prepared based on 677 probes with expression levels that were observed to differ, using Support Vector Machines. The prediction model was applied to a cancer case group and a normal healthy subject group (separate from the cancer case group and the normal healthy subject group used for probe extraction and preparation of the prediction model) for which image analysis and data analysis had been performed for DNA microarrays by similar procedures. Thus, the probability of determining cancer cases to be cancer cases and the probability of determining normal healthy subjects to be normal healthy subjects were found. As a result, 15 out of 20 separately analyzed cancer cases were determined with the prediction model to be pancreatic cancer cases and the probability that such cases had been properly diagnosed was 75%. Also, 13 out of 13 normal healthy subject cases were determined with prediction model to be normal healthy subject cases, and the probability that such cases had been properly diagnosed was 100%. Altogether, 28 out of 33 such cases were correct answers. Thus, the percentage of cases determined correctly was 84.8% (28/33).
Hierarchical clustering with 61 probes corresponding to genes with expression levels that were observed to be attenuated at levels 0.33 times or less or enhanced at levels 3 times or more that of the normal healthy subject group:
Hierarchical clustering was performed for subject cancer cases and normal healthy subjects using a total of 61 probes including the above 6 probes and 55 probes. As shown in FIG. 20, 2 clusters were formed. In the 1st cluster, 8 out of 9 cases (88.9%) were normal healthy subject cases. In the 2nd cluster, 7 out of 7 cases (100%) were pancreatic cancer cases.
Predictive determination using 61 probes corresponding to genes with expression levels that were observed to be attenuated at levels 0.33 times or less or enhanced at levels 3 times or more that of the normal healthy subjects:
Similarly with the use of a GeneSpring GX Class Prediction tool, a prediction model was prepared based on 61 probes with expression levels that were observed to differ, using Support Vector Machines. The prediction model was applied to a cancer case group and a normal healthy subject group (separate from the cancer case group and the normal healthy subject group used for probe extraction and preparation of the prediction model) for which image analysis and data analysis had been performed for DNA microarrays by similar procedures. Thus, the probability of determining cancer cases to be cancer cases and the probability of determining normal healthy subjects to be normal healthy subjects were found. As a result, 15 out of 20 separately analyzed cancer cases were determined with the prediction model to be pancreatic cancer cases and the probability that such cases had been properly diagnosed was 75%. Also, 9 out of 13 normal healthy subject cases were determined with prediction model to be normal healthy subject cases, and the probability that such cases had been properly diagnosed was 69.2%. Altogether, 24 out of 33 such cases were correct answers. Thus, the percentage of cases determined correctly was 72.7% (24/33).
5. Detection of Biliary Tract Cancer
Hierarchical Clustering
Hierarchical clustering was performed using a GeneSpring GX hierarchical clustering tool and 22066 probes that had passed a quality check. As shown in FIG. 25, 3 clusters were formed. In the 1st cluster, 7 out of 7 cases (100%) were normal healthy subject cases. In the 2nd cluster, 3 out of 3 cases (100%) were biliary tract cancer cases. In the 3rd cluster, 5 out of 6 cases (83.3%) were biliary tract cancer cases. Hence, biliary tract cancer cases and normal healthy subjects were separately clustered.
Genes with expression levels that were observed to differ between a biliary tract cancer case group and a normal healthy subject group:
Similarly, with the use of a GeneSpring GX Statistic Analysis tool, probes capable of discriminating between a biliary tract cancer case group and a normal healthy subject group were examined using the Benjamini and Hochberg false discovery rate for a multiple test and p<0.05. As a result, the expression of 8090 probes was observed to differ between the two groups.
Also, normalized numerical values for fluorescence intensities of the 8090 probes were compared using a Fold Change tool between the biliary tract cancer case group and the normal healthy subject group. The expression of 98 probes was observed to be attenuated in the biliary tract cancer case group at levels 0.33 times or less that of the normal healthy subject group and the expression of 265 probes was observed to be enhanced in the biliary tract cancer case group at levels 3 times or more that of the normal healthy subject group.
Hierarchical clustering with 363 probes corresponding to genes with expression levels that were observed to be attenuated at levels 0.33 times or less or enhanced at levels 3 times or more that of the normal healthy subject group:
Hierarchical clustering was performed for subject cancer cases and normal healthy subjects using a total of 363 probes including the above 98 probes and 265 probes. As shown in FIG. 26, 2 clusters were formed. In the 1st cluster, 7 out of 7 cases (100%) were normal healthy subject cases. In the 2nd cluster, 8 out of 9 cases (88.9%) were biliary tract cancer cases.
Predictive determination using 363 probes corresponding to genes with expression levels that were observed to be attenuated at levels 0.33 times or less or enhanced at levels 3 times or more that of the normal healthy subjects:
Similarly with the use of a GeneSpring GX Class Prediction tool, a prediction model was prepared based on 363 probes with expression levels that were observed to differ, using Support Vector Machines. The prediction model was applied to a cancer case group and a normal healthy subject group (separate from the cancer case group and the normal healthy subject group used for probe extraction and preparation of the prediction model) for which image analysis and data analysis had been performed for DNA microarrays by similar procedures. Thus, the probability of determining cancer cases to be cancer cases and the probability of determining normal healthy subjects to be normal healthy subjects were found. As a result, 8 out of 8 separately analyzed cancer cases were determined with the prediction model to be cancer cases and the probability that such cases had been properly diagnosed was 100%. Also, 13 out of 13 normal healthy subject cases were determined with prediction model to be normal healthy subject cases, and the probability that such cases had been properly diagnosed was 100%. Altogether, 21 out of 21 such cases were correct answers. Thus, the percentage of cases determined correctly was 100% (21/21).
All publications, patents, and patent applications cited in this description are herein incorporated by reference in their entirety