US9282304B1 - Full-color images produced by white-light interferometry - Google Patents
Full-color images produced by white-light interferometry Download PDFInfo
- Publication number
- US9282304B1 US9282304B1 US14/293,662 US201414293662A US9282304B1 US 9282304 B1 US9282304 B1 US 9282304B1 US 201414293662 A US201414293662 A US 201414293662A US 9282304 B1 US9282304 B1 US 9282304B1
- Authority
- US
- United States
- Prior art keywords
- sample
- component
- irradiance
- irradiance data
- color
- Prior art date
- Legal status (The legal status is an assumption and is not a legal conclusion. Google has not performed a legal analysis and makes no representation as to the accuracy of the status listed.)
- Expired - Fee Related, expires
Links
- 238000005305 interferometry Methods 0.000 title description 6
- 238000000034 method Methods 0.000 claims description 47
- 238000005259 measurement Methods 0.000 claims description 19
- 238000012545 processing Methods 0.000 claims description 13
- 238000004519 manufacturing process Methods 0.000 claims 3
- 238000013459 approach Methods 0.000 description 18
- 238000005286 illumination Methods 0.000 description 7
- 238000002310 reflectometry Methods 0.000 description 7
- 238000001514 detection method Methods 0.000 description 3
- 238000000339 bright-field microscopy Methods 0.000 description 2
- 238000004364 calculation method Methods 0.000 description 2
- 230000000694 effects Effects 0.000 description 2
- 238000003384 imaging method Methods 0.000 description 2
- 238000013519 translation Methods 0.000 description 2
- 238000004458 analytical method Methods 0.000 description 1
- 239000003086 colorant Substances 0.000 description 1
- 238000010276 construction Methods 0.000 description 1
- 230000001276 controlling effect Effects 0.000 description 1
- 230000002596 correlated effect Effects 0.000 description 1
- 230000002708 enhancing effect Effects 0.000 description 1
- 238000001914 filtration Methods 0.000 description 1
- 239000011521 glass Substances 0.000 description 1
- 238000013507 mapping Methods 0.000 description 1
- 239000000463 material Substances 0.000 description 1
- 239000000203 mixture Substances 0.000 description 1
- 230000007935 neutral effect Effects 0.000 description 1
- 230000003287 optical effect Effects 0.000 description 1
- 238000000879 optical micrograph Methods 0.000 description 1
- 230000007170 pathology Effects 0.000 description 1
- 229920001296 polysiloxane Polymers 0.000 description 1
- 238000000926 separation method Methods 0.000 description 1
- 230000003595 spectral effect Effects 0.000 description 1
- 238000001228 spectrum Methods 0.000 description 1
- 238000010561 standard procedure Methods 0.000 description 1
- 238000004441 surface measurement Methods 0.000 description 1
- 230000000007 visual effect Effects 0.000 description 1
Images


Classifications
-
- H04N9/735—
-
- H—ELECTRICITY
- H04—ELECTRIC COMMUNICATION TECHNIQUE
- H04N—PICTORIAL COMMUNICATION, e.g. TELEVISION
- H04N23/00—Cameras or camera modules comprising electronic image sensors; Control thereof
- H04N23/80—Camera processing pipelines; Components thereof
- H04N23/84—Camera processing pipelines; Components thereof for processing colour signals
- H04N23/88—Camera processing pipelines; Components thereof for processing colour signals for colour balance, e.g. white-balance circuits or colour temperature control
-
- G—PHYSICS
- G01—MEASURING; TESTING
- G01B—MEASURING LENGTH, THICKNESS OR SIMILAR LINEAR DIMENSIONS; MEASURING ANGLES; MEASURING AREAS; MEASURING IRREGULARITIES OF SURFACES OR CONTOURS
- G01B9/00—Measuring instruments characterised by the use of optical techniques
- G01B9/02—Interferometers
- G01B9/02041—Interferometers characterised by particular imaging or detection techniques
-
- G—PHYSICS
- G02—OPTICS
- G02B—OPTICAL ELEMENTS, SYSTEMS OR APPARATUS
- G02B21/00—Microscopes
- G02B21/0004—Microscopes specially adapted for specific applications
- G02B21/002—Scanning microscopes
- G02B21/0024—Confocal scanning microscopes (CSOMs) or confocal "macroscopes"; Accessories which are not restricted to use with CSOMs, e.g. sample holders
- G02B21/0052—Optical details of the image generation
- G02B21/0056—Optical details of the image generation based on optical coherence, e.g. phase-contrast arrangements, interference arrangements
-
- H—ELECTRICITY
- H04—ELECTRIC COMMUNICATION TECHNIQUE
- H04N—PICTORIAL COMMUNICATION, e.g. TELEVISION
- H04N23/00—Cameras or camera modules comprising electronic image sensors; Control thereof
- H04N23/10—Cameras or camera modules comprising electronic image sensors; Control thereof for generating image signals from different wavelengths
- H04N23/12—Cameras or camera modules comprising electronic image sensors; Control thereof for generating image signals from different wavelengths with one sensor only
-
- H04N9/07—
-
- H—ELECTRICITY
- H04—ELECTRIC COMMUNICATION TECHNIQUE
- H04N—PICTORIAL COMMUNICATION, e.g. TELEVISION
- H04N13/00—Stereoscopic video systems; Multi-view video systems; Details thereof
- H04N13/20—Image signal generators
-
- H—ELECTRICITY
- H04—ELECTRIC COMMUNICATION TECHNIQUE
- H04N—PICTORIAL COMMUNICATION, e.g. TELEVISION
- H04N13/00—Stereoscopic video systems; Multi-view video systems; Details thereof
- H04N13/20—Image signal generators
- H04N13/204—Image signal generators using stereoscopic image cameras
- H04N13/254—Image signal generators using stereoscopic image cameras in combination with electromagnetic radiation sources for illuminating objects
-
- H—ELECTRICITY
- H04—ELECTRIC COMMUNICATION TECHNIQUE
- H04N—PICTORIAL COMMUNICATION, e.g. TELEVISION
- H04N13/00—Stereoscopic video systems; Multi-view video systems; Details thereof
- H04N13/20—Image signal generators
- H04N13/257—Colour aspects
Definitions
- the invention relates in general to white-light interferometry. In particular, it relates to a new approach for producing microscope-like color images from interferometric data.
- Imaging of true color has now become an important aspect of interferometric profiling, especially in the fields of biology and pathology, where color as well as structure provides a great deal of visual information to the trained observer. Accordingly, much effort has been devoted to obtaining color images that represent the sample with the high precision afforded by interferometric measurements. For example, one approach has been to provide a 3-D interferometric objective and a bright-field objective in the same instrument to produce both height and color data through independent measurements that are then combined to obtain a high-precision 3-D color image. However, this approach requires two separate measurements, a process that lengthens the data acquisition time beyond what may be acceptable for certain applications.
- Yamauchi Takashi describes an interferometric color-imaging approach based on the usage of either a monochromatic or an RGB (red-green-blue) color camera.
- Three light sources RGB, generated either independently or through filtered white light
- RGB red-green-blue
- the interference effect is then removed from the data to provide true RGB color information that is combined with the height data to produce a full-color interferometric 3-D image. Since both height and color are generated by the same measurement, the procedure is precise and faster than what could be attained by combining microscope and interferometer data.
- the present invention addresses the same problem with a simplified approach for producing in a rapid and computationally efficient manner a full-color interferometric image of a sample surface.
- the procedure is based on the mathematical representation of the irradiance produced by interferometry.
- the method of the invention is carried out with a conventional white-light-interferometry (WLI) instrument fitted with a color (RGB) camera.
- WLI white-light-interferometry
- RGB color
- WLI is well known in the art; therefore, it will not be described here other than in the context of the procedure of the invention.
- RGB color
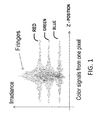
- FIG. 1 When interferometric data are collected with an RGB camera, fringes with a modulation envelope are generated by each of the red, green and blue wavelengths at each pixel, as illustrated in FIG. 1 .
- the peak of modulation used in conventional manner to calculate the relative height of the pixel (such as by the center-of-mass technique described in U.S. Pat. No. 5,633,715) will be substantially at the same Z scanning position.
- the objective of the invention is to extract substantially true colors from the modulation data of FIG. 1 .
- I R ⁇ ⁇ G ⁇ ⁇ B ⁇ ( z ) I obj R ⁇ ⁇ G ⁇ ⁇ B + I ref R ⁇ ⁇ G ⁇ ⁇ B + g R ⁇ ⁇ G ⁇ ⁇ B ⁇ ( z ) ⁇ I obj R ⁇ ⁇ G ⁇ ⁇ B ⁇ I ref R ⁇ ⁇ G ⁇ ⁇ B ⁇ cos ⁇ ( 2 ⁇ ⁇ ⁇ ⁇ z + ⁇ ) , ( 1 )
- I obj RGB represents the red, green or blue wavefront intensity returned by the sample
- I ref RGB represents the red, green or blue wavefront intensity returned by the reference mirror
- g RGB (z) is the signal modulation function associated with the objective and light source used by the white-light interferometer
- ⁇ is average wavelength
- ⁇ is phase. The value of z varies linearly with the physical separation between the sample and the reference mirror (i.e., scanner motion), while the phase ⁇ is introduced by the relative height of each sample pixel with respect to the reference plane.
- Equation 1 is solved and red, green or blue wave-front irradiance, I obj RGB , is identified at every pixel. Once so determined, the red, green and blue irradiances returning from the sample object are combined to obtain an accurate color image of the pixel. This is accomplished for each pixel by first removing the interference term
- the DC component of Equation 1 is obtained directly for each color from measurement data acquired away from focus; that is, in scan zones outside the coherence of the light source or sources.
- the reference mirror contribution to the DC component I ref RGB is then subtracted to obtain the object contribution to the color wavefront irradiance, I obj RGB .
- This approach (as well as the general one described in the previous paragraph) can be further simplified by using a low-reflection reference mirror or a beam splitter that reduces the relative intensity of the reference beam, thereby minimizing the reference-mirror contribution to the interference beam detected at the camera.
- irradiance measurements acquired outside the coherence envelope of the interferogram i.e., away from focus, as in the case above
- FIG. 1 is an illustration of typical modulation envelopes (fringes) obtained recording interferometric irradiance with a color RGB camera.
- FIG. 2 shows for reference the grayscale version of a two-dimensional bright-field image of a metallic sample captured with a bright-field microscope objective.
- FIG. 3 shows the grayscale version of a color image with fringes generated by white-light interference data from the same sample of FIG. 2 .
- FIG. 4 illustrates the grayscale version of the two-dimensional color image obtained according to the invention from the interference data of FIG. 3 without any additional color enhancement.
- FIG. 5 shows a high-precision three-dimensional grayscale view of the sample of FIG. 3 obtained with the combined interferometric height and color measurements of the invention.
- FIG. 6 is a flow-chart of the steps involved in the preferred method of the invention.
- FIG. 7 is a schematic representation of apparatus suitable for carrying out the procedure of the invention using conventional interferometric instrumentation with the addition of side illumination and a computer programmed to perform the required steps.
- FIG. 8 illustrates the grayscale version of the two-dimensional color image obtained according to a simplified version of invention from the sample of FIG. 2 .
- FIG. 9 illustrates in grayscale the two-dimensional color image obtained according to a still simpler version of invention from the sample of FIG. 2 .
- the general idea of the invention is to obtain a color map of a sample object from interferometric data by removing the contribution of interference fringes and of the reference mirror signals from the irradiance detected by a color camera.
- the resulting irradiance component at each pixel corresponds substantially to a bright-field signal received from the sample, from which a substantially true-color map can be composed, especially from in-focus data frames.
- true-color and full-color are used interchangeably to indicate an image having the color quality of an image produced by a conventional bright-field microscope.
- reference surface and reference mirror are both used to refer to the reflective unit in the reference arm of an interferometer.
- sample, object and sample object are used equivalently, as is normal in the art, with regard to the arm of the interferometer directed to the measured surface.
- White light is intended to refer to a wavefront of sufficient wavelengths to represent fairly the true color of the sample object.
- white light as used in the description as well as in the claims of the invention, is intended to cover also multiple single-color wavefronts from different sources, if detected by a color camera and processed according to the invention.
- beam and wavefront are used interchangeably throughout.
- g R ⁇ ⁇ G ⁇ ⁇ B ⁇ ( z ) ⁇ I obj R ⁇ ⁇ G ⁇ ⁇ B ⁇ I ref R ⁇ ⁇ G ⁇ ⁇ B ⁇ cos ⁇ ( 2 ⁇ ⁇ ⁇ ⁇ ⁇ z + ⁇ ) can be accomplished in different ways. From FIG. 1 it can readily be seen that a simple and fast approach consists of estimating the value of the average irradiance of the signal across all or a portion, such as through focus, of the sampled points along the scan. The value obtained in this manner approaches the sum of the irradiance received from the sample object and from the reference mirror (i.e., the value of I obj RGB +I ref RGB ). Equivalently, as is known in the art, the value of the interference term can also be determined as the first term (the DC term) of a Discrete Fourier Transform (DFT) of the recorded signal at each pixel.
- DFT Discrete Fourier Transform
- the preferred implementation consists of filtering the irradiance signal with a conventional low-pass filter considered optimal for the application. While many such FIR (Finite Impulse Response) or IIR (Infinite Impulse Response) filters are known, the five-point FIR filter ⁇ 0.125, 0.25, 0.25, 0.25, 0.125 ⁇ commonly used in the art has been found to be appropriate for the purposes of the invention. This filter is adequate when the irradiance data are acquired at
- the resulting irradiance the DC component of the irradiance signal
- I DC RGB ( z ) I obj RGB +I ref RGB , (2) where the subscript DC refers to the unmodulated signal.
- I ref RGB the beam intensity returned by the reference mirror
- the determination of the signal returned by the reference mirror I ref RGB can be measured a priori and stored. For example, if the data are collected from a black (non-reflective) object, the irradiance measured by the camera is close to the actual intensity of the signal returned just by the reference mirror.
- the preferred approach is based on the explicit determination of the value of I ref RGB by combining Equation 2 with an expression for the modulating envelope of fringes, M RGB (k), from Equation 1. Explicitly, at each data acquisition frame “k” recorded by the color camera and for each color, the following set of equations is solved for each pixel:
- Equations 3 contains two equations and three unknowns (I obj RGB , I ref RGB , g RGB (k)), we choose to select the function g RGB (k) such that it represents a scaled version of the calculated modulation envelope M RGB (k).
- the envelope modulation M RGB (k) can be computed by many standard procedures. For example, using the algorithm developed by Larkin (K. G. Larkin “Efficient nonlinear algorithm for envelope detection in white light interferometry”, J. Opt. Soc. Am. A/Vol. 13, No.
- the value of the modulation can be expressed in terms of five consecutive points, as follows: M ( k ) ⁇ [( I k+1 ⁇ I k ⁇ 1 ) 2 ⁇ ( I k+2 ⁇ I k )( I k ⁇ I k ⁇ 2 )] 1/2 (4) where k is data acquisition frame.
- FIG. 2 shows in grayscale the two-dimensional color image of a metallic sample captured with a bright-field microscope objective.
- FIG. 3 shows in grayscale the color picture generated by white-light interference data from the same sample.
- FIG. 4 illustrates in grayscale the two-dimensional color image obtained according to the invention from the interference data of FIG. 3 with no further color enhancement. As can be seen by comparing FIGS. 2 and 4 , the invention produces a good representation of a true-color image from interferometric data.
- FIG. 5 shows in grayscale a high-precision three-dimensional color view of the sample of FIG. 3 , which further illustrates the advantages of the invention.
- digital color images can be enhanced and manipulated in many ways to highlight features that may be most important for the application at hand.
- the image may be enhanced by the use of a high numerical-aperture objective, or by the use of a beam splitter passing a much larger than normal fraction of the source beam to the object than to the reference surface (i.e., an 80-20 splitter).
- a well known method for enhancing images generated from surfaces having low reflectivity is by means of so-called side illumination.
- a separate source of white light is used to illuminate the sample directionally from outside the interferometric objective, such as from a side, all sides, from all around, at different angles, diffusively, and so on. In any such case, the light irradiated at the detector will be
- I R ⁇ ⁇ G ⁇ ⁇ B ⁇ ( z ) I obj R ⁇ ⁇ G ⁇ ⁇ B + I ref R ⁇ ⁇ G ⁇ ⁇ B + I side R ⁇ ⁇ G ⁇ ⁇ B + g R ⁇ ⁇ G ⁇ ⁇ B ⁇ ( z ) ⁇ I obj R ⁇ ⁇ G ⁇ ⁇ B ⁇ I ref R ⁇ ⁇ G ⁇ ⁇ B ⁇ cos ⁇ ( 2 ⁇ ⁇ ⁇ ⁇ ⁇ z + ⁇ ) , ( 6 )
- I side RGB (z) is the contribution received from the object as a result of the additional illumination.
- Such side illumination has been found to contribute advantageously to color detection based on the DC component interferometric irradiance when low-reflectivity samples are involved. Therefore, the practice is preferred in such cases.
- Another approach for color enhancement is based on white balance calibration (that is, the scaling of R, G, B irradiance to that of neutral—white—objects so that objects believed to be neutral appear so).
- white balance calibration that is, the scaling of R, G, B irradiance to that of neutral—white—objects so that objects believed to be neutral appear so.
- the calibration is normally done on a white area of the sample observed by the objective.
- the calibration is typically done using high illumination and a preferably tilted black and rough felt as the object. Under such conditions, the detector is calibrated so as to register the same signal values for R, G and B at each pixel.
- the reference mirror typically has a fairly flat reflectance throughout the spectrum and setting it to perfectly white only slightly affects the color of the sample.
- FIG. 6 is a flow-chart of the basic steps involved in the procedure of the invention.
- FIG. 7 is a schematic representation of the apparatus required to carry out the procedure using conventional interferometric instrumentation, including an additional light source for optional side illumination, and a computer with non-transitory computer-readable medium programmed to perform the steps of the invention.
- the Z-scanning interferometer 10 includes with a microscope objective 12 and a sample stage 14 capable of relative translation in the X and Y plane to acquire images of a sample surface 16 .
- the interferometer comprises a light source 18 (which can be white light source or comprise multiple independent narrowband sources, such as R, G and B) illuminating a reference mirror 20 and the sample surface 16 through the microscope objective 12 .
- a suitable focusing mechanism 24 is provided to place the sample surface in focus and to track the height changes of the sample surface as the objective scans it so as to keep the sample in focus following any X-Y translation during the measurement. Combining the light beams generated in reflection from the mirror and the sample surface, interference fringes are produced as a result of the optical path difference between the two beams generated by the vertical scan.
- a detector 26 (a color camera or multiple cameras, each for detection of a color) and appropriate electronic components 28 are provided to acquire and transmit digitized irradiance data and for further processing by electronic apparatus, such as a computer 30 and an image display device 32 .
- the interferometer is also equipped with an additional light source 34 for side illumination as described above. The intensity of the light sources 18 and 34 can be varied precisely by controlling the level of power input to them.
- a controller 36 is connected to the computer 30 and the focusing mechanism 24 for bringing the sample surface 16 into focus prior to the vertical scan.
- the controller 36 is adapted for automated operation through the computer 30 and for manual operation via a joy stick or similar device 38 in response to information displayed for a user on the monitor 32 .
- Appropriate software is provided to enable processing according to the invention, as detailed above and below.
- FIG. 8 illustrates in grayscale a color picture obtained by this simplified approach using off-focus interference data from the same scan that produced the image of FIG. 3 with the addition of conventional color enhancement, as explained above.
- a yet simpler approach consists of minimizing the reference-surface contribution to the interference signal by either using a very-low-reflectivity reference mirror, such as glass, or by reducing the intensity of the beam transmitted to it in relation to the intensity of the beam transmitted to the sample surface (that is, by reducing the reference-surface contribution to the DC component of the irradiance data in relation to the sample-surface component thereof).
- the latter can be achieved simply with the proper selection of the beam splitter in the interferometric objective.
- FIG. 9 illustrates in grayscale a color picture of print on paper obtained by this further-simplified approach using a reference mirror with low reflectivity (silicone carbide, with reflectivity no greater than 50% of the reflectivity of the sample surface) and using off-focus interference data from the same scan that produced the image of FIG. 3 .
- a reference mirror with low reflectivity silicone carbide, with reflectivity no greater than 50% of the reflectivity of the sample surface
Abstract
Description
and then subtracting the irradiance Iref RGB returned by the reference mirror. These steps are performed for every pixel and each of the three recorded wavelengths (R, G, B). Once a color map is so generated, the color for each pixel at its best focus is combined with the height map calculated in conventional manner from the interference data to obtain a full-color 3-D image of the sample.
can be accomplished in different ways. From
intervals, which is probably the most common technique used in scanning interferometry. As those skilled in the art will readily recognize, the number of points used for filter construction can be selected arbitrarily large, in accordance with the desired performance and data characteristics. The five-point filter of Equation 2 was found to be sufficiently precise for the purposes of the invention.
I DC RGB(z)=I obj RGB +I ref RGB, (2)
where the subscript DC refers to the unmodulated signal. The next step requires removal of the beam intensity returned by the reference mirror, Iref RGB. In the most simplistic implementation, the determination of the signal returned by the reference mirror Iref RGB can be measured a priori and stored. For example, if the data are collected from a black (non-reflective) object, the irradiance measured by the camera is close to the actual intensity of the signal returned just by the reference mirror. However, while this approach might be sufficiently precise and therefore appropriate for some applications, it is not preferred. The preferred approach is based on the explicit determination of the value of Iref RGB by combining Equation 2 with an expression for the modulating envelope of fringes, MRGB(k), from Equation 1. Explicitly, at each data acquisition frame “k” recorded by the color camera and for each color, the following set of equations is solved for each pixel:
be equal to one is also imposed based on the aforementioned analysis. The envelope modulation MRGB(k) can be computed by many standard procedures. For example, using the algorithm developed by Larkin (K. G. Larkin “Efficient nonlinear algorithm for envelope detection in white light interferometry”, J. Opt. Soc. Am. A/Vol. 13, No. 4/April 1996), the value of the modulation can be expressed in terms of five consecutive points, as follows:
M(k)˜[(I k+1 −I k−1)2−(I k+2 −I k)(I k −I k−2)]1/2 (4)
where k is data acquisition frame. Once the value of MRGB(k) has been determined for each frame k, the expression for gRGB(k) becomes
which enables the solution of the system of Equations 3 for Iref RGB and Iobj RGB With this selection it is easy to see that at the frame k0 (i.e, k=0), for which the maximum envelope is obtained, the interference term satisfies the standard two-wave interference equation:
M RGB(k0)=2√{square root over (I obj RGB I ref RGB)} (6)
where Iside RGB(z) is the contribution received from the object as a result of the additional illumination. Such side illumination has been found to contribute advantageously to color detection based on the DC component interferometric irradiance when low-reflectivity samples are involved. Therefore, the practice is preferred in such cases.
Claims (26)
Priority Applications (2)
| Application Number | Priority Date | Filing Date | Title |
|---|---|---|---|
| US14/293,662 US9282304B1 (en) | 2014-06-02 | 2014-06-02 | Full-color images produced by white-light interferometry |
| US14/733,092 US9746315B1 (en) | 2014-06-02 | 2015-06-08 | Side illumination in interferometry |
Applications Claiming Priority (1)
| Application Number | Priority Date | Filing Date | Title |
|---|---|---|---|
| US14/293,662 US9282304B1 (en) | 2014-06-02 | 2014-06-02 | Full-color images produced by white-light interferometry |
Related Parent Applications (1)
| Application Number | Title | Priority Date | Filing Date |
|---|---|---|---|
| US201414294038A Continuation-In-Part | 2014-06-02 | 2014-06-02 |
Related Child Applications (1)
| Application Number | Title | Priority Date | Filing Date |
|---|---|---|---|
| US14/733,092 Continuation-In-Part US9746315B1 (en) | 2014-06-02 | 2015-06-08 | Side illumination in interferometry |
Publications (1)
| Publication Number | Publication Date |
|---|---|
| US9282304B1 true US9282304B1 (en) | 2016-03-08 |
Family
ID=55410582
Family Applications (1)
| Application Number | Title | Priority Date | Filing Date |
|---|---|---|---|
| US14/293,662 Expired - Fee Related US9282304B1 (en) | 2014-06-02 | 2014-06-02 | Full-color images produced by white-light interferometry |
Country Status (1)
| Country | Link |
|---|---|
| US (1) | US9282304B1 (en) |
Cited By (2)
| Publication number | Priority date | Publication date | Assignee | Title |
|---|---|---|---|---|
| US20220206293A1 (en) * | 2019-04-19 | 2022-06-30 | ARlZONA BOARD OF REGENTS ON BEHALF OF THE UNIVERSITY OF ARIZONA | On-chip signal processing method and pixel-array signal |
| US11910104B2 (en) | 2019-04-19 | 2024-02-20 | ARIZONA BOARD OF REGENTS on behalf of THE UNIVERSITY OF ARIZONA, A BODY CORPORATE | All-in-focus imager and associated method |
Citations (9)
| Publication number | Priority date | Publication date | Assignee | Title |
|---|---|---|---|---|
| US5398113A (en) * | 1993-02-08 | 1995-03-14 | Zygo Corporation | Method and apparatus for surface topography measurement by spatial-frequency analysis of interferograms |
| US5614961A (en) * | 1993-02-03 | 1997-03-25 | Nitor | Methods and apparatus for image projection |
| US7095503B2 (en) | 2004-02-20 | 2006-08-22 | University Of South Florida | Method of full-color optical coherence tomography |
| US7317540B1 (en) | 2004-02-20 | 2008-01-08 | University Of South Florida | Method of full-color optical coherence tomography |
| US8004688B2 (en) | 2008-11-26 | 2011-08-23 | Zygo Corporation | Scan error correction in low coherence scanning interferometry |
| US8300233B2 (en) | 2010-03-30 | 2012-10-30 | Zygo Corporation | Interferometric encoder systems |
| US20140043474A1 (en) * | 2012-08-07 | 2014-02-13 | Carl Zeiss Industrielle Messtechnik Gmbh | Measuring device for measuring a measurement object and related method |
| US20140226150A1 (en) * | 2013-02-12 | 2014-08-14 | Zygo Corporation | Surface topography interferometer with surface color |
| US20150054937A1 (en) * | 2012-05-16 | 2015-02-26 | Carl Zeiss Microscopy Gmbh | Light microscope and method for image recording using a light microscope |
-
2014
- 2014-06-02 US US14/293,662 patent/US9282304B1/en not_active Expired - Fee Related
Patent Citations (11)
| Publication number | Priority date | Publication date | Assignee | Title |
|---|---|---|---|---|
| US5614961A (en) * | 1993-02-03 | 1997-03-25 | Nitor | Methods and apparatus for image projection |
| US5398113A (en) * | 1993-02-08 | 1995-03-14 | Zygo Corporation | Method and apparatus for surface topography measurement by spatial-frequency analysis of interferograms |
| US7095503B2 (en) | 2004-02-20 | 2006-08-22 | University Of South Florida | Method of full-color optical coherence tomography |
| US7317540B1 (en) | 2004-02-20 | 2008-01-08 | University Of South Florida | Method of full-color optical coherence tomography |
| US8004688B2 (en) | 2008-11-26 | 2011-08-23 | Zygo Corporation | Scan error correction in low coherence scanning interferometry |
| US8379218B2 (en) | 2008-11-26 | 2013-02-19 | Zygo Corporation | Fiber-based interferometer system for monitoring an imaging interferometer |
| US20130155413A1 (en) | 2008-11-26 | 2013-06-20 | Zygo Corporation | Low coherence interferometry with scan error correction |
| US8300233B2 (en) | 2010-03-30 | 2012-10-30 | Zygo Corporation | Interferometric encoder systems |
| US20150054937A1 (en) * | 2012-05-16 | 2015-02-26 | Carl Zeiss Microscopy Gmbh | Light microscope and method for image recording using a light microscope |
| US20140043474A1 (en) * | 2012-08-07 | 2014-02-13 | Carl Zeiss Industrielle Messtechnik Gmbh | Measuring device for measuring a measurement object and related method |
| US20140226150A1 (en) * | 2013-02-12 | 2014-08-14 | Zygo Corporation | Surface topography interferometer with surface color |
Cited By (3)
| Publication number | Priority date | Publication date | Assignee | Title |
|---|---|---|---|---|
| US20220206293A1 (en) * | 2019-04-19 | 2022-06-30 | ARlZONA BOARD OF REGENTS ON BEHALF OF THE UNIVERSITY OF ARIZONA | On-chip signal processing method and pixel-array signal |
| US11910104B2 (en) | 2019-04-19 | 2024-02-20 | ARIZONA BOARD OF REGENTS on behalf of THE UNIVERSITY OF ARIZONA, A BODY CORPORATE | All-in-focus imager and associated method |
| US11921285B2 (en) * | 2019-04-19 | 2024-03-05 | Arizona Board Of Regents On Behalf Of The University Of Arizona | On-chip signal processing method and pixel-array signal |
Similar Documents
| Publication | Publication Date | Title |
|---|---|---|
| US9541381B2 (en) | Surface topography interferometer with surface color | |
| US8649024B2 (en) | Non-contact surface characterization using modulated illumination | |
| KR100984809B1 (en) | Phase gap analysis for scanning interferometry | |
| JP2679876B2 (en) | Method and apparatus for measuring surface topography by spatial frequency analysis of interferograms | |
| JP7174060B2 (en) | Measurement of multi-layer stacks | |
| US8565499B2 (en) | Methods, systems, and computer readable media for synthetic wavelength-based phase unwrapping in optical coherence tomography and spectral domain phase microscopy | |
| EP3434173B1 (en) | System and method for performing tear film structure measurement | |
| JP4538661B2 (en) | Method for improving depth discrimination in optical imaging systems | |
| JP6284705B2 (en) | Method and apparatus for measuring film thickness by fitting interference color model | |
| EP2791618A2 (en) | Non-contact surface characterization using modulated illumination | |
| CN107710046B (en) | Method for determining spatially resolved height information of a sample using a wide-field microscope and wide-field microscope | |
| US9282304B1 (en) | Full-color images produced by white-light interferometry | |
| Huntley et al. | Hyperspectral interferometry for single-shot absolute measurement of two-dimensional optical path distributions | |
| Pawłowski et al. | Phase-crossing algorithm for white-light fringes analysis | |
| Solaguren-Beascoa Fernández | Data acquisition techniques in photoelasticity | |
| JP2015230264A (en) | Film thickness measurement method and film thickness measurement device | |
| US9746315B1 (en) | Side illumination in interferometry | |
| Viskovatykh et al. | Combined optical-coherence and spectral microscopy based on tunable acousto-optic filters of images | |
| WO2004020937A1 (en) | Phase measuring method and apparatus for multi-frequency interferometry | |
| Attendu et al. | Coregistered optical coherence tomography and frequency-encoded multispectral imaging for spectrally sparse color imaging | |
| Klein | Multispectral imaging and image processing | |
| Kim et al. | Generating a true color image with data from scanning white-light interferometry by using a Fourier transform | |
| JP2007071817A (en) | Two-light flux interferometer and method for measuring shape of object to be measured using interferometer | |
| US20210333396A1 (en) | 3d sensing depth camera | |
| Artigas | Imaging confocal microscopy |
Legal Events
| Date | Code | Title | Description |
|---|---|---|---|
| AS | Assignment |
Owner name: BRUKER NANO INC., CALIFORNIA Free format text: ASSIGNMENT OF ASSIGNORS INTEREST;ASSIGNORS:SCHMIT, JOANNA;MUNTEANU, FLORIN;REEL/FRAME:033010/0273 Effective date: 20140602 |
|
| STCF | Information on status: patent grant |
Free format text: PATENTED CASE |
|
| FEPP | Fee payment procedure |
Free format text: SURCHARGE FOR LATE PAYMENT, LARGE ENTITY (ORIGINAL EVENT CODE: M1554); ENTITY STATUS OF PATENT OWNER: LARGE ENTITY |
|
| MAFP | Maintenance fee payment |
Free format text: PAYMENT OF MAINTENANCE FEE, 4TH YEAR, LARGE ENTITY (ORIGINAL EVENT CODE: M1551); ENTITY STATUS OF PATENT OWNER: LARGE ENTITY Year of fee payment: 4 |
|
| FEPP | Fee payment procedure |
Free format text: MAINTENANCE FEE REMINDER MAILED (ORIGINAL EVENT CODE: REM.); ENTITY STATUS OF PATENT OWNER: LARGE ENTITY |