US9005126B2 - Ultrasonic tissue displacement/strain imaging of brain function - Google Patents
Ultrasonic tissue displacement/strain imaging of brain function Download PDFInfo
- Publication number
- US9005126B2 US9005126B2 US12/114,703 US11470308A US9005126B2 US 9005126 B2 US9005126 B2 US 9005126B2 US 11470308 A US11470308 A US 11470308A US 9005126 B2 US9005126 B2 US 9005126B2
- Authority
- US
- United States
- Prior art keywords
- data
- stimulated
- relaxed
- brain
- subject
- Prior art date
- Legal status (The legal status is an assumption and is not a legal conclusion. Google has not performed a legal analysis and makes no representation as to the accuracy of the status listed.)
- Expired - Fee Related, expires
Links
Images


Classifications
-
- A—HUMAN NECESSITIES
- A61—MEDICAL OR VETERINARY SCIENCE; HYGIENE
- A61B—DIAGNOSIS; SURGERY; IDENTIFICATION
- A61B8/00—Diagnosis using ultrasonic, sonic or infrasonic waves
- A61B8/08—Detecting organic movements or changes, e.g. tumours, cysts, swellings
- A61B8/0808—Detecting organic movements or changes, e.g. tumours, cysts, swellings for diagnosis of the brain
- A61B8/0816—Detecting organic movements or changes, e.g. tumours, cysts, swellings for diagnosis of the brain using echo-encephalography
-
- A61B5/0402—
-
- A—HUMAN NECESSITIES
- A61—MEDICAL OR VETERINARY SCIENCE; HYGIENE
- A61B—DIAGNOSIS; SURGERY; IDENTIFICATION
- A61B5/00—Measuring for diagnostic purposes; Identification of persons
- A61B5/24—Detecting, measuring or recording bioelectric or biomagnetic signals of the body or parts thereof
- A61B5/316—Modalities, i.e. specific diagnostic methods
- A61B5/318—Heart-related electrical modalities, e.g. electrocardiography [ECG]
Definitions
- EEG electroencephalography
- MEG magenetoencephalography
- Other techniques such as functional near-infrared spectroscopy (fNIRS), functional magnetic resonance imaging (fMRI), positron emission tomography (PET), single photon emission computed tomography (SPECT), and functional transcranial Doppler sonography (fTCD) measure changes in blood flow or blood gas concentration as surrogates for detecting changes in neuronal activation.
- fNIRS functional near-infrared spectroscopy
- fMRI functional magnetic resonance imaging
- PET positron emission tomography
- SPECT single photon emission computed tomography
- fTCD functional transcranial Doppler sonography
- TCD transcranial Doppler sonography
- fTCD Functional TCD
- PCA posterior cerebral artery
- MCA middle cerebral artery
- TCD is a rapid, portable, inexpensive, continuous monitoring technique that can be applied to subjects and in settings unsuitable for study by other neuroimaging techniques.
- Functional TCD is limited, however, in its ability to localize regions of activity; TCD can only be used to measure flow through larger segments of the cerebral vasculature that supply blood to large regions of the brain spanning multiple functional areas because the signal backscattered by blood is significantly less than that backscattered by tissue.
- the skull significantly attenuates ultrasound; researchers have reported the attenuation of the skull to be 13 dB/cm/MHz.
- TCD is generally limited to application through the three “acoustic windows,” including the temporal bone window, the orbital window, and the foramen magnum window. Use of only these three windows for this purpose limits the regional access available with fTCD. Furthermore, 5-8% of the population do not have any adequate acoustic window for applying TCD.
- Tissue Pulsatility Imaging infers function from ultrasonically measured displacement and/or strain of brain tissue due to the natural, local, pulsatile change in blood volume over the cardiac and respiratory cycles.
- This technique differs from previous functional ultrasonic imaging methods by: (1) measuring tissue motion as a surrogate for blood, flow rather than measuring blood flow itself, and, (2) enabling ultrasound images to be obtained directly through the skull from almost any location, rather than just through an anatomical window (such as the temporal bone window), which is possible because tissue backscatters significantly more ultrasound than blood.
- TPI combines/offers the imaging capability of larger and more expensive systems, such as Magnetic Resonance Imaging (MRI) and PET systems, while maintaining the ease of use and portability that are characteristics of fEEG and near infrared spectroscopy (NIRS).
- MRI Magnetic Resonance Imaging
- NIRS near infrared spectroscopy
- TPI tissue motion and/or tissue strain (the derivative of motion with depth) rather than blood velocity
- tissue motion and/or tissue strain the derivative of motion with depth
- blood velocity the limitation of low backscatter from blood that limits ultrasound access to the brain via the skull's acoustic windows.
- This technique has been empirically validated by measuring the hemodynamic response associated with visual stimulation of the occipital cortex using a contrast-reversing checkerboard paradigm.
- TPI is based on characterizing blood flow and perfusion by measuring the natural tissue expansion and relaxation over the cardiac and respiratory cycles.
- blood enters tissue through the arterial vasculature faster than it leaves through the venous vasculature, causing blood to accumulate and the tissue to expand or swell by a fraction of a percent.
- venous drainage dominates, allowing the tissue to return to its pre-systolic volume. The rate of venous drainage is modulated by the respiratory cycle, if the tissue is not elevated above the chest, which results in a periodic expansion of nearly one percent synchronized with respiration, in addition to the cardiac pulsatile expansion.
- TPI is somewhat related to a much older, established technique referred to as plethysmography, which has been a popular noninvasive diagnostic method for the assessment of arterial and venous disease since the 1960's.
- Plethysmography works by measuring whole limb expansion due to vascular perfusion in association with the cardiac cycle (arterial) or the respiratory cycle (venous).
- ultrasound is used to measure tissue displacement or strain to provide the plethysmographic like signal from hundreds or thousands of small volumes of tissue within an ultrasound image plane in only a portion of a limb or body part, rather than the gross plethysmographic signal from an entire limb or body part, as is done with traditional plethysmography.
- TPI enables displacement/strain levels from many different parts of the brain to be compared with each other, in order to determine which portions of the brain exhibit increased displacement/strain in response to visual or other stimuli.
- TPI maps brain function by measuring changes in tissue pulsatility due to changes in blood flow with neuronal activation.
- TPI uses tissue Doppler signal processing methods to measure a pulsatile “plethysmographic” signal from hundreds or thousands of sample volumes in an ultrasound image plane.
- a feasibility study conducted to determine if TPI could be used to detect regional brain activation during a visual contrast-reversing checkerboard block paradigm stimulus showed that in 7 out of 14 tests, consistent regions of activation were detected from tissue around the major vessels perfusing the visual cortex.
- ultrasound data were collected transcranially from the occipital lobe as a subject viewed alternating blocks of a reversing checkerboard (stimulus condition) and a static, gray screen (control condition).
- MANOVA Multivariate Analysis of Variance
- TPI to monitor cerebral vasoreactivity
- reduced cerebral vasoreactivity is associated with many medical conditions, and a procedure for monitoring cerebral vasoreactivity is thus a useful diagnostic tool.
- FIG. 1A graphically illustrates a conventional (Prior Art) gross plethysmographic signal
- FIG. 1B is a flowchart illustrating the basic steps employed in TPI
- FIGS. 2A and 2B illustrate exemplary positioning of the ultrasound probe during brain function mapping studies using TPI
- FIG. 2C is an exemplary B-mode image acquired using probe positioning as indicated in FIGS. 2A and 2B ;
- FIG. 3A is a functional diagram of an empirical data acquisition system for brain function mapping studies using TPI
- FIG. 3B is a functional diagram of a simplified exemplary data acquisition system for brain function mapping studies using TPI;
- FIG. 4 schematically illustrates an exemplary synchronization technique implemented by the system of FIG. 3 , to synchronize the application of visual stimulation and data acquisition;
- FIG. 5 is an exemplary flowchart illustrating the basic steps employed in using TPI to map brain function
- FIG. 6A represent an exemplary 8 second displacement waveform during a control block for a sample volume near the brain stem after filtering to substantially reduce the effect of respiratory motion
- FIG. 6B graphically represents a modified 31-sample Hann window
- FIG. 6C graphically represent one cardiac cycle (as indicated by the solid line) from FIG. 6A and the waveform after tapering (as indicated by the dotted line);
- FIG. 7A graphically illustrates displacement waveforms for two control blocks and two checkerboard blocks for one sample volume
- FIG. 7B graphically illustrates mean waveforms from all the cardiac cycles for the control blocks and all of the checkerboard blocks for the sample volume
- FIG. 8 is a composite image including B-mode images (left column) and functional TPI data (right column) collected from a male test subject, showing consistency among the results from four different TPI studies of the male subject;
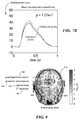
- FIG. 9 schematically illustrates exemplary p-values for one of the sessions superimposed on an MRI image slice approximately corresponding to the ultrasound image plane employed to collect the TPI data;
- FIG. 10A is a functional diagram of an empirical data acquisition system for monitoring cerebral vasoreactivity using TPI
- FIG. 10B is a functional diagram of a simplified exemplary data acquisition system for monitoring cerebral vasoreactivity using TPI;
- FIG. 11 is an exemplary flowchart illustrating the basic steps employed in using TPI to monitor cerebral vasoreactivity
- FIG. 12A graphically illustrates a displacement waveform from one dataset from a single sample volume from subject 4 , before band-pass filtering;
- FIG. 12B graphically illustrates the displacement waveform of FIG. 12A after the band-pass filtering
- FIG. 12C graphically illustrates a mean displacement waveform calculated by averaging cardiac cycles from the waveform of FIG. 12B ;
- FIG. 13A graphically illustrates end-tidal CO 2 from subject 3 , along with pulse amplitude measurements from a single sample volume;
- FIG. 13B graphically illustrates pulse amplitude versus end-tidal CO 2 from the same sample volume along with the best-fit line with first-order linear regression;
- FIG. 14A is a transverse B-mode image of the brain and skull of subject 2 ;
- FIG. 14B is a pulse amplitude image of the brain of subject 2 at rest (i.e., before hyperventilation) with an end-tidal CO 2 of 41.7 mm of Hg;
- FIG. 14C is a pulse amplitude image of the brain of subject 2 during hyperventilation with an end-tidal CO 2 of 20.7 mm of Hg;
- FIG. 15 includes B-mode images from all of the subjects along with the predicted percent change in pulse amplitude for a change in end-tidal CO 2 from 40 mm Hg to 20 mm Hg, for samples volumes with linear regression p-values less than 0.01;
- FIG. 16A graphically illustrates histograms of percent changes from the four subjects for sample volumes with linear regression p-values less that 0.01;
- FIG. 16B graphically illustrates the median, 25 th and 75 th percentiles for percent changes for p-values less than 0.01 arranged by subject age.
- Tissue Pulsatility Imaging is an extension of tissue Doppler imaging methods for measuring and characterizing the natural, pulsatile expansion and relaxation of tissue over the cardiac cycle as an indirect measurement of perfusion.
- Functional Tissue Pulsatility Imaging is an application of TPI for mapping brain function based on the change in tissue pulsatility with regional activation.
- TPI is a novel extension of plethysmography, which has been used for nearly 100 years to measure the gross change in tissue volume in the arms, legs, fingers, toes and other isolatable whole body parts. Tissue volume changes cyclically with the cardiac cycle as blood accumulates in and drains from the arterial vasculature.
- FIG. 1A graphically illustrates a conventional (Prior Art) gross plethysmographic signal. Whereas conventional plethysmography is a single gross plethysmographic measurement of tissue volume change, TPI uses pulsed Doppler ultrasound to measure local “plethysmographic” signals from 100s or 1000s of sample volumes throughout the ultrasound image plane.
- TPI can measure the motion of brain tissue with a resolution of approximately one micron.
- ultrasound can be used to indirectly measure changes in blood flow in the brain from locations other than through the traditional acoustic windows in the skull.
- TPI can be used to monitor cerebral vasoreactivity, which is a commonly employed diagnostic indicator.
- TPI is based on distinguishing motion of brain tissue that is different from the motion due to the cardiac cycle and the respiratory cycle.
- FIG. 1B is a flowchart 120 illustrating the basic steps employed in TPI, to overcome the limitation of low backscatter from blood that limits ultrasound access to the brain via the skull's acoustic windows.
- TPI measures tissue displacement (or tissue strain) in the brain, and this displacement data (or strain data) can be used to map brain function and to monitor cerebral vasoreactivity.
- cardiac cycles are identified.
- An exemplary technique for tracking cardiac cycles is to use electrocardiogram (ECG) data.
- ECG electrocardiogram
- TPI measures this expansion (or the displacement of the tissue) as a surrogate for measuring blood flow.
- ECG electrocardiogram
- the ECG data are used to isolate and process the displacement/strain signals over multiple cardiac cycles. Strictly speaking, the ECG data are not essential, in the present novel approach, because the beginning of each cardiac cycle can be identified using other techniques, such as from a blood pressure waveform measured elsewhere in the body (e.g., an arm) or derived from some other source, but ECG data are relatively easy to acquire, as described above, and this approach is quite accurate.
- ultrasound data are collected to measure tissue displacement in the brain when the subject is quiescent (i.e., the subject has not been exposed to physical or mental stimulation).
- the specific portion of the brain being imaged will be a function of the desired goal (i.e., brain function mapping or monitoring cerebral vasoreactivity).
- ultrasound data are collected to measure tissue displacement in the brain when the subject has been stimulated (mental stimulation for brain function mapping, and hyperventilation for monitoring cerebral vasoreactivity). It should be recognized that many different types of transducers can be used to provide the ultrasound data. While 2-D ultrasound represents an exemplary type of ultrasound, it should be recognized that the concepts disclosed herein are not limited to the use of 2D ultrasound data.
- a block 128 the raw ultrasound data for both data sets (i.e., while the patient is stimulated and at rest or quiescent) are processed to correlate signal elements.
- the correlation process is a function of the type of transducer used to collect the ultrasound data. Common correlation techniques include cross correlation and autocorrelation.
- the initial signal processing i.e., processing of the data in block 128
- includes a transform operation as discussed in greater detail below.
- the correlated ultrasound data are filtered.
- the specific type of filtering will be a function of the type of TPI analysis (i.e., brain function mapping, or monitoring cerebral vasoreactivity) that is being performed.
- Beneficial filtering techniques include, but are not limited to, filtering to remove (or at least substantially reduce) displacement data corresponding to respiratory motion, and possibly filtering to remove (or at least substantially reduce) displacement data corresponding to cardiac motion.
- the empirical studies discussed below employed a high pass filter to separate cardiac signal elements from respiratory signal elements, to focus the analysis on the cardiac signal portion.
- a low pass filter could be employed to focus the analysis on the respiratory signal portion.
- the ECG data (or other types of data) can be used to detect abnormal heart beats, so that they can be excluded from the analysis.
- the filtering techniques noted above are intended to be exemplary, rather than limiting, and other types of filtering to remove motion arising from various specific undesired sources can be implemented.
- a particularly significant data enhancement is re-sampling, in which the ultrasound displacement data are re-ordered such that the first ultrasound pulse in a data sample coincides with the beginning of the cardiac cycle, as determined in block 122 . This step eliminates the need for the ultrasound data acquisition to be synchronized with the cardiac cycle. If desired, the cardiac cycle data collected in block 122 can be used to control ultrasound acquisition, such that re-sampling is not required. As discussed in greater detail below, additional enhancements include waveform segmentation and waveform tapering.
- the processed ultrasound data for brain tissue displacements when the patient is at rest and when stimulated are compared to identify tissue displacements associated with stimulation. Exemplary (but not limiting) processing steps are described in greater detail below with respect to empirical studies conducted to study the use of TPI for brain function mapping and monitoring cerebral vasoreactivity.
- the ultrasound data are used to either map brain function, or to monitor cerebral vasoreactivity.
- the initial data acquisition steps can be considered to correspond to measuring small changes in displacement, while the latter analysis steps can be considered to correspond to measuring small differences in displacement.
- tissue strain the derivative of motion with depth
- TPI Map Brain Function
- Subjects Two subjects participated in the empirical study, a 34 year-old, right-handed male and a 39 year-old, left-handed female. Both subjects had normal, uncorrected vision. A total of seven sessions were conducted on each subject over a four week period. For each session, the two subjects were studied on the same day, approximately 30 minutes apart. No effort was made to control the day of the week, the time of day, or caffeine intake at which the sessions occurred. Written informed consent was obtained from both subjects. The research protocol was approved by the Human Subjects Committee of the University of Washington. Full three-dimensional (3-D) anatomical and angiographic MRI data were collected for the male subject as part of another approved study and were used to identify the location of the occipital lobe and other structures in the brain of this subject.
- Protocol During a session, the subject lay prone on a massage table with his/her head securely and comfortably positioned within the table's face donut. ECG leads were attached to the subject's arms, and ultrasound gel was applied to the back of the subject's head.
- a Terason 4V2TM phased-array transducer (Teratech Corp., Burlington, Mass.) held by an articulated clamp (Manfrotto, Bassano del Grappa, Italy) securely mounted to a laboratory bench was positioned at the back of the head of the subject, over the visual cortex and approximately 2 cm superior to the occipital protuberance and 0 to 2 cm lateral from the midline.
- the transducer Before locking the clamp in position, the transducer was oriented by an experienced sonographer to image a nearly transverse plane passing through the pineal body, which is hyperechoic in most individuals due to calcification.
- the visual stimuli were displayed on a computer monitor (a Dell Corporation, model Latitude D610TM) approximately 75 cm directly below the subject's face. Prior to the start of the study, the lights were dimmed and a visual shield was placed around the front of the table to minimize visual distractions.
- FIGS. 2A and 2B illustrate exemplary positioning of an ultrasound probe 140 during brain function mapping studies
- FIG. 2C is an exemplary B-mode image 152 acquired using such positioning.
- FIGS. 2A and 2B are based on actual MRI images.
- the following structures are identified in one or more of FIGS. 2A and 2B : a pineal body 142 , a posterior commissure 144 , a quadrigeminal cistern 148 , and a 3 rd ventricle 146 .
- a black sector 150 in FIG. 2B generally corresponds to the location and extent of exemplary B-mode image 152 ( FIG. 2C ). It must be recognized that the empirical study was limited to tracking visual brain stimulation.
- the ultrasound probes are positioned to image the visual cortex. If other types of mental stimulation (such as motion, sound, taste, smell, or touch) were being provided, then the probe would be positioned accordingly.
- a commercial system will likely include a plurality of ultrasound probes distributed at different locations around the skull, to enable displacement/strain data to be collected from many different parts of the brain at the same time. The limiting factor in the number of ultrasound probes used is likely to be cost (i.e., from a data collection standpoint, it is likely better to have more probes than fewer probes).
- the plurality of probes are incorporated into a helmet or skull cap worn by the subject.
- a contrast-reversing checkerboard block paradigm was used to stimulate the visual cortex of the subject. This type of visual stimulus is a robust test that reliably produces a response independent of cognitive or learning processes.
- Each study consisted of 31 alternating control and checkerboard blocks beginning and ending with a control block.
- a checkerboard block an 8 square ⁇ 8 square black-and-white checkerboard was displayed for 30 seconds, with the squares alternating from black-to-white or white-to-black every 500 milliseconds. Each square measured 2 cm ⁇ 2 cm creating a 16 cm ⁇ 16 cm checkerboard.
- a static gray screen was displayed for 30 seconds.
- An empirically implemented data acquisition system 154 is schematically illustrated in FIG. 3A , and included a Terason 2000TM ultrasound scanner (available from Teratech Corp., Burlington, Mass., including a processing module/laptop computer 156 and an ultrasound probe 158 ), a personal computer 160 for displaying the visual stimuli, a personal computer 168 for digitizing the subject's ECG signal, an ECG monitor 162 (a model VSM2TM, available from Physio-Control, Redmond, Wash.), and an arbitrary waveform generator 170 (a model 33120ATM, available from Agilent Technologies, Palo Alto, Calif.) controlled by the visual stimulation computer (i.e., computer 160 ) for triggering the ultrasound scanner and ECG digitizer.
- a Terason 2000TM ultrasound scanner available from Teratech Corp., Burlington, Mass., including a processing module/laptop computer 156 and an ultrasound probe 158
- a personal computer 160 for displaying the visual stimuli
- a personal computer 168 for digitizing the subject'
- Leads 164 coupled ECG sensors (not specifically shown) attached to a subject to EGC monitor 162 .
- a data conductor 166 (such as a parallel, serial, or universal serial bus cable, although such data conductors are exemplary, rather than limiting) coupled the output of the ECG monitor (a transistor-transistor logic (TTL) signal coincident with the subject's ECG R-wave) to personal computer 168 .
- a data conductor 172 (such as a parallel, serial, or universal serial bus cable, although such data conductors are exemplary, rather than limiting) coupled personal computer 160 to arbitrary waveform generator 170 .
- the Terason 2000TM a laptop-based, general-purpose ultrasound scanner, with a 4V2 phased array scanhead (90° sector angle, 64 element, 2.5 MHz center frequency, 10 MHz RF sampling frequency, 128 scanlines per frame, and an approximately 55% fractional bandwidth B-mode pulse) was used for ultrasound acquisition.
- a series of post-beamformed ultrasound radio frequency (RF) frames were collected during B-mode imaging for offline analysis in MATLABTM (available from The Mathworks, Inc., Natick, Mass.). A total of 240 frames of RF ultrasound were recorded at 30 frames per second from 10 seconds to 18 seconds within each block.
- RF radio frequency
- the Terason ultrasound scanner is able to record up to 300 frames of RF ultrasound, in these studies only 240 frames were recorded, to allow sufficient time to write the data to the ultrasound scanner's hard drive. Data collection was started 10 seconds into each block to allow sufficient time for the blood flow to change in response to the neuronal stimulation, based on earlier studies indicating that an 8-10 second lag time was desirable.
- an automation application AutoHotkeyTM was used to trigger the ultrasound scanner and save data at appropriate times, without requiring user intervention once the session was started.
- a MATLABTM script running on the Dell Corp. Latitude D610TM laptop computer i.e., computer 160 was used to display the visual stimuli and synchronize data acquisition by the other two computers (i.e., laptop computer 156 and computer 168 ), as is schematically illustrated in FIG. 4 .
- the MATLABTM script instructed the arbitrary waveform generator to output a 100 millisecond TTL pulse that triggered the Terason (using the Terason's ECG triggering feature), and the ECG digitizer computer.
- the subject's ECG R-wave signal was digitized using a Measurement Computing (Middleboro, Mass.) PCI-DAS 1000TM 12-bit digitizer sampling at 1 kHz. Eight seconds after each trigger, the two computers recorded their data to hard drives and rearmed before the next trigger.
- controllers could be employed (such as custom processing circuits); personal computers simply represent a readily available type of controller, and are thus exemplary, rather than limiting.
- the cardiac cycle could be identified using a technique other than collecting ECG data (for example, blood pressure data might be used instead).
- the ultrasound acquisition was not synchronized to the cardiac cycle. Resampling, which is described below, was performed offline after the ultrasound data were collected to correlate the ultrasound data with the cardiac cycle. The resampling function could be eliminated if ultrasound acquisition was synchronized to the cardiac cycle. This approach would also require synchronizing the stimulus with the cardiac cycle. While such an embodiment is certainly encompassed by the disclosure herein, resampling represents a simpler solution, when compared to synchronization. Thus, the ECG monitor (and corresponding computer) are not strictly required, as other techniques do exist for obtaining the desired cardiac signal.
- FIG. 3B schematically illustrates a more streamlined system 174 , which includes an ultrasound data collection component 176 configured to collect the required ultrasound data, a stimulus component 178 configured to provide the stimulus, a cardiac cycle collection component 180 configured to obtain cardiac cycle data (using ECG or some other technique, as noted above), and at least one controller 182 implementing the steps described herein for using TPI to map brain function. While ultrasound data collection component 176 and cardiac cycle collection component 180 are shown as different components, it should be recognized that in some embodiments ultrasound could be used to estimate the cardiac cycles, such that ultrasound data collection component 176 and cardiac cycle collection component 180 are the same component (or that two different ultrasound components are employed, one to collect TPI data and the other to collect cardiac data).
- FIG. 5 corresponds to the method steps of the flowchart of FIG. 1B optimized for using TPI to map brain function. It should be recognized that the specific method steps of FIG. 5 are exemplary, rather than limiting. Thus, different processing steps (such as different transforms, different types of correlation, different types of filtering, and different steps to identify motion associated with mental stimulation) can alternatively be employed within the scope of this novel approach.
- ECG data is collected to identify the cardiac cycle of the subject (although it should be noted that cardiac cycle data can be collected using techniques other than ECG, as discussed herein).
- post beam formed ultrasound data from brain tissue is collected.
- a Hilbert transform is performed on the ultrasound data. It should be noted that the step of block 190 is intended to represent converting RF data from real signals to analytic signals. The use of the Hilbert transform in particular is intended to be exemplary, rather than limiting.
- the ultrasound data undergoes a 2D autocorrelation process.
- correlation techniques are a function of the type of transducer employed to collect the ultrasound data.
- the specific correlation technique identified in FIG. 5 was selected based on the transducer employed in the empirical studies and is thus intended to be exemplary, rather than limiting.
- the correlation step defined the sample volume dimensions as 10 samples of 0.8 mm with a 50% overlap, and 2 scan lines (1.4 degrees) with 0% overlap. Again, such parameters are exemplary, rather than limiting.
- the correlated ultrasound data is filtered to separate out a cardiac portion of the signal from a respiratory portion of the signal.
- the respiratory portion is likely to include desired data, but is inherently noisier than the cardiac portion of the signal, thus less signal processing was required to extract useful data from the cardiac portion.
- the respiratory portion of the signal primarily corresponds to venous pulsations, while the cardiac portion primarily corresponds to arterial pulsations.
- the concepts disclosed herein extend to the use of the respiratory signal portion as well as the cardiac portion of the signal. Given sufficient signal processing techniques to extract noise from the respiratory signal, the respiratory signal alone may be useful.
- various signal enhancements are implemented, including waveform segmentation, waveform resampling, and waveform tapering.
- the purpose of such techniques is to obtain a consistent signal (i.e., to minimize variations between individual signals).
- Such steps are particularly useful in dealing with variations induced by irregularities in the cardiac cycles (i.e., cardiac cycles are similar but not always identical).
- Exemplary, but not limiting implementation include segmenting the data into cardiac cycles, re-sampling such that the beginning of each cardiac cycle coincides with its ECG QRS component, and tapering each cardiac cycle to 1 second using a modified, asymmetric Hann window. It should be recognized that other signal processing techniques can be implemented to similarly enhance the data. Furthermore, resampling is not required if the ultrasound data acquisition is synchronized to the cardiac cycle.
- PCA Principal Components Analysis
- the purpose of which is to analyze the data to identify features that can be used to differentiate the waveforms for the relaxed data from the waveforms for the stimulated data.
- PCA thus represents an exemplary, but not limiting technique that can be used to parameterize the waveforms (such a step is generally referred to as “parameter extraction”).
- PCA involves looking at a plurality of signal components, and it should be recognized that parameter extraction may be limited to only one signal component, as opposed to a plurality of signal components.
- the waveform for each cardiac cycle can be treated as variable with 31 dimensions, one for each time point in the waveform.
- PCA can be used to reduce the dimensionality of the data to significantly fewer dimensions (in empirical studies PCA has been used to reduce dimensionality to as few as 3-5 dimensions, but that may not be true for all cases). This provides greater statistical power with fewer degrees of freedom.
- a one-way Multivariate Analysis of Variance is performed, the purpose of which is to measure statistical differences between rest waveforms and stimulated waveforms for each sample volume.
- MANOVA thus represents an exemplary, but not limiting technique that can be used to measure such differences.
- the analytic versions of the post-beamformed RF ultrasound signals were first calculated using the Hilbert transform. From the analytic signals, tissue displacement was measured using a 2-D autocorrelation estimator.
- the standard one-dimensional (1-D) autocorrelator estimates the mean change in phase of the quadrature demodulated or analytic signal in slow-time, i.e. pulse-to-pulse, and scales the result by the wavelength of ultrasound at a reference frequency, typically the transmitted ultrasound center frequency, to derive velocity or displacement.
- a reference frequency typically the transmitted ultrasound center frequency
- the 2-D autocorrelator additionally estimates the mean change in phase of the signal in fast-time, i.e. depth-to-depth, to calculate the local ultrasound center frequency, and uses the wavelength at that frequency to derive velocity or displacement.
- displacement is estimated as:
- c is the speed of ultrasound in soft tissue
- T is the pulse-to-pulse sampling period
- t s is the depth-to-depth sampling period
- ⁇ circumflex over (R) ⁇ a (r, ⁇ ) is the estimate of the complex 2-D autocorrelation function at depth lag r and temporal lag ⁇
- arg is the argument, i.e. phase angle, of ⁇ circumflex over (R) ⁇ a (r, ⁇ ).
- Eq. (1) for a particular sample volume with a depth lag of one sample and with a temporal lag of one sample can be written as:
- the displacement waveforms for all of the sample volumes were first forward and reverse filtered to remove respiratory motion using a 3 rd order, high-pass Butterworth IIR filter with a cutoff at three-quarters of the mean cardiac frequency during the 8 second data block.
- Mean cardiac frequency was calculated from the subject's ECG R-wave intervals recorded concurrently with the ultrasound data.
- both a cardiac filter and respiratory filter are employed.
- either a cardiac filter or a respiratory filter is employed. The use of a respiratory filter is likely to be beneficial for studying tissue oxygenation in the brain.
- FIG. 6A represents an exemplary 8 second displacement waveform 202 during a control block for a sample volume near the brain stem after filtering to substantially reduce the effect of respiratory motion.
- Vertical dotted lines 204 indicate the beginning of the cardiac cycles based on the ECG R-waves.
- FIG. 6B graphically represents a modified 31 sample Hann window.
- FIG. 6C graphically represents one cardiac cycle (as indicated by a solid line 206 ) from FIG. 6A and the waveform after tapering (as indicated by a dotted line 208 ).
- Each cardiac cycle was segmented using the last sample preceding its R-wave and the first sample following the next cardiac cycle's R-wave. Cardiac cycles that began 0.5 seconds into the data block or that ended 0.5 seconds from the end of the data block were not used because of start-up and ending transient effects introduced by the respiratory filter, typically leaving five or six complete cardiac cycles during each block. The segments were then re-sampled by linear interpolation at 30 Hz such that the first time point in each re-sampled displacement waveform coincided in time with the cycle's R-wave. Each re-sampled segment was shifted such that the displacement at the beginning of the cardiac cycle was 0.
- Each displacement waveform segment for each cardiac cycle was tapered to 1 second to compensate for the variable durations of the cardiac cycles, to enable all of the cardiac cycles to be compared as described in subsequent sections.
- a modified 31 sample Hann window was used to taper the displacement waveforms (see FIG. 6B ). The first 11 samples within each segment were tapered using the first 11 points of a 21-point Hann window, and the remaining 20 samples were tapered using the last 20 points of a 40 point Hann window. This window was created such that the peak of the windowing function approximately coincided with the systolic peak in the displacement waveform segments.
- the displacement waveform segments for cardiac cycles less than 1 second long were zero-padded before tapering.
- the displacement waveforms were then spatially filtered using a Gaussian filter with a full-width-at-half-maximum (FWHM) of 4 mm.
- FWHM full-width-at-half-maximum
- PCA is standard statistical technique commonly used for feature extraction and data reduction.
- PCA is a linear transform that projects multivariate data onto new coordinate axes, i.e. new variables, which are ordered by the amount of variance in the original data that they explain. If the original variables are highly correlated, the number of variables can be reduced by eliminating the new variables that do not account for a significant fraction of the variance.
- the displacement waveforms for each sample volume were first organized into an M row by N column matrix, X, where M corresponds to the number of samples in each cardiac cycle and N corresponds to the number of cardiac cycles from all blocks for the entire study.
- M corresponds to the number of samples in each cardiac cycle
- N corresponds to the number of cardiac cycles from all blocks for the entire study.
- M corresponds to the number of cardiac cycles from all blocks for the entire study.
- M corresponds to the displacement waveform for each cardiac cycle
- M 31 dimensions
- the cumulative fractional energy in the first L eigenvectors is defined as:
- the cumulative fractional energy can be used for dimensionality reduction by retaining the first L eigenvectors needed to exceed a variance threshold for g.
- a threshold of 95% was used.
- W was constructed containing the first L eigenvectors.
- FIG. 7A Displacement waveforms for two control blocks (control waveforms 212 ) and two checkerboard blocks (stimulus waveforms 210 ) for one sample volume are shown in FIG. 7A .
- the displacement waveforms in FIG. 7A are for four successive blocks.
- the waveforms have been resampled, tapered to 1 second, and placed end-to-end.
- the entire data set included 31 blocks and 157 cardiac cycles. Within blocks and across blocks, the overall amplitude varies considerably due primarily to the influence of respiration on cardiac filling and resulting ejection fraction.
- FIG. 7B graphically illustrates mean waveforms from all the cardiac cycles for the control blocks (mean control waveform 212 A) and all the checkerboard blocks (mean stimulus waveform 210 A) for the sample volume.
- the p-value used for testing the hypothesis that the control blocks and checkerboard blocks have the same means was 1.0e ⁇ 10 .
- the shapes are remarkably similar, but the amplitude of the mean checkerboard waveform is larger than the amplitude of the mean control waveform, as would be expected if the blood flow, and thereby, the tissue pulsatility, increases during visual stimulation.
- FIG. 8 shows the consistency in the results from the four successful studies for the male subject.
- the p-values calculated by MANOVA are shown super-imposed on B-mode images for p-values less than 0.01.
- FIG. 9 shows the p-values for one of the sessions superimposed on an MRI image slice corresponding approximately to the ultrasound image plane.
- the left column includes B-mode images from one frame collected during each session.
- the brightest echo in each image at a depth of 80 mm is from the region around the pineal body.
- the right column shows the p-values for the functional TPI data superimposed on the respective B-mode images. P-values less than 0.01 are not considered significant and are not shown.
- a heavy boundary 214 in the images in the right column indicates the region-of-interest for the functional TPI analysis.
- FIG. 9 an MRI slice is shown, the slice approximately corresponding to the ultrasound image plane with superimposed p-values from the male subject, for session 5 .
- the functional TPI p-values have been drawn as a contour plot with curves every order of magnitude from 10 ⁇ 9 to 10 ⁇ 3 .
- the following structures are identified in FIG. 9 : pineal body 142 , posterior commisure 144 , quadrigeminal cistern 148 , and 3 rd ventricle 146 .
- DISCUSSION The empirical studies demonstrated a statistically significant increase in tissue pulsatility within the posterior region of the brain in response to a visual stimulus. The active regions appear to correlate with the paths of vessels that supply the visual cortex. A positive response was obtained in four out of seven studies for the male subject and in three out of seven studies for the female subject. The lack of response in the remaining studies could potentially be attributed to attentiveness, since prior brain function mapping studies have demonstrated a greater vascular response to a visual stimulus during periods of increased attentiveness. The study required the subject to lay still in a prone position with his/her head supported within a massage table face donut. Both subjects expressed difficulty staying awake, lack of attentiveness, and fogging or tearing of the eyes at times.
- the ultrasound system used for the study may also have contributed to the variability in the response.
- a commercially available system with a phased array transducer that was not optimized for transcranial imaging was used. Therefore, the frequency and power settings are not optimized for this specific application.
- the transducer was a standard hand-held transducer retained by an articulated clamp. Although relatively stable, the long moment arm introduced some mechanical instability.
- An ultrasound system with a fitted transducer would be more appropriate and would enable the transducer to be held in place with a helmet-style fixture, so the subject could sit in a more comfortable position during a study.
- functional TPI is based upon ultrasound, it maintains the qualities of being a rapid, portable, inexpensive tool that can be used for continuous monitoring and for repeat studies.
- the advantage of functional TPI over functional TCD is the use of tissue rather than blood as the signal source. Ultrasound backscatter from tissue is significantly stronger than that from blood, enabling acquisition of ultrasound signals of the cortical region of interest directly through the overlying skull.
- An additional advantage is the ability of this approach to study small functional cortical regions rather than larger arteries that supply multiple functional regions.
- ultrasound scanning was performed through the skull over the occipital protuberance, to ensure that the scans would be imaging through the visual cortex in the occipital lobe.
- the use of a tissue rather than a blood backscatter signal may also result in an overall reduction in transmitted ultrasound power once the technique is optimized. The highest power output allowed by the FDA for diagnostic imaging is for TCD.
- tissue pulsatility is more appropriately measured using tissue strain rather than tissue displacement. Assessing regional brain activity using displacement is complicated by the cumulative motion of the brain, i.e. an increase in blood flow to a stimulated region of the brain may displace remote tissues, making it appear as if they are activated even though they are not. Strain imaging could theoretically compensate for this remote, common-mode movement. Limited, preliminary analysis using strain waveforms measured using a least-squares strain estimator reveals similar regions of activation, suggesting cumulative tissue displacement is not a significant problem.
- TPI Cerebral Vasoreactivity
- empirical studies have also been performed to evaluate TPI's ability to monitor cerebral vasoreactivity (reduced cerebral vasoreactivity is associated with many medical conditions, and a system and a procedure for monitoring cerebral vasoreactivity comprise a useful diagnostic tool).
- changing blood volume causes the brain to expand and relax over the cardiac cycle. Because the volume of the brain is constrained by the fixed volume of the skull, expansion of the brain early in the cardiac cycle compresses the cerebral ventricles forcing cerebrospinal fluid (CSF) out of the skull. Later in the cardiac cycle, brain blood volume decreases, drawing CSF back into the skull. This expansion of the brain and compression of the cerebral ventricles causes the brain to move medially during systole and laterally during diastole. Additionally, the changing blood volume pushes the brain posteriorly and caudally towards the foramen magnum during systole followed by a rebound during diastole.
- CSF cerebrospinal fluid
- Cerebral vasoreactivity is the ability of the cerebral arterioles to respond to changes in arterial CO 2 partial pressure (PaCO 2 ) in order to regulate blood flow and oxygen delivery to the brain.
- PaCO 2 partial pressure
- Cerebral vasoreactivity is most commonly tested by having subjects breathe increasing concentrations of CO 2 or by administering acetazolamide to increase PaCO 2 , or by having subjects voluntarily hyperventilate to decrease PaCO 2 .
- Measurement of CVR has been used to evaluate cerebral vascular function over a broad range of clinical applications, including monitoring the severity of brain damage after an ischemic event, predicting the risk of a cerebral ischemic event in patients with carotid occlusive disease, assessing the efficacy of a carotid endarterectomy, and studying anxiety disorders and migraine attacks.
- TCD TCD
- Brain tissue pulsatility was measured in four subjects through the temporal acoustic window using a standard, general-purpose ultrasound scanner. Tissue pulsatility was measured before, during, and after voluntary hyperventilation, and the results were correlated with the subjects' end-tidal CO 2 measurements collected concurrently with ultrasound acquisition.
- TPI data that are not correlated with end-tidal CO 2 can be used to assess CVR trends. Such an assessment would be qualitative rather than quantitative. If a quantitative assessment is desired, then end-tidal CO 2 would be required.
- TPI to monitor CVR encompasses both qualitative monitoring without correlation to end-tidal CO 2 , and quantitative monitoring in connection with correlation to concurrently acquire end-tidal CO 2 data.
- Subjects Four subjects, all male, ages 29, 33, 41, and 52, participated in the study. No effort was made to control the day of the week, time of day, or caffeine intake when the tests were made. Written informed consent was obtained from all subjects.
- Each study consisted of three phases, a pre-hyperventilation phase lasting 6 minutes and 40 seconds, a voluntary hyperventilation phase lasting 20 minutes, and a post-hyperventilation phase lasting 20 minutes.
- the subject was instructed to breathe normally through his nostrils to maintain an end-tidal CO 2 around 40 mm Hg.
- the hyperventilation phase the subject was instructed to breathe rapidly (approximately one breath every 2 seconds) through his nostrils to maintain an end-tidal CO 2 around 20 mm Hg.
- subjects maintained a relatively constant depth of respiration throughout the hyperventilation phase.
- System 216 includes a Terason 2000TM laptop-based, general-purpose ultrasound Scanner (available from Teratech Corp., Burlington, Mass., including processing module/laptop computer 156 and ultrasound probe 158 ), personal computer 168 a with a Measurement Computing (Middleboro, Mass.) PCI-DAS 1000TM 12-bit digitizer sampling at 1 kHz for recording the subject's ECG and end-tidal CO 2 signals, ECG monitor 162 (VSM2TM, Physio-Control, Redmond, Wash.), arbitrary waveform generator 170 (model 33120ATM, available from, Agilent Technologies, Palo Alto, Calif.) for triggering the ultrasound scanner (i.e., computer 156 ) and the digitizer (i.e., computer 168 a ), and a CO 2 monitor 2
- a Terason 2000TM laptop-based, general-purpose ultrasound Scanner available from Teratech Corp., Burlington, Mass., including processing module/laptop computer 156 and ultrasound probe 158
- Leads 164 coupled ECG sensors (not specifically shown) attached to a subject to EGC monitor 162 .
- a data conductor 166 (such as a parallel, serial, or universal serial bus cable, although such data conductors are exemplary, rather than limiting) coupled the output of the ECG monitor (a transistor-transistor logic (TTL) signal coincident with the subject's ECG R-wave) to personal computer 168 a .
- a data conductor 222 (such as a parallel, serial, or universal serial bus cable, although such data conductors are exemplary, rather than limiting) coupled personal computer 168 a to CO 2 monitor 220 , which receives input from a nasal cannula 218 .
- CO 2 monitor 220 was employed in system 216 to determine if there was a correlation between TPI pulse amplitude data and subject end-tidal CO 2 . As discussed below, such a correlation exists, indicating that TPI pulse amplitude data can be used to monitor CVR. Where end-tidal CO 2 data are available, the TPI pulse amplitude data can be calibrated with the end-tidal CO 2 data, such that TPI data can quantitatively assess CVR. Absent such calibration, the TPI data is likely able to provide a qualitative assessment of CVR. Such calibration will require some measurement of the concentration of CO 2 in the subject's blood. An end-tidal CO 2 monitor is an easy way to do that.
- CO 2 concentration in blood is determined by the concentration of CO 2 the subject is breathing and one would not need to measure the concentration of CO 2 .
- a pharmacological agent such as acetazolamide
- acetazolamide could be administered to alter a concentration of carbon dioxide in the patient's blood.
- FIG. 10B schematically illustrates a more streamlined system 230 .
- System 230 shares components with system 174 of FIG. 3B , and common components share common reference numerals.
- System 230 includes an ultrasound data collection component 176 configured to collect the required ultrasound data, a cardiac cycle collection component 180 configured to obtain cardiac cycle data (using ECD or some other technique, as noted above), an optional CO 2 concentration data collection component 232 (required if a quantified assessment of CVR is desired, and not required for a qualified assessment of CVR) and at least one controller 182 a implementing the steps described herein for using TPI to monitor CVR.
- ultrasound is employed to estimate the cardiac cycle
- ultrasound data collection component 176 and cardiac cycle collection component 180 can be implemented using an ultrasound system.
- the 4V2 phased array scanhead (90° sector angle, 64 element, 2.5 MHz center frequency, 10 MHz RF sampling frequency, 128 scanlines per frame, and approximately 55% fractional bandwidth B-mode pulse) was used for ultrasound acquisition.
- a series of post-beamformed ultrasound RF (radiofrequency) frames were collected during B-mode imaging for off-line analysis in MATLABTM (The Mathworks, Inc., Natick, Mass.).
- the arbitrary waveform generator was programmed to output a 100 millisecond TTL pulse once every 40 seconds to trigger the digitizer and ultrasound scanner using the ultrasound scanner's ECG triggering feature.
- the arbitrary waveform generator was used because the ultrasound data and the ECG data were collected with two different computers.
- the arbitrary waveform generator was used to synchronize the two computers, to ensure that the two computers were acquiring data at the same time. If a single logical controller were employed, the waveform generator would not be required.
- flowchart 185 of FIG. 11 which corresponds to the method steps of the flowchart of FIG. 1B optimized for using TPI to monitor CVR. It should be recognized that the specific method steps of FIG. 11 are exemplary, rather than limiting. Thus, different processing steps (such as different transforms, different types of correlation, different types of filtering, and different steps to identify motion associated with mental stimulation) can alternatively be employed within the scope of this novel approach. Note that flowchart 185 shares steps with flowchart 184 of FIG. 5 , and common steps share common reference numerals.
- ECG data is collected to identify the cardiac cycle of the subject (although it should be noted that cardiac cycle data can be collected using techniques other than ECG, as discussed herein).
- post beam formed ultrasound data from brain tissue is collected.
- a Hilbert transform is performed on the ultrasound data. It should be noted that the step of block 190 is intended to represent converting RF data from real signals to analytic signals. The use of the Hilbert transform in particular is intended to be exemplary, rather than limiting.
- the ultrasound data undergoes a 2D autocorrelation process.
- correlation techniques are a function of the type of transducer employed to collect the ultrasound data.
- the specific correlation technique identified in FIG. 11 was selected based on the transducer employed in the empirical studies and is thus intended to be exemplary, rather than limiting.
- the correlation step defined the sample volume dimensions as 10 samples of 0.8 mm with a 50% overlap, and 2 scan lines (1.4 degrees) with 0% overlap. Again, such parameters are exemplary, rather than limiting.
- the correlated ultrasound data is filtered to separate out a cardiac portion of the signal from a respiratory portion of the signal.
- the respiratory portion is likely to include desired data, but is inherently noisier than the cardiac portion of the signal, thus less signal processing was required to extract useful data from the cardiac portion.
- the respiratory portion of the signal primarily corresponds to venous pulsations, while the cardiac portion primarily corresponds to arterial pulsations.
- the concepts disclosed herein extend to the use of the respiratory signal portion as well as the cardiac portion of the signal. Given sufficient signal processing techniques to extract noise from the respiratory signal, the respiratory signal alone may be useful.
- various signal enhancements are implemented, including waveform segmentation, waveform resampling, and waveform averaging.
- the purpose of such techniques is to obtain a consistent signal (i.e., to minimize variations between individual signals). These steps are discussed in greater detail below. Note that these enhancements steps are not identical to those performed for using ultrasound data to map brain function, particularly with respect to the averaging technique.
- the enhanced data is manipulated to measure pulse amplitude for the relaxed data and the stimulated data.
- the theory behind using TPI to assess CVR is based on correlating pulse amplitude to end-tidal CO 2 .
- a first order linear regression is performed on pulse amplitude and end-tidal CO 2 data.
- the analytic versions of the post-beamformed RF ultrasound signals were first calculated using the Hilbert transform. From the analytic signals, tissue displacement was calculated using the 2-D autocorrelation estimator, which estimates the mean change in phase of the quadrature-demodulated or analytic signal in slow-time, i.e., pulse-to-pulse, as well as fast-time, i.e., depth-to-depth. If multiple scan lines are included in the calculation, the displacement for a particular sample volume can be written as:
- FIG. 12A graphically illustrates a displacement waveform 240 from one dataset from a single sample volume from subject 4 before band-pass filtering.
- FIG. 12B graphically illustrates displacement waveform 240 of FIG. 12A after filtering, to yield a filtered waveform 242 .
- FIG. 12C graphically illustrates a mean displacement waveform 244 calculated by averaging cardiac cycles from the waveform of FIG. 12B .
- the lower frequency limit was selected to remove tissue motion synchronized with respiration which approached 0.5 Hz during the hyperventilation phase while retaining pulsatile tissue motion synchronized with the cardiac cycle, which was typically around 0.9 Hz or greater.
- the upper frequency limit was selected to minimize higher frequency noise while maintaining the majority of the motion synchronized with the cardiac cycle.
- the displacement waveform was parameterized by its “pulse amplitude”, i.e., the displacement of the sample volume during the systolic phase of the cardiac cycle ( FIG. 12C ).
- Each displacement waveform was first segmented into its individual cardiac cycles using the ECG R-waves, and each segmented cardiac cycle of displacement was then re-sampled at 30 Hz by linear interpolation such that the first time point in each cycle coincided with its R-wave. The re-sampled displacement waveforms were then averaged to yield a mean displacement waveform for each sample volume.
- pulse amplitude the displacement extrema occurring during the first 0.5 seconds of the mean displacement waveform were identified, and the pulse amplitude was calculated by subtracting the earlier extremum displacement, i.e., the pre-systolic displacement, from the later extremum displacement, i.e., the peak systolic displacement. Positive pulse amplitude indicates displacement towards transducer during systole, and negative pulse amplitude indicates displacement away from the transducer.
- FIG. 13A graphically illustrates end-tidal CO 2 from subject 3 , along with pulse amplitude measurements from a single sample volume.
- FIG. 13B graphically illustrates pulse amplitude versus end-tidal CO 2 from the same sample volume, along with the best-fit line with first-order linear regression.
- the term “pa” in the inset equation of FIG. 13B refers to pulse amplitude, and CO 2 in the same equation is the end-tidal CO 2 measurement.
- FIGS. 14A-14C collectively include a B-mode image 248 from one of the subjects along with the pulse amplitudes from two data sets, one collected before hyperventilation when the subject's end-tidal CO 2 was 41.7 mm Hg (pulse amplitude 250 of FIG. 14B ), and one collected during hyperventilation when the subject's end-tidal CO 2 was 20.7 mm Hg (pulse amplitude 252 of FIG. 14C ).
- the images show large regions of brain tissue pulsating up to ⁇ 75 ⁇ m under normal breathing conditions and a significant reduction in the pulse amplitude during hyperventilation.
- FIG. 14A is a transverse B-mode image of the brain and skull of subject 2 .
- FIG. 14B is a pulse amplitude image of the brain of subject 2 at rest (i.e., before hyperventilation) with an end-tidal CO 2 of 41.7 mm of Hg.
- FIG. 14C is a pulse amplitude image of the brain of subject 2 during hyperventilation with an end-tidal CO 2 of 20.7 mm of Hg.
- a positive-pulse amplitude indicates displacement toward the ultrasound transducer during systole, while a negative-pulse amplitude indicates displacement away from the ultrasound transducer during systole.
- FIG. 15 includes B-mode images from all of the subjects along with the predicted percent change in pulse amplitude for a change in end-tidal CO 2 from 40 mm of Hg to 20 mm of Hg for sample volumes with linear regression p-values less than 0.01.
- the B-mode images are from the first frame of the first data set for each subject.
- the predicted pulse amplitudes at 40 mm of Hg and 20 mm of Hg are calculated using the equation derived for each sample volume from the first-order linear regression of the measured pulse amplitudes onto the end-tidal CO 2 signal.
- Percent change is calculated by subtracting the pulse amplitude at 20 mm of Hg from the pulse amplitude at 40 mm of Hg and dividing the result by the pulse amplitude at 40 mm of Hg. Although some regions of increased pulsatility were observed, tissue pulsatility decreased with decreasing PaCO 2 for all subjects in the vast majority of sample volumes with p-values less than 0.01. Specifically, a left column 254 of FIG. 15 includes the B-mode images, while a right column 256 includes the expected percent change in pulse amplitude for a decrease in end-tidal CO 2 from 40-20 mm of Hg. Pulse amplitude percent change is shown only for sample volumes where the linear regression p-value of pulse amplitude onto end-tidal CO 2 was less than 0.01.
- FIG. 16A graphically illustrates histograms of percent changes from the four subjects for sample volumes with linear regression p-values less that 0.01.
- FIG. 16B graphically illustrates the median, 25 th and 75 th percentiles for percent changes for p-values less than 0.01 arranged by subject age.
- the tissue pulsatility response to hypocapnia appears to decrease with age, although with only four subjects, it is not possible to conclude that this trend is real and significant. This prospective finding is consistent, however, with the results of other studies that indicate a decrease in CVR with age, and age-related cerebrovascular disease.
- TPI CVR study demonstrated statistically significant changes in tissue pulsatility in the brain in response to hypocapnia induced by voluntary hyperventilation. In all subjects, the tissue pulsatility predominantly decreased with hyperventilation. There were, however, regions where pulsatility increased and regions without statistically significant changes in pulsatility. With TPI, the ability to accurately resolve tissue motion is affected by the amplitude and direction of motion along with the ultrasound signal-to-noise ratio (SNR). At the beginning of each cardiac cycle, the brain displaces medially towards the ventricles and posteriorly and caudally towards the foramen magnum. As a result, there is a gradient of motion across the brain.
- SNR ultrasound signal-to-noise ratio
- the amplitude of displacement is least near the surface of the skull and greatest near the ventricles and the foramen magnum.
- Doppler ultrasound it is only possible to measure the projected component of displacement parallel to the direction of ultrasound propagation. Because the displacement in the brain is not isotropic, the measured displacement will generally be less than the true displacement.
- the effect of this limitation is evidenced by the heterogeneity in the magnitude of the pulse amplitude, i.e., the absolute value of the pulse amplitude, between the two hemispheres (see FIGS. 14A-14C ).
- the absolute pulse amplitude measured in the left anterior hemisphere is greater than the absolute pulse amplitude measured in the right anterior hemisphere. It is assumed that corresponding sample volumes in the two hemispheres are displaced with equal magnitudes but in opposite directions in the medial direction.
- the measurement of pulse amplitude and the detection of significant changes in pulse amplitude are influenced by ultrasound SNR.
- the SNR from the brain can be particularly poor, given the significant attenuation of ultrasound by the skull.
- the variance in the pulse amplitude estimate increases. This variance is of greater significance when the true pulse amplitude is small, such as near the surface of the skull.
- all of the subjects have regions without statistically significant changes in pulse amplitude, which is most likely explained by poor SNR and not by a true lack of change in pulse amplitude.
- the ultrasound system used for the study may have also contributed to the heterogeneity of the TPI signal within and between subjects.
- the ultrasound scanner used was a commercially available system with a phased-array transducer that was not optimized for transcranial imaging. Therefore, the frequency and power settings were not optimized for TPI CVR studies.
- the transducer was a standard handheld transducer held by an articulated clamp. Although relatively stable, the long moment arm potentially introduced some mechanical instability.
- TPI is based on ultrasound, it maintains the qualities of being a rapid, portable, inexpensive tool that can be used for continuous monitoring in almost any setting.
- the advantage of TPI over TCD for assessing CVR is the use of tissue rather than blood as the signal source. Ultrasound backscatter from tissue is significantly stronger than that from blood, which is particularly important when imaging the brain, given the significant attenuation of ultrasound by the skull. Because of this fact, TCD is generally limited to imaging blood flow in the major cerebral blood vessels that supply large portions of the brain. With TPI, the increased ultrasound backscatter from tissue enables ultrasound to image brain displacement as a surrogate for blood flow through locations on the skull other than the three traditional acoustic windows.
- One potential alternative to both TPI and conventional TCD is transcranial ultrasound using echo-contrast agents. Such an approach would enable better visualization of localized cerebral perfusion, but would increase the cost and complexity of the examination.
Abstract
Description
where c is the speed of ultrasound in soft tissue, T is the pulse-to-pulse sampling period, ts is the depth-to-depth sampling period, {circumflex over (R)}a (r, τ) is the estimate of the complex 2-D autocorrelation function at depth lag r and temporal lag τ, and “arg” is the argument, i.e. phase angle, of {circumflex over (R)}a (r, τ).
where Z is the analytic signal indexed by depth i, scan line j, and frame k, and where I, J, and K indicate the number of depths, scan lines, and frames, respectively, over which the measurement is made. For the empirical studies discussed herein, the values employed are as follows: I=10 (0.77 mm), J=2 (0.025 rad), and K=2 (frames). Displacement for the first frame was set to 0, and displacement for subsequent frames was calculated from the cumulative displacement from previous frames.
C·V=V·D (4)
where D is the M×M diagonal matrix of eigenvalues sorted in descending order where each eigenvalue indicates the variance of the original data when projected onto the corresponding eigenvector arranged in columns in the M×M matrix V. The cumulative fractional energy in the first L eigenvectors is defined as:
Y=W′·B (6)
where Y is the L×N matrix of principal components, i.e., Y[l,n] corresponds to the projection of the nth displacement waveform onto the lth eigenvector.
where “arg” is the argument, i.e., phase angle, of the autocorrelation function, c is the speed of ultrasound, ts is the depth-to-depth sampling period, Z is the analytic signal indexed by depth i, scan line j, and frame k, and where I, J, and K are the number of depths, scan lines, and frames, respectively, over which the measurement is made. The following parameters were used in this study: I=39 (3.00 mm), J=2 (0.025 rad), and K=2 (frames). Displacement for the first frame was set to 0, and displacement for subsequent frames was calculated from the cumulative displacement from previous frames.
Claims (32)
Priority Applications (1)
| Application Number | Priority Date | Filing Date | Title |
|---|---|---|---|
| US12/114,703 US9005126B2 (en) | 2007-05-03 | 2008-05-02 | Ultrasonic tissue displacement/strain imaging of brain function |
Applications Claiming Priority (2)
| Application Number | Priority Date | Filing Date | Title |
|---|---|---|---|
| US91589707P | 2007-05-03 | 2007-05-03 | |
| US12/114,703 US9005126B2 (en) | 2007-05-03 | 2008-05-02 | Ultrasonic tissue displacement/strain imaging of brain function |
Publications (2)
| Publication Number | Publication Date |
|---|---|
| US20080275340A1 US20080275340A1 (en) | 2008-11-06 |
| US9005126B2 true US9005126B2 (en) | 2015-04-14 |
Family
ID=39940042
Family Applications (1)
| Application Number | Title | Priority Date | Filing Date |
|---|---|---|---|
| US12/114,703 Expired - Fee Related US9005126B2 (en) | 2007-05-03 | 2008-05-02 | Ultrasonic tissue displacement/strain imaging of brain function |
Country Status (1)
| Country | Link |
|---|---|
| US (1) | US9005126B2 (en) |
Cited By (10)
| Publication number | Priority date | Publication date | Assignee | Title |
|---|---|---|---|---|
| US10617388B2 (en) | 2016-01-05 | 2020-04-14 | Neural Analytics, Inc. | Integrated probe structure |
| US10709417B2 (en) | 2016-01-05 | 2020-07-14 | Neural Analytics, Inc. | Systems and methods for detecting neurological conditions |
| US11090026B2 (en) | 2016-01-05 | 2021-08-17 | Novasignal Corp. | Systems and methods for determining clinical indications |
| US11207054B2 (en) | 2015-06-19 | 2021-12-28 | Novasignal Corp. | Transcranial doppler probe |
| US11273283B2 (en) | 2017-12-31 | 2022-03-15 | Neuroenhancement Lab, LLC | Method and apparatus for neuroenhancement to enhance emotional response |
| US11364361B2 (en) | 2018-04-20 | 2022-06-21 | Neuroenhancement Lab, LLC | System and method for inducing sleep by transplanting mental states |
| US11452839B2 (en) | 2018-09-14 | 2022-09-27 | Neuroenhancement Lab, LLC | System and method of improving sleep |
| US11717686B2 (en) | 2017-12-04 | 2023-08-08 | Neuroenhancement Lab, LLC | Method and apparatus for neuroenhancement to facilitate learning and performance |
| US11723579B2 (en) | 2017-09-19 | 2023-08-15 | Neuroenhancement Lab, LLC | Method and apparatus for neuroenhancement |
| US11786694B2 (en) | 2019-05-24 | 2023-10-17 | NeuroLight, Inc. | Device, method, and app for facilitating sleep |
Families Citing this family (43)
| Publication number | Priority date | Publication date | Assignee | Title |
|---|---|---|---|---|
| US8069125B2 (en) * | 2007-12-13 | 2011-11-29 | The Invention Science Fund I | Methods and systems for comparing media content |
| US8615479B2 (en) * | 2007-12-13 | 2013-12-24 | The Invention Science Fund I, Llc | Methods and systems for indicating behavior in a population cohort |
| US8356004B2 (en) * | 2007-12-13 | 2013-01-15 | Searete Llc | Methods and systems for comparing media content |
| US20090164458A1 (en) * | 2007-12-20 | 2009-06-25 | Searete Llc, A Limited Liability Corporation Of The State Of Delaware | Methods and systems employing a cohort-linked avatar |
| US9211077B2 (en) * | 2007-12-13 | 2015-12-15 | The Invention Science Fund I, Llc | Methods and systems for specifying an avatar |
| US8195593B2 (en) * | 2007-12-20 | 2012-06-05 | The Invention Science Fund I | Methods and systems for indicating behavior in a population cohort |
| US20090157751A1 (en) * | 2007-12-13 | 2009-06-18 | Searete Llc, A Limited Liability Corporation Of The State Of Delaware | Methods and systems for specifying an avatar |
| US20090156955A1 (en) * | 2007-12-13 | 2009-06-18 | Searete Llc, A Limited Liability Corporation Of The State Of Delaware | Methods and systems for comparing media content |
| US20090157625A1 (en) * | 2007-12-13 | 2009-06-18 | Searete Llc, A Limited Liability Corporation Of The State Of Delaware | Methods and systems for identifying an avatar-linked population cohort |
| US20090171164A1 (en) * | 2007-12-17 | 2009-07-02 | Jung Edward K Y | Methods and systems for identifying an avatar-linked population cohort |
| US20090164302A1 (en) * | 2007-12-20 | 2009-06-25 | Searete Llc, A Limited Liability Corporation Of The State Of Delaware | Methods and systems for specifying a cohort-linked avatar attribute |
| US20090157813A1 (en) * | 2007-12-17 | 2009-06-18 | Searete Llc, A Limited Liability Corporation Of The State Of Delaware | Methods and systems for identifying an avatar-linked population cohort |
| US20090157481A1 (en) * | 2007-12-13 | 2009-06-18 | Searete Llc, A Limited Liability Corporation Of The State Of Delaware | Methods and systems for specifying a cohort-linked avatar attribute |
| US20090157660A1 (en) * | 2007-12-13 | 2009-06-18 | Searete Llc, A Limited Liability Corporation Of The State Of Delaware | Methods and systems employing a cohort-linked avatar |
| US20090164503A1 (en) * | 2007-12-20 | 2009-06-25 | Searete Llc, A Limited Liability Corporation Of The State Of Delaware | Methods and systems for specifying a media content-linked population cohort |
| US8150796B2 (en) * | 2007-12-20 | 2012-04-03 | The Invention Science Fund I | Methods and systems for inducing behavior in a population cohort |
| US9418368B2 (en) * | 2007-12-20 | 2016-08-16 | Invention Science Fund I, Llc | Methods and systems for determining interest in a cohort-linked avatar |
| US9775554B2 (en) * | 2007-12-31 | 2017-10-03 | Invention Science Fund I, Llc | Population cohort-linked avatar |
| US8425428B2 (en) | 2008-03-31 | 2013-04-23 | Covidien Lp | Nitric oxide measurements in patients using flowfeedback |
| US8652064B2 (en) | 2008-09-30 | 2014-02-18 | Covidien Lp | Sampling circuit for measuring analytes |
| US20120136255A1 (en) * | 2010-06-07 | 2012-05-31 | Shu Feng Fan | Tissue malignant tumor detection method and tissue malignant tumor detection apparatus |
| KR101120851B1 (en) * | 2010-09-15 | 2012-03-16 | 삼성메디슨 주식회사 | Ultrasound system and method for providing an elastic image based on lateral direction displacement compensation processing |
| DE112011103567A5 (en) * | 2010-10-26 | 2013-09-12 | Technische Universität München | Application of a two-dimensional analytical signal in sonography |
| US20130046168A1 (en) * | 2011-08-17 | 2013-02-21 | Lei Sui | Method and system of characterization of carotid plaque |
| US10512794B2 (en) | 2016-12-16 | 2019-12-24 | Brainsonix Corporation | Stereotactic frame |
| US9061133B2 (en) | 2012-12-27 | 2015-06-23 | Brainsonix Corporation | Focused ultrasonic transducer navigation system |
| US10974078B2 (en) | 2012-12-27 | 2021-04-13 | Brainsonix Corporation | Treating degenerative dementia with low intensity focused ultrasound pulsation (LIFUP) device |
| KR101501524B1 (en) * | 2013-01-11 | 2015-03-18 | 재단법인대구경북과학기술원 | Combining Brain Signals and Functional Electrostimulation Self-Directed Rehabilitation Method |
| JP6553140B2 (en) * | 2013-01-22 | 2019-07-31 | キヤノンメディカルシステムズ株式会社 | Ultrasonic diagnostic apparatus, image processing apparatus, and image processing method |
| WO2014115782A1 (en) * | 2013-01-22 | 2014-07-31 | 株式会社東芝 | Ultrasonic diagnostic device, image processing device, and image processing method |
| US11880989B2 (en) | 2014-04-25 | 2024-01-23 | Thornhill Scientific Inc. | Imaging abnormalities in vascular response |
| US10791931B2 (en) | 2015-02-04 | 2020-10-06 | Thornhill Scientific Inc. | Imaging reductions in cerebrovascular reactivity |
| WO2015161363A1 (en) * | 2014-04-25 | 2015-10-29 | Joseph Fisher | Imaging abnormalities in vascular response |
| FR3023156B1 (en) | 2014-07-02 | 2016-08-05 | Centre Nat Rech Scient | METHOD AND DEVICE FOR FUNCTIONAL IMAGING OF THE BRAIN |
| EP3087915B1 (en) * | 2015-04-27 | 2022-02-09 | Tata Consultancy Services Limited | Method and system for noise cleaning of photoplethysmogram signals for estimating blood pressure |
| US20160354061A1 (en) * | 2015-06-03 | 2016-12-08 | George Mason University | Method And Apparatus For Ultrasonic Analysis Of Brain Activity In Stroke Patients |
| US11690591B2 (en) * | 2015-09-24 | 2023-07-04 | Nihon Kohden Corporation | Apparatus and methods for detecting increase in brain swelling and/or shifting |
| CN112384140A (en) * | 2018-05-25 | 2021-02-19 | 丰田自动车欧洲公司 | System and method for determining the perceptual load and stimulus perception level of the human brain |
| US11324954B2 (en) | 2019-06-28 | 2022-05-10 | Covidien Lp | Achieving smooth breathing by modified bilateral phrenic nerve pacing |
| CN110623686B (en) * | 2019-08-14 | 2023-03-21 | 深圳市德力凯医疗设备股份有限公司 | Display method of cerebral blood flow data, storage medium and terminal device |
| US11759661B2 (en) | 2020-05-20 | 2023-09-19 | Brainsonix Corporation | Ultrasonic transducer treatment device |
| WO2022026587A1 (en) * | 2020-07-29 | 2022-02-03 | Liminal Sciences, Inc. | Methods and apparatus for pulsatility-mode sensing |
| CN112834367A (en) * | 2020-12-31 | 2021-05-25 | 中国人民解放军陆军特色医学中心 | Skull collision test system and dynamic measurement method of brain tissue strain |
Citations (24)
| Publication number | Priority date | Publication date | Assignee | Title |
|---|---|---|---|---|
| US5088498A (en) | 1988-10-17 | 1992-02-18 | The Board Of Regents Of The University Of Washington | Ultrasonic plethysmograph |
| US5183046A (en) | 1988-10-17 | 1993-02-02 | Board Of Regents Of The University Of Washington | Ultrasonic plethysmograph |
| US5194291A (en) | 1991-04-22 | 1993-03-16 | General Atomics | Corona discharge treatment |
| US5534232A (en) | 1994-08-11 | 1996-07-09 | Wisconsin Alumini Research Foundation | Apparatus for reactions in dense-medium plasmas |
| US5638823A (en) | 1995-08-28 | 1997-06-17 | Rutgers University | System and method for noninvasive detection of arterial stenosis |
| US5824277A (en) | 1995-12-06 | 1998-10-20 | E. I.Du Pont De Nemours And Company | Plasma oxidation of an exhaust gas stream from chlorinating titanium-containing material |
| US5840028A (en) | 1996-06-24 | 1998-11-24 | Japan Science And Technology Corporation | Ultrasonic diagnostic equipment |
| US5919139A (en) | 1997-12-19 | 1999-07-06 | Diasonics Ultrasound | Vibrational doppler ultrasonic imaging |
| US5935339A (en) | 1995-12-14 | 1999-08-10 | Iowa State University | Decontamination device and method thereof |
| US5951476A (en) * | 1997-11-14 | 1999-09-14 | Beach; Kirk Watson | Method for detecting brain microhemorrhage |
| US6066097A (en) * | 1997-10-22 | 2000-05-23 | Florida Atlantic University | Two dimensional ultrasonic scanning system and method |
| US6200539B1 (en) | 1998-01-08 | 2001-03-13 | The University Of Tennessee Research Corporation | Paraelectric gas flow accelerator |
| US6390979B1 (en) * | 2001-08-24 | 2002-05-21 | Philip Chidi Njemanze | Noninvasive transcranial Doppler ultrasound computerized mental performance testing system |
| US6406759B1 (en) | 1998-01-08 | 2002-06-18 | The University Of Tennessee Research Corporation | Remote exposure of workpieces using a recirculated plasma |
| WO2002069805A1 (en) | 2001-03-02 | 2002-09-12 | Palti Yoram Prof | Method and apparatus for detecting arterial stenosis |
| US6626855B1 (en) | 1999-11-26 | 2003-09-30 | Therus Corpoation | Controlled high efficiency lesion formation using high intensity ultrasound |
| US20040002654A1 (en) * | 2000-09-29 | 2004-01-01 | New Health Sciences, Inc. | Precision brain blood flow assessment remotely in real time using nanotechnology ultrasound |
| US6706892B1 (en) | 1999-09-07 | 2004-03-16 | Conjuchem, Inc. | Pulmonary delivery for bioconjugation |
| US20050015009A1 (en) * | 2000-11-28 | 2005-01-20 | Allez Physionix , Inc. | Systems and methods for determining intracranial pressure non-invasively and acoustic transducer assemblies for use in such systems |
| US20050065436A1 (en) | 2003-09-23 | 2005-03-24 | Ho Winston Zonh | Rapid and non-invasive optical detection of internal bleeding |
| US6875176B2 (en) * | 2000-11-28 | 2005-04-05 | Aller Physionix Limited | Systems and methods for making noninvasive physiological assessments |
| US20060079782A1 (en) * | 2004-08-31 | 2006-04-13 | University Of Washington | Ultrasonic technique for assessing wall vibrations in stenosed blood vessels |
| US7233819B2 (en) * | 2003-03-20 | 2007-06-19 | National Institute Of Information And Communications Technology | Method for mapping higher brain function and headgear for mapping higher brain function |
| US7309315B2 (en) * | 2002-09-06 | 2007-12-18 | Epoch Innovations, Ltd. | Apparatus, method and computer program product to facilitate ordinary visual perception via an early perceptual-motor extraction of relational information from a light stimuli array to trigger an overall visual-sensory motor integration in a subject |
-
2008
- 2008-05-02 US US12/114,703 patent/US9005126B2/en not_active Expired - Fee Related
Patent Citations (27)
| Publication number | Priority date | Publication date | Assignee | Title |
|---|---|---|---|---|
| US5088498A (en) | 1988-10-17 | 1992-02-18 | The Board Of Regents Of The University Of Washington | Ultrasonic plethysmograph |
| US5183046A (en) | 1988-10-17 | 1993-02-02 | Board Of Regents Of The University Of Washington | Ultrasonic plethysmograph |
| US5289820A (en) | 1988-10-17 | 1994-03-01 | The Board Of Regents Of The University Of Washington | Ultrasonic plethysmograph |
| US5194291A (en) | 1991-04-22 | 1993-03-16 | General Atomics | Corona discharge treatment |
| US5534232A (en) | 1994-08-11 | 1996-07-09 | Wisconsin Alumini Research Foundation | Apparatus for reactions in dense-medium plasmas |
| US5638823A (en) | 1995-08-28 | 1997-06-17 | Rutgers University | System and method for noninvasive detection of arterial stenosis |
| US5824277A (en) | 1995-12-06 | 1998-10-20 | E. I.Du Pont De Nemours And Company | Plasma oxidation of an exhaust gas stream from chlorinating titanium-containing material |
| US5935339A (en) | 1995-12-14 | 1999-08-10 | Iowa State University | Decontamination device and method thereof |
| US5840028A (en) | 1996-06-24 | 1998-11-24 | Japan Science And Technology Corporation | Ultrasonic diagnostic equipment |
| US6066097A (en) * | 1997-10-22 | 2000-05-23 | Florida Atlantic University | Two dimensional ultrasonic scanning system and method |
| US5951476A (en) * | 1997-11-14 | 1999-09-14 | Beach; Kirk Watson | Method for detecting brain microhemorrhage |
| US5919139A (en) | 1997-12-19 | 1999-07-06 | Diasonics Ultrasound | Vibrational doppler ultrasonic imaging |
| US6200539B1 (en) | 1998-01-08 | 2001-03-13 | The University Of Tennessee Research Corporation | Paraelectric gas flow accelerator |
| US6406759B1 (en) | 1998-01-08 | 2002-06-18 | The University Of Tennessee Research Corporation | Remote exposure of workpieces using a recirculated plasma |
| US6706892B1 (en) | 1999-09-07 | 2004-03-16 | Conjuchem, Inc. | Pulmonary delivery for bioconjugation |
| US6626855B1 (en) | 1999-11-26 | 2003-09-30 | Therus Corpoation | Controlled high efficiency lesion formation using high intensity ultrasound |
| US20040030268A1 (en) | 1999-11-26 | 2004-02-12 | Therus Corporation (Legal) | Controlled high efficiency lesion formation using high intensity ultrasound |
| US20040002654A1 (en) * | 2000-09-29 | 2004-01-01 | New Health Sciences, Inc. | Precision brain blood flow assessment remotely in real time using nanotechnology ultrasound |
| US6955648B2 (en) | 2000-09-29 | 2005-10-18 | New Health Sciences, Inc. | Precision brain blood flow assessment remotely in real time using nanotechnology ultrasound |
| US20050015009A1 (en) * | 2000-11-28 | 2005-01-20 | Allez Physionix , Inc. | Systems and methods for determining intracranial pressure non-invasively and acoustic transducer assemblies for use in such systems |
| US6875176B2 (en) * | 2000-11-28 | 2005-04-05 | Aller Physionix Limited | Systems and methods for making noninvasive physiological assessments |
| WO2002069805A1 (en) | 2001-03-02 | 2002-09-12 | Palti Yoram Prof | Method and apparatus for detecting arterial stenosis |
| US6390979B1 (en) * | 2001-08-24 | 2002-05-21 | Philip Chidi Njemanze | Noninvasive transcranial Doppler ultrasound computerized mental performance testing system |
| US7309315B2 (en) * | 2002-09-06 | 2007-12-18 | Epoch Innovations, Ltd. | Apparatus, method and computer program product to facilitate ordinary visual perception via an early perceptual-motor extraction of relational information from a light stimuli array to trigger an overall visual-sensory motor integration in a subject |
| US7233819B2 (en) * | 2003-03-20 | 2007-06-19 | National Institute Of Information And Communications Technology | Method for mapping higher brain function and headgear for mapping higher brain function |
| US20050065436A1 (en) | 2003-09-23 | 2005-03-24 | Ho Winston Zonh | Rapid and non-invasive optical detection of internal bleeding |
| US20060079782A1 (en) * | 2004-08-31 | 2006-04-13 | University Of Washington | Ultrasonic technique for assessing wall vibrations in stenosed blood vessels |
Non-Patent Citations (9)
| Title |
|---|
| Aaslid, R., "Visually Evoked Dynamic Blood Flow Response of the Human Cerebral Circulation", Stroke, 1987, 18:771-775. * |
| Aaslid, Rune, Thomas-Marc Markwalder, and Helge Nornes. "Noninvasive transcranial Doppler ultrasound recording of flow velocity in basal cerebral arteries" J Neurosurg. 57:769-774, 1982. |
| Campbell, J.K., J.M. Clark, D.N. White, and C.O. Jenkins. "Pulsatile Echo-encephalography" Acta Neurol Scand Suppl 45:1-57, 1970. |
| Dahl, Arve, David Russell, Rolf Nyberg-Hansen, Kjell Rootwelt, and Petter Mowinckel. "Simultaneous Assessment of Vasoreactivity Using Transcranial Doppler Ultrasound and Cerebral Blood Flow in Healthy Subjects" J. Cereb Blood Flow Metab 14(6):974-981, 1994. |
| Gao, L., K.J. Parker, R.M. Lerner, and S.F. Levinson. "Imaging of the Elastic Properties of Tissue-A Review" Ultrasound Med Biol 22(8):959-977, 1996. |
| Gao, L., K.J. Parker, R.M. Lerner, and S.F. Levinson. "Imaging of the Elastic Properties of Tissue—A Review" Ultrasound Med Biol 22(8):959-977, 1996. |
| Klingelhöfer, Jürgen, Dirk Sander, and Ingo Wittich. "Functional Ultrasonographic Imaging" In Babikian VL, Wechsler LR, eds. Transcranial Doppler Ultrasonography. Woburn, MA: Butterworth-Heinemann, 1999. pp. 49-66. |
| Markwalder, Thomas-Marc, Peter Grolimund, Rolf W. Seiler, Fritz Roth, and Rune Aaslid. "Dependency of Blood Flow Velocity in the Middle Cerebral Artery on End-Tidal Carbon Dioxide Partial Pressure-A Transcranial Ultrasound Doppler Study" J. Cereb Blood Flow Metab 4(3):368-372, 1984. |
| Markwalder, Thomas-Marc, Peter Grolimund, Rolf W. Seiler, Fritz Roth, and Rune Aaslid. "Dependency of Blood Flow Velocity in the Middle Cerebral Artery on End-Tidal Carbon Dioxide Partial Pressure—A Transcranial Ultrasound Doppler Study" J. Cereb Blood Flow Metab 4(3):368-372, 1984. |
Cited By (14)
| Publication number | Priority date | Publication date | Assignee | Title |
|---|---|---|---|---|
| US11207054B2 (en) | 2015-06-19 | 2021-12-28 | Novasignal Corp. | Transcranial doppler probe |
| US10617388B2 (en) | 2016-01-05 | 2020-04-14 | Neural Analytics, Inc. | Integrated probe structure |
| US10709417B2 (en) | 2016-01-05 | 2020-07-14 | Neural Analytics, Inc. | Systems and methods for detecting neurological conditions |
| US11090026B2 (en) | 2016-01-05 | 2021-08-17 | Novasignal Corp. | Systems and methods for determining clinical indications |
| US11589836B2 (en) | 2016-01-05 | 2023-02-28 | Novasignal Corp. | Systems and methods for detecting neurological conditions |
| US11452500B2 (en) | 2016-01-05 | 2022-09-27 | Novasignal Corp. | Integrated probe structure |
| US11723579B2 (en) | 2017-09-19 | 2023-08-15 | Neuroenhancement Lab, LLC | Method and apparatus for neuroenhancement |
| US11717686B2 (en) | 2017-12-04 | 2023-08-08 | Neuroenhancement Lab, LLC | Method and apparatus for neuroenhancement to facilitate learning and performance |
| US11478603B2 (en) | 2017-12-31 | 2022-10-25 | Neuroenhancement Lab, LLC | Method and apparatus for neuroenhancement to enhance emotional response |
| US11318277B2 (en) | 2017-12-31 | 2022-05-03 | Neuroenhancement Lab, LLC | Method and apparatus for neuroenhancement to enhance emotional response |
| US11273283B2 (en) | 2017-12-31 | 2022-03-15 | Neuroenhancement Lab, LLC | Method and apparatus for neuroenhancement to enhance emotional response |
| US11364361B2 (en) | 2018-04-20 | 2022-06-21 | Neuroenhancement Lab, LLC | System and method for inducing sleep by transplanting mental states |
| US11452839B2 (en) | 2018-09-14 | 2022-09-27 | Neuroenhancement Lab, LLC | System and method of improving sleep |
| US11786694B2 (en) | 2019-05-24 | 2023-10-17 | NeuroLight, Inc. | Device, method, and app for facilitating sleep |
Also Published As
| Publication number | Publication date |
|---|---|
| US20080275340A1 (en) | 2008-11-06 |
Similar Documents
| Publication | Publication Date | Title |
|---|---|---|
| US9005126B2 (en) | Ultrasonic tissue displacement/strain imaging of brain function | |
| Willie et al. | Utility of transcranial Doppler ultrasound for the integrative assessment of cerebrovascular function | |
| Gratton et al. | Removing the heart from the brain: compensation for the pulse artifact in the photon migration signal | |
| US20120203121A1 (en) | Devices and methods for monitoring cerebral hemodynamic characteristics | |
| JP2018510726A (en) | System and method for non-invasive monitoring of intracranial pressure | |
| US20130041271A1 (en) | Devices and methods for monitoring intracranial pressure and additional intracranial hemodynamic parameters | |
| US10898143B2 (en) | Quantitative mapping of cerebrovascular reactivity using resting-state functional magnetic resonance imaging | |
| US20110196245A1 (en) | Measurement of cerebral hemodynamic parameters | |
| US9167970B2 (en) | Non-invasive optical imaging for measuring pulse and arterial elasticity in the brain | |
| Kucewicz et al. | Functional tissue pulsatility imaging of the brain during visual stimulation | |
| US20130274615A1 (en) | Measurement of Cerebral Physiologic Parameters Using Bioimpedance | |
| US10912470B2 (en) | System and method for tracking cerebral blood flow in fMRI | |
| Lohmann et al. | Functional transcranial Doppler sonography | |
| US20210100525A1 (en) | Waveform visualization tool for facilitating medical diagnosis | |
| US20220192596A1 (en) | Method and system for engineering cycle variability-related features from biophysical signals for use in characterizing physiological systems | |
| Kucewicz et al. | Tissue pulsatility imaging of cerebral vasoreactivity during hyperventilation | |
| Laganà et al. | Cardiac, respiratory and postural influences on venous return of internal jugular and vertebral veins | |
| Tabassum et al. | Clinical translation of noninvasive intracranial pressure sensing with diffuse correlation spectroscopy | |
| US20220183561A1 (en) | Generating imaging-based neurological state biomarkers and estimating cerebrospinal fluid (csf) dynamics based on coupled neural and csf oscillations during sleep | |
| Turner et al. | Brain tissue pulsation in healthy volunteers | |
| Hsu et al. | Heart rate and respiratory rate monitoring using seismocardiography | |
| Deppe et al. | A method for the automated assessment of temporal characteristics of functional hemispheric lateralization by transcranial Doppler sonography | |
| US11304618B2 (en) | Method and apparatus for noninvasive absolute (mean) intracranial pressure (A-ICP) measurement and/or monitoring | |
| Saeed et al. | The carotid artery as an alternative site to the middle cerebral artery for reproducible estimates of autoregulation index | |
| CN111631700A (en) | System for regulating blood pressure according to optimal blood pressure target value |
Legal Events
| Date | Code | Title | Description |
|---|---|---|---|
| AS | Assignment |
Owner name: UNIVERSITY OF WASHINGTON, WASHINGTON Free format text: ASSIGNMENT OF ASSIGNORS INTEREST;ASSIGNORS:BEACH, KIRK;KUCEWICZ, JOHN;DUNMIRE, BARBRINA;REEL/FRAME:021177/0788;SIGNING DATES FROM 20080619 TO 20080625 Owner name: UNIVERSITY OF WASHINGTON, WASHINGTON Free format text: ASSIGNMENT OF ASSIGNORS INTEREST;ASSIGNORS:BEACH, KIRK;KUCEWICZ, JOHN;DUNMIRE, BARBRINA;SIGNING DATES FROM 20080619 TO 20080625;REEL/FRAME:021177/0788 |
|
| AS | Assignment |
Owner name: NATIONAL INSTITUTES OF HEALTH (NIH), U.S. DEPT. OF Free format text: EXECUTIVE ORDER 9424, CONFIRMATORY LICENSE;ASSIGNOR:UNIVERSITY OF WASHINGTON;REEL/FRAME:022173/0691 Effective date: 20080827 |
|
| STCF | Information on status: patent grant |
Free format text: PATENTED CASE |
|
| FEPP | Fee payment procedure |
Free format text: MAINTENANCE FEE REMINDER MAILED (ORIGINAL EVENT CODE: REM.); ENTITY STATUS OF PATENT OWNER: SMALL ENTITY |
|
| LAPS | Lapse for failure to pay maintenance fees |
Free format text: PATENT EXPIRED FOR FAILURE TO PAY MAINTENANCE FEES (ORIGINAL EVENT CODE: EXP.); ENTITY STATUS OF PATENT OWNER: SMALL ENTITY |
|
| STCH | Information on status: patent discontinuation |
Free format text: PATENT EXPIRED DUE TO NONPAYMENT OF MAINTENANCE FEES UNDER 37 CFR 1.362 |
|
| FP | Expired due to failure to pay maintenance fee |
Effective date: 20190414 |