US8831754B2 - Event prediction using hierarchical event features - Google Patents
Event prediction using hierarchical event features Download PDFInfo
- Publication number
- US8831754B2 US8831754B2 US13/608,714 US201213608714A US8831754B2 US 8831754 B2 US8831754 B2 US 8831754B2 US 201213608714 A US201213608714 A US 201213608714A US 8831754 B2 US8831754 B2 US 8831754B2
- Authority
- US
- United States
- Prior art keywords
- event
- data structure
- features
- graphical data
- variable nodes
- Prior art date
- Legal status (The legal status is an assumption and is not a legal conclusion. Google has not performed a legal analysis and makes no representation as to the accuracy of the status listed.)
- Active
Links
Images


Classifications
-
- G06F17/30958—
-
- G—PHYSICS
- G06—COMPUTING; CALCULATING OR COUNTING
- G06F—ELECTRIC DIGITAL DATA PROCESSING
- G06F16/00—Information retrieval; Database structures therefor; File system structures therefor
- G06F16/90—Details of database functions independent of the retrieved data types
- G06F16/901—Indexing; Data structures therefor; Storage structures
- G06F16/9024—Graphs; Linked lists
-
- G—PHYSICS
- G06—COMPUTING; CALCULATING OR COUNTING
- G06F—ELECTRIC DIGITAL DATA PROCESSING
- G06F16/00—Information retrieval; Database structures therefor; File system structures therefor
- G06F16/90—Details of database functions independent of the retrieved data types
- G06F16/95—Retrieval from the web
- G06F16/953—Querying, e.g. by the use of web search engines
- G06F16/9535—Search customisation based on user profiles and personalisation
-
- G06F17/30867—
Definitions
- a search engine monitors search results presented to users and whether users click on those search results.
- features describing the search result events are universal resource locator prefix levels which are inherently hierarchically related.
- a graphical data structure is created and stored and used to represent the hierarchical relationships between features.
- An online training process is used in examples which enables knowledge to be propagated through the graphical data structure according to the hierarchical relations between features.
- the graphical data structure is used to predict whether a user will click on a search result and those predictions are used by the search engine to rank search results for future searches.
- the events are advertisement impressions and the predictions are used by an online advertisement system.
- FIG. 1 is a schematic diagram of a control system for predicting events in order to control an apparatus which at least in part, influences the events;
- FIG. 2 is a flow diagram of a method at the control system of FIG. 1 ;
- FIG. 3 is a schematic diagram of an information retrieval system incorporating a prediction engine at an Enterprise connected behind a firewall to the Internet;
- FIG. 4 is a schematic diagram of an information retrieval system incorporating a prediction engine and having a simultaneous scope search engine at an Enterprise which is connected to the Internet via a firewall;
- FIG. 5 is a schematic diagram of an internet advertising system having an event prediction engine
- FIG. 6 is a flow diagram of a method of online training of a prediction engine
- FIG. 7 is a flow diagram of a method of predicting an event using a prediction engine
- FIG. 8 is a schematic diagram of a page impression represented as a sparse binary vector
- FIG. 9 is a schematic diagram of a graphical data structure for use in a control system.
- FIG. 10 is a schematic diagram of the graphical data structure of FIG. 9 with more detail.
- FIG. 11 is a schematic diagram of an example graphical data structure which is a factor graph
- FIG. 12 is a schematic diagram of a portion of the graphical data structure of FIG. 10 ;
- FIG. 13 is a schematic diagram of message passing on a graphical data structure in an example update
- FIG. 14 is a schematic diagram of a graphical data structure for a Gaussian level noise component
- FIG. 15 illustrates an exemplary computing-based device in which embodiments of a control system may be implemented.
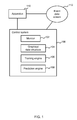
- FIG. 1 is a schematic diagram of a control system 100 for controlling an apparatus 110 .
- the control system 100 is computer implemented and is in communication with the apparatus 110 via a communications network or link. In some cases the control system 100 is integral with the apparatus 110 .
- the apparatus produces a stream of events 112 which have outcomes.
- the apparatus is a search engine which produces search results in response to queries. Each time a search result is produced by the search engine and displayed at a user interface an event occurs. The outcome of the event may be whether a user clicks on the search result or not.
- the apparatus is an online advertising system. In this case the event stream is a sequence of advertisement impressions and the outcome of an advertisement impression event is whether a user clicks on an advertisement or not.
- the apparatus is an email system and the event stream is a sequence of emails sent to a particular user. The outcome of an event is whether an email is classified as junk or not.
- the apparatus is a credit card fraud detection system and the event stream is a sequence of credit card transactions. The outcome of an event is whether a transaction is identified as being fraudulent.
- the control system 100 comprises a monitor 102 for monitoring the events and the event outcomes, a graphical data structure 104 stored in memory, a training engine 106 and a prediction engine 108 .
- the control system is arranged to provide a machine learning system which may incrementally learn from the monitored events. It may then be used to predict events and to control the apparatus 110 using those predictions.
- the control system 100 is arranged to exploit knowledge about hierarchical relationships of features describing the events. This enables the control system 100 to make improved quality predictions in situations where event data is sparse (and for events which have not previously been observed) and thus to provide improved control of the apparatus 110 .
- the control system 100 is able to exploit the knowledge about the hierarchical relationships through online or incremental learning. This enables the control system 100 to scale up successfully for use with large amounts of data.
- the control system provides a practical solution for web-scale applications such as where the apparatus 110 is a web search engine or internet advertising system. Because the control system 100 uses a training engine 106 that does not need to revisit data it is able to scale to very large online scenarios.
- the particular knowledge about hierarchical relationships between features describing events varies according to the application domain.
- the hierarchical features may be universal resource locator prefix levels.
- the hierarchical features may be email threads, email sender identifiers, email distribution groups or other clusters of emails.
- the hierarchical features may be times of day, calendar days, time periods, geographical locations, monetary amounts, or other clusters of credit card transaction features.
- the knowledge about the hierarchical relationships is captured in an efficient manner using a graphical data structure. The knowledge may be propagated through the graphical data structure in a manner which enables the knowledge to be shared.
- an event is a search result which is a new web page previously unseen by the control system
- knowledge about a domain from which that web page stems may be used as evidence about the new web page. This is possible for example where the control system already has evidence about the domain from which the new web page stems.
- the control system in at least some embodiments is able to use hierarchical relationships between features even when the number of levels in the hierarchy is variable. This increases the flexibility of the control system and enables it to fully exploit hierarchical relationships in event stream data. This flexibility is achieved at least in part by arranging the control system to dynamically adapt a graphical data structure that it uses.
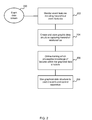
- FIG. 2 is a flow diagram of a method at the control system of FIG. 1 .
- An event data stream 200 is monitored and event features including hierarchical event features are detected 202 .
- Online training is carried out 206 which propagates knowledge of the features within a graphical data structure which captures the hierarchical relationships between features.
- the graphical data structure is used 208 to predict events and control an apparatus.
- the graphical data structure is formed from variable nodes each storing statistics describing a probability distribution which represents belief about a weight associated with a feature.
- the weights may be updated using a Bayesian update process which is implemented by carrying out message passing between nodes in the graph.
- intranet search engines An embodiment in which the apparatus to be controlled is an intranet search engine is now described with reference to FIGS. 3 and 4 .
- web pages and other documents are typically well organized in a hierarchical, structured manner as compared with documents and web pages stored outside intranet environments.
- event data such as user document-click-through data is often sparse for intranet search engines as compared with public domain search engine data.
- intranet (or Enterprise) search engines may be improved in terms of the quality of their results by exploiting the hierarchical information that is available as described herein.
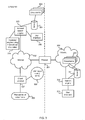
- FIG. 3 is a schematic diagram of an information retrieval system at an Enterprise (or other private domain) connected behind a firewall 301 to the Internet 300 .
- the entities to the left of the dotted line in FIG. 3 are referred to herein as being part of the Enterprise domain whereas those to the right of the dotted line are in the public domain.
- a search engine 312 is provided in the public domain connected to the Internet 300 and arranged to provide a user interface 313 which can be browsed by an end user at a client terminal such as client terminal 307 in the Enterprise domain.
- the search engine 312 has access to an index 311 of documents 310 . It is arranged to receive query terms 308 from an end user at a client terminal 307 (either in the public or private domain) and to return a ranked list of documents 309 using the index 311 .
- An intranet search engine 305 is also provided in the Enterprise domain and connected to an intranet 302 to which the client terminal 307 is also connected.
- the intranet search engine 305 has access to an index 304 of documents 303 which are available to users in the Enterprise but which are not generally available outside the Enterprise domain.
- the intranet search engine 305 also provides a user interface 306 which is accessible by the client terminal 307 .
- An end user at the client terminal 307 is able to input user query terms 308 to the Intranet search engine user interface 306 to obtain a ranked list of documents 309 from the index 304 .
- the intranet search engine 305 uses a prediction engine 314 using hierarchical click rates to predict which of a plurality of documents in the Enterprise domain the user is most likely to select and to use the prediction to present a ranked list of documents to a user.
- the end user is able to manually send queries to either the internet search engine 312 or the intranet search engine 305 .
- the event data stream comprises search results found by intranet search engine 305 and user click data observed in response to the search results.
- Each event may be described by a plurality of features. Some of these features exhibit inherent hierarchical relationships. For example, a web page listed in a list of search results has a web address which has a plurality of prefix levels. Each of these prefix levels may be a feature describing the event of listing that web page in a list of search results.
- an event comprises presenting the following universal resource locator (URL) to a user at client terminal 307 :
- each of these URL prefix levels is used as a feature of the event there is a potential for double counting.
- the prefix levels URL-1 and Domain+2 are the same.
- the graphical data structure may also comprise an observation component which is non-tree-based and which is used to capture information about features which are not hierarchical.
- these features may be content features describing content of search results presented as part of an event. Examples of content features may be whether the search result is an image, email, blog, text document, web page, or other type of document. Other examples of content features include but are not limited to: key words appearing in the document, anchor text, size of the document.
- the intranet search engine 305 observes that a user at client terminal 307 clicks on the search result Searchengine.com/images/cat/food.
- an online training process is used (as provided by the training engine 106 of FIG. 1 ) to update statistics stored in a graphical data structure ( 104 of FIG. 1 ) in respect of each of the following features:
- the online training process is also arranged to enable propagation of knowledge within the graphical data structure. For example, if an event occurs whereby a new web page is presented as a search result then knowledge about URL prefix levels of that new web page may influence features of the new web page. This is described in more detail below.
- a simultaneous scope search system may be provided as illustrated in FIG. 4 .
- a simultaneous scope search engine 402 is connected to the intranet and either integral with or in communication with the intranet search engine. Integral with, or connected to the simultaneous scope search engine 402 is a merging engine 403 and an evaluator 404 .
- the intranet search engine has a user interface for simultaneous scope search 405 .
- a user at a client terminal 307 is able to input user query terms 308 to the user interface for simultaneous scope search 405 and to obtain a ranked list of merged documents 400 .
- the simultaneous scope search engine is arranged to send the query terms 308 to both the intranet search engine 305 and the intern& search engine 312 and to receive the results. It is arranged to merge the results using the merging engine 403 and display the ranked, merged results list to the end user at the user interface 405 .
- the intranet search engine 305 uses a prediction engine 314 using hierarchical click rates to predict which of a plurality of documents in the Enterprise domain and in the public domain a user is most likely to select and to use the prediction to determine how best to merge the results and present a ranked list of documents to a user Implicit and/or explicit feedback 401 is observed at the user interface 405 and fed back to the simultaneous scope search engine. This feedback can be used to update the event prediction engine in order to produce new probabilities to update the merging engine.
- FIG. 5 shows an example where the apparatus to be controlled is an internet advertising system 504 .
- the event data stream comprises advertisement impressions and user click data which may be monitored by a monitor 506 at the internet advertising system 504 .
- the advertisement system 504 is arranged to select advertisements from a database of adverts 502 or other suitable source of adverts. The advertisements are selected on the basis of predicted click through rates as well as bids made by advertisers. The advertisements are to be presented to end users in conjunction with search results obtained from a search engine 516 .
- a prediction engine 510 at the advertisement system 504 is able to make improved click through rate predictions and hence better advertisement selections.
- the advertisement features may comprise URL prefix levels.
- the advertisement system 504 comprises an advertisement monitor 506 , a training engine 508 , a prediction engine 510 , a billing engine 512 , and a ranking engine 514 .
- the advertisement system is arranged to access a database or other store of advertisements 502 in order to select advertisements for presentation to a user.
- the advertisement system 504 may be connected to a search engine 516 which is arranged to retrieve documents 518 from a document database or other store.
- a user is able to access the search engine 516 , for example, using a web browser or other suitable access interface.
- the search engine is of any suitable type arranged to rank documents from the database 518 on the basis of the relevance of those documents to user input search terms.
- the search engine may rank documents using any appropriate method.
- an advertiser at a first computer implemented device 520 may wish to purchase advertising key words.
- the user submits information to the advertisement system 504 .
- the information may be an advertisement, a keyword the user is interested in bidding on or other appropriate information.
- the user receives a plurality of ranked advertisement keywords and is able to submit bids for the keywords.
- a schematic example of a user interface display 522 viewed by the advertiser is illustrated in FIG. 5 .
- a user at a further computer implemented device 524 may use a graphical user interface 526 to submit a query to the search engine 516 in order to find relevant search results.
- the search engine additionally provides a list of advertisements or sponsored search results to the user as illustrated in schematic graphical user interface 526 of FIG. 5 .
- the advertisement system 504 stores a graphical data structure as described in more detail below. Nodes of the graphical data structure store statistics representing belief about weights associated with advertisement features.
- the training engine 508 uses an online training process to update the statistics as events are observed.
- a prediction engine 510 is then able to use the graphical data structure to predict outcomes of future advertisement impressions.
- Some of the advertisement features are hierarchical and this knowledge is captured in the graphical data structure as described in more detail below. Information may then be propagated between nodes in the graphical data structure to enable previously unseen advertisements, or advertisements for which there is little data, to be dealt with appropriately.
- FIG. 6 is a flow diagram of a method at a training engine such as the training engine 106 of FIG. 1 .
- a monitor 102 of a control system receives 600 variables describing an event. These variables may be indicator variables as described below with reference to FIG. 8 although this is not essential. Some of the variables are hierarchical event variables and some are non-hierarchical event variables. For example, in the case each event is presentation of a search result from a search engine having a URL then the hierarchical event variables may be a sequence of URL prefix levels. The non-hierarchical event variables may be content features of the search result such as document type, document size.
- the monitor 102 also receives 602 an outcome of the event. For example, the outcome may be whether a user clicks the search result or not.
- the training engine 106 accesses 606 a graphical data structure having a node for each hierarchical event variable. If needed the training engine 106 creates and stores such a graphical data structure or adds 604 nodes to an existing graphical data structure available to it.
- the nodes for each hierarchical event variable are connected in a manner which reflects the hierarchy. For example, a tree-based graphical data structure may be used where a node has a parent and may have one or more children.
- a latent event score is stored at each hierarchical event variable node. These scores are stored as statistics describing a probability distribution representing belief about a weight associated with the hierarchical feature.
- the graphical data structure comprises nodes for the non-hierarchical event features. These nodes also store statistics describing a probability distribution representing belief about a weight associated with the feature. These nodes may be thought of as comprising an observation component of the graphical data structure. The nodes in this component are connected in any suitable manner which need not be tree-based.
- Nodes representing noise are also added to the graphical data structure.
- a level noise component made be added to the graphical data structure for each level of the tree.
- the training engine For each received hierarchical event variable the training engine is arranged to access 608 the latent event score from the graphical data structure. These latent event scores may be set to default values for previously unseen event features.
- the training engine updates 610 the accessed latent event scores using incremental Bayesian machine learning in the light of the event outcome.
- the update process is arranged such that a latent event score of a child node may inherit a noisy version of the latent event score of its parent node.
- the amount of noise to be used is specified by the level noise component at the level of the parent node.
- the nodes at the level noise component are themselves trained as part of the training process.
- the training engine is also arranged to update 612 the latent weights of the non-hierarchical event variables. This is also achieved using incremental Bayesian machine learning for example.
- the updated latent event scores and weights are stored 614 by replacing their previous values.
- the variables describing the event and the event outcome are discarded 616 and the process repeats as indicated in FIG. 6 for the next observed event. Because the updated values replace their previous values and because some of the data is discarded after the update the training process scales up well and provides a practical solution for web-scale applications.
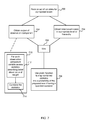
- FIG. 7 is a flow diagram of a method at a prediction engine such as that of FIG. 1 .
- a set of variables is received 700 for a proposed event.
- these variables are indicator variables for event features of a proposed event.
- a prediction engine is required to determine a probability that the outcome of the event will be a specified outcome.
- Some of the variables are hierarchical and these are used to look up in the graphical data structure and obtain 704 the latent event score at the appropriate level of the hierarchy for the feature.
- Others of the variables are non-hierarchical and are input to an observation component of the graphical data structure.
- the output of the observation component of the graphical data structure is obtained 702 and is biased 706 by the latent event score that was obtained 704 .
- the output of the observation component of the graphical data structure comprises combined statistics from the content features and after the bias is applied 706 a probit function is used 708 to map to a probability of the proposed event having the specified outcome.
- observation component 702 of the graphical data structure process 710 To obtain the output from the observation component 702 of the graphical data structure process 710 is followed. For each observation component variable statistics are accessed 712 describing belief about the value of a weight. These statistics are combined 714 using an inner product or in another manner.
- indicator variable is used herein to refer to a variable which may take only one of two values such as 0 and 1.
- Each indicator variable is associated with a feature which describes or is associated with an event.
- a “variable” may take any real value. For example, suppose a feature ‘price’ is specified. A variable associated with this feature may take any real value such as a number of cents. An “indicator variable” with this feature may take a value of say 0 or 1, to indicate for a given event, into which of a specified set of price ranges the event falls.
- a stream of event data is typically accessed and it is required to predict future items in that stream of event data.
- the events may be advertisement impressions and the event data may be, for each event, values taken by a specified set of features for that particular advertisement impression.
- an advertisement impression a non-exhaustive list of examples of features is: clientIP, match type and a generalized notion of position (page number, position on page, ad count).
- an advertisement impression was delivered to client IP 15.70.165.9 (see 800 in FIG. 1 ), the match type was broad 802 and the advertisement was displayed in position ML-1 (see 804 in FIG. 1 ).
- the advertisement comprises a web page with domain searchengine.com and URL prefix level domain+1 searchengine.com/cats.
- the binary indicator vectors may be stacked to obtain a representation of the advertisement impression as a sparse binary vector 812 .
- a sparse binary input vector x may be obtained by stacking the N individual feature vectors as follows:
- x [ x 1 ⁇ x N ]
- ⁇ ⁇ x i [ x i , 1 ⁇ x i , M i ]
- Each feature is represented by a binary indicator vector: for the i-th feature.
- Each position in feature vector corresponds to one of the possible values that feature can take. All values of the vector are 0 except for the one corresponding to the active value for the current impression which is set to 1. The total number of elements of the input vector set to 1 is N.
- FIG. 9 illustrates a tree-based graphical data structure although this is not essential. Any graphical data structure may be used which is able to represent hierarchical relationships between event features.
- FIG. 9 shows a plurality of nodes representing event features that are connected by edges in a hierarchical fashion.
- the structure is tree-based with a single root node s o that has two children s 1 1 and s 2 1 and where s 1 1 itself is a parent to more children and so on.
- s 1 1 itself is a parent to more children and so on.
- Each node is a variable node and stores statistics describing a probability distribution. That probability distribution represents a prediction engine's belief about a weight associated with an event feature.
- each variable node stores statistics which describe a Gaussian distribution s i l where l is the level in the hierarchy and i is the index of a node in a level.
- the levels of the tree may represent levels of a URL hierarchy.
- each clickable page in a hierarchy of web pages may be represented by a path in the tree so that root node s o may represent searchengine.com, s 1 1 may represent searchengine.com/images, S 2 2 may represent searchengine.com/images/cats and s 1 3 may represent searchengine.com/images/cats/food.
- emails or credit card transaction features may be represented by paths in the tree.
- each variable node representing a hierarchical event feature is referred to herein as a latent event score s 900 .
- a variable node representing a Boolean observable output y 902 Connected to each of these variable nodes is a variable node representing a Boolean observable output y 902 . For example, this might be whether a web page is clicked or not.
- a prior probability distribution for each variable node representing a hierarchical event feature may be a noisy copy of its parent. In this way information may be propagated through the graphical data structure as explained in more detail below.
- a plurality of variable nodes which represent noise are incorporated into the graphical data structure. These are shown as nodes n 904 in FIG. 9 and there is one for each level in the tree although this is not essential. Other numbers and arrangements of noise nodes may be used. In an example, level dependent Gaussian noise n l is learned for each level of the hierarchical graphical data structure.
- the graphical data structure comprises one or more observation components 906 .
- An observation component itself comprises variable nodes connected by links where the variable nodes represent event features which are not hierarchically related. For example, in the case that the events are search result documents then these features may be content features describing content of those documents. Variable nodes representing belief about weights associated with those content features are also provided in the observation component.
- each observation component comprises content feature nodes x i 908 and weight nodes w i 910 .
- Each variable nodes of the observation component stores statistics describing a probability distribution in the same way as for the other variable nodes 900 , 902 .
- the non-zero mean level noise indicates that shorter URLs have a greater click rate than longer URLs.
- the means of these Gaussians are less than zero in general. When there are many observations at any level of the tree the observations mean that the score variables will deviate from the prior. When a large number of observations are received the accuracy of the event prediction is increased. For example where the event observations are click-through rates some nodes will have greater click rates than their content would justify. Other less popular sites where more clicks were predicted than were observed will have a score distribution with a mean that is smaller than the sum of its parent and the level noise.
- the hierarchical graphical data structure described herein is scalable to very large online scenarios as it does not need to re-visit data. In addition the larger the number of events that are observed the more accurate the predictions become as this will deviate the score variables from the prior.
- FIG. 10 is a schematic diagram of the graphical data structure of FIG. 9 with more detail.
- the graphical data structure is shown as a factor graph representation.
- the factor graph comprises nodes connected by links.
- the nodes are either variable nodes 1000 (circles) or factor nodes 1002 (rectangles).
- Variable nodes represent storage locations and factor nodes represent computational units.
- the factor nodes read and write information to their neighbouring variable nodes according to calculation rules described later.
- An event that is observed or for which an outcome is to be predicted may be defined in the graphical data structure by a tuple ⁇ x, s 0 , s 1 , s 2 , s 3 , y ⁇ .
- the observed node is 1004 in FIG. 10 .
- Messages are propagated downward through the graphical data structure according to the sequence of hierarchical nodes specified in the tuple to generate a prediction, an observation is recorded y ⁇ 1,1 ⁇ and then the upward messages are propagated to update the graphical data structure.
- the factor graph components are shown expanded for the observed node 1004 and its parent noise 1006 n 3 .
- a latent event score at the observed node s 3 1004 serves as a bias to the output u 1008 of the observation component which in this example comprises a linear model of content features x 1010 with weights w 1012 .
- the latent event score at a node can be thought of as the residual between the observation component prediction and the actual observed click-through.
- the process of message passing comprises carrying out a calculation associated with a factor node 1002 using distribution parameters from neighbouring variable nodes 1000 and passing the results to one of the neighbouring variable nodes 1000 .
- the message can be defined as a partial joint distribution.
- the direction of passing the results (also referred to as a processing schedule) is explained in more detail now.
- An operator proj[x] is defined as a mapping from a non-Gaussian distribution x to a Gaussian or Gamma distribution with the same mean and variance.
- this operator many messages are Gaussian functions.
- m A ⁇ v (V) N(v′, ⁇ A ⁇ v , ⁇ 2 A ⁇ v ).
- FIG. 11 is a schematic diagram of an example graphical data structure which is a factor graph wherein an observation defines a tuple ⁇ y, x, s 0 , . . . , s l , . . . , s L ⁇ .
- the nodes have a single subscript which describes the node level.
- this type of graphical data structure may be formed and stored at a prediction engine in order to implement embodiments described herein.
- the factor graph can be considered as comprising one or more observation components 906 (described with reference to FIG. 12 ), score inheritance functionality (described in more detail with reference to FIG. 13 ) and level noise functionality (described in more detail with reference to FIG. 14 ). Messages are derived for these three sub-models and given a single observation tuple a processing schedule can be obtained.
- FIG. 12 shows a factor node K 1100 which reads a mean and a variance of a probability distribution representing the latent event score for root node 1000 from a database or other store. These statistics may be set to default values if the training is beginning and no updates have yet occurred.
- Root variable node 1000 has a plurality of children. For example, it is connected via factor node 1104 to the next level of the tree structure represented by node 1108 . That is node 1108 is intended to represent a layer of the tree structure in a collapsed form for clarity. Root variable node 1000 may also be connected to other child nodes which depend from it via other factor nodes 1102 . Thus other parts of the tree structure which step from root variable node 1000 are not shown for clarity but are indicated as stemming from factor nodes 1102 .
- the tree structure continues in this manner for more levels as indicated by nodes 1110 and 1114 .
- the particular number of levels of the tree may vary according to the event that is observed. This is indicated by the broken continuation lines between nodes 1108 and 1110 and between 1110 and 1114 .
- a level noise component 1112 is provided at each level of the tree. In FIG. 11 only one level noise component is shown expanded from node 1110 for clarity. In practice level noise components are formed for each level.
- An observation node 1116 is connected in a chain of variable nodes from the root node 1000 .
- the observation node may represent a latent event score for a proposed event (when the graphical data structure is used for prediction).
- the observation node may represent a latent event score for an observed event when the graphical data structure is used for training.
- the observation node 1116 has one or more children indicated in collapsed form by node 1118 in FIG. 11 .
- Output from the observation node 1116 is biased by output from an observation component 906 using factor node 1122 .
- Observation component 906 comprises variable nodes 1010 representing event features and variable nodes representing belief about weights associated with those event features.
- Factor node 1128 reads in a mean and variance from a database or other store for each observed event feature.
- Factor node 1126 combines the beliefs about the feature weights from the observation component, for example, using an inner product and stores the result at variable node 1124 .
- Variable node 1120 stores statistics describing belief about the event outcome.
- Factor node 1122 biases the output of the hierarchical event feature part of the data structure from node 1116 with knowledge from the observation component 906 and from the event outcome variable node 1120 and also according to a criterion specified by factor node 1132 . It stores the result at variable node 1130 and messages are passed back up through the tree structure to update the variable nodes.
- FIG. 12 is a schematic diagram of a portion of the graphical data structure of FIG. 11 showing how an observation component 906 is incorporated into the graphical data structure. Examples of messages that are passed from factor nodes to variable nodes in this portion of the graphical data structure are now described.
- a training engine is arranged to examine one observation at a time. In this way only the weight variables w i of observation component 906 associated with observed node 1116 are obtained.
- a batch update with multiple observations would giver rise to simultaneous messages at many such nodes, and in this situation the weight variables would be connected to multiple places in the tree introducing many loops. Treating one observation at a time in an online fashion effectively removes these loops giving a practical scalable solution.
- An example processing schedule for predicting events using the factor graph of FIG. 12 is:
- a message passed from a variable to a factor is defined by the fact that variables pass on the product of all their incoming messages from factors.
- a general expression for this is:
- a message passed from a variable node x to a factor node f is the product of all the messages received at x.
- Messages passed from factors to variables are the sum of all the variables local to the factor. When there are many variables local to the factor the message is obtained by integrating out each variable in turn.
- a general expression for a message passed from a factor f to variable w in terms of the upstream messages to the factor is:
- FIG. 12 An example of message passing between a variable and a factor is shown in FIG. 12 between observed variable node S L 1116 and factor node H 1122 .
- a product is taken over incoming messages to the variable node.
- One is from s L 's 1116 upstream B-factor (in the examples herein B-factors are functions which represent how a child node inherits a noise version of its parent score, described in more detail below) and the others are from its downstream child nodes.
- B-factors that are upstream of s L 1116 are denoted by B
- B-factors in a level L are denoted by L
- B-factors of a child node of S L 1116 are denoted by (s L ).
- m s L ⁇ H ⁇ ( s ) m B L ⁇ S L ⁇ ⁇ ⁇ B L + 1 i Message J ⁇ w i
- the message G ⁇ u is an example of a message passed from a factor node to a variable node as described above with reference to (0.2).
- G ⁇ u takes the form:
- the click event occurs here, where y ⁇ 1,1 ⁇ but there is no message as the click event is incorporated in the factor H.
- Passing update messages allows nodes closer to the root of the graphical data structure to be updated with information regarding events downstream.
- variable node When no observation is made at a node the s variable node can be thought of as a terminal node. There is no H-factor or observation messages to multiply up at the variable node.
- the observation sub model described in FIG. 12 is removed. This allows the approach to be adopted that only factors neighboring the “lightening bolt” from the root to the observed node in FIG. 11 are updated.
- the outcome is not binary and a more general ordinal regression framework can be adopted.
- the observations do not need to be restricted to a single variable.
- the binary outcomes “last click”, “only click” and “examined” are useful implicit relevance signals that stop short of the complexity involved with click-chain style model.
- Examined can be encoded as an input. For example the number of rank positions below the last known examination, which can be defined as the last clicked rank, can be encoded and if there are no clicks on the impression list it can be assumed that the top ranked document was examined. This feature may explain many skip events on documents with ostensibly good content.
- LastClick and OnlyClick may best be considered as outputs.
- the base click observation model can be extended to harness these two extra events.
- the variables are dependent, for example LastClick can only be true if Click is true. In this sense they represent an ordinal set. Instead of having a single fixed threshold at zero, a set is learnt. This observation model is more complex as the simplifications from the fact that y ⁇ 1,1 ⁇ no longer apply.
- a B-factor is where the level noise variable is added to a parent node score distribution to generate a prior child node distribution.
- the level noise variable is added to a parent node score distribution to generate a prior child node distribution.
- the messages described below with reference to FIG. 13 are messages that may be used for a schedule of updates.
- the downward prediction process is optimized and the upward update pass is slower. This feature makes prediction fast and the model update a slower off-line process.
- the messages described in FIG. 13 are members of a loop in the graph for a single update.
- the constituent nodes are updated by following a processing schedule.
- An example update path is:
- a single observation should affect each variable in the graph.
- the B-factors such as 1308 , 1304
- the update schedule does not update the whole tree but instead caches minimal updates in preparation for a new query at the B-factors.
- the update may be performed immediately or may be postponed.
- the messages from the B(s l ⁇ 1 ) factors may be set to one leaving the B-factor messages from the parent.
- A represents all A-factors below s 0 :
- m A i ⁇ s 0 represents messages from fellow siblings in the top level of the hierarchy.
- these messages may be set to one and m K ⁇ s 0 is a Gaussian message which is given by (0.3).
- m s 1 ⁇ B 2 ⁇ ( s 1 ) m A 1 ⁇ S 1 ⁇ ⁇ m B 2 i ⁇ s 1
- B-factors represent the sibling factors that are the children of s 1 .
- the messages from B(S 1 ) factors may be set to one, leaving just the A-factor message.
- the message P 2 : B l ⁇ S l is a special case of the message m K ⁇ s 0 . Both upstream variables can be integrate out using (0.2).
- m B l ⁇ s l ( s l ) N ( s l ; ⁇ s l ⁇ 1 ⁇ B l + ⁇ n l ⁇ B l , ⁇ s l ⁇ 1 ⁇ B l 2 + ⁇ n l ⁇ B l 2 )
- m s l ⁇ B l ⁇ ( s l ) m H ⁇ s L ⁇ ⁇ m B l + 1 i ⁇ s l
- m s l - 1 ⁇ B l i ⁇ ( s l - 1 ) m B l - 1 ⁇ s l - 1 ⁇ ⁇ m B l - 1 ⁇ s l - 1 ⁇ ⁇ B l i ⁇ ⁇ ⁇ ( s l - 1 ) - B l ⁇
- Message U 5 is the basis for messages U 4 and U 6
- Message U 4 is a collection of messages for a single B l ⁇ n l .
- An outgoing message from n l takes their product.
- the relevant child score variable is no longer s l but s l i defined here to be the child variable of the potentially many B l i factors that are the children of s l ⁇ 1 but not including s l ⁇ 1 itself m
- B l i ⁇ n l ( n l ) N ( n l ; ⁇ s l i ⁇ B l i ⁇ s l ⁇ 1 ⁇ B l i , ⁇ s l i ⁇ B l i + ⁇ s l ⁇ 1 ⁇ B l i ) ⁇ B l i ⁇ ( s l ⁇ 1 ) ⁇ B l ⁇
- the messages are expressed in terms of the message m s l i ⁇ B l i which are instances of message type U 1 .
- the local update for n l can be transferred to and from all the other B-factors in the level (in conjunction with message U 7 below).
- This message is the broadcast set. Applying the variable to factor rule a product of all other incoming messages to the variable n l 1312 is computed. An identical message can be broadcast for each node B l j :
- n l ⁇ B l j ⁇ ( n l ) m E l ⁇ n l ⁇ m B l ⁇ n l ⁇ ⁇ m B l i ⁇ n l ⁇ ⁇ B l j ⁇ ⁇ B l - ⁇ ( s l - 1 ) - B l ⁇
- these message can be replaced with a subset of messages in order to increase efficiency as long as the subset is of sufficient size.
- Message U 7 denotes a large number of messages from non-sibling B-factors to the level noise variable.
- the child integrated out is the child of the B-factor denoted s l j , the child variable of potentially very many B l j factors in level that are not children of s l ⁇ 1 .
- the parent score variable integrated out is not s l ⁇ 1 (as with U 4 ) but the parent of the B factor denoted here as s l ⁇ 1 j :
- n l ⁇ B l ⁇ ( n l ) m E l ⁇ n l ⁇ ⁇ m B l i ⁇ n l ⁇ ( n l ) ⁇ ⁇ m B l j ⁇ n l ⁇ ( n l )
- Message U 10 can be described as:
- n l ⁇ B l i ⁇ ( n l ) m E l ⁇ n l ⁇ m B l ⁇ n l ⁇ ⁇ m B ⁇ n l ⁇ ⁇ B l i ⁇ ⁇ B l - ⁇ ( s l - 1 ) - B l ⁇
- the message passing algorithm describes the level dependent Gaussian noise.
- the scores may be expected to decrease the lower the level in the tree. In other examples it may be the case that the score increases.
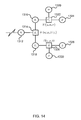
- FIG. 14 is a schematic diagram of a graphical data structure for a Gaussian level noise component which is a subset of the factor graph shown in FIG. 11 .
- variable 1312 n representing the noise level receives the following message from the Gaussian factor E 1314 .
- ⁇ m E ⁇ n ⁇ ( n ) 1 m n ⁇ E ⁇ ( n ) ⁇ proj ⁇ [ ⁇ ⁇ ⁇ ( ⁇ ; a , b ) ⁇ N ⁇ ( n ; ⁇ n , ⁇ n - 1 ) ⁇ k ] ⁇ d ⁇
- ⁇ n ⁇ 1 + ⁇ ⁇ 1 ⁇ n ⁇ E 2
- ⁇ n ( m ⁇ ⁇ ⁇ 1 + ⁇ + ⁇ n ⁇ E ⁇ n ⁇ E 2 ) ⁇ 1 ⁇ n
- ⁇ k N ⁇ ( ⁇ n ⁇ E ; m , ⁇ - 1 + ⁇ - 1 + ⁇ n ⁇ E 2 )
- the incoming message m n ⁇ E is defined above.
- ⁇ m E ⁇ ⁇ ⁇ ( ⁇ ) 1 m ⁇ ⁇ E ⁇ ( ⁇ ) ⁇ proj ⁇ [ ⁇ ⁇ ⁇ ( ⁇ ; a , b ) ⁇ N ⁇ ( ⁇ n ⁇ E ; m ⁇ ⁇ + ⁇ - 1 + ⁇ n ⁇ E 2 ) ]
- the proj operator in this message needs to map a gamma distribution.
- the three other components in the calculation of this message have all been assimilated into the one term.
- the upward message also needs messages m n ⁇ E (n) defined above.
- the marginal at each node that has received a new message as a result of the observation can be computed in the same way as the marginal is computed for message U 8 above.
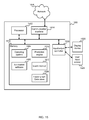
- FIG. 15 illustrates various components of an exemplary computing-based device 1500 which may be implemented as any form of a computing and/or electronic device, and in which embodiments of an event prediction system may be implemented.
- the computing-based device 1500 comprises a communication interface 1514 which enables it to communicate with one or more other entities over a communications network 1516 .
- the other entities may be databases, apparatus to be controlled or other entities.
- Computing-based device 1500 comprises one or more processors 1502 which may be microprocessors, controllers or any other suitable type of processors for processing computing executable instructions to control the operation of the device in order to predict events and use those predictions to control an apparatus.
- Platform software comprising an operating system 1504 or any other suitable platform software may be provided at the computing-based device to enable application software 1506 to be executed on the device.
- a prediction engine 1510 is provided and is arranged to predict events using hierarchical event features.
- An event monitor 1512 is provided to observe and monitor event outcomes and features of events as they occur.
- a factor graph data store 1508 is provided to store graphical data structures used by the prediction engine 1510 .
- Computer-readable media may include, for example, computer storage media such as memory 1518 and communications media.
- Computer storage media, such as memory 1518 includes volatile and non-volatile, removable and non-removable media implemented in any method or technology for storage of information such as computer readable instructions, data structures, program modules or other data.
- Computer storage media includes, but is not limited to, RAM, ROM, EPROM, EEPROM, flash memory or other memory technology, CD-ROM, digital versatile disks (DVD) or other optical storage, magnetic cassettes, magnetic tape, magnetic disk storage or other magnetic storage devices, or any other medium that can be used to store information for access by a computing device.
- communication media may embody computer readable instructions, data structures, program modules, or other data in a modulated data signal, such as a carrier wave, or other transport mechanism.
- computer storage media memory 1518
- the storage may be distributed or located remotely and accessed via a network or other communication link (e.g. using communication interface 1514 ).
- the computing-based device 1500 also comprises an input/output controller 1526 arranged to output display information to a display device 1520 which may be separate from or integral to the computing-based device 1500 .
- the display information may provide a graphical user interface.
- the input/output controller 1526 is also arranged to receive and process input from one or more devices, such as a user input device 1524 (e.g. a mouse or a keyboard).
- a user input device 1524 e.g. a mouse or a keyboard
- the display device 1520 may also act as the user input device 1524 if it is a touch sensitive display device.
- the input/output controller 1526 may also output data to devices other than the display device, e.g. a locally connected printing device.
- computer is used herein to refer to any device with processing capability such that it can execute instructions. Those skilled in the art will realize that such processing capabilities are incorporated into many different devices and therefore the term ‘computer’ includes PCs, servers, mobile telephones, personal digital assistants and many other devices.
- the methods described herein may be performed by software in machine readable form on a tangible storage medium.
- tangible (or non-transitory) storage media include disks, thumb drives, memory etc and do not include propagated signals.
- the software can be suitable for execution on a parallel processor or a serial processor such that the method steps may be carried out in any suitable order, or simultaneously.
- a remote computer may store an example of the process described as software.
- a local or terminal computer may access the remote computer and download a part or all of the software to run the program.
- the local computer may download pieces of the software as needed, or execute some software instructions at the local terminal and some at the remote computer (or computer network).
- a dedicated circuit such as a DSP, programmable logic array, or the like.
Abstract
Description
For example a message passed from a variable node x to a factor node f is the product of all the messages received at x. When the variable is a leaf node there are no incoming messages from upstream factors and n=0 in the product in (0.1).
Thus the message in the leaf node case is:
m x
When a factor is a leaf node, there are no incoming messages from upstream variables and so n=0 in the product in (0.2). Thus the message in an example of a leaf node which is a factor is:
m f
Message J→wi
m J→w
Message G→u
m H→t(t)=N(t;y[μ s→H+μG→u],σs→H 2+σG→u 2)
Message t→I
where v(z):=N(x; 0,1)/Φ(t; 0,1) where Φ is a probability mass attributed by a Gaussian to event potential values above zero and is a probit or cumulative Gaussian function and N(x; m, v) is the Gaussian distribution of a random variable x with mean m and variance v and z=μt→1/σ t→1.
Message t→H
m H→u(u)=N(u:yμ I→t+μs→H,σI→t 2+σs→H 2)
Message u→G
Message u→G is the same as message H→u above:
m u→G(u)=m H→u(u)
Message H→sL
m H→s(s)=N(s L ;yμ I→t→μu→H,σI→t 2+σu→H 2)
-
- 1. Update sl−1 1300 via messages to B-factors that are children of sl−1, keeping
n 1 1312 fixed: U1, (U9) U2; U10, U11 - 2. Update nl using all B-factors connected to nl: U3, U4 Pl; U5, U6, U7, U8
- 3. Update sl−1 1300 with new level noise: U9, U2; U10, U11
- 1. Update sl−1 1300 via messages to B-factors that are children of sl−1, keeping
m B
m A
Message Ul: sl→Bl
Message U2: Bl→sl−1
m B
m B
m B
m B
Message E→γ
Claims (20)
Priority Applications (1)
| Application Number | Priority Date | Filing Date | Title |
|---|---|---|---|
| US13/608,714 US8831754B2 (en) | 2010-06-17 | 2012-09-10 | Event prediction using hierarchical event features |
Applications Claiming Priority (2)
| Application Number | Priority Date | Filing Date | Title |
|---|---|---|---|
| US12/817,577 US8265778B2 (en) | 2010-06-17 | 2010-06-17 | Event prediction using hierarchical event features |
| US13/608,714 US8831754B2 (en) | 2010-06-17 | 2012-09-10 | Event prediction using hierarchical event features |
Related Parent Applications (1)
| Application Number | Title | Priority Date | Filing Date |
|---|---|---|---|
| US12/817,577 Continuation US8265778B2 (en) | 2010-06-17 | 2010-06-17 | Event prediction using hierarchical event features |
Publications (2)
| Publication Number | Publication Date |
|---|---|
| US20130006900A1 US20130006900A1 (en) | 2013-01-03 |
| US8831754B2 true US8831754B2 (en) | 2014-09-09 |
Family
ID=45329350
Family Applications (2)
| Application Number | Title | Priority Date | Filing Date |
|---|---|---|---|
| US12/817,577 Expired - Fee Related US8265778B2 (en) | 2010-06-17 | 2010-06-17 | Event prediction using hierarchical event features |
| US13/608,714 Active US8831754B2 (en) | 2010-06-17 | 2012-09-10 | Event prediction using hierarchical event features |
Family Applications Before (1)
| Application Number | Title | Priority Date | Filing Date |
|---|---|---|---|
| US12/817,577 Expired - Fee Related US8265778B2 (en) | 2010-06-17 | 2010-06-17 | Event prediction using hierarchical event features |
Country Status (1)
| Country | Link |
|---|---|
| US (2) | US8265778B2 (en) |
Cited By (3)
| Publication number | Priority date | Publication date | Assignee | Title |
|---|---|---|---|---|
| US10067596B2 (en) * | 2014-06-04 | 2018-09-04 | International Business Machines Corporation | Touch prediction for visual displays |
| US11397745B1 (en) | 2019-03-26 | 2022-07-26 | Grant Carter Hemingway | System and method for determining rankings, searching, and generating reports of profiles and personal information |
| US11947622B2 (en) | 2012-10-25 | 2024-04-02 | The Research Foundation For The State University Of New York | Pattern change discovery between high dimensional data sets |
Families Citing this family (25)
| Publication number | Priority date | Publication date | Assignee | Title |
|---|---|---|---|---|
| US8065315B2 (en) * | 2008-08-27 | 2011-11-22 | Sap Ag | Solution search for software support |
| US8265778B2 (en) | 2010-06-17 | 2012-09-11 | Microsoft Corporation | Event prediction using hierarchical event features |
| US8712931B1 (en) * | 2011-06-29 | 2014-04-29 | Amazon Technologies, Inc. | Adaptive input interface |
| US8639680B1 (en) | 2012-05-07 | 2014-01-28 | Google Inc. | Hidden text detection for search result scoring |
| WO2014107193A1 (en) | 2013-01-03 | 2014-07-10 | Board Of Regents, The University Of Texas System | Efficiently identifying images, videos, songs or documents most relevant to the user based on attribute feedback |
| US9176993B2 (en) | 2013-01-03 | 2015-11-03 | Board Of Regents, The University Of Texas System | Efficiently identifying images, videos, songs or documents most relevant to the user using binary search trees on attributes for guiding relevance feedback |
| US9501460B1 (en) * | 2013-02-28 | 2016-11-22 | Google Inc. | Detecting and processing invisible elements within a web page |
| US10565501B1 (en) * | 2013-04-19 | 2020-02-18 | Amazon Technologies, Inc. | Block device modeling |
| US10354284B2 (en) * | 2013-12-05 | 2019-07-16 | Palo Alto Research Center Incorporated | System and method for estimating and clustering multiple-dimension characteristics for auction-based message delivery |
| US10007719B2 (en) * | 2015-01-30 | 2018-06-26 | Microsoft Technology Licensing, Llc | Compensating for individualized bias of search users |
| US10007730B2 (en) | 2015-01-30 | 2018-06-26 | Microsoft Technology Licensing, Llc | Compensating for bias in search results |
| US9443002B1 (en) * | 2015-07-10 | 2016-09-13 | Grand Rapids, Inc. | Dynamic data analysis and selection for determining outcomes associated with domain specific probabilistic data sets |
| US10122646B2 (en) * | 2015-11-06 | 2018-11-06 | Oath Inc. | Resource placement via a web page |
| US20180165583A1 (en) * | 2016-12-14 | 2018-06-14 | Microsoft Technology Licensing, Llc | Controlling systems based on values inferred by a generative model |
| US10776426B1 (en) * | 2017-04-28 | 2020-09-15 | EMC IP Holding Company LLC | Capacity management for trees under multi-version concurrency control |
| US10521725B2 (en) | 2017-06-12 | 2019-12-31 | Vicarious Fpc, Inc. | Systems and methods for event prediction using schema networks |
| US10540410B2 (en) | 2017-11-15 | 2020-01-21 | Sap Se | Internet of things structured query language query formation |
| US10726072B2 (en) | 2017-11-15 | 2020-07-28 | Sap Se | Internet of things search and discovery graph engine construction |
| CN109993334A (en) * | 2017-12-29 | 2019-07-09 | 顺丰科技有限公司 | Quota prediction technique, device, equipment and storage medium |
| US20200019840A1 (en) * | 2018-07-13 | 2020-01-16 | Arizona Board Of Regents On Behalf Of Arizona State University | Systems and methods for sequential event prediction with noise-contrastive estimation for marked temporal point process |
| US11048767B2 (en) * | 2018-11-16 | 2021-06-29 | Sap Se | Combination content search |
| US10719314B2 (en) * | 2018-11-26 | 2020-07-21 | Oracle International Corporation | Probabilistic call-graph construction |
| CN110019253B (en) * | 2019-04-18 | 2021-10-12 | 北京邮电大学 | Distributed graph data sequence sampling method and device |
| US11269895B2 (en) * | 2019-09-06 | 2022-03-08 | Microsoft Technology Licensing, Llc | Automated labeling of child objects within tagged parents |
| CN112948508A (en) * | 2021-04-15 | 2021-06-11 | 平安科技(深圳)有限公司 | Information prediction method, device, equipment and medium based on multilayer associated knowledge graph |
Citations (24)
| Publication number | Priority date | Publication date | Assignee | Title |
|---|---|---|---|---|
| US6317761B1 (en) * | 1998-05-15 | 2001-11-13 | Unicast Communications Corporation | Technique for implementing browser-initiated user-transparent advertising and for interstitially displaying an advertisement, so distributed, through a web browser in response to a user click-stream |
| US6484203B1 (en) * | 1998-11-09 | 2002-11-19 | Sri International, Inc. | Hierarchical event monitoring and analysis |
| US20030005038A1 (en) | 2001-06-29 | 2003-01-02 | International Business Machines Corporation | Method and system for predictive directional data caching |
| US20040219776A1 (en) * | 2002-12-30 | 2004-11-04 | Cheolsoo Park | Method for forming metal lines in a semiconductor device |
| US20040249776A1 (en) | 2001-06-28 | 2004-12-09 | Microsoft Corporation | Composable presence and availability services |
| US6883148B1 (en) | 2001-08-28 | 2005-04-19 | Cadence Design Systems, Inc. | Method and apparatus for creating an extraction model using Bayesian inference |
| US20050131869A1 (en) * | 2003-12-12 | 2005-06-16 | Lexing Xie | Unsupervised learning of video structures in videos using hierarchical statistical models to detect events |
| US6947935B1 (en) | 2001-04-04 | 2005-09-20 | Microsoft Corporation | Training, inference and user interface for guiding the caching of media content on local stores |
| US7103524B1 (en) * | 2001-08-28 | 2006-09-05 | Cadence Design Systems, Inc. | Method and apparatus for creating an extraction model using Bayesian inference implemented with the Hybrid Monte Carlo method |
| US20070094219A1 (en) * | 2005-07-14 | 2007-04-26 | The Boeing Company | System, method, and computer program to predict the likelihood, the extent, and the time of an event or change occurrence using a combination of cognitive causal models with reasoning and text processing for knowledge driven decision support |
| US20070244746A1 (en) * | 2006-04-18 | 2007-10-18 | Issen Daniel A | Correlating an advertisement click event with a purchase event |
| US20080005163A1 (en) | 2006-06-30 | 2008-01-03 | International Business Machines Corporation | Method and Apparatus For Caching Broadcasting Information |
| US7318056B2 (en) * | 2002-09-30 | 2008-01-08 | Microsoft Corporation | System and method for performing click stream analysis |
| US20080071714A1 (en) | 2006-08-21 | 2008-03-20 | Motorola, Inc. | Method and apparatus for controlling autonomic computing system processes using knowledge-based reasoning mechanisms |
| US20080154821A1 (en) | 2006-12-11 | 2008-06-26 | Poulin Christian D | Collaborative Predictive Model Building |
| US20090043593A1 (en) | 2007-08-08 | 2009-02-12 | Microsoft Corporation | Event Prediction |
| US20090106221A1 (en) | 2007-10-18 | 2009-04-23 | Microsoft Corporation | Ranking and Providing Search Results Based In Part On A Number Of Click-Through Features |
| US7565334B2 (en) | 2006-11-17 | 2009-07-21 | Honda Motor Co., Ltd. | Fully bayesian linear regression |
| US7607169B1 (en) * | 2002-12-02 | 2009-10-20 | Arcsight, Inc. | User interface for network security console |
| US7860870B2 (en) * | 2007-05-31 | 2010-12-28 | Yahoo! Inc. | Detection of abnormal user click activity in a search results page |
| US7941525B1 (en) * | 2006-04-01 | 2011-05-10 | ClickTale, Ltd. | Method and system for monitoring an activity of a user |
| US8015604B1 (en) * | 2003-10-10 | 2011-09-06 | Arcsight Inc | Hierarchical architecture in a network security system |
| US20110313548A1 (en) | 2010-06-17 | 2011-12-22 | Microsoft Corporation | Event Prediction Using Hierarchical Event Features |
| US20130144722A1 (en) * | 2005-09-14 | 2013-06-06 | Jumptap, Inc. | System for Targeting Advertising Content to a Plurality of Mobile Communication Facilities |
-
2010
- 2010-06-17 US US12/817,577 patent/US8265778B2/en not_active Expired - Fee Related
-
2012
- 2012-09-10 US US13/608,714 patent/US8831754B2/en active Active
Patent Citations (26)
| Publication number | Priority date | Publication date | Assignee | Title |
|---|---|---|---|---|
| US7155663B2 (en) * | 1998-05-15 | 2006-12-26 | Unicast Communications Corporation | Technique for implementing browser-initiated user-transparent network-distributed advertising and for interstitially displaying an advertisement, so distributed, through a web browser in response to a user click-stream |
| US6317761B1 (en) * | 1998-05-15 | 2001-11-13 | Unicast Communications Corporation | Technique for implementing browser-initiated user-transparent advertising and for interstitially displaying an advertisement, so distributed, through a web browser in response to a user click-stream |
| US6484203B1 (en) * | 1998-11-09 | 2002-11-19 | Sri International, Inc. | Hierarchical event monitoring and analysis |
| US20040221191A1 (en) * | 1998-11-09 | 2004-11-04 | Porras Phillip Andrew | Network surveillance |
| US6947935B1 (en) | 2001-04-04 | 2005-09-20 | Microsoft Corporation | Training, inference and user interface for guiding the caching of media content on local stores |
| US20040249776A1 (en) | 2001-06-28 | 2004-12-09 | Microsoft Corporation | Composable presence and availability services |
| US20030005038A1 (en) | 2001-06-29 | 2003-01-02 | International Business Machines Corporation | Method and system for predictive directional data caching |
| US6883148B1 (en) | 2001-08-28 | 2005-04-19 | Cadence Design Systems, Inc. | Method and apparatus for creating an extraction model using Bayesian inference |
| US7103524B1 (en) * | 2001-08-28 | 2006-09-05 | Cadence Design Systems, Inc. | Method and apparatus for creating an extraction model using Bayesian inference implemented with the Hybrid Monte Carlo method |
| US7318056B2 (en) * | 2002-09-30 | 2008-01-08 | Microsoft Corporation | System and method for performing click stream analysis |
| US7607169B1 (en) * | 2002-12-02 | 2009-10-20 | Arcsight, Inc. | User interface for network security console |
| US20040219776A1 (en) * | 2002-12-30 | 2004-11-04 | Cheolsoo Park | Method for forming metal lines in a semiconductor device |
| US8015604B1 (en) * | 2003-10-10 | 2011-09-06 | Arcsight Inc | Hierarchical architecture in a network security system |
| US20050131869A1 (en) * | 2003-12-12 | 2005-06-16 | Lexing Xie | Unsupervised learning of video structures in videos using hierarchical statistical models to detect events |
| US20070094219A1 (en) * | 2005-07-14 | 2007-04-26 | The Boeing Company | System, method, and computer program to predict the likelihood, the extent, and the time of an event or change occurrence using a combination of cognitive causal models with reasoning and text processing for knowledge driven decision support |
| US20130144722A1 (en) * | 2005-09-14 | 2013-06-06 | Jumptap, Inc. | System for Targeting Advertising Content to a Plurality of Mobile Communication Facilities |
| US7941525B1 (en) * | 2006-04-01 | 2011-05-10 | ClickTale, Ltd. | Method and system for monitoring an activity of a user |
| US20070244746A1 (en) * | 2006-04-18 | 2007-10-18 | Issen Daniel A | Correlating an advertisement click event with a purchase event |
| US20080005163A1 (en) | 2006-06-30 | 2008-01-03 | International Business Machines Corporation | Method and Apparatus For Caching Broadcasting Information |
| US20080071714A1 (en) | 2006-08-21 | 2008-03-20 | Motorola, Inc. | Method and apparatus for controlling autonomic computing system processes using knowledge-based reasoning mechanisms |
| US7565334B2 (en) | 2006-11-17 | 2009-07-21 | Honda Motor Co., Ltd. | Fully bayesian linear regression |
| US20080154821A1 (en) | 2006-12-11 | 2008-06-26 | Poulin Christian D | Collaborative Predictive Model Building |
| US7860870B2 (en) * | 2007-05-31 | 2010-12-28 | Yahoo! Inc. | Detection of abnormal user click activity in a search results page |
| US20090043593A1 (en) | 2007-08-08 | 2009-02-12 | Microsoft Corporation | Event Prediction |
| US20090106221A1 (en) | 2007-10-18 | 2009-04-23 | Microsoft Corporation | Ranking and Providing Search Results Based In Part On A Number Of Click-Through Features |
| US20110313548A1 (en) | 2010-06-17 | 2011-12-22 | Microsoft Corporation | Event Prediction Using Hierarchical Event Features |
Non-Patent Citations (16)
| Title |
|---|
| Atrey et al., Audio Based Event Detection for Multimedia Surveillance, 2006, IEEE, p. V-813-V816. * |
| Bilenko, et al., "Mining the Search Trails of Surfing Crowds: Identifying Relevant Websites From User Activity", retrieved on Dec. 16, 2009 at <<http://www2008.org/papers/pdf/p51-bilenko.pdf>>, ACM, Proceedings of International World Wide Web Conference (WWW), Beijing, CN, Apr. 2008, pp. 51-60. |
| Bilenko, et al., "Mining the Search Trails of Surfing Crowds: Identifying Relevant Websites From User Activity", retrieved on Dec. 16, 2009 at >, ACM, Proceedings of International World Wide Web Conference (WWW), Beijing, CN, Apr. 2008, pp. 51-60. |
| Chapelle, et al., "A Dynamic Bayesian Network Click Model for Web Search Ranking", retrieved on Dec. 16, 2009 at <<http://olivier.chapelle.cc/pub/DBN—www2009.pdf>>, ACM, Proceedings of International World Wide Web Conference (WWW), Madrid, ES, Apr. 2009, pp. 1-10. |
| Chapelle, et al., "A Dynamic Bayesian Network Click Model for Web Search Ranking", retrieved on Dec. 16, 2009 at >, ACM, Proceedings of International World Wide Web Conference (WWW), Madrid, ES, Apr. 2009, pp. 1-10. |
| Ester, et al., "Accurate and Efficient Crawling for Relevant Websites", retrieved on Dec. 16, 2009 at <<http://www.dbs.ifi.Imu.de/Publikationen/Papers/VLDB2004.pdf>>, Very Large Data Base Endowment, Proceedings of VLDB Conference, Toronto, CA, Sep. 3, 2004, pp. 396-407. |
| Ester, et al., "Accurate and Efficient Crawling for Relevant Websites", retrieved on Dec. 16, 2009 at >, Very Large Data Base Endowment, Proceedings of VLDB Conference, Toronto, CA, Sep. 3, 2004, pp. 396-407. |
| Herbrich, et al., "TrueSkill (tm): A Bayesian Skill Rating System", MIT Press, Advances in Neural Information Processing Systems 20, 2007, pp. 569-576. |
| Minka, et al., "Gates", MIT Press, Advances in Neural Information Processing Systems 22, 2009, pp. 1073-1080. |
| Richardson, et al., "Beyond PageRank: Machine Learning for Static Ranking", ACM, Proceedings of International World Wide Web Conference (WWW), Edinburgh, UK, 2006, pp. 707-715. |
| Stern, et al., "Matchbox: Large Scale Online Bayesian Recommendations", ACM, Proceedings of International World Wide Web Conference (WWW), Madrid, ES, Apr. 2009, pp. 111-120. |
| Zhang, et al., "Fast Computation of Posterior Mode in Multi-Level Hierarchical Models", Proceedings of Conference on Neural Information Processing Systems (NIPS), Vancouver, CA, Dec. 2008, pp. 1913-1920. |
| Zhou, et al., "Learning User Clicks in Web Search", retrieved on Dec. 16, 2009 at <<http://www.aaai.org/Papers/IJCA1/2007/IJCA107-188.pdf>>, ACM, Proceedings of International Joint Conference on Artificial Intelligence (IJCAI), Hyderabad, IN, Jan. 2007, pp. 1162-1167. |
| Zhou, et al., "Learning User Clicks in Web Search", retrieved on Dec. 16, 2009 at >, ACM, Proceedings of International Joint Conference on Artificial Intelligence (IJCAI), Hyderabad, IN, Jan. 2007, pp. 1162-1167. |
| Zhu, et al., "Using Markov Chains for Link Prediction in Adaptive Web Sites", retrieved on Dec. 16, 2009 at <<http://www. springerlink.com/content/yejxyf2pat2Icwv1/fulltext.pdf>>, Springer-Verlag, Lecture Notes on Computer Science vol. 2311, Proceedings of International Conference on Soft-Ware: Computing in an Imperfect World, Belfast, IE, 2002, pp. 60-73. |
| Zhu, et al., "Using Markov Chains for Link Prediction in Adaptive Web Sites", retrieved on Dec. 16, 2009 at >, Springer-Verlag, Lecture Notes on Computer Science vol. 2311, Proceedings of International Conference on Soft-Ware: Computing in an Imperfect World, Belfast, IE, 2002, pp. 60-73. |
Cited By (5)
| Publication number | Priority date | Publication date | Assignee | Title |
|---|---|---|---|---|
| US11947622B2 (en) | 2012-10-25 | 2024-04-02 | The Research Foundation For The State University Of New York | Pattern change discovery between high dimensional data sets |
| US10067596B2 (en) * | 2014-06-04 | 2018-09-04 | International Business Machines Corporation | Touch prediction for visual displays |
| US10162456B2 (en) | 2014-06-04 | 2018-12-25 | International Business Machines Corporation | Touch prediction for visual displays |
| US10203796B2 (en) | 2014-06-04 | 2019-02-12 | International Business Machines Corporation | Touch prediction for visual displays |
| US11397745B1 (en) | 2019-03-26 | 2022-07-26 | Grant Carter Hemingway | System and method for determining rankings, searching, and generating reports of profiles and personal information |
Also Published As
| Publication number | Publication date |
|---|---|
| US8265778B2 (en) | 2012-09-11 |
| US20110313548A1 (en) | 2011-12-22 |
| US20130006900A1 (en) | 2013-01-03 |
Similar Documents
| Publication | Publication Date | Title |
|---|---|---|
| US8831754B2 (en) | Event prediction using hierarchical event features | |
| US9087332B2 (en) | Adaptive targeting for finding look-alike users | |
| Agarwal et al. | fLDA: matrix factorization through latent dirichlet allocation | |
| US8417650B2 (en) | Event prediction in dynamic environments | |
| US20100138451A1 (en) | Techniques for facilitating on-line contextual analysis and advertising | |
| US20110213655A1 (en) | Hybrid contextual advertising and related content analysis and display techniques | |
| US20100257117A1 (en) | Predictions based on analysis of online electronic messages | |
| King et al. | Ensemble learning methods for pay-per-click campaign management | |
| Serrano | Neural networks in big data and Web search | |
| Bonchi et al. | Meme ranking to maximize posts virality in microblogging platforms | |
| Lu et al. | Learning from multi-view multi-way data via structural factorization machines | |
| Kumar et al. | E-commerce website usability analysis using the association rule mining and machine learning algorithm | |
| Yang et al. | Characteristics of Chinese online movie reviews and opinion leadership identification | |
| Aslam et al. | Self voting classification model for online meeting app review sentiment analysis and topic modeling | |
| Dong et al. | Improving sequential recommendation with attribute-augmented graph neural networks | |
| Almasharawi et al. | Estimating user response rate using locality sensitive hashing in search marketing | |
| Chen et al. | Sequential recommendation model for next purchase prediction | |
| Shanahan et al. | Digital advertising: An information scientist’s perspective | |
| Shi et al. | MFPR: A personalized ranking recommendation with multiple feedback | |
| Chen et al. | Controllable Multi-Objective Re-ranking with Policy Hypernetworks | |
| Adeniyi et al. | Personalised news filtering and recommendation system using Chi-square statistics-based K-nearest neighbour (χ 2SB-KNN) model | |
| An et al. | Neural user embedding from browsing events | |
| Tsai et al. | Predicting online news popularity based on machine learning | |
| Ramkissoon et al. | Determining an optimal data classification model for credibility-based fake news detection | |
| Chacko et al. | Customer Lookalike Modeling: A Study of Machine Learning Techniques for Customer Lookalike Modeling |
Legal Events
| Date | Code | Title | Description |
|---|---|---|---|
| STCF | Information on status: patent grant |
Free format text: PATENTED CASE |
|
| AS | Assignment |
Owner name: MICROSOFT TECHNOLOGY LICENSING, LLC, WASHINGTON Free format text: ASSIGNMENT OF ASSIGNORS INTEREST;ASSIGNOR:MICROSOFT CORPORATION;REEL/FRAME:034544/0541 Effective date: 20141014 |
|
| MAFP | Maintenance fee payment |
Free format text: PAYMENT OF MAINTENANCE FEE, 4TH YEAR, LARGE ENTITY (ORIGINAL EVENT CODE: M1551) Year of fee payment: 4 |
|
| MAFP | Maintenance fee payment |
Free format text: PAYMENT OF MAINTENANCE FEE, 8TH YEAR, LARGE ENTITY (ORIGINAL EVENT CODE: M1552); ENTITY STATUS OF PATENT OWNER: LARGE ENTITY Year of fee payment: 8 |