US8799783B2 - System and method for presenting option data using animated 3-dimensional graphical display - Google Patents
System and method for presenting option data using animated 3-dimensional graphical display Download PDFInfo
- Publication number
- US8799783B2 US8799783B2 US13/009,520 US201113009520A US8799783B2 US 8799783 B2 US8799783 B2 US 8799783B2 US 201113009520 A US201113009520 A US 201113009520A US 8799783 B2 US8799783 B2 US 8799783B2
- Authority
- US
- United States
- Prior art keywords
- option
- data
- computerized system
- filtered
- option data
- Prior art date
- Legal status (The legal status is an assumption and is not a legal conclusion. Google has not performed a legal analysis and makes no representation as to the accuracy of the status listed.)
- Active, expires
Links
Images


Classifications
-
- G—PHYSICS
- G06—COMPUTING; CALCULATING OR COUNTING
- G06Q—INFORMATION AND COMMUNICATION TECHNOLOGY [ICT] SPECIALLY ADAPTED FOR ADMINISTRATIVE, COMMERCIAL, FINANCIAL, MANAGERIAL OR SUPERVISORY PURPOSES; SYSTEMS OR METHODS SPECIALLY ADAPTED FOR ADMINISTRATIVE, COMMERCIAL, FINANCIAL, MANAGERIAL OR SUPERVISORY PURPOSES, NOT OTHERWISE PROVIDED FOR
- G06Q40/00—Finance; Insurance; Tax strategies; Processing of corporate or income taxes
- G06Q40/04—Trading; Exchange, e.g. stocks, commodities, derivatives or currency exchange
Definitions
- the present invention relates generally to financial data analysis and presentation and, more specifically, to a system and method for presenting option data to a trader using graphical representation.
- Option trading is one of the most complex and dynamic trading areas.
- Option traders must create and execute various trading strategies based on risk analysis and other pertinent information.
- options traders must quickly identify potentially profitable trades based on the snapshot of current market conditions as well as historical data and make quick buy/sell decisions during active trading sessions.
- the amount of data that needs to be analyzed by a trader in order to make a profitable trade is very large. Unfortunately, most of these data is available in unstructured form and cannot be easily comprehended by a human within a short period of time.
- the inventive methodology is directed to methods and systems that substantially obviate one or more of the above and other problems associated with conventional techniques for displaying option data to traders.
- a computerized system incorporating a communication interface configured to couple the computerized system to a network; a processing unit configured to obtain option data, to filter the obtained option data in accordance with filtering criteria, and to generate graphical representation of the filtered option data for display to a user; and a storage unit.
- the processing unit obtains the option data from a remote data provider using the communication interface or causes the option data to be retrieved from the storage unit and causes the graphical representation of the filtered option data to be displayed to the user.
- the graphical representation of the filtered option data includes interposed volatility data for multiple option contracts; and the filtering criteria involves at least selecting out of the money options and excluding options with no bids.
- a computer-implemented method involving coupling, using a communication interface, the computerized system to a network; using a processing unit to obtain option data, to filter the option data in accordance with filtering criteria, and to generate graphical representation of the filtered option data for display to a user; allocating a storage resource in a storage unit, wherein the option data is obtained from a remote data provider via the communication interface or retrieved from the storage unit; and causing the graphical representation of the filtered option data to be displayed to the user.
- the graphical representation of the filtered option data includes interposed volatility data for multiple option contracts and the filtering criteria involves at least selecting out of the money options and excluding options with no bids.
- a computer-readable medium embodying a set of instructions, which, when executed by one or more processors, cause the one or more processors to execute a method involving coupling, using a communication interface, the computerized system to a network; using a processing unit to obtain option data, to filter the option data in accordance with filtering criteria, and to generate graphical representation of the filtered option data for display to a user; allocating a storage resource in a storage unit, wherein the option data is obtained from a remote data provider via the communication interface or retrieved from the storage unit; and causing the graphical representation of the filtered option data to be displayed to the user.
- the graphical representation of the filtered option data includes interposed volatility data for multiple option contracts and the filtering criteria involves at least selecting out of the money options and excluding options with no bids.
- FIG. 1A illustrates a conventional option volatility skew chart for a single option contract.
- FIG. 1B illustrates an exemplary skew chart processed in accordance with an embodiment of the inventive methodology.
- FIG. 2 illustrates an exemplary option volatility skew chart generated by means of a user interface in accordance with one or more embodiments of the inventive concept.
- FIG. 3 illustrates another exemplary option volatility skew chart generated by means of a user interface in accordance with one or more embodiments of the inventive concept.
- FIG. 4 illustrates an exemplary embodiment of system architecture on which various embodiments of the inventive methodology may be deployed.
- FIG. 5 illustrates an exemplary embodiment of a computer platform upon which the inventive system may be implemented.
- a computerized system and associated method as well as a corresponding computer programming product for generating an enhanced graphical interface that offers improvements to conventional systems for facilitating trading of options on options markets.
- the improvements provided by one or more embodiments of the invention include enabling faster decisions by the trader during a trading session, increased ability to identify risks and opportunities in the market, faster analysis of comparative options skews and new ways to analyze option premiums in a faster, more beneficial way over the traditional methods of option data analysis and presentation.
- the pertinent option data is displayed to the trader in a real-time, historic and time-projection three-dimensional graphs, which provide the option trader with a means to quickly uncover potential trading opportunity, speed up trade executions and quickly identify potential risks.
- the inventive system accesses the historic as well as real-time option data and performs analysis of the received data in order to display the relevant information to the option trader in an informative, easily comprehendible format.
- an inventive real time view of the option data alerts the trader to the current skew, for options in the same month, as well as in comparison with all other options in the option chain.
- analysis and presentation of the historical data is important.
- the chief difficulty that many option traders face in analyzing historical data is that the amount of the raw historical option data is very large and this data is unstructured. For example, option data for one underlying issue for a two-year period can easily exceed 50,000 records of historical data values.
- conventional two-dimensional stock charts having about 500 data points in a two-year historical time period, there is no easy way to get useful information out of such an extensive options dataset, simply because of its sheer size.
- the inventive system juxtaposes filtered and analyzed option data in a three-dimensional dynamic graph, which is displayed, for example, on a computer display terminal to the option trader.
- the option trader views the selectively filtered option data presented by the embodiments of the inventive system in a way that reveals trends, risk and pricing over time. Further advantage of various embodiments of the inventive technique comes from the fact that the option trader gradually learns to recognize the significance of the various shapes and patterns of the displayed information and use them to execute profitable trades.
- the inventive system is capable of sequentially displaying (playing) hundreds of images of graphical option data representation to create an animation of dynamics of options volatility over time.
- a trader can quickly recognize various market opportunities.
- Certain patterns signify lower risk and opportunity over other patterns, much like the Japanese candle charts have recognizable patterns that stock traders learn.
- FIG. 1A illustrates a conventional option volatility skew chart 100 .
- the skew chart 100 includes two curves: curve 101 corresponds to put options and curve 102 corresponds to call options.
- the variable on the horizontal (X) axis is an option strike price, while the variable on the vertical (Y) axis is the implied volatility.
- the option implied volatility (IV) is the measure of the volatility of the underlying implied by the market price of the option. This implied volatility is calculated based on a particular option pricing model. In other words, it is the volatility that, when used in a particular pricing model, yields a theoretical value for the option price equal to the current market price of that option.
- One exemplary option pricing model widely used for calculating implied volatility is Black-Scholes pricing model well known to persons of ordinary skill in the art. However, it should be noted that the inventive concept is not limited to the Black-Scholes pricing model for calculating volatility values and any other suitable model now known or developed in the future may be used for that purpose. It should be noted that the aforesaid implied volatility is often used as a measure of the true option value.
- the volatility curve 101 on the chart 100 is formed by a connected string of data points, and clearly shows that the implied volatility is “skewed” towards the out of money put options corresponding to the strike price values in the left portion of the chart 100 .
- the implied volatility values near the strike prices close to the current value of the underlying (at the money strike prices) is often smaller that the implied volatility for out of the money puts (at the left of the chart 100 ) and out of the money calls (at the right of the chart 100 ).
- the volatility curve 101 as a function of the strike price has a characteristic shape of a “smile” and is, therefore, called a “volatility smile”.
- FIG. 1B illustrates an exemplary skew chart 104 processed in accordance with an embodiment of the inventive methodology.
- the skew chart 104 includes a single curve 103 , which is generated using data points corresponding to only out of the money (OTM) option data (both OTM puts and calls).
- the data shown in the skew chart 103 has been filtered in accordance with a filtering criteria which excludes options with no bids.
- FIG. 2 illustrates an exemplary option volatility skew chart 200 generated by means of a user interface 210 in accordance with one or more embodiments of the inventive concept.
- the chart 200 illustrated in FIG. 2 provides the trader with multiple implied volatility curves 201 , 202 , 203 and 204 drawn on the same chart 200 , which are formed by strings of data points corresponding to multiple option contracts for the same underlying with different option expiration dates.
- having multiple volatility curves 201 , 202 , 203 and 204 on the same chart 200 provides the trader with the information on the dynamics of the implied volatility changes with time.
- the volatility curves corresponding to different option contracts are color-coded for ease of differentiation. In another embodiment, these volatility curves are drawn using distinct line styles.
- the system receives a selection of the option contracts to be displayed on the chart from the trader using an option contact selection interface 205 , wherein the trader may select or unselect appropriate option contracts for display on the volatility chart 200 by clicking on the appropriate option contract symbol.
- the option data displayed on the chart 200 may be filtered using one or more filtering criteria specified by the trader.
- the trader is provided with a data filter criteria selection interface 206 , which is designed to enable the trader to select filtering criteria for the option data displayed on the volatility chart 200 .
- the trader's section made using the filter criteria selection interface 206 is received by the inventive system and the corresponding chart 200 is appropriately updated to reflect the selected filtering criteria.
- the trader may use the data filter criteria selection interface 206 to select option data for all strike prices or for a subset of strike prices. In one exemplary embodiment, the trader may select to view volatility data for either 10%, 25% or 50% out of the money options. In another embodiment, in lieu of, or in addition to, selecting the option contracts to be displayed using the option contact selection interface 205 , the trader may select to view all contracts expiring within a predetermined future period, such as next six months, or all available contracts. In one or more embodiments of the invention, the data filter criteria selection interface 206 also enables the trader to select the option contracts with all premium values or specific premium values.
- the filtering criteria may also exclude options with no bids.
- the filtering criteria used in generating the data points used in creating the skew chart selects for inclusion into the skew chart only out of the money (OTM) options and excludes options with no bibs.
- FIG. 3 illustrates another exemplary option volatility skew chart 300 generated by means of a user interface 301 in accordance with one or more embodiments of the inventive concept.
- the skew chart illustrated in FIG. 3 is three-dimensional, with the expiration date for each option contract illustrated in the chart being marked along the third, (Z) axis of the chart 300 .
- the aforesaid Z axis may show either calendar days or trading days.
- the data points on the different volatility curves corresponding to the same strike price are connected using lines 320 .
- the curves in FIG. 3 corresponding to different option contracts may be color-coded for the ease of visual comprehension thereof by the trader.
- the inventive used interface is provided with skew chart rotation interface operable to receive from the trader a command to rotate the skew chart in an appropriate manner.
- the system is operable to detect an action by the trader, wherein the trader drags the mouse cursor in an appropriate direction. The system detects the mouse drag direction and/or distance provided by the trader and appropriately rotates the skew chart in three dimensions displaying the resulting view to the trader.
- one or more embodiments of the inventive system are configured to access a database, flat data files, memory storage area, or any other data container with option data, to issue a query to said database or search other data storage using the criteria specified by the trader using the inventive user interface 301 , to retrieve the corresponding data from the database or other data storage, to analyze the retrieved data, to generate the skew chart representation based on the retrieved data, and to display the generated representation to the trader.
- the displayed data (implied volatility) is calculated, and can be pre-calculated and stored on the server, the client, or dynamically calculated using the display software or hardware.
- the inventive user interface is operable to provide the trader with a representation on how the skew chart has changed in the past.
- the system plays a movie representing the historical changes in the skew chart over the predetermined time period.
- each frame in the aforesaid movie represents a skew chart as it looked on a specific day during the aforesaid time period.
- the inventive interface 3 is provided with an interface 307 for receiving a selection of the aforesaid time period as well as play/pause 308 , forward 309 and rewind 310 buttons, which are used by the trader to control the display of the aforesaid skew chart movie.
- the inventive interface may also include a scale interface 311 for receiving a selection of specific day from the trader. Based on the trader's day selection performed using the scale interface 311 , the embodiment of the inventive system is operable to display a historical skew chart 300 , as it existed on the selected day. Two additional interface buttons 312 and 313 enable the trader to select the next or the previous day, respectively, and to view the updated skew chart for the newly selected day. For each selected day, the embodiments of the inventive user interface enable the trader to alter the various skew chart parameters using the interfaces described above.
- one or more embodiments of the inventive system are configured to access a database, flat data files, or any other data storage with historical option data, to issue a query to said database or search other data using the criteria specified by the trader using the inventive user interface, to retrieve the corresponding data from the database or other data storage, to analyze the retrieved data, to generate the historical skew chart representation based on the retrieved data, and to display the generated representation to the trader.
- the described skew chart generation interface and the associated tools and features provide the trader with representation of dynamics of the option volatility data in a very informative and concise form.
- the inventive system may automatically detect put option and call option disparity and alert the trader of the detected disparity.
- the system additionally provides a user interface for fast, one-click submission of option trade orders to enable the option trader to quickly react to the opportunities discovered using the inventive option data presentation methodology.
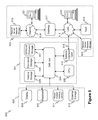
- FIG. 4 illustrates an exemplary embodiment of system architecture 400 on which various embodiments of the inventive methodology may be deployed.
- the exemplary architecture illustrated in FIG. 4 incorporates a computer/server platform 401 on which a web server module 402 and data processing module 403 are deployed.
- the data processing module receives the historical option data from a database 404 , which may be deployed locally within in the proximity the same computer/server system 401 or accessed remotely using a network interface of the computer/server system 401 .
- the data processing module 403 also receives the real time option data provided by the remote option data service 405 , which it accesses using network interface of the computer/server system 401 .
- the trader accesses the inventive system using a client computer system 406 via network link 407 .
- the client computer system establishes a network connection with the web server 402 using a network communication protocol, such as HTTP.
- a network communication protocol such as HTTP.
- the web server 402 furnishes a markup language code, such as HTML code, to the client 406 , which generates the inventive charts and associated interfaces in the trader's browser window (not shown).
- Trader's commands are sent from the trader's web browser, or installable desktop software application deployed on the client 406 to the web server 402 and transmitted to the data processing module 403 .
- the data processing module 403 uses the historical as well as real-time option data to generate the skew charts based on the commands and selections received from the trader.
- the skew charts are then transmitted to the web server 402 , which furnishes them back to the trader's client computer 406 via HTTP, whereupon the generated charts are displayed to the trader using a web browser (not shown).
- the skew charts are generated on the client computer 406 using intermediate data received from the data processing module 403 via the web server 402 .
- the charts are generated on the client 406 using a client-side application (not shown), such as JAVA applet executing on the client's web browser.
- the skew charts are generated entirely on the client computer 406 using a client desktop application installed on the client computer 406 , which is configured to receive options data from a remote options data service accessible through a network and which is also configured to perform all the processing necessary for creating and displaying skew charts locally on the client computer 406 .
- FIG. 5 is a block diagram that illustrates an embodiment of a computer/server system 500 upon which an embodiment of the inventive methodology may be implemented.
- the system 500 includes a computer or server platform 501 , peripheral devices 502 and network resources 503 .
- the computer platform 501 may include a data bus 504 or other communication mechanism for communicating information across and among various parts of the computer platform 501 , and a processor 505 coupled with bus 504 for processing information and performing other computational and control tasks.
- Computer platform 501 also includes a volatile storage 506 , such as a random access memory (RAM) or other dynamic storage device, coupled to bus 504 for storing various information as well as instructions to be executed by processor 505 .
- the volatile storage 506 also may be used for storing temporary variables or other intermediate information during execution of instructions by processor 505 .
- Computer platform 501 may further include a read only memory (ROM or EPROM) 507 or other static storage device coupled to bus 504 for storing static information and instructions for processor 505 , such as basic input-output system (BIOS), as well as various system configuration parameters.
- ROM or EPROM read only memory
- a persistent storage device 508 such as a magnetic disk, optical disk, or solid-state flash memory device is provided and coupled to bus 504 for storing information and instructions.
- Computer platform 401 may be coupled via bus 504 to a display 509 , such as a cathode ray tube (CRT), plasma display, or a liquid crystal display (LCD), for displaying information to a system administrator or user of the computer platform 501 .
- a display 509 such as a cathode ray tube (CRT), plasma display, or a liquid crystal display (LCD), for displaying information to a system administrator or user of the computer platform 501 .
- An input device 510 is coupled to bus 504 for communicating information and command selections to processor 505 .
- cursor control device 511 is Another type of user input device.
- cursor control device 511 such as a mouse, a trackball, or cursor direction keys for communicating direction information and command selections to processor 505 and for controlling cursor movement on display 509 .
- This input device typically has two degrees of freedom in two axes, a first axis (e.g., x) and a second axis (e.g.,
- An external storage device 512 may be coupled to the computer platform 501 via bus 504 to provide an extra or removable storage capacity for the computer platform 501 .
- the external removable storage device 512 may be used to facilitate exchange of data with other computer systems.
- the invention is related to the use of computer system 401 for implementing the techniques described herein.
- the inventive system may reside on a machine such as computer platform 501 .
- the techniques described herein are performed by computer system 501 in response to processor 505 executing one or more sequences of one or more instructions contained in the volatile memory 506 .
- Such instructions may be read into volatile memory 506 from another computer-readable medium, such as persistent storage device 508 .
- Execution of the sequences of instructions contained in the volatile memory 506 causes processor 505 to perform the process steps described herein.
- hard-wired circuitry may be used in place of or in combination with software instructions to implement the invention.
- embodiments of the invention are not limited to any specific combination of hardware circuitry and software.
- Non-volatile media includes, for example, optical or magnetic disks, such as storage device 508 .
- Volatile media includes dynamic memory, such as volatile storage 506 .
- Computer-readable media include, for example, a floppy disk, a flexible disk, hard disk, magnetic tape, or any other magnetic medium, a CD-ROM, any other optical medium, punchcards, papertape, any other physical medium with patterns of holes, a RAM, a PROM, an EPROM, a FLASH-EPROM, a flash drive, a memory card, any other memory chip or cartridge, or any other medium from which a computer can read.
- Various forms of computer readable media may be involved in carrying one or more sequences of one or more instructions to processor 505 for execution.
- the instructions may initially be carried on a magnetic disk from a remote computer.
- a remote computer can load the instructions into its dynamic memory and send the instructions over a telephone line using a modem.
- a modem local to computer system can receive the data on the telephone line and use an infra-red transmitter to convert the data to an infra-red signal.
- An infra-red detector can receive the data carried in the infra-red signal and appropriate circuitry can place the data on the data bus 504 .
- the bus 504 carries the data to the volatile storage 506 , from which processor 505 retrieves and executes the instructions.
- the instructions received by the volatile memory 506 may optionally be stored on persistent storage device 408 either before or after execution by processor 505 .
- the instructions may also be downloaded into the computer platform 501 via Internet using a variety of network data communication protocols well known in the art.
- the computer platform 501 also includes a communication interface, such as network interface card 513 coupled to the data bus 504 .
- Communication interface 513 provides a two-way data communication coupling to a network link 515 that is coupled to a local network 515 .
- communication interface 513 may be an integrated services digital network (ISDN) card or a modem to provide a data communication connection to a corresponding type of telephone line.
- ISDN integrated services digital network
- communication interface 513 may be a local area network interface card (LAN NIC) to provide a data communication connection to a compatible LAN.
- Wireless links such as well-known 802.11a, 802.11b, 802.11g and Bluetooth may also used for network implementation.
- communication interface 513 sends and receives electrical, electromagnetic or optical signals that carry digital data streams representing various types of information.
- Network interface 513 typically provides data communication through one or more networks to other network resources.
- network link 515 may provide a connection through local network 515 to a host computer 516 , or a network storage/server 517 .
- the network link 513 may connect through gateway/firewall 517 to the wide-area or global network 518 , such as an Internet.
- the computer platform 501 can access network resources located anywhere on the Internet 518 , such as a remote network storage/server 519 .
- the computer platform 501 may also be accessed by clients located anywhere on the local area network 515 and/or the Internet 518 .
- the network clients 520 and 521 may themselves be implemented based on the computer platform similar to the platform 501 .
- Local network 515 and the Internet 518 both use electrical, electromagnetic or optical signals that carry digital data streams.
- Computer platform 501 can send messages and receive data, including program code, through the variety of network(s) including Internet 518 and LAN 515 , network link 515 and communication interface 513 .
- network(s) including Internet 518 and LAN 515 , network link 515 and communication interface 513 .
- the system 501 when the system 501 acts as a network server, it might transmit a requested code or data for an application program running on client(s) 520 and/or 521 through Internet 518 , gateway/firewall 517 , local area network 515 and communication interface 513 . Similarly, it may receive code from other network resources.
- the received code may be executed by processor 405 as it is received, and/or stored in persistent or volatile storage devices 408 and 406 , respectively, or other non-volatile storage for later execution.
- the database 404 for storing option data used by the inventive system may be deployed either within the computer platform 501 or on a remote server.
- the option data would be stored on one of the storage devices of the system, such as data storage devices 506 , 507 and/or 512 .
- the inventive system accesses the historical and/or real-time option data using the communication interface 513 as well as network links 515 and/or 518 from a network storage/server 517 .
Abstract
Description
Claims (22)
Priority Applications (1)
| Application Number | Priority Date | Filing Date | Title |
|---|---|---|---|
| US13/009,520 US8799783B2 (en) | 2010-01-19 | 2011-01-19 | System and method for presenting option data using animated 3-dimensional graphical display |
Applications Claiming Priority (2)
| Application Number | Priority Date | Filing Date | Title |
|---|---|---|---|
| US29642010P | 2010-01-19 | 2010-01-19 | |
| US13/009,520 US8799783B2 (en) | 2010-01-19 | 2011-01-19 | System and method for presenting option data using animated 3-dimensional graphical display |
Publications (2)
| Publication Number | Publication Date |
|---|---|
| US20110179360A1 US20110179360A1 (en) | 2011-07-21 |
| US8799783B2 true US8799783B2 (en) | 2014-08-05 |
Family
ID=44278462
Family Applications (1)
| Application Number | Title | Priority Date | Filing Date |
|---|---|---|---|
| US13/009,520 Active 2032-02-10 US8799783B2 (en) | 2010-01-19 | 2011-01-19 | System and method for presenting option data using animated 3-dimensional graphical display |
Country Status (1)
| Country | Link |
|---|---|
| US (1) | US8799783B2 (en) |
Families Citing this family (3)
| Publication number | Priority date | Publication date | Assignee | Title |
|---|---|---|---|---|
| US10803522B2 (en) * | 2012-11-30 | 2020-10-13 | Montal Research Ltd | Computing system that generates graphical displays of stock options trading data |
| US9117239B2 (en) * | 2013-03-13 | 2015-08-25 | Reno Acquisitions, Llc | Method and system for generating a data grid interface to monitor and recommend relevant products |
| US20150379641A1 (en) * | 2014-06-27 | 2015-12-31 | Chicago Mercantile Exchange Inc. | Implied Volatility Skew Futures Product |
Citations (12)
| Publication number | Priority date | Publication date | Assignee | Title |
|---|---|---|---|---|
| US4988981A (en) * | 1987-03-17 | 1991-01-29 | Vpl Research, Inc. | Computer data entry and manipulation apparatus and method |
| US5524187A (en) * | 1991-03-25 | 1996-06-04 | The Trustees Of Columbia University | Worlds-within-worlds nested display and interaction system and method |
| US6049783A (en) * | 1997-08-08 | 2000-04-11 | Power Financial Group, Inc. | Interactive internet analysis method |
| US20010056398A1 (en) * | 2000-04-14 | 2001-12-27 | E-Vantage International, Inc. | Method and system for delivering foreign exchange risk management advisory solutions to a designated market |
| US20030028459A1 (en) * | 2001-05-03 | 2003-02-06 | Hillel Rosendorf Charles | Securities analysis method and system |
| US7165036B2 (en) * | 2001-10-23 | 2007-01-16 | Electronic Data Systems Corporation | System and method for managing a procurement process |
| US7219034B2 (en) * | 2001-09-13 | 2007-05-15 | Opnet Technologies, Inc. | System and methods for display of time-series data distribution |
| US20070156479A1 (en) * | 2005-11-02 | 2007-07-05 | Long Erik T | Multivariate statistical forecasting system, method and software |
| US20080183639A1 (en) * | 2005-04-14 | 2008-07-31 | Disalvo Dean F | System and Method for Securities Liquidity Flow Tracking, Display and Trading |
| US20090125447A1 (en) * | 2007-11-09 | 2009-05-14 | Thomson Financial Llc | Method, system and machine readable program for mitigating effects of data spikes |
| US20090278848A1 (en) * | 2008-05-12 | 2009-11-12 | Microsoft Corporation | Drawing familiar graphs while system determines suitable form |
| US20110066933A1 (en) * | 2009-09-02 | 2011-03-17 | Ludwig Lester F | Value-driven visualization primitives for spreadsheets, tabular data, and advanced spreadsheet visualization |
-
2011
- 2011-01-19 US US13/009,520 patent/US8799783B2/en active Active
Patent Citations (16)
| Publication number | Priority date | Publication date | Assignee | Title |
|---|---|---|---|---|
| US4988981A (en) * | 1987-03-17 | 1991-01-29 | Vpl Research, Inc. | Computer data entry and manipulation apparatus and method |
| US4988981B1 (en) * | 1987-03-17 | 1999-05-18 | Vpl Newco Inc | Computer data entry and manipulation apparatus and method |
| US5524187A (en) * | 1991-03-25 | 1996-06-04 | The Trustees Of Columbia University | Worlds-within-worlds nested display and interaction system and method |
| US6049783A (en) * | 1997-08-08 | 2000-04-11 | Power Financial Group, Inc. | Interactive internet analysis method |
| US20010056398A1 (en) * | 2000-04-14 | 2001-12-27 | E-Vantage International, Inc. | Method and system for delivering foreign exchange risk management advisory solutions to a designated market |
| US7801788B2 (en) * | 2001-05-03 | 2010-09-21 | Charles Hillel Rosendorf | Securities analysis method and system |
| US20030028459A1 (en) * | 2001-05-03 | 2003-02-06 | Hillel Rosendorf Charles | Securities analysis method and system |
| US7219034B2 (en) * | 2001-09-13 | 2007-05-15 | Opnet Technologies, Inc. | System and methods for display of time-series data distribution |
| US7165036B2 (en) * | 2001-10-23 | 2007-01-16 | Electronic Data Systems Corporation | System and method for managing a procurement process |
| US20080183639A1 (en) * | 2005-04-14 | 2008-07-31 | Disalvo Dean F | System and Method for Securities Liquidity Flow Tracking, Display and Trading |
| US20070156479A1 (en) * | 2005-11-02 | 2007-07-05 | Long Erik T | Multivariate statistical forecasting system, method and software |
| US20090125447A1 (en) * | 2007-11-09 | 2009-05-14 | Thomson Financial Llc | Method, system and machine readable program for mitigating effects of data spikes |
| US20090278848A1 (en) * | 2008-05-12 | 2009-11-12 | Microsoft Corporation | Drawing familiar graphs while system determines suitable form |
| US20110066933A1 (en) * | 2009-09-02 | 2011-03-17 | Ludwig Lester F | Value-driven visualization primitives for spreadsheets, tabular data, and advanced spreadsheet visualization |
| US20130132811A1 (en) * | 2009-09-02 | 2013-05-23 | Lester F. Ludwig | Graphical Surface Rendering Data Visualization Tools and Primitives for Tabular Data and Spreadsheets |
| US20130174004A1 (en) * | 2009-09-02 | 2013-07-04 | Lester F. Ludwig | Graphical 3D Curve Rendering Data Visualization Tools and Primitives for Tabular Data and Spreadsheets |
Also Published As
| Publication number | Publication date |
|---|---|
| US20110179360A1 (en) | 2011-07-21 |
Similar Documents
| Publication | Publication Date | Title |
|---|---|---|
| US8412620B1 (en) | Methods and systems related to trading engines | |
| US20220012809A1 (en) | Data structures for transfer and processing of financial data | |
| US20050256797A1 (en) | Method and apparatus for user-interactive financial instrument trading | |
| US20210350465A1 (en) | Processing data inputs from alternative sources to generate a predictive signal | |
| US20150332396A1 (en) | Options Trading Interface to Facilitate Improved Trading Decisions | |
| US10728125B2 (en) | State generation system for a sequential stage application | |
| US8650108B1 (en) | User interface for investment decisioning process model | |
| US11620706B2 (en) | Trading platforms using market sentiment and dynamic risk assessment profiles | |
| US8374940B1 (en) | Wealth allocation analysis tools | |
| US20100218115A1 (en) | Enhanced user interface for currency trading | |
| US8799783B2 (en) | System and method for presenting option data using animated 3-dimensional graphical display | |
| US20020198811A1 (en) | System and method for monitoring the status of analyses performed on a portfolio of financial instruments | |
| US20190019247A1 (en) | System and method for creating and managing a charging condition matrix | |
| US8606674B1 (en) | Income analysis tools for wealth management | |
| US9852470B1 (en) | Time period analysis tools for wealth management transactions | |
| AU2011226957A1 (en) | Systems and methods for providing share assessment data with plain language interpretation | |
| US7305353B1 (en) | System and method for forecasting tax effects of financial transactions | |
| KR101097130B1 (en) | Auto-Investment System using Computer Network and method thereof | |
| US20130066801A1 (en) | Option spread midrange processing | |
| US20140108215A1 (en) | System and methods for trading | |
| US9665908B1 (en) | Net worth analysis tools | |
| US20140289091A1 (en) | Method and System for Generating and Operating Hybrid Markets and User-Defined Marketplaces | |
| US20140297489A1 (en) | Systems and methods for providing share assessment data with cash flow analysis | |
| US20230122877A1 (en) | Smart Decentralized Platform for Settlement of Delisted Stocks | |
| US20150248728A1 (en) | System and methods for integrating information to facilitate composing trades |
Legal Events
| Date | Code | Title | Description |
|---|---|---|---|
| AS | Assignment |
Owner name: LIVEVOL INC., CALIFORNIA Free format text: ASSIGNMENT OF ASSIGNORS INTEREST;ASSIGNORS:HORWATH, RON ALEX;CHOY, SUNG-GIE STEFEN;REEL/FRAME:025662/0784 Effective date: 20110119 |
|
| AS | Assignment |
Owner name: FIRST BANK AND TRUST, TRUSTEE FBO RONALD CHEZ IRA, Free format text: SECURITY AGREEMENT;ASSIGNOR:LIVEVOL, INC.;REEL/FRAME:029817/0706 Effective date: 20130130 Owner name: RONALD CHEZ, AGENT FOR HOLDERS OF SERIES 1 SECURED Free format text: SECURITY AGREEMENT;ASSIGNOR:LIVEVOL, INC.;REEL/FRAME:029817/0510 Effective date: 20130113 |
|
| STCF | Information on status: patent grant |
Free format text: PATENTED CASE |
|
| AS | Assignment |
Owner name: LIVEVOL, INC., CALIFORNIA Free format text: RELEASE BY SECURED PARTY;ASSIGNOR:FIRST BANK & TRUST, TRUSTEE FOR THE BENEFIT OF RONALD L. CHEZ IRA;REEL/FRAME:036510/0084 Effective date: 20150902 Owner name: LIVEVOL, INC., CALIFORNIA Free format text: RELEASE BY SECURED PARTY;ASSIGNOR:RONALD CHEZ, AGENT FOR HOLDERS OF SERIES 1 SECURED NOTES;REEL/FRAME:036510/0342 Effective date: 20150902 |
|
| AS | Assignment |
Owner name: CBOE IV, LLC, ILLINOIS Free format text: ASSIGNMENT OF ASSIGNORS INTEREST;ASSIGNOR:LIVEVOL, INC.;REEL/FRAME:040200/0226 Effective date: 20150807 |
|
| AS | Assignment |
Owner name: CBOE IV, LLC, ILLINOIS Free format text: ASSIGNMENT OF ASSIGNORS INTEREST;ASSIGNOR:LIVEVOL, INC.;REEL/FRAME:040255/0311 Effective date: 20150807 Owner name: CBOE LIVEVOL, LLC, ILLINOIS Free format text: CHANGE OF NAME;ASSIGNOR:CBOE IV, LLC;REEL/FRAME:040578/0307 Effective date: 20150828 |
|
| AS | Assignment |
Owner name: CHICAGO BOARD OPTIONS EXCHANGE, INCORPORATED, ILLINOIS Free format text: CHANGE OF NAME;ASSIGNOR:CHICAGO BOARD OPTIONS EXCHANGE, INCORPORATED;REEL/FRAME:044741/0138 Effective date: 20171016 Owner name: CHICAGO BOARD OPTIONS EXCHANGE, INCORPORATED, ILLI Free format text: CHANGE OF NAME;ASSIGNOR:CHICAGO BOARD OPTIONS EXCHANGE, INCORPORATED;REEL/FRAME:044741/0138 Effective date: 20171016 Owner name: CBOE EXCHANGE, INC., ILLINOIS Free format text: CHANGE OF NAME;ASSIGNOR:CHICAGO BOARD OPTIONS EXCHANGE, INCORPORATED;REEL/FRAME:044742/0576 Effective date: 20171016 |
|
| FEPP | Fee payment procedure |
Free format text: ENTITY STATUS SET TO UNDISCOUNTED (ORIGINAL EVENT CODE: BIG.) |
|
| FEPP | Fee payment procedure |
Free format text: SURCHARGE FOR LATE PAYMENT, LARGE ENTITY (ORIGINAL EVENT CODE: M1554) |
|
| MAFP | Maintenance fee payment |
Free format text: PAYMENT OF MAINTENANCE FEE, 4TH YEAR, LARGE ENTITY (ORIGINAL EVENT CODE: M1551) Year of fee payment: 4 |
|
| MAFP | Maintenance fee payment |
Free format text: PAYMENT OF MAINTENANCE FEE, 8TH YEAR, LARGE ENTITY (ORIGINAL EVENT CODE: M1552); ENTITY STATUS OF PATENT OWNER: LARGE ENTITY Year of fee payment: 8 |