US8644607B1 - Method and apparatus for image processing - Google Patents
Method and apparatus for image processing Download PDFInfo
- Publication number
- US8644607B1 US8644607B1 US13/801,027 US201313801027A US8644607B1 US 8644607 B1 US8644607 B1 US 8644607B1 US 201313801027 A US201313801027 A US 201313801027A US 8644607 B1 US8644607 B1 US 8644607B1
- Authority
- US
- United States
- Prior art keywords
- image
- sub
- signature
- luminance
- images
- Prior art date
- Legal status (The legal status is an assumption and is not a legal conclusion. Google has not performed a legal analysis and makes no representation as to the accuracy of the status listed.)
- Active
Links
- 238000000034 method Methods 0.000 title claims abstract description 78
- 238000012545 processing Methods 0.000 title claims abstract description 16
- 239000013598 vector Substances 0.000 claims description 9
- 238000006243 chemical reaction Methods 0.000 description 5
- 230000001419 dependent effect Effects 0.000 description 3
- 238000004891 communication Methods 0.000 description 2
- 238000003672 processing method Methods 0.000 description 2
- 239000011435 rock Substances 0.000 description 2
- 238000010561 standard procedure Methods 0.000 description 2
- 238000013179 statistical model Methods 0.000 description 2
- 238000013519 translation Methods 0.000 description 2
- 241000526960 Amaranthus acanthochiton Species 0.000 description 1
- 241000272525 Anas platyrhynchos Species 0.000 description 1
- 101100188555 Arabidopsis thaliana OCT6 gene Proteins 0.000 description 1
- 241000023320 Luma <angiosperm> Species 0.000 description 1
- 241000282376 Panthera tigris Species 0.000 description 1
- 238000004364 calculation method Methods 0.000 description 1
- 230000007423 decrease Effects 0.000 description 1
- 238000001514 detection method Methods 0.000 description 1
- 238000005516 engineering process Methods 0.000 description 1
- 238000002474 experimental method Methods 0.000 description 1
- 230000003993 interaction Effects 0.000 description 1
- 238000012804 iterative process Methods 0.000 description 1
- 238000013178 mathematical model Methods 0.000 description 1
- OSWPMRLSEDHDFF-UHFFFAOYSA-N methyl salicylate Chemical compound COC(=O)C1=CC=CC=C1O OSWPMRLSEDHDFF-UHFFFAOYSA-N 0.000 description 1
- 238000012986 modification Methods 0.000 description 1
- 230000004048 modification Effects 0.000 description 1
- 230000002093 peripheral effect Effects 0.000 description 1
- 238000007670 refining Methods 0.000 description 1
- 238000005070 sampling Methods 0.000 description 1
- 230000011218 segmentation Effects 0.000 description 1
- 230000003068 static effect Effects 0.000 description 1
- XLYOFNOQVPJJNP-UHFFFAOYSA-N water Substances O XLYOFNOQVPJJNP-UHFFFAOYSA-N 0.000 description 1
Images


Classifications
-
- G—PHYSICS
- G06—COMPUTING; CALCULATING OR COUNTING
- G06F—ELECTRIC DIGITAL DATA PROCESSING
- G06F16/00—Information retrieval; Database structures therefor; File system structures therefor
- G06F16/50—Information retrieval; Database structures therefor; File system structures therefor of still image data
- G06F16/58—Retrieval characterised by using metadata, e.g. metadata not derived from the content or metadata generated manually
- G06F16/583—Retrieval characterised by using metadata, e.g. metadata not derived from the content or metadata generated manually using metadata automatically derived from the content
- G06F16/5862—Retrieval characterised by using metadata, e.g. metadata not derived from the content or metadata generated manually using metadata automatically derived from the content using texture
-
- G—PHYSICS
- G06—COMPUTING; CALCULATING OR COUNTING
- G06V—IMAGE OR VIDEO RECOGNITION OR UNDERSTANDING
- G06V10/00—Arrangements for image or video recognition or understanding
- G06V10/40—Extraction of image or video features
-
- G—PHYSICS
- G06—COMPUTING; CALCULATING OR COUNTING
- G06V—IMAGE OR VIDEO RECOGNITION OR UNDERSTANDING
- G06V10/00—Arrangements for image or video recognition or understanding
- G06V10/40—Extraction of image or video features
- G06V10/46—Descriptors for shape, contour or point-related descriptors, e.g. scale invariant feature transform [SIFT] or bags of words [BoW]; Salient regional features
- G06V10/467—Encoded features or binary features, e.g. local binary patterns [LBP]
Definitions
- This invention relates to image processing, in particular to processing images to assist in image searching and image matching.
- FIGS. 1 a to 1 e show a variety of static two-dimensional images, in this case photographs of clothing or home furnishing.
- Each image contains many elements, including color (black, white, grey, red, orange), an object (e.g. dress, shorts, shirt or rug) and texture (e.g. stripes, spots, checks).
- the texture has a large scale relative to the image itself.
- the texture may be termed macro-scale or coarse grained.
- the texture is not consistent across the entire image.
- the images of FIGS. 1 a to 1 e are merely representative of the wide variety of images which fall into this category.
- some images contain just a single texture and that texture is fine-grained, e.g. the grain pattern in a rock.
- the word pattern may be used interchangeably with texture.
- these methods assume that there is just one texture in the entire image. Alternatively they can be applied to parts of images to identify texture in different parts of the image.
- One example of such a technique is the use of co-occurrence matrices described in Robert Haralick's “Textural Features for Image Classification” published in IEEE Transactions on Systems, Man and Cybernetics in November 1973.
- a method for processing an image to generate a signature which is characteristic of a pattern within said image comprising:
- said combining is such that said signature is independent of the location of each sub-image.
- this method is insensitive to location (i.e. it is translation independent). In other words, it will identify patterns wherever they occur in an image. Hence, an image that contains a stripy dress in the center could have a similar signature to an image in which the stripes are around the border of the image.
- This invention provides a way of comparing the gross-scale texture or pattern of one image with that of a number of other images. This can be used, for example, to search for similar images based on pattern.
- Said luminance value may be determined by determining an average luminance for each of said plurality of pixels; determining whether said average luminance is greater than a threshold value; setting each of said plurality of pixels to a first value if said average luminance is greater than a threshold value; setting each of said plurality of pixels to a second value if said average luminance is lower than a threshold value; and combining said first values and said second values to generate said luminance value for each said sub-image.
- Said threshold value may be the average luminance of the image.
- Said first value may be black or one and said second value may be white or zero.
- the use of black and white results in a simple sub-image composed of black and white pixels.
- the black and white pixels may be converted into a luminance value which is a binary number.
- the binary number may be further converted into an index number. It will be appreciated that the binary and index numbers may be determined in different ways; all that is essential is that the same method is used for all sub-images.
- Combining said luminance value may comprise defining a histogram having a plurality of slots with each slot representing a luminance value.
- the slots may thus be numbered with the index number where one is determined.
- Each slot in said histogram may be incremented for each sub-image having a luminance value corresponding to said slot. In this way, the combining ensures that the signature is independent of the location of each sub-image because the slot in the histogram which corresponds to the index number is incremented regardless of the location within the image of the sub-image which led to that index number.
- the size of the histogram may be determined from the size of each sub-image.
- said histogram may have 512 slots and each said sub-image may have 3 ⁇ 3 pixels.
- Said signature may be considered to be said histogram.
- said histogram may be converted to a feature vector to form said signature.
- the window may be overlaid on the image such that at least some of said plurality of images partially overlap at least one other image.
- the image in contrast to US2009/0324077, the image is not divided up into separate sub-images.
- the overlapping images will reinforce the dominant patterns within the image as a whole and ensure that patterns are not missed that happen not to span a particular window.
- Another key difference over US2009/0324077 is that a single histogram is calculated for the whole image rather than a histogram being calculated for each sub-image.
- the present invention calculates a luminance value to determine the pattern whereas in US2009/0324077, textures are calculated based on dominant directions.
- the use of dominant directions means, for example, that while it may be able to deal fairly well with stripes, the method of US2009/0324077 would not work as well with spots, leopard-skin or other non linear patterns.
- the image may be rescaled before overlaying said window.
- the rescaling ensures a consistent result because all images are rescaled to the same fixed size.
- Said sub-image within said window may also be rescaled to reduce the number of pixels within said sub-image to said plurality of pixels. Reducing the number of pixels affects the computation of the signature for the overall image. For example, if too many pixels are contained in each sub-image, there will be an unmanageable number of slots in the histogram.
- Conversion to grayscale may also be incorporated into said method.
- the color is not generally relevant to the pattern of the image. It is the luminance of each pixel which is key.
- said received image or said rescaled image may be converted to grayscale before determining said luminance values.
- the conversion to grayscale may take place when determining said luminance value for said sub-image.
- a method of searching for an image comprising:
- a method of creating a database of images comprising:
- the determining of a signature for said query image and/or said input image may be accessing said signature from a database.
- said signature may be calculated in real-time using the method described above.
- the method may be combined with other features such as color and shape.
- the method may further comprise inputting a color and/or shape with the query image and generating a similarity value which incorporates said color and/or shape.
- the method may further comprise determining the color and/or shape of the input image and the input image may be allocated to a sub-section depending on its color and/or shape.
- the invention further provides processor control code to implement the above-described systems and methods, for example on a general purpose computer system or on a digital signal processor (DSP).
- the code is provided on a physical data carrier such as a disk, CD- or DVD-ROM, programmed memory such as non-volatile memory (eg Flash) or read-only memory (Firmware).
- Code (and/or data) to implement embodiments of the invention may comprise source, object or executable code in a conventional programming language (interpreted or compiled) such as C, or assembly code. As the skilled person will appreciate such code and/or data may be distributed between a plurality of coupled components in communication with one another.
- the invention further provides systems for carrying out the methods described above.
- a system for processing an image to generate a signature which is characteristic of a pattern within said image comprising
- a processor configured to:
- said combining is such that said signature is independent of the location of each sub-image.
- a query engine for searching for an image comprising:
- a processor configured to
- a system for characterizing an image within a database of images comprising:
- a processor which is configured to determine a signature for said input image by overlaying a window at multiple locations on said image to define a plurality of sub-images within said image, with each sub-image each having a plurality of pixels having a luminance level;
- the signature of the query image or input image may be created using the methods described in detail above.
- FIGS. 1 a to 1 e show various images having a coarse grained texture
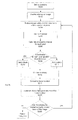
- FIG. 2 a is a flowchart setting out the method for processing an image according to the present invention
- FIG. 2 b is a flowchart setting out the steps associated with defining a histogram as part of the method of FIG. 2 a;
- FIG. 3 a illustrates an image to be processed according to the present invention
- FIG. 3 b illustrates a rescaled version of the image of FIG. 3 a
- FIG. 3 c illustrates a sub-image of image of FIG. 3 b
- FIG. 3 d illustrates a processed version of the sub-image of FIG. 3 d
- FIG. 4 illustrates a histogram created using the steps of FIG. 2 b;
- FIG. 5 illustrates the image of FIG. 3 b with a window overlaid at various positions
- FIG. 6 schematically illustrates a system for implementing the present invention
- FIGS. 7 a to 7 d illustrate the results for searching for images which match an image which has been processed according to the present invention
- FIG. 7 e is a flowchart of the method of searching used in FIGS. 7 a to 7 d;
- FIGS. 8 a to 8 c show images which are used to build up a library of images using the processing techniques of the present invention
- FIGS. 8 d and 8 e are flowcharts of the method involved in building up a library of images and categorizing images.
- FIGS. 2 a and 2 b illustrate the steps in the processing of an image according to the present invention.
- the overall result is that the pattern/texture feature of the image is effectively “extracted” from the image.
- the first step (S 100 ) is that the image is received.
- the image is converted to grey-scale (as color is not relevant).
- This is an optional step.
- Various techniques for the conversion may be used.
- the next step S 104 is to rescale the image to a fixed size (say 100 ⁇ 100 pixels). This is also illustrated in FIGS. 3 a and 3 b .
- FIG. 3 a shows the original image (after optional grayscale conversion) and
- FIG. 3 b shows the rescaled image.
- the rescaling ensures a consistent result because all images are rescaled to the same fixed size. It also removes some of the fine detail from very large images, which is consistent with a desire to analyze only the coarser grained patterns in the image.
- Rescaling (or resizing) of images can be done in a number of ways, for example, nearest neighbor, linear interpolation in a 2 ⁇ 2 environment, cubic spline interpolation in a 4 ⁇ 4 environment, or down sampling with anti-aliasing.
- the nearest neighbor scaling algorithm may be used. This algorithm calculates the horizontal and vertical ratios between the original image and the scaled image. Once the ratios have been calculated, a buffer is created to store information for the scaled image which is derived from the original image. The technique is described in more detail in “Nearest Neighbor Image Scaling” published in Tech-Algorithm.com on 6 Oct. 2007.
- the next step (S 106 ) is to define a histogram with a fixed number of slots.
- an empty histogram is defined with 512 “slots” (the reason for this number is explained below). It is preferable to initialize the histogram before use, e.g. by inserting 0 into each slot.
- the histogram is populated based on the rescaled image, as described in more detail in FIG. 3 b .
- the histogram is converted to a vector of non-negative integer values. The vector has the same number of values as there are slots in the histogram.
- This vector can be thought of as a signature which is characteristic of the pattern within the image or alternatively the histogram itself may be considered to be the signature.
- Other techniques may be used for creating the pattern-signature if desired.
- the signature is a translation-independent representation of the pattern(s) contained in the image.
- FIG. 2 b explains in more detail the steps in populating the histogram based on the rescaled image.
- a window is defined on the rescaled image.
- Such a window is shown in FIG. 5 as a square window which is small relative to the image on which it is placed.
- a window of 12 ⁇ 12 pixels may be used. It will be appreciated that other shapes of window may be used although a square simplifies the calculations.
- the window is overlaid on the image to create a sub-image of the image.
- the sub-image has 12 ⁇ 12 pixels and is illustrated in FIG. 3 c .
- the 12 ⁇ 12 sub-image is shrunk to 3 ⁇ 3 pixels at step S 204 .
- a threshold is defined at step S 205 .
- This threshold value may be the average luminance of the rescaled image and may be calculated using standard techniques.
- the average luminance value for the 9 pixels is calculated at step S 206 . This average luminance value is calculated in any standard way.
- step S 208 it is determined whether or not the luminance of each pixel is greater than the threshold value. If the luminance value is greater than the threshold value, the pixels are set to black (S 210 ), and all others are set to white (S 212 ). This results in an image containing only pixels which are wholly black or wholly white pixels as illustrated in FIG. 3 d.
- the thresholding step described above means that the grayscale conversion is not essential. This is possible because the thresholding step could be carried out on the luminance of RGB colored cells. In other words, each RGB value could be converted to a luminance value in order to calculate the average luminance for each pixel at step S 206 . The thresholding could then be applied at Step S 208 to this luminance value.
- the fixed number of pixels are flattened into a binary number, by converting black pixels to 1 and white pixels to 0 (step S 214 ).
- This binary number is converted to an index number (step S 216 ) which corresponds to a slot in the histogram.
- the histogram slot with the specified index has its value incremented by 1 at step S 218 .
- the binary number for the 9 pixel image of FIG. 3 d is 111000111 and thus the corresponding index number is 455.
- the binary or index number may be considered to be a luminance value which is representative of the luminance levels within the sub-image.
- the binary and index numbers are location independent.
- the slot in the histogram which corresponds to the index number is incremented regardless of the location within the image of the sub-image which led to that index number. This is a key feature of the invention.
- the next step S 220 is to determine whether or not the window can be moved to overlay a new block of the image.
- the window is moved around the image.
- the window covers every sub-image of a fixed size (say 12 ⁇ 12) in the image.
- 12 ⁇ 12 i.e. 144 pixels in total
- the window moves across from the top-left to the top-right with each step. Following this, the window would move down by one pixel and would start again from the left-hand size moving to the right. This would be repeated until the entire image had been covered. This movement is illustrated in FIG.
- both the first and second placements of the window capture the left strap of the dress.
- both the fourth and fifth placements of the window capture the right strap of the dress.
- steps S 204 to S 220 are repeated for the new location.
- the method is an iterative process which gradually covers every sub-image. Once there are no more sub-images to process, the histogram is output.
- FIG. 4 An example of a histogram is shown in FIG. 4 .
- the histogram that is created contains a representation of the types of patterns that are present in the image, in this case for the dress of FIG. 3 a .
- the y-axis shows the count in each slot in the histogram, and the x-axis shows the slot numbers.
- the dominant patterns are represented by larger values than patterns that occur in only small parts of the image. In this case, the peaks in the histogram are at 0, 56, 455 and 504.
- the nine pixels sub-images for the four non-zero peaks are shown as inserts. Three of these four dominant patterns represent the horizontal stripes of a certain thickness. Another smaller peak occurs at 219 which represents the edge of each dark horizontal stripe.
- 0 is the most dominant pattern. This is mostly because of the background being white, which counts as 000000000. This is not necessarily a problem but the method can be improved by applying automatic segmentation to separate the main image from the background and then the method described here applied only to the foreground. This would, in this case, eliminate the vast majority of the values in the 0 slot, although 0 would still probably be a minor peak because of the horizontal white stripes within the main image.
- the numbers used in the descriptions here have been selected as optimal based on experimentation. However, other values can be used.
- the size of the histogram is entirely dependent on the size that each sub-image is resized to. In this case, the minimum fixed size used is 3 ⁇ 3 pixels. The smallest binary number possible is 000000000 (which in decimal is zero) and the largest possible, with nine bits, is 111111111 which in decimal notation is 511. Hence, the number of slots in the histogram in this example is 512.
- n 2 d ⁇ d
- FIG. 6 shows a schematic image of a system which can be used to implement the various processes described herein.
- the system can be used in many ways, including allowing a user to make searches and categorizing images in an image database.
- a user can use an input device 100 .
- the input device is shown as a computer but may be any suitable device, including computers, laptops, mobile phones.
- Each input device typically comprises one or more processors, memory, a display, a user interface, e.g. devices such as keypad, keyboard, microphone, touch screen and a network interface.
- the input device 100 is connected in any known manner, e.g. over the Internet 102 , to a server 104 for processing any user input.
- the server 104 comprises a processor or operating system which processing any data received at the server.
- the server 104 also comprises memory storing applications programs and program data. These application programs are run to create the desired functionality. For example, if the server 104 receives an image from a user, the server may run the application program which generates the signature for this image as described in FIGS. 2 a and 2 b . Once the signature has been generated, this may be used to search for comparable images as described in more detail in relation to FIG. 7 e or to categorize the image for storage in a library as described in relation to FIG. 8 d.
- the server is connected to an image database 106 and a feature database 108 .
- the feature database 108 may store the signatures created as described above.
- the image database 106 may store the image associated with these signatures.
- an image(s) from the image database may be presented to a user on the user interface of the input device 100 for selection.
- the server may query the images and associated signatures in these databases.
- the image database 106 and a feature database 108 may also be termed a library as described in more detail below.
- the server may be implemented using standard technology as a single unit or a plurality of interconnected units.
- the hardware components of any server typically include: a central processing unit (CPU), an Input/Output (I/O) Controller, a system power and clock source; display driver; RAM; ROM; and a hard disk drive.
- a network interface provides connection to a computer network such as Ethernet, TCP/IP or other popular protocol network interfaces.
- the functionality may be embodied in software residing in computer-readable media (such as the hard drive, RAM, or ROM).
- a typical software hierarchy for the system can include a BIOS (Basic Input Output System) which is a set of low level computer hardware instructions, usually stored in ROM, for communications between an operating system, device driver(s) and hardware.
- BIOS Basic Input Output System
- Device drivers are hardware specific code used to communicate between the operating system and hardware peripherals.
- Applications are software applications written typically in C/C++, Java, assembler or equivalent which implement the desired functionality, running on top of and thus dependent on the operating system for interaction with other software code and hardware.
- the operating system loads after BIOS initializes, and controls and runs the hardware. Examples of operating systems include LinuxTM, SolarisTM, UnixTM, OSXTM Windows XPTM and equivalents.
- FIGS. 7 a to 7 d show the results of a search based on a query image.
- the first image is the “query” image and the following images are the ones deemed by a searching algorithm to have the most similar pattern/texture.
- the searching algorithm is set out in FIG. 7 e as follows:
- the first step S 300 is to receive an image for a search query. This may be input by a user by any known method.
- the next step S 302 is to get the histogram for the received image. If the query image has been processed using the method described above, the histogram or the corresponding pattern feature vector may be retrieved from a database. Alternatively, the histogram may be generated in real-time as part of the query.
- the next step S 304 is to retrieve a histogram or corresponding pattern feature vector for another image.
- the image and its associated histogram are selected from a database, which may have over 1,000,000 images.
- This database may comprise pattern feature vectors for all images in the database, pre-computed and stored.
- the two histograms can now be compared using standard techniques, e.g. earth-mover distance, Euclidean distance or another vector or histogram difference metric. Such techniques typically determine the difference between the patterns contained in the two images. The difference can be converted to a similarity by inverting it (for example by subtracting it from the maximum possible difference score). A similarity value for the pair of images is thus determined S 308 .
- standard techniques e.g. earth-mover distance, Euclidean distance or another vector or histogram difference metric.
- Such techniques typically determine the difference between the patterns contained in the two images.
- the difference can be converted to a similarity by inverting it (for example by subtracting it from the maximum possible difference score).
- a similarity value for the pair of images is thus determined S 308 .
- the process S 310 determines whether or not there are any other images to be compared in the database. If there are other images, steps S 304 and S 308 are repeated. Thus, multiple similarity values are generated in which the query image is compared with other images. These similarity values can then be ranked S 312 and the highest ranking images S 314 may be output. In other words, a k-nearest neighbor algorithm is applied to identify the nearest neighbors to the query image, which in this case will be the images with the most similar patterns to those contained in the query image.
- the dominant pattern of the query image is made up, approximately, of horizontal stripes.
- the algorithm has correctly identified, as the five most similar images, other items of clothing with bumpy horizontal stripes. Note that color and shape have not played a part; the matching has been done solely on the patterns found in the query image.
- the query image in FIG. 7 b is almost entirely made up of diagonal stripes.
- the first two results identified by the algorithm are similarly dominated by diagonal stripes.
- the next three results can also be seen to have diagonal patterns working from the bottom-left to the top-right, although the pattern is less visually obvious than in the query image.
- the pattern is made up of approximately vertical trees against a fuzzy (leafy) background. This example shows that the algorithm works well with patterns that are more complex than stripes and geometric patterns.
- the pattern is more complex and less well defined. Nevertheless, the results show images having a pattern of waves created by a duck or other bird in water.
- the system comprises an image database and a feature database which stores images and their associated signatures.
- the searching described in relation to FIGS. 7 a to 7 e can be conducted through the images stored in these databases. It may be helpful for such databases to be divided into a library of patterns.
- a library of patterns may contain some or all of the following types of pattern; vertical stripes, horizontal stripes, diagonal stripes, large dots, small dots, tiger stripes, brickwork, checks and zig-zags.
- Clearly other types of categories of patterns could be used as a sub-section within the library. Each sub-section has a canonical form for the pattern which is defined manually but as explained in more detail below, the library itself is built up automatically.
- Such a library may be helpful when conducting a search, for example, when a user does not have an image to begin the search.
- the user could select the pattern they are interested in by clicking on a sample image showing a canonical form of the pattern.
- FIG. 8 d shows how the library is initialized by defining a representative pattern (canonical form) for each sub-section at step S 400 .
- the signature for this sub-section is then determined as described above (S 402 ).
- the system determines whether or not there are any further patterns to be included at step S 404 and if so repeats the first two steps until the library is complete.
- the library is then output at step S 406 .
- the images shown in FIGS. 8 a to 8 c may be input as the representative pattern for “stripes”, “spots” and “checks” respectively.
- the library can be expanded by including or refining the subsections by defining new representative patterns and repeating the steps for the method.
- FIG. 8 e shows how such a library can be used to automatically label or tag each image. For example, each image could be compared with a representative histogram for each type of pattern. Each image could then be added to the section of the library with which it has the highest similarity value or perhaps to more than one section if the similarity values are above a threshold value.
- FIG. 8 e shows that the algorithm to provide the functionality to tag images using a library could be as follows:
- An image (query image) is received for classification (step S 500 );
- step S 502 Compute the histogram or signature of the query image, as described above (step S 502 ).
- v. Select the pattern whose histogram is closest to that of the query image and look up the textual description of this pattern. E.g., “Stripes”. (Note that this could be in any language, making the method language independent).
- This label is then assigned to the ranked sub-section (step S 508 ). It will be appreciated that more than one closest sub-image may be selected so that the image is tagged with more than one label. This is dependent on how many sub-sections are within the library.
- FIGS. 8 a to 8 c show three examples of a canonical form for a sub-section of a library. In this case, the subsections are red horizontal stripes, green spots and purple checks.
- the library could contain sub-sections within the sub-sections for example, horizontal stripes may be the main category, this may be sub-divided by color and may be also be sub-divided by object, e.g. horizontal striped dress or green horizontal stripes or even green horizontal striped dress.
- Another method for a user to input a query image is to type a query such as “Striped dress” into a text-based search engine.
- the canonical image of stripes may then be used as the query image.
- the word dress might be applied as a keyword query alongside the query image or perhaps applied against an object recognition database to identify images of dresses from within the images which match the canonical image for stripes.
- the canonical image for this sub-section can be input as the query image to identify further images of dresses.
Abstract
Description
L=R*299/1000+G*587/1000+B*114/1000
n=2d×d
Claims (18)
Priority Applications (1)
| Application Number | Priority Date | Filing Date | Title |
|---|---|---|---|
| US14/155,434 US8971669B2 (en) | 2012-11-01 | 2014-01-15 | Method and apparatus for image processing |
Applications Claiming Priority (2)
| Application Number | Priority Date | Filing Date | Title |
|---|---|---|---|
| GBGB1219650.7A GB201219650D0 (en) | 2012-11-01 | 2012-11-01 | Method and apparatus for image processing |
| GB1219650.7 | 2012-11-01 |
Related Child Applications (1)
| Application Number | Title | Priority Date | Filing Date |
|---|---|---|---|
| US14/155,434 Continuation US8971669B2 (en) | 2012-11-01 | 2014-01-15 | Method and apparatus for image processing |
Publications (1)
| Publication Number | Publication Date |
|---|---|
| US8644607B1 true US8644607B1 (en) | 2014-02-04 |
Family
ID=47359000
Family Applications (2)
| Application Number | Title | Priority Date | Filing Date |
|---|---|---|---|
| US13/801,027 Active US8644607B1 (en) | 2012-11-01 | 2013-03-13 | Method and apparatus for image processing |
| US14/155,434 Active US8971669B2 (en) | 2012-11-01 | 2014-01-15 | Method and apparatus for image processing |
Family Applications After (1)
| Application Number | Title | Priority Date | Filing Date |
|---|---|---|---|
| US14/155,434 Active US8971669B2 (en) | 2012-11-01 | 2014-01-15 | Method and apparatus for image processing |
Country Status (2)
| Country | Link |
|---|---|
| US (2) | US8644607B1 (en) |
| GB (1) | GB201219650D0 (en) |
Cited By (1)
| Publication number | Priority date | Publication date | Assignee | Title |
|---|---|---|---|---|
| CN109242750A (en) * | 2018-08-14 | 2019-01-18 | 武汉斗鱼网络科技有限公司 | Picture signature method, picture match method, apparatus, equipment and storage medium |
Families Citing this family (3)
| Publication number | Priority date | Publication date | Assignee | Title |
|---|---|---|---|---|
| US10255703B2 (en) | 2015-12-18 | 2019-04-09 | Ebay Inc. | Original image generation system |
| CN108876832B (en) * | 2018-05-30 | 2022-04-26 | 重庆邮电大学 | Robust texture feature extraction method based on grouping-order mode |
| US11735028B2 (en) | 2018-06-12 | 2023-08-22 | Intergraph Corporation | Artificial intelligence applications for computer-aided dispatch systems |
Citations (7)
| Publication number | Priority date | Publication date | Assignee | Title |
|---|---|---|---|---|
| WO2001072030A2 (en) | 2000-03-20 | 2001-09-27 | Koninklijke Philips Electronics N.V. | Hierarchical authentication system for images and video |
| US20060064248A1 (en) * | 2004-08-11 | 2006-03-23 | Olivier Saidi | Systems and methods for automated diagnosis and grading of tissue images |
| US20080212899A1 (en) * | 2005-05-09 | 2008-09-04 | Salih Burak Gokturk | System and method for search portions of objects in images and features thereof |
| US20090324077A1 (en) | 2008-06-27 | 2009-12-31 | Microsoft Corporation | Patch-Based Texture Histogram Coding for Fast Image Similarity Search |
| US20100166339A1 (en) * | 2005-05-09 | 2010-07-01 | Salih Burak Gokturk | System and method for enabling image recognition and searching of images |
| US20120243051A1 (en) * | 2009-11-26 | 2012-09-27 | Oce-Technologies B.V. | Method for generating print data and a color printer system |
| US8421859B2 (en) * | 2008-04-24 | 2013-04-16 | GM Global Technology Operations LLC | Clear path detection using a hierachical approach |
Family Cites Families (3)
| Publication number | Priority date | Publication date | Assignee | Title |
|---|---|---|---|---|
| US8890951B2 (en) * | 2008-04-24 | 2014-11-18 | GM Global Technology Operations LLC | Clear path detection with patch smoothing approach |
| US8385971B2 (en) * | 2008-08-19 | 2013-02-26 | Digimarc Corporation | Methods and systems for content processing |
| US8886206B2 (en) * | 2009-05-01 | 2014-11-11 | Digimarc Corporation | Methods and systems for content processing |
-
2012
- 2012-11-01 GB GBGB1219650.7A patent/GB201219650D0/en not_active Ceased
-
2013
- 2013-03-13 US US13/801,027 patent/US8644607B1/en active Active
-
2014
- 2014-01-15 US US14/155,434 patent/US8971669B2/en active Active
Patent Citations (7)
| Publication number | Priority date | Publication date | Assignee | Title |
|---|---|---|---|---|
| WO2001072030A2 (en) | 2000-03-20 | 2001-09-27 | Koninklijke Philips Electronics N.V. | Hierarchical authentication system for images and video |
| US20060064248A1 (en) * | 2004-08-11 | 2006-03-23 | Olivier Saidi | Systems and methods for automated diagnosis and grading of tissue images |
| US20080212899A1 (en) * | 2005-05-09 | 2008-09-04 | Salih Burak Gokturk | System and method for search portions of objects in images and features thereof |
| US20100166339A1 (en) * | 2005-05-09 | 2010-07-01 | Salih Burak Gokturk | System and method for enabling image recognition and searching of images |
| US8421859B2 (en) * | 2008-04-24 | 2013-04-16 | GM Global Technology Operations LLC | Clear path detection using a hierachical approach |
| US20090324077A1 (en) | 2008-06-27 | 2009-12-31 | Microsoft Corporation | Patch-Based Texture Histogram Coding for Fast Image Similarity Search |
| US20120243051A1 (en) * | 2009-11-26 | 2012-09-27 | Oce-Technologies B.V. | Method for generating print data and a color printer system |
Non-Patent Citations (3)
| Title |
|---|
| Haralick,Robert "Textural Features for Image Classification" IEEE Transactions on Systems, Man and Cybernetics, Nov. 1973. |
| Tech-Algorithm.com "Nearest Neighbour Image Scaling", Oct. 6, 2007. |
| Wang et al "Large-Scale Duplicate Detection for WEb Image Search" 2006 IEEE INT conf on Multimedia and Expo, Jan. 7, 2006. |
Cited By (1)
| Publication number | Priority date | Publication date | Assignee | Title |
|---|---|---|---|---|
| CN109242750A (en) * | 2018-08-14 | 2019-01-18 | 武汉斗鱼网络科技有限公司 | Picture signature method, picture match method, apparatus, equipment and storage medium |
Also Published As
| Publication number | Publication date |
|---|---|
| US8971669B2 (en) | 2015-03-03 |
| US20140185959A1 (en) | 2014-07-03 |
| GB201219650D0 (en) | 2012-12-12 |
Similar Documents
| Publication | Publication Date | Title |
|---|---|---|
| AU2018250370B2 (en) | Weakly supervised model for object detection | |
| JP6098702B2 (en) | Method, system and computer readable program for analyzing an image containing a plurality of organized objects | |
| US6556710B2 (en) | Image searching techniques | |
| US8917910B2 (en) | Image segmentation based on approximation of segmentation similarity | |
| US6522782B2 (en) | Image and text searching techniques | |
| US8385646B2 (en) | Image processing | |
| CN110866896B (en) | Image saliency target detection method based on k-means and level set super-pixel segmentation | |
| US20140149412A1 (en) | Information processing apparatus, clustering method, and recording medium storing clustering program | |
| Naeem | Detection of malicious activities in internet of things environment based on binary visualization and machine intelligence | |
| TW202207077A (en) | Text area positioning method and device | |
| JP2004525471A (en) | Palette-based histogram matching by recursive histogram vector generation | |
| US8971669B2 (en) | Method and apparatus for image processing | |
| US6522780B1 (en) | Indexing of images and/or text | |
| US20220277192A1 (en) | Visual Analytics System to Assess, Understand, and Improve Deep Neural Networks | |
| US6522779B2 (en) | Representing an image with a posterized joint histogram | |
| Chan et al. | A ROI image retrieval method based on CVAAO | |
| Gagaudakis et al. | Shape measures for image retrieval | |
| Yang et al. | Scene classification-oriented saliency detection via the modularized prescription | |
| Amelio | Approximate matching in ACSM dissimilarity measure | |
| Li et al. | Visual saliency map from tensor analysis | |
| US6671402B1 (en) | Representing an image with weighted joint histogram | |
| Choi et al. | Object-aware image thumbnailing using image classification and enhanced detection of ROI | |
| Wang et al. | Enhancing hierarchical linkage clustering via boundary point detection | |
| Qiu et al. | Top-Down saliency by multi-scale contextual pooling | |
| Matilla Alastruey | Extension of the BRIEF descriptor for color images and its evaluation in robotic applications. |
Legal Events
| Date | Code | Title | Description |
|---|---|---|---|
| AS | Assignment |
Owner name: DEEPMIND TECHNOLOGIES LIMITED, UNITED KINGDOM Free format text: ASSIGNMENT OF ASSIGNORS INTEREST;ASSIGNORS:COPPIN, BENJAMIN KENNETH;SULEYMAN, MUSTAFA;NAIR, ARUN;REEL/FRAME:029988/0103 Effective date: 20130313 |
|
| STCF | Information on status: patent grant |
Free format text: PATENTED CASE |
|
| AS | Assignment |
Owner name: GOOGLE INC., CALIFORNIA Free format text: ASSIGNMENT OF ASSIGNORS INTEREST;ASSIGNOR:DEEPMIND TECHNOLOGIES LIMITED;REEL/FRAME:032746/0855 Effective date: 20140422 |
|
| FEPP | Fee payment procedure |
Free format text: PAT HOLDER NO LONGER CLAIMS SMALL ENTITY STATUS, ENTITY STATUS SET TO UNDISCOUNTED (ORIGINAL EVENT CODE: STOL); ENTITY STATUS OF PATENT OWNER: LARGE ENTITY |
|
| FPAY | Fee payment |
Year of fee payment: 4 |
|
| AS | Assignment |
Owner name: GOOGLE LLC, CALIFORNIA Free format text: CHANGE OF NAME;ASSIGNOR:GOOGLE INC.;REEL/FRAME:044101/0299 Effective date: 20170929 |
|
| AS | Assignment |
Owner name: DEEPMIND TECHNOLOGIES LIMITED, UNITED KINGDOM Free format text: ASSIGNMENT OF ASSIGNORS INTEREST;ASSIGNOR:GOOGLE INC.;REEL/FRAME:044242/0116 Effective date: 20170921 |
|
| MAFP | Maintenance fee payment |
Free format text: PAYMENT OF MAINTENANCE FEE, 8TH YEAR, LARGE ENTITY (ORIGINAL EVENT CODE: M1552); ENTITY STATUS OF PATENT OWNER: LARGE ENTITY Year of fee payment: 8 |
|
| AS | Assignment |
Owner name: DEEPMIND TECHNOLOGIES LIMITED, UNITED KINGDOM Free format text: CORRECTIVE ASSIGNMENT TO CORRECT THE DECLARATION AGAINST APPLICATION NO. 13801027 PREVIOUSLY RECORDED AT REEL: 044101 FRAME: 0299. ASSIGNOR(S) HEREBY CONFIRMS THE DECLARATION;ASSIGNOR:DEEPMIND TECHNOLOGIES LIMITED;REEL/FRAME:058704/0759 Effective date: 20220111 |