US8600190B1 - Method for combining two image data sets using fixed distribution - Google Patents
Method for combining two image data sets using fixed distribution Download PDFInfo
- Publication number
- US8600190B1 US8600190B1 US12/846,086 US84608610A US8600190B1 US 8600190 B1 US8600190 B1 US 8600190B1 US 84608610 A US84608610 A US 84608610A US 8600190 B1 US8600190 B1 US 8600190B1
- Authority
- US
- United States
- Prior art keywords
- gray level
- image
- lut
- level value
- pixel
- Prior art date
- Legal status (The legal status is an assumption and is not a legal conclusion. Google has not performed a legal analysis and makes no representation as to the accuracy of the status listed.)
- Active, expires
Links
Images


Classifications
-
- G—PHYSICS
- G06—COMPUTING; CALCULATING OR COUNTING
- G06T—IMAGE DATA PROCESSING OR GENERATION, IN GENERAL
- G06T11/00—2D [Two Dimensional] image generation
Definitions
- the present invention in general, relates to methods and systems for combining two digital input images to produce a fused output image. More specifically, the present invention relates to controlling the distribution of the output image by attempting to drive the output gray level values so that they do not naturally move towards the middle gray region.
- the resulting fused image of the present invention has more contrast than an image resulting from a ratio-metric approach.
- FIGS. 1A , 1 B and 1 C show histograms of output gray levels resulting from combining each possible input pair of gray levels from image A and image B.
- FIG. 1A results from combining all possible input gray level pairs, using a mix-level of 0.25
- FIG. 1B results from combining all possible input gray level pairs using a mix-level of 0.5
- FIG. 1C results from combining all possible input gray level pairs using a mix-level of 0.75.
- the resulting output using the ratio-metric approach shown in these figures achieves images with characteristic middle-gray weighted data, usually low contrast data, which are not visually appealing. Furthermore, determining an appropriate gamma, or TTC curve, and a contrast stretch method to enhance these image data sets—regardless of input content—is not straight forward.
- the present invention targets an output distribution of a combined image, in which the look and tone of the fused brightness of the image are controlled.
- the present invention provides a fixed distribution look-up-table (LUT) for combining two digital images to produce a fused image that maintains expected contrast and does not reduce it.
- the present invention also provides an algebraic approach to obtaining a fixed distribution, when fusing two images, and achieves the fusion without need of a LUT that requires large memory storage and large processing power.
- the present invention provides a look-up-table (LUT) for forming an output image from a combination of two input images.
- the LUT includes first and second sets of gray levels, respectively, formed from first and second input images; and a third set of gray levels, calculated by a processor, for forming an output image.
- the third set of gray levels is formed from the first and second sets of gray levels.
- a pixel of the output image includes a gray level value of z that is dependent on a probability distribution function of gray levels in the LUT, expressed as p(z), where z is a gray level.
- P(z) is a cumulative distribution function (CDF) of p(z), and the gray level value, z, of the pixel is a function of the inverse of P(z); the inverse is denoted as P ⁇ 1 (k).
- CDF cumulative distribution function
- the LUT may include a virtual two dimensional table having horizontal and vertical axes, x and y, in which r is a maximum gray level value of the first set of gray levels, virtually placed along the vertical axis; q is a maximum gray level value of the second set of gray levels, virtually placed along the horizontal axis; and s is a maximum gray level of the output set of gray levels.
- the diagonal line is extended between the vertical axis and the horizontal axis at an angle of ⁇ with respect to the vertical axis, through the point (x, y) in the virtual LUT, where y is the pixel value from the first image, and x is the pixel value from the second image.
- a gradient from dark gray levels to light gray levels is formed along the angle ⁇ with respect to the vertical axis, and the angle ⁇ is determined by a mix-ratio of ⁇ , as follows:
- ⁇ ⁇ 2 ⁇ ( 1 - ⁇ ) .
- the mix-ratio may be determined either automatically by the processor or manually by a user.
- the present invention is a system for fusing input images to form an output image.
- the system includes a first imager for forming a first image, a second imager for forming a second image, and a processing module for fusing the first and second images.
- the processing module includes a calculator for determining a gray level value of z assigned to a pixel of the output image, based on a probability distribution function expressed as p(z), where z is a gray level.
- the P(z) is a cumulative distribution function (CDF) of p(z)
- the gray level value, z, of the pixel is a function of the inverse of P(z), where the inverse is denoted P ⁇ 1 (k).
- Yet another embodiment of the present invention is a method of forming an output image based on first and second input images.
- the method includes the steps of:
- the values of n and s are maximum gray level values, respectively, of the input sets of gray levels, and an output set of gray levels.
- P(z) is a cumulative distribution function (CDF) of p(z)
- the gray level value, z, of the pixel of the output image is a function of the inverse of P(z), where the inverse is denoted as P ⁇ 1 (k).
- the method also includes the step of:
- FIGS. 1A , 1 B and 1 C show the results of combining all possible input gray level pairs at different mix-levels using conventional methods, in which the resulting fused image tends to clump in the mid-range of gray level values with few, or no gray level values found in the end-ranges.
- FIG. 2 shows an exemplary LUT populated with gray level values based on fusing two images at a mix-ratio of 50%/50%), in accordance with an embodiment of the present invention.
- the LUT is populated along the shown vectors by moving from left to right and top to bottom.
- FIG. 3 shows an exemplary LUT populated with gray level values based on fusing two images at a mix-ratio of 20%/80%, in accordance with an embodiment of the present invention.
- the LUT is populated along the shown vectors by moving from left to right and top to bottom.
- FIG. 4A is an exemplary LUT populated with gray levels ranging from 0 to 3 providing 2-bit fused imagery for an input mix-ratio of 0, thereby reproducing the 2-bit gray levels of input image A, in accordance with an embodiment of the present invention.
- FIG. 4B is an exemplary LUT populated with gray levels ranging from 0 to 3 providing 2-bit fused imagery for an input mix-ratio of 1, thereby reproducing the 2-bit gray levels of image B, in accordance with an embodiment of the present invention.
- FIG. 5 is an illustration of angle ⁇ formed between a diagonal line or a vector extended between (a) the vertical axis depicting gray level values of image A and (b) the horizontal axis depicting gray level values of image B, which is constrained by a mix-ratio such that 0 ⁇ /2, in accordance with an embodiment of the present invention.
- FIG. 6 is an exemplary LUT populated with gray levels ranging from 0 to 3 providing uniform fusion in the output image, based on 2-bit input images, in accordance with an embodiment of the present invention.
- the vectors, v 1 to v 7 , each extended at an angle of ⁇ , are also shown.
- FIGS. 7A and 7B are flow diagrams depicting a method for forming a fused output image from an LUT populated by a fixed distribution of gray levels, based on two input images, and a mix-ratio, in accordance with an embodiment of the present invention.
- FIG. 8 is a virtual visualization of an LUT populated by forming a gradient in a given direction using a specified histogram of gray levels, where n is the same maximum gray level value of input image B and input image A, in accordance with an embodiment of the present invention.
- FIGS. 9A and 9B are illustrations showing how a fractional area covered by the area of interest, A, is used to evaluate the gray levels in the virtual LUT of FIG. 8 , in which k varies between 0 and 1, and s is the maximum gray level in the virtual LUT.
- a desired probability distribution of gray levels, z, in the virtual LUT is p(z), and P(z) is the cumulative distribution function of p(z).
- FIGS. 10A , 10 B, 10 C and 10 D depict four different scenarios for calculating the fractional area covered by the area of interest, A, shown in FIG. 9A , in accordance with an embodiment of the present invention.
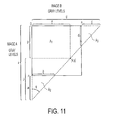
- FIG. 11 illustrates an example of how the fractional area covered by the area of interest, A (shown in FIG. 9A ) is calculated by a processor of the present invention.
- FIGS. 12A , 12 B and 12 C show examples of histograms resulting from an algebraic uniform fusion method of the present invention the examples showing, respectively, mix-levels of 0.25, 0.50 and 0.75.
- FIG. 13 is a flow diagram depicting an algebraic method for forming a fused output image having a fixed distribution of gray levels, based on two input images and a mix-ratio, in accordance with an embodiment of the present invention.
- FIG. 14 is an example of a virtual LUT formed by using the algebraic method shown in FIG. 13 and a uniform probability distribution, based on 4-bit input imagery (gray levels ranging from 0 to 15) and a mix-ratio of 0.30. Also shown is the associated histogram of output gray levels, which is approximately uniform.
- FIG. 15 is another example of a virtual LUT formed by using the algebraic method shown in FIG. 13 and a uniform probability distribution, based on 4-bit input imagery (gray levels ranging from 0 to 15) and a mix-ratio of 0.68. Also shown is the associated histogram of output gray levels, which is approximately uniform.
- FIGS. 16A , 16 B and 16 C are, respectively, exemplary curves of p(z), P(z) and P ⁇ 1 (k), where z is a gray level value that varies from 0 to a maximum gray level value of s, and k is a probability that varies from 0 to 1. Furthermore, p(z) is a probability distribution function; and P(z) is a cumulative distribution function (CDF) of p(z).
- the gray level value, z, of the pixel is a function of the inverse of P(z), where the inverse is denoted as P ⁇ 1 (k), and k varies between 0 and 1.
- the present invention provides a process for populating a fixed-distribution look-up-table (LUT) by receiving dual-modality images and then combining these images into a single (fused) image.
- the process uses image data, as well as a mapping function that includes a specified distribution of gray levels.
- the process or algorithm of the present invention provides increased control over how pixel values are mapped from the input images to the fused output image.
- Conventional approaches tend to cause the fused image to appear flat. Consequently, the fused image must be enhanced with dynamic range adjustment (DRA) algorithms.
- DRA dynamic range adjustment
- Such DRA algorithms that optimize the fused image vary with the mix-ratio and do not always work well for every image.
- the fixed-distribution LUT algorithm achieves the desired result.
- the combined output image may be controlled so that its contrast is increased, without expense of downstream processing.
- the present invention controls the spread of data in the output image.
- the present invention uses techniques, as will be explained, that are very different from conventional techniques, the latter including histogram equalization, which attempt to maximize contrast by forcing the output distribution to the full dynamic range of an output bin regardless of the input characteristics.
- FIGS. 2 and 3 a conceptual embodiment of the present invention is illustrated.
- Each figure shows an output table providing all combinations of gray level values based on two input images A and B.
- the gray level values of input image A are placed along the vertical axis of the table and the gray level values of input image B are placed along the horizontal axis of the table.
- Each table is populated with output gray level values that transverse the table based upon selected mix-ratio weights.
- the generation of the output table may be thought of as resulting from use of slanting diagonal lines that are extended across the table. The angle of these lines is a variable and is a function of the desired output weights.
- the table is populated with non-decreasing gray level values.
- FIG. 2 shows a table populated for a 50%/50% combination of images A and B.
- FIG. 3 shows a table populated for a 20%/80% combination of images A and B.
- the output is assumed to have the same bit depth, and the table is populated with various combinations of gray levels varying from 0 to 7, by moving along the slanting lines and populating the table with non-decreasing values starting at 0 and ending at 7.
- the table shown in FIG. 2 (50%/50% mix) includes an equal distribution of gray level values varying from 0 to 7, in which each gray level value is repeated eight times.
- the table shown in FIG. 3 has the same equal distribution of gray level values, but is based on a different mix ratio (20%/80% mix).
- the present invention provides a method for populating a LUT that is cost effective in low-power devices. Instead of using a large two-dimensional LUT, the present invention provides direct computations that use an algebraic form to quickly determine output values for such a table.
- a virtual LUT is formed by way of calculations executed by a processor, or a computer.
- Uses of the present invention may include image fusion, data-fusion, image processing and image enhancement.
- a system may use two cameras operating at different bandpass frequencies to simultaneously collect two different modality images of a single target. Both images may be processed independently, aligned, and then fused into a single resultant image. The goal of fusing the two image modalities, of course, is to preserve important information from each image, after both are combined into a single fused image.
- the fusion approach is adaptive.
- the fusion algorithm includes a mix-ratio, so that the contents of the fused image may gradually transition from 100% of the content of image A to 100% of the content of image B.
- fusion with a mix-ratio of 0 results in the gray levels of image A along the vertical axis of the LUT; and a mix-ratio of 1 results in the gray levels of image B along the horizontal axis of the LUT.
- the present invention contemplates two modes for adjusting the mix-ratio, namely a manual mode and an automatic mode.
- a manual mode a user selects the mix-ratio.
- an algorithm uses metrics from the first image and metrics from the second image in order to select the mix-ratio automatically.
- both input images may be optimized before fusion of the output image occurs. If a user, for example, desires either 100% of image A (first image) or 100% of image B (second image), then no further processing of the input images would improve the quality of the output image. Therefore, under these circumstances, the fused output image would be identical to the desired corresponding input image.
- the LUT need not be an actual table with values stored in memory, but rather the LUT may be a visual aide in representing an approach to the fusion problem solved by the present invention.
- the LUT is essentially a matrix that shows all possible output gray levels for pairs of input gray levels that are represented by the rows and columns of the matrix.
- the gray levels of image A are represented by the rows of the LUT (along the vertical axis), and the gray levels of image B are represented by the columns of the LUT (along the horizontal axis).
- the bit depth of the input images and the output image are all equal.
- FIGS. 4A and 4B provide examples of outputs in the image, at those mix-ratios for input and output imagery having a bit depth of 2.
- FIG. 4A shows the gray levels of the output image at mix-ratios of 0, and
- FIG. 4B shows the gray levels of the output image at mix-ratios of 1.
- the fixed distribution LUT algorithm of the present invention requires that the LUT have a histogram with a uniform distribution. This is a special case in the fixed distribution LUT fusion, referred to herein as a uniform fusion. Any desired histogram, however, may be used by the present algorithm.
- a uniform distribution is exemplified herein, because it works well in many cases, and because it minimizes the complexity of the algorithm.
- the algorithm requires that the gray levels in the LUT form a gradient from dark values to light values along an angle ⁇ , this angle is determined by the mix-ratio, ⁇ , as follows:
- the mix-ratio, ⁇ is determined manually by the user, or automatically by the algorithm executed by the processor or computer.
- the angle, ⁇ is determined using the following convention:
- the angle, ⁇ is constrained by a mix ratio, such that 0 ⁇ /2.
- the angle, ⁇ , and its relationship to a LUT having input images of n-bits of resolution is shown in FIG. 5 .
- the angle, ⁇ has a value of 45 degrees ( ⁇ /4).
- the LUT is populated along vectors drawn perpendicular to the gradient direction, as shown in FIG. 6 .
- the vectors, v 1 to v 7 as shown, are each drawn at an angle ⁇ so that each row position and each column position in the LUT will be populated by a gray level value.
- An exemplary algorithm of the present invention may begin by positioning itself at the start of the first vector, v 1 , and moving element-by-element along this vector. Any element in the LUT that the vector passes is then assigned a gray level value, as long as that element is still empty. When the edge of the LUT is reached (at the horizontal axis), the algorithm moves down to the next vector, namely, v 2, . Values are then assigned along this vector, v 2 . This process is repeated until every vector is traversed and the entire LUT is populated with gray level values.
- the value assigned to each element of the LUT in an exemplary embodiment may be determined from a desired histogram of the LUT, denoted as H(z), where z is a gray level.
- the histogram, H(z) determines the maximum number of repetitions each gray level may have (for example, reference is now made to the histograms shown in FIGS. 14 and 15 , in which z has a value between 0 and 15; and H(z) denotes the number of repetitions that the value z is allowed).
- a counter in the algorithm starts at 0 and next assigns a value of z to each empty LUT element that is traversed along a specific vector.
- a counter is incremented each time an element is populated in the LUT. If the counter reaches H(z), that implies that the maximum number of repetitions of gray level z has been reached. At this point, the value of z is incremented and the counter is reset to zero. The process continues as the LUT is traversed along each successive vector.
- the input and output images have gray levels that can range from 0 to 3.
- the algorithm assigns a gray level value to each element in the LUT in a non-decreasing manner, along each succeeding vector, as the algorithm moves from top to bottom and from left to right along the LUT.
- H(z) is equal for all z, so each gray level fills an equal area in the LUT.
- each gray level in the LUT of FIG. 6 has 4 repetitions.
- H(z) represents the total area covered by a particular gray level i in the LUT.
- FIGS. 7A and 7B A flow diagram of a method of the present invention for populating an LUT in order to form an output image is shown in FIGS. 7A and 7B .
- the method generally designated as 70 , starts at step 81 by inputting a desired mix-ratio, a gray level value of a pixel of image 1 , and a corresponding gray level value of a pixel of image 2 .
- a LUT with the particular mix-ratio is read next by step 82 .
- Step 83 finds the image 1 gray level value at position x of the horizontal axis and finds the image 2 gray level value at position y of the vertical axis.
- Step 84 obtains the gray level value, z, of the fused corresponding pixel of the output image at the intersection of position x and position y.
- Method 70 next branches back to step 83 to obtain the gray level value of the next pixel of the output image.
- the method continues looping back to process steps 83 and 84 in order to extract the gray level value, z, of each output pixel at the element of LUT(x, y).
- step 71 which receives the input parameters of a desired mix-ratio, the bit-depth for images 1 and 2 and a desired histogram H(z).
- step 72 converts the mix-ratio to determine the angle ⁇ using Equation 1.
- the parallel vectors, v are formed by step 73 , so that each row and each column of the LUT includes a vector passing through it, as shown in FIG. 6 .
- Method 70 next initializes a counter to 0 and also initializes the current gray level value of z to 0 using step 74 .
- step 75 follows the vector v. If the vector overlaps an unassigned LUT element, then step 76 assigns the element equal to the current gray level value of z. The counter is then incremented by one count and the assigned element is flagged as being filled.
- Step 77 determines whether the counter has reached the maximum number of repetitions for a specific gray level value of z. If the answer is yes, the gray level value of z is incremented to the next gray level value of z+1.
- Step 78 determines whether the vector has exited the LUT area. If the answer is yes, then the method moves to the start of the next vector position along the vertical axis. By looping back to step 76 , the method continues this process, until each vector is traversed and each element in the LUT is populated.
- the present invention provides another approach that uses algebraic formulation to increase the efficiency of the algorithm. This is accomplished by providing an algebraic formulation that calculates a fused gray level of an image based only on the input gray levels and a desired mix-ratio.
- the algebraic formulation forms a fixed distribution of elements in a virtual LUT.
- a gray level value from input image B denoted by x
- a gray level value from input image A denoted by y
- the angle, ⁇ the gray level value z of the output image at the LUT element position (x, y) may be calculated using the geometry shown in FIG. 8 .
- input image B with gray levels varying from 0 to q
- input image A with gray levels varying from 0 to r
- the output image may also have a different bit depth, with gray levels varying from 0 to s.
- the two input images have the same bit depth. In other words q is equal to r.
- q is equal to r.
- one or both of the input image bit depths may be rescaled in some manner, so that their range of possible values are the same, and the maximum possible gray level value of both inputs is then equal to n.
- the maximum possible gray level of input image B is n
- the maximum possible gray level of input image A is n
- the maximum possible gray level of the output image is s.
- the LUT gray level values increase as a function of the area behind a diagonal line through (x, y) at an angle, ⁇ .
- This area of interest, A is shown in hatched lines in FIG. 8 .
- p(z) be the desired probability distribution of gray levels in the LUT
- P(z) be the CDF (cumulative distribution function) of p(z), where z is a gray level.
- the fusion output is the inverse of P(z), denoted as P ⁇ 1 (k), evaluated at the fraction of the total LUT area covered by A. This is illustrated in FIGS. 9A and 9B .
- the area of interest, A may be calculated using the above information and relatively simple geometry. It will be appreciated, however, that the shape of the area of interest changes as x, y, and/or ⁇ change. The bounds on ⁇ restrict the area, A to four possible scenarios, as illustrated in FIGS. 10A , 10 B, 10 C and 10 D.
- the area of interest, A is included within each large triangle formed by the dotted lines in FIGS. 10A-10D .
- the area of each large triangle is designated as A 1 .
- area A 1 is equivalent to A.
- FIGS. 10B-10D it is necessary to subtract the area of either one or both of the small outer triangles from A 1 to determine A.
- the areas of the lower triangles in FIGS. 10C and 10D are designated as A 2
- the areas of the upper triangles in FIGS. 10B and 10D are designated as A 3 .
- Equation 1 is used to compute ⁇ .
- Equations 4 through 7 are used to calculate the area of the large triangle, A 1 , as follows:
- the method of the present invention determines if the lower triangle exists. If it exists, then area, A 2 , is computed. If the triangle exists, the method subtracts n from v to determine the length of side a. If the subtraction results in a negative number, however, then the lower triangle is assumed not to exist. If this is the case, then the value of a is set to 0, which forces the area, A 2 , to be set to 0.
- the actual distribution may be seen in the histograms plotted in FIGS. 12A , 12 B and 12 C.
- the histogram in FIG. 12A depicts a uniform distribution with a mix ratio of 0.25.
- the histogram in FIG. 12C depicts a uniform distribution with a mix ratio of 0.75.
- the histogram in FIG. 12B depicts a uniform distribution with a mix ratio of 0.50.
- FIG. 13 A flow diagram for the algebraic formulation method of the present invention is shown in FIG. 13 .
- the method assumes that the input images and the output image are not necessarily equal in size. This, however, is not a limitation of the present invention, as the input images and the output image may be equal in size. Furthermore, when a pixel from a first input image A does not have a corresponding pixel value from a second input image to fuse together, then the output image may use the pixel value of the larger first input image A.
- Step 131 receives the required input values, namely the mix-ratio, the pixels of image 1 , the pixels of image 2 , and the maximum pixel value of image 1 and image 2 , namely n.
- Step 132 computes the inverse of the desired CDF for the gray level values (for example, the CDF may be the same as that shown in FIG. 9B , which in the figure is for a particular cumulative distribution function, P(z)).
- Step 133 uses Equation 1 to determine the angle of ⁇ .
- the area of interest A is calculated, in step 134 , by using the angle of ⁇ and the known geometry of the LUT space, as shown in FIGS. 10A through 10D .
- the inverse of the desired CDF, namely P ⁇ 1 (k), is evaluated, by step 135 , at the fractional area of A/n 2 . This result provides the gray level value z at element (x, y) of the virtual LUT.
- the method 130 loops back to step 134 and continues the process until each pixel for the output image is determined.
- the output from the fusion has good image quality.
- the output image quality may be further improved by adjusting the CDF of P(z) in Equation 2.
- additional complexity may be added to the method which may require a LUT to evaluate P ⁇ 1 (k).
- the LUT in FIG. 12B is the worst approximation to a uniform distribution that the algebraic approach produces. This is because the area of interest runs directly along a diagonal and every element along this diagonal is identically rounded. Even with this much variation from a uniformly distributed LUT, the method described produces very good imagery, and the gray levels are at most at a difference of 1 from what they would be if the histogram were exactly uniform.
- FIGS. 14 and 15 Also included in each figure is a histogram of each LUT. Notice that the histograms are approximately uniform. It will be appreciated that expanding the algebraic uniform fusion to higher bit-depths tends to have similar histogram shapes. Thus, for the sake of simplicity only 4-bit LUTs are shown.
Abstract
Description
-
- determining a mix-ratio, α, between the first and second input images;
- determining an angle φ based on the mix-ratio of α, as follows:
-
- extending a diagonal line at the angle of φ between a vertical axis and a horizontal axis in the LUT, in which the vertical axis, x, includes a gray level value from the first input image, and the horizontal axis, y, includes a gray level value from the second input image and the diagonal line passes through a position (x, y) at the angle φ with respect to the vertical axis;
- computing an area A included within the horizontal and vertical axes and the diagonal line,
- determining the gray level value, defined as z, at position (x, y) for the pixel of the output image using the following equation:
z=P −1(k=A/(n 2)) - where, n represents the maximum gray level of both the first input image and the second input image. The value k varies between 0 and 1.
-
- forming a gradient from dark gray levels to light gray levels along the angle φ with respect to the vertical axis.
n=2β−1.
v=y+l (5)
u=v tan(φ) (6)
A 1=0.5 uv (7)
a=max(v−n,0) (8)
b=a tan(φ) (9)
A 2=0.5ab (10)
c=max(u−n,0) (11)
A 3=0.5cd (13)
A=A 1−(A 2 +A 3) (14)
Claims (16)
z=P −1(k=A/(n 2))
Priority Applications (1)
| Application Number | Priority Date | Filing Date | Title |
|---|---|---|---|
| US12/846,086 US8600190B1 (en) | 2010-07-29 | 2010-07-29 | Method for combining two image data sets using fixed distribution |
Applications Claiming Priority (1)
| Application Number | Priority Date | Filing Date | Title |
|---|---|---|---|
| US12/846,086 US8600190B1 (en) | 2010-07-29 | 2010-07-29 | Method for combining two image data sets using fixed distribution |
Publications (1)
| Publication Number | Publication Date |
|---|---|
| US8600190B1 true US8600190B1 (en) | 2013-12-03 |
Family
ID=49640815
Family Applications (1)
| Application Number | Title | Priority Date | Filing Date |
|---|---|---|---|
| US12/846,086 Active 2032-07-10 US8600190B1 (en) | 2010-07-29 | 2010-07-29 | Method for combining two image data sets using fixed distribution |
Country Status (1)
| Country | Link |
|---|---|
| US (1) | US8600190B1 (en) |
Cited By (1)
| Publication number | Priority date | Publication date | Assignee | Title |
|---|---|---|---|---|
| CN113538311A (en) * | 2021-07-22 | 2021-10-22 | 浙江赫千电子科技有限公司 | Image fusion method based on human eye subjective visual effect vehicle-mounted redundant camera |
Citations (13)
| Publication number | Priority date | Publication date | Assignee | Title |
|---|---|---|---|---|
| US5187747A (en) * | 1986-01-07 | 1993-02-16 | Capello Richard D | Method and apparatus for contextual data enhancement |
| US5818528A (en) * | 1994-10-25 | 1998-10-06 | United Parcel Service Of America | Automatic electronic camera for label image capture |
| US6259472B1 (en) * | 1996-06-20 | 2001-07-10 | Samsung Electronics Co., Ltd. | Histogram equalization apparatus for contrast enhancement of moving image and method therefor |
| US6343159B1 (en) * | 1998-12-23 | 2002-01-29 | Xerox Corporation | Method and apparatus for modeling and reconstruction of halftoned images |
| US6735330B1 (en) * | 2000-10-17 | 2004-05-11 | Eastman Kodak Company | Automatic digital radiographic bright light |
| US6785425B1 (en) * | 1999-03-28 | 2004-08-31 | Ramot At Tel-Aviv University Ltd. | Method and system for compression of images |
| US20060251200A1 (en) * | 2005-02-25 | 2006-11-09 | Miller Martin T | Measuring components of jitter |
| US20070076948A1 (en) * | 2005-09-30 | 2007-04-05 | Pitney Bowes Incorporated | Method and system for optimizing print-scan simulations |
| US20070136012A1 (en) * | 2005-10-18 | 2007-06-14 | Lecroy Corporation | Estimating bit error rate performance of signals |
| US7359573B2 (en) * | 2002-11-07 | 2008-04-15 | Samsung Electronics Co., Ltd. | Contrast compensation apparatus and method thereof |
| US7388998B2 (en) * | 2003-07-04 | 2008-06-17 | Ed-Tech Co., Ltd. | Apparatus and method for controlling brightness of moving image signals in real time |
| US7512268B2 (en) * | 2005-02-22 | 2009-03-31 | Texas Instruments Incorporated | System and method for local value adjustment |
| US7925113B2 (en) * | 2007-04-27 | 2011-04-12 | Hewlett-Packard Development Company, L.P. | Generating compound images having increased sharpness and reduced noise |
-
2010
- 2010-07-29 US US12/846,086 patent/US8600190B1/en active Active
Patent Citations (13)
| Publication number | Priority date | Publication date | Assignee | Title |
|---|---|---|---|---|
| US5187747A (en) * | 1986-01-07 | 1993-02-16 | Capello Richard D | Method and apparatus for contextual data enhancement |
| US5818528A (en) * | 1994-10-25 | 1998-10-06 | United Parcel Service Of America | Automatic electronic camera for label image capture |
| US6259472B1 (en) * | 1996-06-20 | 2001-07-10 | Samsung Electronics Co., Ltd. | Histogram equalization apparatus for contrast enhancement of moving image and method therefor |
| US6343159B1 (en) * | 1998-12-23 | 2002-01-29 | Xerox Corporation | Method and apparatus for modeling and reconstruction of halftoned images |
| US6785425B1 (en) * | 1999-03-28 | 2004-08-31 | Ramot At Tel-Aviv University Ltd. | Method and system for compression of images |
| US6735330B1 (en) * | 2000-10-17 | 2004-05-11 | Eastman Kodak Company | Automatic digital radiographic bright light |
| US7359573B2 (en) * | 2002-11-07 | 2008-04-15 | Samsung Electronics Co., Ltd. | Contrast compensation apparatus and method thereof |
| US7388998B2 (en) * | 2003-07-04 | 2008-06-17 | Ed-Tech Co., Ltd. | Apparatus and method for controlling brightness of moving image signals in real time |
| US7512268B2 (en) * | 2005-02-22 | 2009-03-31 | Texas Instruments Incorporated | System and method for local value adjustment |
| US20060251200A1 (en) * | 2005-02-25 | 2006-11-09 | Miller Martin T | Measuring components of jitter |
| US20070076948A1 (en) * | 2005-09-30 | 2007-04-05 | Pitney Bowes Incorporated | Method and system for optimizing print-scan simulations |
| US20070136012A1 (en) * | 2005-10-18 | 2007-06-14 | Lecroy Corporation | Estimating bit error rate performance of signals |
| US7925113B2 (en) * | 2007-04-27 | 2011-04-12 | Hewlett-Packard Development Company, L.P. | Generating compound images having increased sharpness and reduced noise |
Non-Patent Citations (1)
| Title |
|---|
| Gonzalez, Rafael C. et al., "Digital Image Processing," Prentice Hall, New Jersey, pp. 598-600, 2002. |
Cited By (2)
| Publication number | Priority date | Publication date | Assignee | Title |
|---|---|---|---|---|
| CN113538311A (en) * | 2021-07-22 | 2021-10-22 | 浙江赫千电子科技有限公司 | Image fusion method based on human eye subjective visual effect vehicle-mounted redundant camera |
| CN113538311B (en) * | 2021-07-22 | 2024-01-23 | 浙江赫千电子科技有限公司 | Image fusion method of vehicle-mounted redundant camera based on subjective visual effect of human eyes |
Similar Documents
| Publication | Publication Date | Title |
|---|---|---|
| US9454810B2 (en) | Correcting chrominance values based onTone-mapped luminance values | |
| US7940997B2 (en) | Method and apparatus for enhancing contrast | |
| CN109410126B (en) | Tone mapping method of high dynamic range image with detail enhancement and brightness self-adaption | |
| US8666156B2 (en) | Image-based backgrounds for images | |
| US8605105B2 (en) | Image processing apparatus and method for enhancing depth perception | |
| CN102203829B (en) | Method and device for generating a depth map | |
| US9030469B2 (en) | Method for generating depth maps from monocular images and systems using the same | |
| CN109767386A (en) | A kind of rapid image super resolution ratio reconstruction method based on deep learning | |
| US7317844B1 (en) | Tonal balancing of multiple images | |
| US8374428B2 (en) | Color balancing for partially overlapping images | |
| US20150138312A1 (en) | Method and apparatus for a surround view camera system photometric alignment | |
| CN107133914B (en) | Apparatus for generating three-dimensional color image and method for generating three-dimensional color image | |
| CN107409221A (en) | Signal shaping approaches | |
| US20030174887A1 (en) | Apparatus and method to enhance a contrast using histogram matching | |
| US8831372B2 (en) | Image processing device, image processing method and storage medium storing image processing program | |
| US8665262B2 (en) | Depth map enhancing method | |
| US10810707B2 (en) | Depth-of-field blur effects generating techniques | |
| CN108604302B (en) | Adaptive Bilateral (BL) filtering for computer vision | |
| US9280811B2 (en) | Multi-scale large radius edge-preserving low-pass filtering | |
| CN108184122A (en) | Image reversible information hidden method and device based on multiple linear regression | |
| JP5362130B2 (en) | Image processing method and apparatus therefor | |
| US8600190B1 (en) | Method for combining two image data sets using fixed distribution | |
| CN108171651B (en) | Image alignment method based on multi-model geometric fitting and layered homography transformation | |
| CN116681636B (en) | Light infrared and visible light image fusion method based on convolutional neural network | |
| CN106575434A (en) | Image processing device, image capturing device, image processing method, and program |
Legal Events
| Date | Code | Title | Description |
|---|---|---|---|
| AS | Assignment |
Owner name: ITT MANUFACTURING ENTERPRISES, INC., DELAWARE Free format text: ASSIGNMENT OF ASSIGNORS INTEREST;ASSIGNORS:D'ORAZIO, ANGELA MARIE;BRODEUR, KENNETH MICHAEL;REEL/FRAME:024760/0907 Effective date: 20100728 |
|
| AS | Assignment |
Owner name: EXELIS, INC., VIRGINIA Free format text: ASSIGNMENT OF ASSIGNORS INTEREST;ASSIGNOR:ITT MANUFACTURING ENTERPRISES, LLC (FORMERLY KNOWN AS ITT MANUFACTURING ENTERPRISES, INC.);REEL/FRAME:027604/0001 Effective date: 20111028 |
|
| STCF | Information on status: patent grant |
Free format text: PATENTED CASE |
|
| AS | Assignment |
Owner name: HARRIS CORPORATION, FLORIDA Free format text: MERGER;ASSIGNOR:EXELIS INC.;REEL/FRAME:039362/0534 Effective date: 20151223 |
|
| FPAY | Fee payment |
Year of fee payment: 4 |
|
| MAFP | Maintenance fee payment |
Free format text: PAYMENT OF MAINTENANCE FEE, 8TH YEAR, LARGE ENTITY (ORIGINAL EVENT CODE: M1552); ENTITY STATUS OF PATENT OWNER: LARGE ENTITY Year of fee payment: 8 |