US8433472B2 - Event-driven data mining method for improving fault code settings and isolating faults - Google Patents
Event-driven data mining method for improving fault code settings and isolating faults Download PDFInfo
- Publication number
- US8433472B2 US8433472B2 US12/850,058 US85005810A US8433472B2 US 8433472 B2 US8433472 B2 US 8433472B2 US 85005810 A US85005810 A US 85005810A US 8433472 B2 US8433472 B2 US 8433472B2
- Authority
- US
- United States
- Prior art keywords
- parameter identification
- identification data
- vehicle
- serviced
- current
- Prior art date
- Legal status (The legal status is an assumption and is not a legal conclusion. Google has not performed a legal analysis and makes no representation as to the accuracy of the status listed.)
- Active, expires
Links
Images


Classifications
-
- G—PHYSICS
- G05—CONTROLLING; REGULATING
- G05B—CONTROL OR REGULATING SYSTEMS IN GENERAL; FUNCTIONAL ELEMENTS OF SUCH SYSTEMS; MONITORING OR TESTING ARRANGEMENTS FOR SUCH SYSTEMS OR ELEMENTS
- G05B23/00—Testing or monitoring of control systems or parts thereof
- G05B23/02—Electric testing or monitoring
- G05B23/0205—Electric testing or monitoring by means of a monitoring system capable of detecting and responding to faults
- G05B23/0218—Electric testing or monitoring by means of a monitoring system capable of detecting and responding to faults characterised by the fault detection method dealing with either existing or incipient faults
- G05B23/0224—Process history based detection method, e.g. whereby history implies the availability of large amounts of data
- G05B23/024—Quantitative history assessment, e.g. mathematical relationships between available data; Functions therefor; Principal component analysis [PCA]; Partial least square [PLS]; Statistical classifiers, e.g. Bayesian networks, linear regression or correlation analysis; Neural networks
Definitions
- An embodiment relates generally to identifying detection of faults and anomalies in the service repair data.
- DTCs Diagnostic trouble codes
- the service diagnostic tools retrieves DTCs from a vehicle processor memory and are used to determine the fault in the vehicle.
- Each of the processors in the vehicle includes a memory that stores DTCs when the vehicle experiences a fault and is detected.
- the service technician can review the current or history of any DTCs for determining the root cause in the vehicle.
- DTCs are alphanumeric codes that are used to identify a fault that occurs in various components within the vehicle.
- Such DTCs are related to various electrical vehicle functions that include, but are not limited to, engine operation, emissions, braking, powertrain, safety, and steering.
- Each subsystem may have its own on-board processor for monitoring faults of the subsystem operation or a processor may be responsible for monitoring faults for a plurality of subsystems. When the subsystem processor detects a fault, one or more DTCs are generated.
- the DTCs assist the service technician in pinpointing the area of concern.
- DTCs are retrieved by the service technician with the aid of a scan tool.
- the DTC provides assistance to the technician in pinpointing the area of concern, the DTC does not provide definitive information as to what exactly caused the problem.
- a DTC indicates a fault either in a specific component, circuit connecting component to the control module or in the control module itself. Now, it is still up to the technician to identify the root cause by performing further electrical circuit tests, utilize analytical reasoning, prior experience, or a best guess.
- DTCs provides diagnostics only up to certain extent, additional diagnostic resolution could be obtained only via performing additional field tests and collecting additional operating parameter data from the vehicle.
- the algorithm generating the DTC may have an error in and provide an incorrect diagnostic to the technician.
- the DTCs may exhibit intermittent behavior which is hard to fix by technicians due to absence of the DTC setting operating conditions. Intermittent behavior of faults is those instances when a fault is triggered and recorded; however, the fault conditions cannot be repeated at the service repair center.
- the scan tool may further retrieve on-board diagnostic operating parameter identifiers (PIDs) for determining specific information output by a sensor or similar device.
- PIDs diagnostic operating parameter identifiers
- a PID code is an operating parameter of a component that is recorded via the scan tool which is transmitted by reading from the communication bus of the vehicle.
- One of the devices on the communication bus recognizes the PID code for which it is responsible and sends back information relating to the PID code for which further details relating to one or more of the devices sensing data relating to the detected fault.
- the number of PIDs relating to a DTC may be quite numerous and a service personnel randomly analyzing the PID codes is time consuming as well as burdensome.
- An advantage of an embodiment is the detection of errors in diagnostic software algorithms utilizing operating parameter identifier (PIDs) data.
- PIDs operating parameter identifier
- a determination may be made whether the fault relates to the identified circuit currently being tested and serviced utilizing the PIDs.
- the technique described herein can analyze available PIDs, categorize PIDs into informative or non-informative categories, detect fault conditions from the categories, determine whether an error exists in the diagnostic algorithm, determine the key PIDs responsible for characterizing the intermittent DTCs and determine whether the fault relates to the identified circuit tested.
- An embodiment contemplates a parameter identification-based fault isolation technique.
- a diagnostic software routine is executed for identifying diagnostic trouble codes used to detect faults in a circuit of a current serviced vehicle.
- the diagnostic software routine retrieves parameter identification data relating to the circuit identified with the detected fault.
- Parameter identification data of prior serviced vehicles is obtained on a computer.
- the parameter identification data is retrieved from the prior serviced vehicles that include vehicles having same vehicle specifications as the current serviced vehicle under substantially similar operating conditions as the current serviced vehicle.
- the parameter identification data of the prior serviced vehicles are grouped into a plurality of clusters based on mutual dependence to one another.
- a joint probability distribution is determined as a function of a mutual dependence of the parameter identification data of the prior serviced vehicles.
- Parameter identification data of the current serviced vehicle is selected having coherence to the parameter identification data from the prior serviced vehicles.
- a mutual dependence of the parameter identification data of the current serviced vehicle is projected onto the corresponding joint probability distribution.
- An anomaly in the parameter identification data of the current serviced vehicle is detected in response to the probability distribution of parameter identification data being outside of a predetermined variance.
- the detected anomaly represents at least one of an error in the diagnostic software routine or an intermittent occurrence of a respective diagnostic trouble code.
- At least one of the diagnostic software routine or a component associated with the intermitted occurrence of the respective diagnostic trouble code is modified to correct the error.
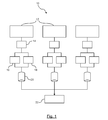
- FIG. 1 is a block diagram of a diagnostic repair reporting system.
- FIG. 2 is a flowchart of a method for an anomaly and fault classification technique.
- FIG. 3 is a scree plot for identifying principal components for use in clustering and divergence analysis.
- FIGS. 4 a - 4 c are silhouette plots for identifying properly grouped clusters.
- FIG. 5 is a distribution density plot for PID training dataset.
- FIG. 6 is an exemplary distribution density plot for PID test data indicating coherence between the datasets.
- FIG. 7 is an exemplary distribution density plot for PID test data indicating non-coherence between the datasets.
- FIG. 8 is an exemplary bar graph illustrating a high KL divergence.
- FIG. 9 is an exemplary bar graph illustrating a low KL divergence.
- the diagnostic repair reporting system 10 includes a plurality of service centers 12 for reporting diagnostic trouble codes (DTCs) obtained from servicing vehicles.
- DTCs diagnostic trouble codes
- repair data is retrieved from the service shops.
- Original equipment manufacturers such as automotive companies, maintain an online repair reporting system.
- the vehicles are brought to a service shop, such as a service department at a dealership.
- the technicians will run a diagnostic check on the vehicle using a scan tool 14 that communicates with one or more processors in the vehicle (e.g. engine control module).
- processors in the vehicle e.g. engine control module
- Each of the processors in the vehicle includes a memory or utilizes remote memory for storing DTCs 16 when the vehicle experiences a problem and an error code is recorded.
- DTCs 16 are alphanumeric codes that are used to identify a problem that occurs in various components in the vehicle. Such DTCs 16 may be related to various vehicle functions that include, but are not limited to, engine operation, emissions, braking, powertrain, and steering. Each subsystem may have its own on-board processor for monitoring faults of the subsystem operation or a processor may be responsible for monitoring faults for a plurality of subsystems.
- DTCs 16 When the subsystem processor detects a fault, one or more DTCs 16 are generated.
- the DTCs 16 are stored in the processor's memory and are later retrieved by the service technician when tested.
- the DTCs 16 assist the service technician in pinpointing the area of concern.
- the service technician enters a mode on the scan tool 14 requesting retrieval of DTCs 16 stored for a current or past driving cycle.
- the scan tool 16 may also be used to retrieve the operating parameter identifiers (PIDs) 18 which are recorded at the time of DTC is triggered and recorded by the on-board processors.
- PIDs operating parameter identifiers
- the health of the subsystems is typically monitored by a plurality (e.g., thousands) of operating PIDs 18 which are continuously collected using various sensors and diagnostic software routines contained in the on-board processors.
- the PIDs 18 are collected from freeze frame data, which is a set of limited number of instances when the DTC occurred.
- the information in the PIDs 18 may include data concerning its operating condition (e.g., ratio of the air-fuel mixture is provided so that a determination may be made whether the ratio is within a minimum and maximum value).
- the DTCs 16 and PIDs 18 are collected and stored in a plurality of storage devices 20 which may be retrieved for later analysis.
- An analysis tool 22 is in communication with the storage devices 20 for retrieving all or a portion of the service data containing the DTCs 16 and PIDs 18 of prior serviced vehicles to assist in identifying root causes of a current serviced vehicle.
- the analysis tool 22 may include a computer, laptop, handheld wireless processing device, or similar device that store data and execute the diagnostic routines as described herein.
- the methodology described herein provides a data-driven technique to systematically analyze the PIDs, and in the absence of any anomaly, classify faults within the automotive system. That is, a determination is made whether the fault described by the test data belongs to a fault described in a training data analysis utilizing historical data which will be described in detail later. PIDs that show similar trends in variation are described as coherent. As a result, clusters are formed utilizing coherent PIDs after identifying coherence among the PIDs in a training phase. After clusters are formed, a comparative analysis of the behavior of PIDs belonging to a same cluster between the training data and the test data can now be used for anomaly detection.
- the technique executed includes a training phase that utilizes historical serviced data and a testing phase that uses both the current service data and historical service data to detect the fault.
- FIG. 2 illustrates a flowchart of a broad overview of the training phase portion and testing portion to the fault detection technique.
- step 30 several patterns of PID data are retrieved from previously service vehicles.
- a pattern as described herein is a group of PID values for a specific vehicle and specific DTC. For example, if a specific vehicle had a specific DTC that was triggered, then at the time when DTC is triggered, the onboard processor records respective sensor values (PIDs) such as vehicle speed, throttle angle, engine coolant temperature, ambient temperature.
- PIDs sensor values
- the training data retrieved is from vehicles having the same vehicle specifications as the current serviced vehicle.
- DTCs that are determined to be intermittent are preferably identified and tagged as an intermittent DTC by the off-board diagnostic tool.
- a set of heuristic guidelines may be set up in the diagnostic tool to identify when an intermittent DTC occurs and the identified intermittent DTC is thereafter tagged or labeled as an intermittent DTC for future analysis.
- step 31 PID data is preprocessed to categorize the PID data and eliminate unrelated and constant-valued PIDs using automotive domain knowledge.
- step 32 the data is analyzed for coherence across the various PID values using a data reduction technique which utilizes correlation and information-theoretic measures.
- a key assumption in the data reduction technique described herein is a presence of coherence among the PIDs.
- Coherence provides justification for forming the clusters of coherent PIDs such that PIDs in a same cluster have similar variation due to their respective coherence.
- Data reduction may be applied using Principal Component Analysis (PCA) and Independent Component Analysis (ICA) for reducing the data size and finding coherence among PID values.
- PCA Principal Component Analysis
- ICA Independent Component Analysis
- PCA identifies a linear combination of variables that best describe variability in the dataset.
- the linear combination of variables are calculated by an eigenvector decomposition of a covariance matrix of the PID data.
- Linear combination of variables which describes the most variability e.g., 90% of the total variance in the dataset
- PCA is effective only under the assumption that the data has Gaussian distribution which may not be true for automotive systems because there are several nonlinear processes which could generate non-Gaussian data.
- ICA is a non-linear technique to estimate statistically independent components from a data matrix. ICA is utilized for linear representation of non-Gaussian data so that the components are statistically independent, or as independent as possible. ICA is most effective in systems that are highly nonlinear where data is more likely to be non-Gaussian. Since data reduction has already been reduced utilizing PCA, ICA is applied to the PCA data output to check if any further reduction is possible.
- the redundancy determined by PCA and ICA shows the coherence present amongst the PIDs that can be utilized for fault detection in two approaches.
- the first approach reduces the number of PIDs and forms a data set with several-fold reduction in data size and then divides the PID data into as many clusters as the number of statistically independent components. Statistical Independence between two components implies that the value of one component does not depend on the value of the other.
- the second approach helps us in identifying anomalous PIDs by checking its statistical deviation with its expected cluster which is described below in step 32 .
- the vehicle system includes an H02S heater control bank.
- the HO2S heater performance bank and HO2S heater resistance circuit bank includes 1376 patterns.
- a resulting dataset for the both banks has dimensions 1376 ⁇ 253 where the dimension 253 represents the number of PIDs that consist of both binary and real-valued PIDs. From these, 42 PIDs are selected using the domain knowledge as discussed in step 30 .
- the resulting dataset has dimensions of 1376 ⁇ 42.
- FIG. 3 shows a scree plot used to identify principal components that are to be selected for clustering.
- the plot utilizes variance values on the y-axis and an index of the principal components on the x-axis. It is observed that a significant knee occurs at the 9 th principal component.
- the first 9 components are determined to account for substantially 90% of the total variance in the dataset. This implies that the data from the PIDs show major variation along 9 orthogonal directions. Utilizing an assumption that Principal Components in PCA with larger associated variance represent the targeted structure and those with lower variation represent noise, coherence in the data can be inferred.
- the components identified under PCA are further processed using ICA and the entropy of each latent independent component determined is estimated.
- clustering is performed to find the actual number of clusters and their consistency to represent the original data.
- Clustering involves an unsupervised technique of classifying unlabeled PID datasets into finite hidden data-structures depending on their proximity in some feature space.
- the PID data is unlabeled because the faults are not known before the analysis.
- the clustering involves selection of distinguishing features from a set of candidates and then transforming them to generate novel features from the original ones (e.g., proximity measures). The selected samples are then clustered according to their proximity in the transformed feature space. Once a proximity measure is chosen, the construction of a clustering criterion function makes the partition of clusters an optimization problem. The optimality of the clustering process can be verified by a Silhouette plot that measures the Silhouette width of a PID in a cluster.
- FIGS. 4 a - 4 c illustrate datasets of silhouette plots for respective clusters (e.g. clusters 1 - 5 ) based on mutual information between the PIDs.
- the horizontal width S w i of each respective bar in the chart varies from 1, which is good clustering, to ⁇ 1 which is inferior clustering.
- Clustering can be performed based on either distance measures or mutual information measures.
- Clustering based on distance may utilize Euclidean distance or Mindowski distance.
- Euclidean distance is a special case of the Minkowski distance.
- Minkowski distances The drawback of Minkowski distances is that the largest scaled feature tends to dominate other features. As a result, the data needs to be normalized before clustering. A comparison between syntactic and statistical measures of data clustering suggests that the later out performs the former.
- Clustering based on mutual information is another example of how to form clusters of PIDs.
- a mutual dependence between two PIDs if two PIDs have a high value of mutual information, then the two PIDs are assumed to have a high degree of dependence between them. PIDs having a high degree of mutual information are termed coherent and are grouped together.
- intermittent DTCs may be initially grouped as a class and non-intermittent DTCs may be grouped as another class.
- Mutual information between the classes may then be analyzed and clustered to determine the key PIDs which distinguishes the intermittent DTCs from non-intermittent DTCs.
- a distribution of similarity of PIDs in a cluster provides domain knowledge.
- datasets of silhouette plots are illustrated for respective clusters (e.g. clusters 1 - 5 ) based on mutual information between the PIDs.
- Each horizontal bar corresponds to a PID and every contiguous set of bars represents a cluster along the y-axis.
- the clusters are grouped 1-5 along the y-axis.
- the x-axis represents a Silhouette value.
- the length of each horizontal bar (S w i —Silhouette width) is a measure of a tendency of a respective PID to belong to the cluster it is in.
- the mutual information is measured to characterize the coherence amongst the PIDs.
- the distribution of the coherence is further characterized by plotting the distribution density functions and mutual information for each cluster.
- An example of a plot for a respective cluster for a training dataset is shown in FIG. 5 .
- the x-axis represents similarity values using mutual information whereas the y-axis represents a distribution function for the respective cluster.
- step 34 information groups are generated.
- Information groups are generated by randomly selecting one PID from each cluster.
- any singleton PID i.e., a single PID that doesn't belong to a cluster
- Information content of the information group is a measurable used to determine the joint entropy of the PIDs within each respective information group.
- the information groups are used to determine the divergence of the PIDs which will be discussed in detail later. The divergence of the PIDs is used for determining fault classification.
- step 35 the anomaly and fault detection process utilizing the current vehicle test data set is initiated.
- a presence of anomalies is first determined, and then fault classification is determined.
- a fault is characterized by applying the joint probability distribution to the PIDs in its entirety. The state of the system under a fault is described by the values of the PIDs, and therefore, is a function of all PIDs across all clusters.
- a joint probability distribution of the independent components of all PIDs is determined in the training phase.
- Fault classification can be performed by determining the Kulback-Leibler divergence (KL divergence) between the joint probability of the independent components in the training set PIDs and that of the PIDs in the testing set.
- KL divergence quantifies the proximity between two probability distribution functions.
- step 36 several patterns of PID data are retrieved from the current serviced vehicle.
- a respective test PID from the current serviced vehicle is identified.
- the respective PID from the current serviced vehicle is analyzed by applying an anomaly detection technique to detect if an anomaly is present.
- the distribution of mutual information between the PIDs data for the historical data (i.e., prior serviced vehicles) and test data of the current serviced vehicle are determined. If the mutual information distribution is similar, then the determination made is that the PID is not anomalous.
- the KL divergence between the test data and training data low, then the low divergence indicates that the fault belongs to the modeled class.
- a dissimilarity between the mutual information distributions indicates a presence of anomalous PIDs and a high value of divergence indicates that the fault does not belong to the targeted fault class.
- Fault detection is executed by estimating a divergence between a joint probability distributions of the PIDs observed from the current serviced vehicle within that of the joint probability distribution of the prior serviced vehicles.
- the generation of a DTC may not always indicate the root cause of the fault as the DTCs are generated based on a diagnostic routine which follows predetermined logical or hard decisions.
- anomalies may be detected by analyzing the PIDs in clusters formed previously in the training phase.
- any variation in one parameter should be accompanied by similar variations in all other coherent parameters under normal conditions.
- the distance and mutual information between those PIDs should remain the same for any later instance of the fault. If any of the PIDs are anomalous, then the respective PID will not remain coherent with other PIDs in its cluster as the distance of this PID with respect to others in the same cluster will differ from its previously estimated values. Therefore, a determination is first made as to whether anomalies exist in the data before determining whether the fault belongs to the targeted class
- the mutual information of the PID being tested for an anomaly with respect to others in an associated cluster of the training data set are projected onto the already computed distribution density functions of the training data set. For example, PID-values for a Mass Air Flow (MAF) sensor of the current serviced vehicle are recorded.
- the PID-values for the MAF sensor are grouped in cluster-1 which has 12 different PIDs.
- the first step is to compute the mutual information of the MAF output PID value with respect to the 11 other PID values and then project each of them to obtain the distribution function of the MAF cluster-1.
- the process is repeated by selecting random sets of 50 patterns each time.
- FIG. 6 shows a plot of the estimated distribution function versus the mutual information of this PID with respect to the other PIDs for the current serviced vehicle.
- the plot shown in FIG. 6 is similar to the MAF sensor plot in FIG. 5 , and therefore, the divergence is low.
- the similarity between the test data plot ( FIG. 6 ) and the training data plot ( FIG. 5 ) indicates that there is coherence with the other PIDs in cluster- 1 so that the respective PID is not anomalous. This process has to be repeated for all PIDs in the testing dataset.
- FIG. 7 illustrates an example of a plot where the estimated probability distribution function of the testing data set does not show similarity to the training data set.
- the dissimilarity indicates that the respective PID tested is anomalous. As a result, the dissimilarity indicates that there is an error in the diagnostic software algorithm.
- An anomaly as mentioned above may include a PID which has incorrect values or may include a PID associated with an intermittent DTC as described earlier.
- the DTCs that were identified as intermittent that are maintained in the dataset of a cluster are projected onto the already computed distribution density function of the training data set. In the same manner as discussed above, a comparison is made to determine if the divergence is low or the divergence is high.
- a low divergence between the PIDs associated with the intermittent DTCs and the PIDs associated with the non-intermittent DTCs indicates coherence so that the respective PID is identified as normal whereas high divergence indicates that the PID cluster is anomalous.
- the probability density plots may include a line graph, a bar plot, or a scatter plot.
- step 38 a determination is made whether any of the projected values are high (i.e., substantially similar to the plotted probability distribution function of the training data set). If the determination is that the projected values are high, then the determination is made that the no anomalies exist in the PID data in step 39 . The routine then proceeds to step 42 to determine if more PIDs require analysis.
- step 38 determines whether the projected values are low. If the determination made in step 38 that the projected values are low, then the determination is made that anomalies exist in the PID data in step 40 . All information groups containing the respective PID are removed from the list in step 41 . Moreover, the determination may be made that an error exists within the diagnostic algorithm given the presence of the anomaly.
- step 42 a determination is made whether more PIDs require testing. If more PIDs require testing, then a return is made to step 37 to initiate testing of additional PIDs. In no additional PIDs require testing, then for those PIDs where no anomaly exists, the routine proceeds to step 43 .
- step 43 the fault classification technique is initiated.
- the information groups generated in step 34 are used to determine a divergence between the test data and the training data.
- any set of PID values of the respective fault should have a similar joint probability distribution function of their independent components. Therefore, the KL divergence between the joint probability distributions of the modeled fault and test data is determined. If the determination is made that the KL divergence is low, then the fault is classified to the circuit being tested. If the determination is made that the KL divergence is high, then the fault is not attributed to the circuit being tested.
- step 43 an information group having no anomalous PIDs and the highest information content is selected.
- step 44 the KL divergence is determined for the PIDs of the selected information group between the training data set and the test data set.
- step 45 a determination is made whether the KL divergence is high.
- FIG. 8 illustrates a plot illustrating a high KL divergence. A high KL divergence indicates that the fault is not in the tested circuit and the technician should look to other circuits to test.
- FIG. 9 illustrates a plot illustrating a low KL divergence. The KL divergence is represented by the x-axis and a frequency count is represented by the y-axis. A low KL divergence indicates that the fault is in the tested circuit and the technician should continue to test for faults in this circuit. If the determination is made in step 45 that the KL divergence is high, then the determination is made in step 46 that the fault does not belong to the circuit tested. If the determination is made in step 45 that the KL divergence is low, then the determination is made in step 47 that the fault belongs to the circuit tested. In step 48 , the routine is terminated.
Abstract
Description
Claims (18)
Priority Applications (3)
| Application Number | Priority Date | Filing Date | Title |
|---|---|---|---|
| US12/850,058 US8433472B2 (en) | 2010-08-04 | 2010-08-04 | Event-driven data mining method for improving fault code settings and isolating faults |
| DE102011108678.5A DE102011108678B8 (en) | 2010-08-04 | 2011-07-27 | Event-driven data mining method for improving error code settings and isolating errors |
| CN201110222293.4A CN102375452B (en) | 2010-08-04 | 2011-08-04 | Event-driven data mining method for improving fault code settings and isolating faults |
Applications Claiming Priority (1)
| Application Number | Priority Date | Filing Date | Title |
|---|---|---|---|
| US12/850,058 US8433472B2 (en) | 2010-08-04 | 2010-08-04 | Event-driven data mining method for improving fault code settings and isolating faults |
Publications (2)
| Publication Number | Publication Date |
|---|---|
| US20120035803A1 US20120035803A1 (en) | 2012-02-09 |
| US8433472B2 true US8433472B2 (en) | 2013-04-30 |
Family
ID=45556743
Family Applications (1)
| Application Number | Title | Priority Date | Filing Date |
|---|---|---|---|
| US12/850,058 Active 2031-08-11 US8433472B2 (en) | 2010-08-04 | 2010-08-04 | Event-driven data mining method for improving fault code settings and isolating faults |
Country Status (3)
| Country | Link |
|---|---|
| US (1) | US8433472B2 (en) |
| CN (1) | CN102375452B (en) |
| DE (1) | DE102011108678B8 (en) |
Cited By (11)
| Publication number | Priority date | Publication date | Assignee | Title |
|---|---|---|---|---|
| US20120065833A1 (en) * | 2009-04-06 | 2012-03-15 | Honda Motor Co., Ltd. | Diagnosis apparatus for assisting a trouble reproduction and a method for presenting data for reproducing trouble |
| US20130079971A1 (en) * | 2011-09-23 | 2013-03-28 | Sudarshan Raghunathan | Systems and methods for processing vehicle data to report performance data interchangeably |
| US20130159240A1 (en) * | 2011-12-19 | 2013-06-20 | GM Global Technology Operations LLC | Method and system for root cause analysis and quality monitoring of system-level faults |
| CN106813926A (en) * | 2015-12-01 | 2017-06-09 | 现代自动车株式会社 | For the method for diagnosing faults of vehicle |
| US20170351937A1 (en) * | 2016-06-03 | 2017-12-07 | Siemens Healthcare Gmbh | System and method for determining optimal operating parameters for medical imaging |
| US20180075672A1 (en) | 2016-08-12 | 2018-03-15 | Snap-On Incorporated | Method and system for providing diagnostic filter lists |
| US10176186B2 (en) | 2015-12-11 | 2019-01-08 | Tata Consultancy Services Limited | Systems and methods for detecting matching content in code files |
| US10248490B2 (en) | 2015-10-15 | 2019-04-02 | Tata Consultancy Services Limited | Systems and methods for predictive reliability mining |
| US10269191B2 (en) | 2016-08-12 | 2019-04-23 | Snap-On Incorporated | Method and system for displaying PIDs based on a PID filter list |
| US10319377B2 (en) | 2016-03-15 | 2019-06-11 | Tata Consultancy Services Limited | Method and system of estimating clean speech parameters from noisy speech parameters |
| US11798325B2 (en) | 2020-12-09 | 2023-10-24 | Cummins Inc. | Fault isolation using on-board diagnostic (OBD) capability data |
Families Citing this family (9)
| Publication number | Priority date | Publication date | Assignee | Title |
|---|---|---|---|---|
| US9165413B2 (en) | 2013-06-03 | 2015-10-20 | Honda Motor Co., Ltd. | Diagnostic assistance |
| US9524592B2 (en) | 2013-06-03 | 2016-12-20 | Honda Motor Co., Ltd. | Driving analytics |
| US9037572B2 (en) | 2013-06-03 | 2015-05-19 | Honda Motor Co., Ltd. | Event driven snapshots |
| DE102013110151A1 (en) * | 2013-09-16 | 2015-04-02 | Airbus Defence and Space GmbH | A method of detecting an error in an array, detection device and missile |
| US20160163130A1 (en) * | 2014-12-08 | 2016-06-09 | Ford Global Technologies, Llc | Method and Apparatus for Connected Vehicle System Wear Estimation and Maintenance Scheduling |
| US10380557B2 (en) * | 2015-07-31 | 2019-08-13 | Snap-On Incorporated | Methods and systems for clustering of repair orders based on alternative repair indicators |
| JP6633966B2 (en) * | 2016-04-27 | 2020-01-22 | 本田技研工業株式会社 | Electronic manual display method and electronic manual control device |
| CN108848072B (en) * | 2018-05-25 | 2021-04-27 | 东南大学 | Vehicle-mounted CAN bus abnormality detection method based on relative entropy |
| CN112785109A (en) * | 2019-11-11 | 2021-05-11 | 国网天津市电力公司 | Power grid equipment fault analysis method and system based on regulation cloud |
Citations (12)
| Publication number | Priority date | Publication date | Assignee | Title |
|---|---|---|---|---|
| US20050114743A1 (en) * | 2002-07-19 | 2005-05-26 | Moorhouse Timothy J. | Fault diagnosis system |
| US20050265607A1 (en) * | 2004-05-13 | 2005-12-01 | Proximex | Multimodal high-dimensional data fusion for classification and identification |
| US20080004840A1 (en) * | 2004-04-21 | 2008-01-03 | Pattipatti Krishna R | Intelligent model-based diagnostics for system monitoring, diagnosis and maintenance |
| US20080004764A1 (en) * | 2006-06-30 | 2008-01-03 | Manokar Chinnadurai | Diagnostics data collection and analysis method and apparatus to diagnose vehicle component failures |
| WO2008140381A1 (en) * | 2007-05-14 | 2008-11-20 | Volvo Technology Corporation | Remote diagnosis modelling |
| US20100082197A1 (en) * | 2008-09-30 | 2010-04-01 | Honeywell International Inc. | Intermittent fault detection and reasoning |
| US7715961B1 (en) * | 2004-04-28 | 2010-05-11 | Agnik, Llc | Onboard driver, vehicle and fleet data mining |
| US20110035094A1 (en) * | 2009-08-04 | 2011-02-10 | Telecordia Technologies Inc. | System and method for automatic fault detection of a machine |
| US20110123100A1 (en) * | 2009-11-25 | 2011-05-26 | International Business Machines Corporation | Predicting States of Subjects |
| US20110172874A1 (en) * | 2010-01-13 | 2011-07-14 | Gm Global Technology Operations, Inv. | Fault prediction framework using temporal data mining |
| US20110238259A1 (en) * | 2010-03-25 | 2011-09-29 | Gm Global Technology Operations, Inc. | V2X-Connected Cooperative Diagnostic & Prognostic Applications in Vehicular AD HOC Networks |
| US20120136913A1 (en) * | 2010-03-15 | 2012-05-31 | Duong Tuan A | System and method for cognitive processing for data fusion |
Family Cites Families (4)
| Publication number | Priority date | Publication date | Assignee | Title |
|---|---|---|---|---|
| US20070050105A1 (en) * | 2005-08-31 | 2007-03-01 | Spx Corporation | Remote diagnostic data collections for automotive scan tools |
| DE102007010978A1 (en) * | 2007-03-05 | 2008-09-11 | Volkswagen Ag | Electrical system's diagnosis supporting device for use in motor vehicle, has evaluation unit to produce list of incorrect components that are sorted based on dependence value, and output/supply unit to display or provide list |
| DE102008020380B4 (en) * | 2008-04-23 | 2010-04-08 | Siemens Aktiengesellschaft | Method for computer-aided learning of a control and / or regulation of a technical system |
| DE102013110151A1 (en) * | 2013-09-16 | 2015-04-02 | Airbus Defence and Space GmbH | A method of detecting an error in an array, detection device and missile |
-
2010
- 2010-08-04 US US12/850,058 patent/US8433472B2/en active Active
-
2011
- 2011-07-27 DE DE102011108678.5A patent/DE102011108678B8/en active Active
- 2011-08-04 CN CN201110222293.4A patent/CN102375452B/en active Active
Patent Citations (12)
| Publication number | Priority date | Publication date | Assignee | Title |
|---|---|---|---|---|
| US20050114743A1 (en) * | 2002-07-19 | 2005-05-26 | Moorhouse Timothy J. | Fault diagnosis system |
| US20080004840A1 (en) * | 2004-04-21 | 2008-01-03 | Pattipatti Krishna R | Intelligent model-based diagnostics for system monitoring, diagnosis and maintenance |
| US7715961B1 (en) * | 2004-04-28 | 2010-05-11 | Agnik, Llc | Onboard driver, vehicle and fleet data mining |
| US20050265607A1 (en) * | 2004-05-13 | 2005-12-01 | Proximex | Multimodal high-dimensional data fusion for classification and identification |
| US20080004764A1 (en) * | 2006-06-30 | 2008-01-03 | Manokar Chinnadurai | Diagnostics data collection and analysis method and apparatus to diagnose vehicle component failures |
| WO2008140381A1 (en) * | 2007-05-14 | 2008-11-20 | Volvo Technology Corporation | Remote diagnosis modelling |
| US20100082197A1 (en) * | 2008-09-30 | 2010-04-01 | Honeywell International Inc. | Intermittent fault detection and reasoning |
| US20110035094A1 (en) * | 2009-08-04 | 2011-02-10 | Telecordia Technologies Inc. | System and method for automatic fault detection of a machine |
| US20110123100A1 (en) * | 2009-11-25 | 2011-05-26 | International Business Machines Corporation | Predicting States of Subjects |
| US20110172874A1 (en) * | 2010-01-13 | 2011-07-14 | Gm Global Technology Operations, Inv. | Fault prediction framework using temporal data mining |
| US20120136913A1 (en) * | 2010-03-15 | 2012-05-31 | Duong Tuan A | System and method for cognitive processing for data fusion |
| US20110238259A1 (en) * | 2010-03-25 | 2011-09-29 | Gm Global Technology Operations, Inc. | V2X-Connected Cooperative Diagnostic & Prognostic Applications in Vehicular AD HOC Networks |
Cited By (24)
| Publication number | Priority date | Publication date | Assignee | Title |
|---|---|---|---|---|
| US9087421B2 (en) * | 2009-04-06 | 2015-07-21 | Honda Motor Co., Ltd. | Diagnosis apparatus which supports fault reproduction, and method of outputting fault reproduction data |
| US20120065833A1 (en) * | 2009-04-06 | 2012-03-15 | Honda Motor Co., Ltd. | Diagnosis apparatus for assisting a trouble reproduction and a method for presenting data for reproducing trouble |
| US20130079971A1 (en) * | 2011-09-23 | 2013-03-28 | Sudarshan Raghunathan | Systems and methods for processing vehicle data to report performance data interchangeably |
| US9262873B2 (en) * | 2011-09-23 | 2016-02-16 | Omnitracs, Llc | Systems and methods for processing vehicle data to report performance data interchangeably |
| US20130159240A1 (en) * | 2011-12-19 | 2013-06-20 | GM Global Technology Operations LLC | Method and system for root cause analysis and quality monitoring of system-level faults |
| US8732112B2 (en) * | 2011-12-19 | 2014-05-20 | GM Global Technology Operations LLC | Method and system for root cause analysis and quality monitoring of system-level faults |
| US10248490B2 (en) | 2015-10-15 | 2019-04-02 | Tata Consultancy Services Limited | Systems and methods for predictive reliability mining |
| CN106813926A (en) * | 2015-12-01 | 2017-06-09 | 现代自动车株式会社 | For the method for diagnosing faults of vehicle |
| CN106813926B (en) * | 2015-12-01 | 2019-12-27 | 现代自动车株式会社 | Fault diagnosis method for vehicle |
| US10176186B2 (en) | 2015-12-11 | 2019-01-08 | Tata Consultancy Services Limited | Systems and methods for detecting matching content in code files |
| US10319377B2 (en) | 2016-03-15 | 2019-06-11 | Tata Consultancy Services Limited | Method and system of estimating clean speech parameters from noisy speech parameters |
| US10074037B2 (en) * | 2016-06-03 | 2018-09-11 | Siemens Healthcare Gmbh | System and method for determining optimal operating parameters for medical imaging |
| US20170351937A1 (en) * | 2016-06-03 | 2017-12-07 | Siemens Healthcare Gmbh | System and method for determining optimal operating parameters for medical imaging |
| US10692307B2 (en) | 2016-08-12 | 2020-06-23 | Snap-On Incorporated | Method and system for providing diagnostic filter lists |
| US10269191B2 (en) | 2016-08-12 | 2019-04-23 | Snap-On Incorporated | Method and system for displaying PIDs based on a PID filter list |
| US9934624B2 (en) | 2016-08-12 | 2018-04-03 | Snap-On Incorporated | Method and system for providing diagnostic filter lists |
| US20180075672A1 (en) | 2016-08-12 | 2018-03-15 | Snap-On Incorporated | Method and system for providing diagnostic filter lists |
| US10692306B2 (en) | 2016-08-12 | 2020-06-23 | Snap-On Incorporated | Method and system for providing diagnostic filter lists |
| US10769870B2 (en) | 2016-08-12 | 2020-09-08 | Snap-On Incorporated | Method and system for displaying PIDs based on a PID filter list |
| US11403893B2 (en) | 2016-08-12 | 2022-08-02 | Snap-On Incorporated | Method and system for providing diagnostic filter lists |
| US11403895B2 (en) | 2016-08-12 | 2022-08-02 | Snap-On Incorporated | Method and system for providing diagnostic filter lists |
| US11694491B2 (en) | 2016-08-12 | 2023-07-04 | Snap-On Incorporated | Method and system for providing diagnostic filter lists |
| US11887413B2 (en) | 2016-08-12 | 2024-01-30 | Snap-On Incorporated | Method and system for displaying PIDs based on a PID filter list |
| US11798325B2 (en) | 2020-12-09 | 2023-10-24 | Cummins Inc. | Fault isolation using on-board diagnostic (OBD) capability data |
Also Published As
| Publication number | Publication date |
|---|---|
| US20120035803A1 (en) | 2012-02-09 |
| DE102011108678B8 (en) | 2019-05-16 |
| DE102011108678A1 (en) | 2012-03-22 |
| DE102011108678B4 (en) | 2019-02-07 |
| CN102375452A (en) | 2012-03-14 |
| CN102375452B (en) | 2014-06-18 |
Similar Documents
| Publication | Publication Date | Title |
|---|---|---|
| US8433472B2 (en) | Event-driven data mining method for improving fault code settings and isolating faults | |
| EP3441947B1 (en) | System and method for remaining useful life determination | |
| EP3460611B1 (en) | System and method for aircraft fault detection | |
| US20170284896A1 (en) | System and method for unsupervised anomaly detection on industrial time-series data | |
| EP2015186B1 (en) | Diagnostic systems and methods for predictive condition monitoring | |
| US8509985B2 (en) | Detecting anomalies in fault code settings and enhancing service documents using analytical symptoms | |
| US7539597B2 (en) | Diagnostic systems and methods for predictive condition monitoring | |
| CN114065613A (en) | Multi-working-condition process industrial fault detection and diagnosis method based on deep migration learning | |
| EP3105644B1 (en) | Method of identifying anomalies | |
| US20130073260A1 (en) | Method for anomaly detection/diagnosis, system for anomaly detection/diagnosis, and program for anomaly detection/diagnosis | |
| US20120290879A1 (en) | Method and device for monitoring the state of a facility | |
| US10032322B2 (en) | Validation tool for an aircraft engine monitoring system | |
| AU2002246994A1 (en) | Diagnostic systems and methods for predictive condition monitoring | |
| US10775270B2 (en) | System and method for monitoring a turbomachine, with indicator merging for the synthesis of an alarm confirmation | |
| WO2014199177A1 (en) | Early warning and prevention system | |
| Pirasteh et al. | Interactive feature extraction for diagnostic trouble codes in predictive maintenance: A case study from automotive domain | |
| US20150120214A1 (en) | Non-regression method of a tool for designing a monitoring system of an aircraft engine | |
| Gopalakrishnan et al. | IIoT Framework Based ML Model to Improve Automobile Industry Product. | |
| Routray et al. | Data reduction and clustering techniques for fault detection and diagnosis in automotives | |
| Singh et al. | Predictive reliability mining for early warnings in populations of connected machines | |
| Körper et al. | Harmonizing Heterogeneous Diagnostic Data of a Vehicle Fleet for Data-Driven Analytics | |
| CN117671818B (en) | Management system for vehicle data | |
| CN116244651A (en) | System and method for detecting manufacturing anomalies | |
| WO2022241447A1 (en) | System and method for generating predictive failure and maintenance models for a vehicle fleet | |
| JP2017204107A (en) | Data analytic method, and system and device therefor |
Legal Events
| Date | Code | Title | Description |
|---|---|---|---|
| AS | Assignment |
Owner name: GM GLOBAL TECHNOLOGY OPERATIONS, INC., MICHIGAN Free format text: ASSIGNMENT OF ASSIGNORS INTEREST;ASSIGNORS:SINGH, SATNAM;ROUTRAY, AUROBINDA;RAJAGURU, APARNA;REEL/FRAME:024788/0001 Effective date: 20100722 |
|
| AS | Assignment |
Owner name: WILMINGTON TRUST COMPANY, DELAWARE Free format text: SECURITY AGREEMENT;ASSIGNOR:GM GLOBAL TECHNOLOGY OPERATIONS, INC.;REEL/FRAME:025327/0156 Effective date: 20101027 |
|
| AS | Assignment |
Owner name: GM GLOBAL TECHNOLOGY OPERATIONS LLC, MICHIGAN Free format text: CHANGE OF NAME;ASSIGNOR:GM GLOBAL TECHNOLOGY OPERATIONS, INC.;REEL/FRAME:025781/0333 Effective date: 20101202 |
|
| FEPP | Fee payment procedure |
Free format text: PAYOR NUMBER ASSIGNED (ORIGINAL EVENT CODE: ASPN); ENTITY STATUS OF PATENT OWNER: LARGE ENTITY |
|
| STCF | Information on status: patent grant |
Free format text: PATENTED CASE |
|
| AS | Assignment |
Owner name: GM GLOBAL TECHNOLOGY OPERATIONS LLC, MICHIGAN Free format text: RELEASE BY SECURED PARTY;ASSIGNOR:WILMINGTON TRUST COMPANY;REEL/FRAME:034287/0159 Effective date: 20141017 |
|
| FPAY | Fee payment |
Year of fee payment: 4 |
|
| MAFP | Maintenance fee payment |
Free format text: PAYMENT OF MAINTENANCE FEE, 8TH YEAR, LARGE ENTITY (ORIGINAL EVENT CODE: M1552); ENTITY STATUS OF PATENT OWNER: LARGE ENTITY Year of fee payment: 8 |