US8260730B2 - Method of, and system for, classification count adjustment - Google Patents
Method of, and system for, classification count adjustment Download PDFInfo
- Publication number
- US8260730B2 US8260730B2 US11/080,098 US8009805A US8260730B2 US 8260730 B2 US8260730 B2 US 8260730B2 US 8009805 A US8009805 A US 8009805A US 8260730 B2 US8260730 B2 US 8260730B2
- Authority
- US
- United States
- Prior art keywords
- classifier
- estimate
- items
- class
- count
- Prior art date
- Legal status (The legal status is an assumption and is not a legal conclusion. Google has not performed a legal analysis and makes no representation as to the accuracy of the status listed.)
- Active, expires
Links
- 238000000034 method Methods 0.000 title claims description 25
- 230000000295 complement effect Effects 0.000 claims description 8
- 238000011156 evaluation Methods 0.000 claims description 8
- 238000002790 cross-validation Methods 0.000 claims description 5
- 239000011159 matrix material Substances 0.000 claims description 5
- 108090000623 proteins and genes Proteins 0.000 claims description 5
- 238000004590 computer program Methods 0.000 claims description 4
- 238000000926 separation method Methods 0.000 claims description 3
- 230000006399 behavior Effects 0.000 description 31
- 238000012360 testing method Methods 0.000 description 8
- 238000010586 diagram Methods 0.000 description 7
- 239000010749 BS 2869 Class C1 Substances 0.000 description 4
- 239000010750 BS 2869 Class C2 Substances 0.000 description 4
- 238000004422 calculation algorithm Methods 0.000 description 2
- 238000012549 training Methods 0.000 description 2
- 238000010200 validation analysis Methods 0.000 description 2
- 238000004364 calculation method Methods 0.000 description 1
- 238000007418 data mining Methods 0.000 description 1
- 230000007423 decrease Effects 0.000 description 1
- 238000010801 machine learning Methods 0.000 description 1
- 238000005259 measurement Methods 0.000 description 1
- 238000012986 modification Methods 0.000 description 1
- 230000004048 modification Effects 0.000 description 1
- 230000035945 sensitivity Effects 0.000 description 1
Images


Classifications
-
- G—PHYSICS
- G06—COMPUTING; CALCULATING OR COUNTING
- G06F—ELECTRIC DIGITAL DATA PROCESSING
- G06F18/00—Pattern recognition
- G06F18/20—Analysing
- G06F18/21—Design or setup of recognition systems or techniques; Extraction of features in feature space; Blind source separation
-
- G—PHYSICS
- G06—COMPUTING; CALCULATING OR COUNTING
- G06F—ELECTRIC DIGITAL DATA PROCESSING
- G06F18/00—Pattern recognition
- G06F18/20—Analysing
- G06F18/21—Design or setup of recognition systems or techniques; Extraction of features in feature space; Blind source separation
- G06F18/217—Validation; Performance evaluation; Active pattern learning techniques
Definitions
- the present invention relates, generally, to the field of classification and, more particularly, to a method of, and a system for, classification count adjustment.
- an automated classifier may be used that predicts which of the data items belong to a particular subset of interest.
- an automated classifier may be used to estimate how many documents in a business news wire are related to a particular company of interest.
- Another example is where a news company uses a classifier to determine under which major topic each incoming news article should be filed. In order to determine the percentage of articles filed under one particular category last year, one could count how many articles were predicted by the classifier to belong in this category. This is advantageous so that the relative level of interest in a particular topic can be tracked.
- the results of the automated categorization are then aggregated to give overall estimates of the number of articles in each category area. These results are then used to report to media relations teams.
- Another application of automated classifiers includes estimating how many genes in a database are predicted to exhibit some property. It can be extremely important to scientists and business analysts to obtain the best possible estimates.
- trained classifiers may be used for the purpose of counting how many items in a new (unlabeled) batch fall into several classes. In such applications the actual counts are of particular interest rather than the individual classifications of each item.
- a problem with the present automated classifiers is that, in practice, the automated classifiers that assign items or subsets of data to categories make mistakes.
- Of primary concern in this invention is the actual number of items in a particular category and not so much what each item assigned to the category involves. In other words, it is advantageous to know how frequent a particular category is without necessarily knowing about the category of any particular record.
- the mistakes made by the classifier do not always cancel one another out (so-called false positives being offset by so-called false negatives) as the misclassifications made by automatic classifiers may skew the observed frequency of items assigned by the classifier to a category either way (from what the frequency actually should be if all items were assigned correctly) depending on the calibration and training of the classifier. This results in bias in the estimate of the size of a category of interest.
- a classification count adjustment system for adjusting a count estimate of items in a dataset classified into a class.
- the system includes a count estimate produced by a classifier of the number of items in the dataset classified into the class and one or more measures of behavior of the classifier indicating the ability of the classifier to classify the items into the class.
- the system includes a processor for computing an adjusted estimate based on the count estimate by the classifier and the one or more measures of behavior.
- FIG. 1A is a schematic diagram of components of a classification count adjustment system according to an embodiment of the invention.
- FIG. 1B is a schematic diagram showing examples of measures of behavior of a classifier according to an embodiment of the invention.
- FIG. 1C is a flow diagram showing a method of adjusting a count estimate of items in a dataset classified in a class according to an embodiment
- FIG. 2 is an example of a contingency table pertaining to a classifier to estimate a precision and a recall of a classifier according to an embodiment of the invention
- FIG. 3 is a flow diagram showing how to calculate the precision and recall measures from FIG. 2 according to an embodiment of the invention
- FIG. 4 is a schematic diagram showing the calculation of one or more measures using a calibration dataset according to an embodiment of the invention.
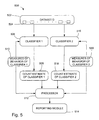
- FIG. 5 is a schematic diagram of components of a classification count adjustment system using two classifiers according to another embodiment of the invention.
- reference numeral 100 generally designates a classification count adjustment system, in accordance with an embodiment, for adjusting a count estimate of items in a dataset D classified into a class.
- the system 100 adjusts a count estimate 108 provided by a classifier 106 of a number of items 104 in dataset 102 classified into a class C.
- the classifier 106 is applied to the items 104 in the dataset 102 and then counts the number of items 104 in dataset 102 that are classified in the class C, to produce the count estimate.
- TPR true positive rate
- FPR false positive rate
- TPR(C) is also known as a recall of the classifier for class C.
- the classifier 106 is applied to each item 104 of the dataset 102 which then provides the count estimate 108 for class C.
- One way in which the classifier 106 can provide the count estimate is by counting, or tallying, the number of items 104 in the dataset 102 assigned to class C by the classifier 106 .
- a processor 112 computes an adjusted estimate for class C based on the one or more measures of behavior 110 and the count estimate 108 .
- An adjusted count estimate is then provided by reporting module 114 .
- FIG. 1B Apart from a true positive rate 116 and a false positive rate 118 , other measures of behavior of the classifier 106 are shown in FIG. 1B and include an accuracy 120 , a precision 122 , a recall 124 , a true negative rate 126 , a false negative rate 128 , a confusion matrix 130 , an information gain 132 , a bi-normal separation 134 , a lift 136 , an F-measure 138 , and an area under an ROC curve 140 . Additional measures of behavior of classifiers may be obtained, including permutations of those measures mentioned above. The methods by which all of these measures are to be computed are known to those persons skilled in the art.
- FIG. 1C shows a flow diagram of a method of adjusting a count estimate 108 of items 104 in a dataset 102 classified in a class.
- the method includes providing the count estimate 108 produced by classifier 106 of the number of items 104 in the dataset 102 classified into the class at step 142 .
- one or more measures of behavior 110 of the classifier 106 are used to indicate the ability of the classifier 106 to classify the items 104 into the class.
- the adjusted estimate is computed based on the count estimate 108 by classifier 106 and the one or more measures of behavior 110 .
- a computer program is used to control a computer to adjust the count estimate 108 of items 104 in dataset 102 classified in a class.
- the computer program is operable to control the computer to carry out the method steps 142 , 144 and 146 above.
- the result of applying the classifier 106 to the dataset 102 is a tally or count estimate produced by the classifier 106 of the number of items 104 out of the dataset 102 that are classified into the class C.
- the processor 112 then computes an adjusted estimate based on the count estimate and the one or more measures of behavior of the classifier.
- the Dataset D 102 consists of 1000 items and the classifier 106 classifies 250 of the items 104 into class C.
- Adjusted Estimate Count estimate*Precision( C )/Recall( C ).
- Precision(C) and Recall(C) are measures of behavior of classifiers known to persons skilled in the art and used commonly in the field of data mining.
- the reporting module 114 then reports the adjusted estimate.
- Bounds on the Adjusted estimate may be computed in other ways as well, for example by assuming that FPR(C) is equal to zero or that TPR(C) is equal to 1.
- the reporting module 114 may report these bounds as LowerBound and Upperbound.
- the classifier 106 detects 100 items of class C in the data set D 102 . If it is determined that classifier 106 has a 97% precision but only 45% recall then the count of 100 items has a lower bound of 97 and an upper bound of 222 with the adjusted estimate being 215 using the equations defined above for the adjusted estimate, lower bound and upper bound. Thus, it can be seen that it is most likely that there are at least 97 items, at most 222 items and most probably 215 items in class C.
- FIG. 2 An example of how the measures of behavior may be calculated is shown with reference to FIG. 2 .
- classifier 106 has assessed 100 items for which it is known whether they truly should be assigned to class C in the dataset D 102 and it was observed to have the performance as shown in FIG. 2 , such that items that were classified in or assigned to class C by the classifier 106 amounted to 13 and items that were not classified in class C amounted to 87.
- this 2 ⁇ 2 contingency table it is shown that items that should have been classified in or assigned to class C should have amounted to 10 and those that should not have been classified in class C amounted to 90. From FIG. 2 it is seen that precision equals 8/13 equal to 61.5% and recall equals 8/10 equal to 80%.
- the measures of behavior may be obtained as follows.
- a calibration set of items is obtained for which it is know whether they should be assigned to class C. For example, this may be determined by a human expert for each item in the calibration set.
- the classifier 106 is applied to each of the items in the calibration set.
- a tally is made whether the classifier 106 correctly or incorrectly assigns the item to class C and whether the item should be assigned to class C. Examples of such tallies are shown in the table in FIG. 2 .
- one or more measures of behavior of the classifier 106 are computed based on the resulting tallies.
- precision and recall and true positive rate and false positive rate measures can be computed at step 308 based on these figures and these may then be input to the processor 112 in order to obtain the adjusted estimate.
- a calibration set of items (such that it is known for the items in the calibration set whether each of the items truly belongs to class C) provides one way to compute one or more measures of behavior of the classifier 106 .
- a count estimate 108 can be adjusted by the classification count adjustment system 100 for any dataset 102 , regardless of whether it is known for the items 104 in the dataset 102 whether each item truly belongs to class C.
- a complement adjusted estimate may also be calculated by the processor 112 representative of the number of items in the complement of the class which may then be reported by the reporting module 114 .
- the measures of behavior of the classifier 106 may be obtained by these possibilities:
- the measures may be given as an input, for example, provided with the classifier 106 or processor 112 .
- the measures may be computed by applying a labeled calibration dataset T 402 ( FIG. 4 ), that has each item labeled with the particular class C, to classifier 404 (which is the same as classifier 106 in FIG. 1A ).
- Such calibration dataset T 402 is commonly referred to as a “test set”.
- a record 406 contains an indication as to whether an item in dataset 402 is classified in class C by the classifier 404 .
- Each record 406 is recorded by recording module 410 by applying the classifier 404 to the item.
- classifier 404 is applied to each item of calibration dataset T 402 .
- an evaluation module 408 computes the one or more measures of behavior, such as true positive rate, false positive rate, Precision, and Recall based on the dataset T 402 and the record 406 .
- the measures of behavior can be computed directly from a confusion matrix by known techniques.
- An estimator module 412 may be used for estimating the proportion of items in a population belonging to the class based on the adjusted estimate.
- the dataset may be a subset of the population and the proportion estimate may be based on the size of the dataset and the size of the population.
- a classifier 106 is presented with a dataset D 102 containing 1,000 items originating from a population of 100,000 items.
- the count estimate 108 of class C in the dataset D 102 is 120 items.
- the adjusted count estimate computed by the classification count adjustment system 100 and reported by the reporting module 114 is 140 items.
- the measures of behavior can be estimated by known manner cross validation systems which can be performed by the evaluation module 408 .
- the training dataset T 402 is partitioned into ten equal portions, and, for each of the ten portions P, the algorithm A is applied to the other nine portions to train a classifier M′, which is then applied to P and the tallies in a confusion matrix CM are incremented appropriately.
- true positive rate, false positive rate, precision, recall, and other measures of behavior can be computed directly from CM by known manner computations.
- reference numeral 500 generally designates a classification count adjustment system, in accordance with another embodiment, for adjusting a count estimate of items in a dataset D classified into two classes.
- the system 500 adjusts a count estimate 508 produced by a classifier 506 of a number of items 504 in dataset 502 classified into a first class C 1 .
- the classifier 506 is applied to the items 504 in the dataset 502 and then the number of items 504 in dataset 502 that are classified in the class C 1 are counted, to produce the count estimate 508 .
- the system 500 adjusts a count estimate 518 produced by a second classifier 516 of a number of items 504 in dataset 502 classified into a second class C 2 .
- the second classifier 516 is applied to the items 504 in dataset 502 and then counts the number of items 504 in dataset 502 that are classified in the class C 2 , to produce the count estimate 518 .
- One or more measures of behavior 510 of the first classifier 506 and one or more measures of behavior 520 of the second classifier 516 are used to indicate the ability of respective classifiers 506 and 516 to classify the items 504 into classes C 1 and C 2 .
- Examples of the measures include a true positive rate, a false positive rate, a precision and recall.
- a processor 512 computes an adjusted count estimate for class C 1 based on the count estimate 508 and the one or more measures of behavior 510 and computes an adjusted count estimate for class C 2 based on the count estimate 518 and the one or more measures of behavior 520 .
- An adjusted count estimate for class C 1 , for class C 2 , or for both is then reported by reporting module 514 .
- the setting of the threshold of the classifier 106 optimizes confidence in the correctness of the adjustment. For example if the classifier 106 considers that an object has a probability of 80% of being a member of class X, it must be decided whether 80% is considered high enough to be called a “positive”. This leads to a trade off between true positives and false positives, that is, if the threshold is made higher, there will be fewer false positives but the number of true positives decreases as well as false negatives start to appear and vice versa.
- An optimal choice of threshold is based on the “cost” of a false positive or a false negative and the value of a true positive or a true negative taking into account the total number of positives and negatives in the population.
- threshold is not critical, as long as knowledge of the trade off, relating to a so-called ROC curve, is substantially accurate.
- a threshold can be set according to the judgment of the developer of the classifier, and the measures of behavior of the classifier can be computed accordingly, for example a true positive rate and a false positive rate.
- the classification count adjustment will use the resulting measures of behavior of the classifier to improve the estimates. This however is subject to the fact that there is confidence in where the ROC curve truly lies for the population that is being assessed.
- the choice of threshold may have a bearing on the accuracy of the results.
- ROC curve is an interpolation of a set of discrete measurements, each reflecting a particular choice of threshold and the resulting numbers of true positives, false negatives, true negatives, and false positives.
- the smoothness of the ROC curve is determined by the number of test cases on which the behavior of the classifier 106 is assessed. Given a particular set of test cases and their features and the behavior of the classifier 106 , an ROC curve (or a precision-recall curve) shows a trade off between the two axes. In the case of a single test set, this curve is plotted as follows:
- a natural extension is to pick a threshold that reflects a point on the convex hull of this step curve, which is regarded as an optimal surface.
- Another extension is to pick the threshold in an insensitive area, that is an area where the classifier scores of adjacent points are far apart so it takes substantial changes in the threshold to make cases go from a true positive to a false negative or from a true negative to a false positive.
- the recording module 410 records the score of the classifier 404 when applied to the items from the calibration dataset 402 in the record 406 .
- the evaluation module 408 then orders the items in the record 406 according to classifier score, interpreting the items as an ROC curve.
- the evaluation module 408 determines the setting of one or more parameters of the classifier 404 , such as a threshold that determines the minimal score required for the classifier 404 to classify an item from the dataset 402 into the class C, according to the record.
- Such a parameter for example said threshold
- the evaluation module 408 Given the determined setting of the one or more parameters of the classifier 404 , the evaluation module 408 further computes the one or more measures of behavior of the classifier 404 .
- the second part of the extension involves variability among multiple ROC curves.
- cross-validation or sampled validation for example when the test set is enormous, a better grasp on the variants of the ROC curve is possible.
- the embodiment provides improved accuracy in estimates of counts of items classified by a classifier in one or more classes by taking into account one or more measures of behavior of the classifier.
Abstract
Description
Adjusted Estimate=(Count estimate−FPR(C)*Total)/(TPR(C)−FPR(C))
where Total is the total number of
Adjusted Estimate=Count estimate*Precision(C)/Recall(C).
Precision(C) and Recall(C) are measures of behavior of classifiers known to persons skilled in the art and used commonly in the field of data mining.
LowerBound=count*Precision(C)
UpperBound=count/Recall(C)
where count is the count estimate produced by the
Precision=# items classified into class C that are truly in class C/# items classified into class C
Recall=# items classified into class C that are truly in class C/# items truly belonging to class C
Claims (35)
Priority Applications (1)
| Application Number | Priority Date | Filing Date | Title |
|---|---|---|---|
| US11/080,098 US8260730B2 (en) | 2005-03-14 | 2005-03-14 | Method of, and system for, classification count adjustment |
Applications Claiming Priority (1)
| Application Number | Priority Date | Filing Date | Title |
|---|---|---|---|
| US11/080,098 US8260730B2 (en) | 2005-03-14 | 2005-03-14 | Method of, and system for, classification count adjustment |
Publications (2)
| Publication Number | Publication Date |
|---|---|
| US20060206443A1 US20060206443A1 (en) | 2006-09-14 |
| US8260730B2 true US8260730B2 (en) | 2012-09-04 |
Family
ID=36972229
Family Applications (1)
| Application Number | Title | Priority Date | Filing Date |
|---|---|---|---|
| US11/080,098 Active 2029-04-23 US8260730B2 (en) | 2005-03-14 | 2005-03-14 | Method of, and system for, classification count adjustment |
Country Status (1)
| Country | Link |
|---|---|
| US (1) | US8260730B2 (en) |
Cited By (1)
| Publication number | Priority date | Publication date | Assignee | Title |
|---|---|---|---|---|
| US20080148106A1 (en) * | 2006-12-18 | 2008-06-19 | Yahoo! Inc. | Evaluating performance of binary classification systems |
Families Citing this family (9)
| Publication number | Priority date | Publication date | Assignee | Title |
|---|---|---|---|---|
| US7797282B1 (en) | 2005-09-29 | 2010-09-14 | Hewlett-Packard Development Company, L.P. | System and method for modifying a training set |
| US8744987B1 (en) * | 2006-04-19 | 2014-06-03 | Hewlett-Packard Development Company, L.P. | Count estimation via machine learning |
| US20080103849A1 (en) * | 2006-10-31 | 2008-05-01 | Forman George H | Calculating an aggregate of attribute values associated with plural cases |
| US9396254B1 (en) * | 2007-07-20 | 2016-07-19 | Hewlett-Packard Development Company, L.P. | Generation of representative document components |
| JP5025776B2 (en) * | 2010-09-28 | 2012-09-12 | 株式会社東芝 | Abnormality diagnosis filter generator |
| US9047278B1 (en) * | 2012-11-09 | 2015-06-02 | Google Inc. | Identifying and ranking attributes of entities |
| BR112017009015A2 (en) * | 2014-10-28 | 2017-12-26 | Twitter Inc | classifier sensitivity estimate for sparse topics |
| US10417579B2 (en) | 2015-09-25 | 2019-09-17 | Mcafee, Inc. | Multi-label classification for overlapping classes |
| US10679390B1 (en) * | 2016-07-19 | 2020-06-09 | Uber Technologies, Inc. | Confidence threshold determination for machine-learned labeling |
Citations (8)
| Publication number | Priority date | Publication date | Assignee | Title |
|---|---|---|---|---|
| US5333184A (en) * | 1992-05-06 | 1994-07-26 | At&T Bell Laboratories | Call message recording for telephone systems |
| US5452399A (en) * | 1992-06-19 | 1995-09-19 | United Parcel Service Of America, Inc. | Method and apparatus for input classification using a neuron-based voting scheme |
| US5930803A (en) | 1997-04-30 | 1999-07-27 | Silicon Graphics, Inc. | Method, system, and computer program product for visualizing an evidence classifier |
| US5989811A (en) * | 1994-09-29 | 1999-11-23 | Urocor, Inc. | Sextant core biopsy predictive mechanism for non-organ confined disease status |
| US6301579B1 (en) | 1998-10-20 | 2001-10-09 | Silicon Graphics, Inc. | Method, system, and computer program product for visualizing a data structure |
| US6460049B1 (en) | 1998-12-22 | 2002-10-01 | Silicon Graphics, Inc. | Method system and computer program product for visualizing an evidence classifier |
| US6728690B1 (en) | 1999-11-23 | 2004-04-27 | Microsoft Corporation | Classification system trainer employing maximum margin back-propagation with probabilistic outputs |
| US20040148330A1 (en) | 2003-01-24 | 2004-07-29 | Joshua Alspector | Group based spam classification |
-
2005
- 2005-03-14 US US11/080,098 patent/US8260730B2/en active Active
Patent Citations (10)
| Publication number | Priority date | Publication date | Assignee | Title |
|---|---|---|---|---|
| US5333184A (en) * | 1992-05-06 | 1994-07-26 | At&T Bell Laboratories | Call message recording for telephone systems |
| US5452399A (en) * | 1992-06-19 | 1995-09-19 | United Parcel Service Of America, Inc. | Method and apparatus for input classification using a neuron-based voting scheme |
| US5638491A (en) * | 1992-06-19 | 1997-06-10 | United Parcel Service Of America, Inc. | Method and apparatus for hierarchical input classification using a neural network |
| US5664067A (en) * | 1992-06-19 | 1997-09-02 | United Parcel Service Of America, Inc. | Method and apparatus for training a neural network |
| US5989811A (en) * | 1994-09-29 | 1999-11-23 | Urocor, Inc. | Sextant core biopsy predictive mechanism for non-organ confined disease status |
| US5930803A (en) | 1997-04-30 | 1999-07-27 | Silicon Graphics, Inc. | Method, system, and computer program product for visualizing an evidence classifier |
| US6301579B1 (en) | 1998-10-20 | 2001-10-09 | Silicon Graphics, Inc. | Method, system, and computer program product for visualizing a data structure |
| US6460049B1 (en) | 1998-12-22 | 2002-10-01 | Silicon Graphics, Inc. | Method system and computer program product for visualizing an evidence classifier |
| US6728690B1 (en) | 1999-11-23 | 2004-04-27 | Microsoft Corporation | Classification system trainer employing maximum margin back-propagation with probabilistic outputs |
| US20040148330A1 (en) | 2003-01-24 | 2004-07-29 | Joshua Alspector | Group based spam classification |
Cited By (3)
| Publication number | Priority date | Publication date | Assignee | Title |
|---|---|---|---|---|
| US20080148106A1 (en) * | 2006-12-18 | 2008-06-19 | Yahoo! Inc. | Evaluating performance of binary classification systems |
| US8554622B2 (en) * | 2006-12-18 | 2013-10-08 | Yahoo! Inc. | Evaluating performance of binary classification systems |
| US8655724B2 (en) * | 2006-12-18 | 2014-02-18 | Yahoo! Inc. | Evaluating performance of click fraud detection systems |
Also Published As
| Publication number | Publication date |
|---|---|
| US20060206443A1 (en) | 2006-09-14 |
Similar Documents
| Publication | Publication Date | Title |
|---|---|---|
| US8260730B2 (en) | Method of, and system for, classification count adjustment | |
| Bellotti et al. | Support vector machines for credit scoring and discovery of significant features | |
| US10095774B1 (en) | Cluster evaluation in unsupervised learning of continuous data | |
| US9721213B2 (en) | Information matching apparatus, method of matching information, and computer readable storage medium having stored information matching program | |
| US7904397B2 (en) | System and method for scalable cost-sensitive learning | |
| EP1739580B1 (en) | Categorization including dependencies between different category systems | |
| US8554715B2 (en) | Electronic document classification apparatus | |
| JP5120254B2 (en) | Clustering system and defect type determination apparatus | |
| US6574585B2 (en) | Method for improving robustness of weighted estimates in a statistical survey analysis | |
| US20080091627A1 (en) | Data Learning System for Identifying, Learning Apparatus, Identifying Apparatus and Learning Method | |
| US20110029463A1 (en) | Applying non-linear transformation of feature values for training a classifier | |
| CN110866030A (en) | Database abnormal access detection method based on unsupervised learning | |
| CN110991474A (en) | Machine learning modeling platform | |
| US20080103849A1 (en) | Calculating an aggregate of attribute values associated with plural cases | |
| Kuhn et al. | Measuring performance in classification models | |
| Lawi et al. | Classification of credit card default clients using LS-SVM ensemble | |
| WO2023284192A1 (en) | Method and device for training multi-disease referral model | |
| CN110209811B (en) | Automatic commodity classification method and system | |
| US8429098B1 (en) | Classification confidence estimating tool | |
| CN110189034A (en) | A kind of insider trading method of identification based on model-naive Bayesian | |
| KR102266950B1 (en) | Method of under-sampling based ensemble for data imbalance problem | |
| Wang et al. | Are crises predictable? a review of the early warning systems in currency and stock markets | |
| Farou et al. | A Comparative Study of Assessment Metrics for Imbalanced Learning | |
| CN116933187B (en) | Digital processing method and system for financial reimbursement bill | |
| Siswanto et al. | Salary Classification & Prediction based on Job Field and Location using Ensemble Methods |
Legal Events
| Date | Code | Title | Description |
|---|---|---|---|
| AS | Assignment |
Owner name: HEWLETT-PACKARD DEVELOPMENT COMPANY, L.P., TEXAS Free format text: ASSIGNMENT OF ASSIGNORS INTEREST;ASSIGNORS:FORMAN, GEORGE H.;SUERMONDT, HENRI JACQUES;REEL/FRAME:016391/0266;SIGNING DATES FROM 20050311 TO 20050314 Owner name: HEWLETT-PACKARD DEVELOPMENT COMPANY, L.P., TEXAS Free format text: ASSIGNMENT OF ASSIGNORS INTEREST;ASSIGNORS:FORMAN, GEORGE H.;SUERMONDT, HENRI JACQUES;SIGNING DATES FROM 20050311 TO 20050314;REEL/FRAME:016391/0266 |
|
| STCF | Information on status: patent grant |
Free format text: PATENTED CASE |
|
| AS | Assignment |
Owner name: HEWLETT PACKARD ENTERPRISE DEVELOPMENT LP, TEXAS Free format text: ASSIGNMENT OF ASSIGNORS INTEREST;ASSIGNOR:HEWLETT-PACKARD DEVELOPMENT COMPANY, L.P.;REEL/FRAME:037079/0001 Effective date: 20151027 |
|
| FPAY | Fee payment |
Year of fee payment: 4 |
|
| AS | Assignment |
Owner name: ENTIT SOFTWARE LLC, CALIFORNIA Free format text: ASSIGNMENT OF ASSIGNORS INTEREST;ASSIGNOR:HEWLETT PACKARD ENTERPRISE DEVELOPMENT LP;REEL/FRAME:042746/0130 Effective date: 20170405 |
|
| AS | Assignment |
Owner name: JPMORGAN CHASE BANK, N.A., DELAWARE Free format text: SECURITY INTEREST;ASSIGNORS:ENTIT SOFTWARE LLC;ARCSIGHT, LLC;REEL/FRAME:044183/0577 Effective date: 20170901 Owner name: JPMORGAN CHASE BANK, N.A., DELAWARE Free format text: SECURITY INTEREST;ASSIGNORS:ATTACHMATE CORPORATION;BORLAND SOFTWARE CORPORATION;NETIQ CORPORATION;AND OTHERS;REEL/FRAME:044183/0718 Effective date: 20170901 |
|
| AS | Assignment |
Owner name: MICRO FOCUS LLC, CALIFORNIA Free format text: CHANGE OF NAME;ASSIGNOR:ENTIT SOFTWARE LLC;REEL/FRAME:050004/0001 Effective date: 20190523 |
|
| MAFP | Maintenance fee payment |
Free format text: PAYMENT OF MAINTENANCE FEE, 8TH YEAR, LARGE ENTITY (ORIGINAL EVENT CODE: M1552); ENTITY STATUS OF PATENT OWNER: LARGE ENTITY Year of fee payment: 8 |
|
| AS | Assignment |
Owner name: MICRO FOCUS LLC (F/K/A ENTIT SOFTWARE LLC), CALIFORNIA Free format text: RELEASE OF SECURITY INTEREST REEL/FRAME 044183/0577;ASSIGNOR:JPMORGAN CHASE BANK, N.A.;REEL/FRAME:063560/0001 Effective date: 20230131 Owner name: NETIQ CORPORATION, WASHINGTON Free format text: RELEASE OF SECURITY INTEREST REEL/FRAME 044183/0718;ASSIGNOR:JPMORGAN CHASE BANK, N.A.;REEL/FRAME:062746/0399 Effective date: 20230131 Owner name: MICRO FOCUS SOFTWARE INC. (F/K/A NOVELL, INC.), WASHINGTON Free format text: RELEASE OF SECURITY INTEREST REEL/FRAME 044183/0718;ASSIGNOR:JPMORGAN CHASE BANK, N.A.;REEL/FRAME:062746/0399 Effective date: 20230131 Owner name: ATTACHMATE CORPORATION, WASHINGTON Free format text: RELEASE OF SECURITY INTEREST REEL/FRAME 044183/0718;ASSIGNOR:JPMORGAN CHASE BANK, N.A.;REEL/FRAME:062746/0399 Effective date: 20230131 Owner name: SERENA SOFTWARE, INC, CALIFORNIA Free format text: RELEASE OF SECURITY INTEREST REEL/FRAME 044183/0718;ASSIGNOR:JPMORGAN CHASE BANK, N.A.;REEL/FRAME:062746/0399 Effective date: 20230131 Owner name: MICRO FOCUS (US), INC., MARYLAND Free format text: RELEASE OF SECURITY INTEREST REEL/FRAME 044183/0718;ASSIGNOR:JPMORGAN CHASE BANK, N.A.;REEL/FRAME:062746/0399 Effective date: 20230131 Owner name: BORLAND SOFTWARE CORPORATION, MARYLAND Free format text: RELEASE OF SECURITY INTEREST REEL/FRAME 044183/0718;ASSIGNOR:JPMORGAN CHASE BANK, N.A.;REEL/FRAME:062746/0399 Effective date: 20230131 Owner name: MICRO FOCUS LLC (F/K/A ENTIT SOFTWARE LLC), CALIFORNIA Free format text: RELEASE OF SECURITY INTEREST REEL/FRAME 044183/0718;ASSIGNOR:JPMORGAN CHASE BANK, N.A.;REEL/FRAME:062746/0399 Effective date: 20230131 |
|
| MAFP | Maintenance fee payment |
Free format text: PAYMENT OF MAINTENANCE FEE, 12TH YEAR, LARGE ENTITY (ORIGINAL EVENT CODE: M1553); ENTITY STATUS OF PATENT OWNER: LARGE ENTITY Year of fee payment: 12 |