US8074207B1 - Application profiling - Google Patents
Application profiling Download PDFInfo
- Publication number
- US8074207B1 US8074207B1 US11/756,519 US75651907A US8074207B1 US 8074207 B1 US8074207 B1 US 8074207B1 US 75651907 A US75651907 A US 75651907A US 8074207 B1 US8074207 B1 US 8074207B1
- Authority
- US
- United States
- Prior art keywords
- instructions
- application
- executing
- state sample
- execution
- Prior art date
- Legal status (The legal status is an assumption and is not a legal conclusion. Google has not performed a legal analysis and makes no representation as to the accuracy of the status listed.)
- Active, expires
Links
Images


Classifications
-
- G—PHYSICS
- G06—COMPUTING; CALCULATING OR COUNTING
- G06F—ELECTRIC DIGITAL DATA PROCESSING
- G06F11/00—Error detection; Error correction; Monitoring
- G06F11/30—Monitoring
- G06F11/34—Recording or statistical evaluation of computer activity, e.g. of down time, of input/output operation ; Recording or statistical evaluation of user activity, e.g. usability assessment
- G06F11/3466—Performance evaluation by tracing or monitoring
- G06F11/3476—Data logging
-
- G—PHYSICS
- G06—COMPUTING; CALCULATING OR COUNTING
- G06F—ELECTRIC DIGITAL DATA PROCESSING
- G06F2201/00—Indexing scheme relating to error detection, to error correction, and to monitoring
- G06F2201/865—Monitoring of software
Definitions
- the present disclosure relates to profiling an application.
- Application profilers track and capture information about the execution of an application. Typically an application has to be specially compiled so that when the application is subsequently executed profiler information will be captured. Some application profilers operate in two steps, first capturing and storing profile data in an encoded file while an application is running. In a second step, subsequent to the application's execution, the encoded file can be decoded to derive human-readable profiler information. Thus, analysis of the profiler data occurs separately from the execution of the application. Alternatively, some profilers provide profiler data to another running process which decodes the profiler information as the application being profiled runs. However, the profiler data is limited to a subset of the information available in the application's running process.
- This specification describes technologies relating to profiling an application.
- one aspect of the subject matter described in this specification can be embodied in methods that include the actions of obtaining an application for execution.
- the application comprises a plurality of machine-independent first instructions. Regions of the first instructions that implement one or more programming language methods, functions, or flow control structures are identified.
- the first instructions are translated into corresponding machine-dependent second instructions for a target machine.
- the second instructions are instrumented to include sampling instructions for the identified regions.
- the sampling instructions are configured to cause generation of a state sample when an identified region is executed.
- Each state sample includes a time stamp and an identification of a currently executing method or function.
- the second instructions are executed in order to execute the application. During the executing each generated state sample is collected.
- Other embodiments of this aspect include corresponding systems, apparatus, and computer program products.
- Information based on the collected samples can be presented on a display device during execution of the application.
- the presenting can include presenting information regarding the execution time spent in each method or function.
- the presenting can include presenting information regarding memory allocation.
- Instrumenting can include inserting the sampling instructions into the second instructions at method or function entry points or backwards branches.
- Collecting each generated state samples can include determining if a time period has elapsed. A state sample is collected if the time period has elapsed. Collecting each state sample can include capturing a snapshot of a current execution stack and adding the snapshot to the set of samples.
- an indication that an object is being instantiated can be added to the collected samples when the object is instantiated.
- an indication that an object is being destroyed can be added to the collected samples when the object is destroyed.
- the collected samples can be ordered according to each sample's respective time stamp.
- Profiling data of an application is collected while the application is running.
- Profiling data is collected, processed and presented within the same process or threads as the running application being profiled.
- Profiling data can be stored and later accessed in off-line analysis. No synchronization or inter-process data marshalling is necessary.
- Profiling information is collected and presented interactively and on demand based on the needs of the profiler user.
- FIG. 1A is a screenshot of a presentation generated by an executing application.
- FIG. 1B is a screenshot of a presentation of profile information pertaining to the executing application.
- FIG. 2 is a block diagram showing a system for capturing state samples.
- FIG. 3 is a block diagram showing the generation of state samples.
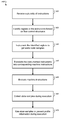
- FIG. 4 is a flowchart of a process for generating and presenting profile information based on collected state samples.
- FIG. 1A is a screenshot of a presentation 102 generated by an executing application.
- the executing application is an example of an application from which state samples can be collected.
- the operations of an application are specified by the application's particular sequence of instructions.
- the instructions of the executing application generate the presentation 102 , which includes animated bubbles 110 and fish 106 .
- the instructions that are executed cause the position of fish and bubbles to change position within a display area 112 .
- the application also allocates and deallocates resources (e.g., memory) to store values.
- the application may allocate memory used for storing properties of each of the fish 106 , such as appearance, position and direction.
- State samples which generally describe the execution of the application, are collected as operations of the application are carried out over the course of the application's execution. State samples can include information about the execution of the application, such as what part the application was executed at a particular point in time, for example. State samples can also include information about resource consumption (e.g., such as memory allocations or deallocations), which occur over the course of the application's execution.
- resource consumption e.g., such as memory allocations or deallocations
- FIG. 1B is a screenshot of a presentation of profile information 104 pertaining to the executing application.
- State samples collected from the executing application are used to derive a human-readable presentation of profile information 104 .
- the collection of state samples, the derivation of profile information, and the presentation of profile information 104 occurs during execution of the application.
- the collection of state samples and the display of profile information occurs in the same process or thread, for example, in which the application being profiled is executing.
- the execution of the application, collection of the state samples and derivation of profile information from the state samples can be managed by an application execution environment, discussed below.
- the presentation of profile information 104 includes information derived from state samples collected while the application is running.
- the profile information that is displayed can vary among implementations but generally includes information relating to the execution time of the application and memory events.
- the profile information can be used to compare the amount of execution time used to animate the fish in presentation 102 of FIG. 1 compared to the execution time used to animate the bubbles.
- allocating new memory, used by the executing application for representing a new fish in the presentation 102 can be presented a memory event in the profile information 104 (e.g., so that a user can observe the relative frequency of memory allocations (or deallocations) over time as the application executes).
- the presentation of profile information 104 is interactive thereby allowing a user to control the collection of state samples on demand while the application is executing. In some implementations, for example, users are able to start and stop some or all of state sample collection (e.g., cause only particular state samples to be collected for only particular parts of the application).
- the presentation of profile information 104 can also allow the user to control what profile information is presented. As shown, the presentation of profile information 104 can include buttons which can be selected to display information relating to application execution time 114 , memory usage 116 , or CPU (central processing unit) statistics 118 .
- the profile information display 104 presents information concerning the amount of time used to execute the application.
- the relative amount of processing time used to execute logical components of the application can be presented in a pie chart 120 .
- the pie chart 120 can be used to compare each component (e.g., instructions of the application, external libraries, system calls or memory management).
- one portion corresponds to the proportion of execution time used by system libraries such as those used to draw visual elements (e.g., fish 106 , bubbles 110 ) to the display area 112 .
- Another portion shows the proportion of execution time used to execute instructions of the application (rather than instructions of supporting libraries).
- Another portion corresponds to the proportion of execution time used managing memory (e.g., garbage collection or other memory management activities).
- each portion may correspond to the relative amount of time used to execute a method, subroutine, function, procedure, code block (or combination thereof) of the application.
- a first portion corresponds to a method concerning the repositioning of fish in the display area 112
- another portion corresponds to another method concerning the rendering of bubbles 110 in the display area 112 .
- memory usage information is presented as the chart 124 , illustrating the relative amount of memory used by components of the application. For example, one portion illustrates the proportion of memory used by the application, while another portion illustrates the proportion of unused memory.
- a timeline 126 can be used to plot the execution events 128 , such as memory allocations or method entries, over a particular period of time for which the application is executing.
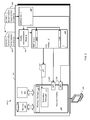
- FIG. 2 is a block diagram of a system 200 for capturing state samples.
- the system 200 includes a profiling agent 202 .
- the agent 202 generally includes instructions 208 that provide a user interface for presenting and interacting with profiler information as well as controlling the collection of state samples.
- the agent 202 and the application 204 can be represented as series of encoded instructions.
- the encoded instructions are platform independent instructions (e.g., bytecode, such as Adobe Flash® ActionScript bytecode, or source code), that are decoded, such as through interpretation or translation, and executed by an application execution environment 201 .
- the application execution environment 201 is a virtualization environment that works in conjunction with native services (e.g., an operating system) of a data processing apparatus to provide a consistent well-defined environment in which applications can be loaded and executed.
- the application execution environment typically includes facilities such as memory management (e.g., garbage collection), standard libraries, media decoders, user interface frameworks and input-output interfaces (e.g., display device 228 ).
- memory management e.g., garbage collection
- standard libraries e.g., media decoders
- user interface frameworks e.g., display device 228
- An application designed to run within an application execution environment can often be developed rapidly because developers can rely on the consistency of the application execution environment—even if the environment itself exists on widely varying platforms.
- the application execution environment can be a plug-in to a web browser or a standalone software program.
- One such application execution environment is the Adobe Flash Player available from Adobe Systems Incorporated of San Jose, Calif. Each application executed by the application execution environment can correspond to a Macromedia Flash (SWF) file, an ActionScript (AS) file or a Flash Video (FLV) file, for example.
- SWF Macromedia Flash
- AS ActionScript
- FLV Flash Video
- Another such application execution environment is the Java Virtual Machine available from Sun Microsystems Inc of Santa Clara, Calif.
- the profiling agent 202 requests that the application execution environment 201 both load and instrument the application 204 .
- the profiling agent 202 can be invoked with user input specifying the application 204 as the application to be profiled.
- the profiling agent 202 includes the application 204 (e.g., in a single file).
- the profiling agent 202 can reference configuration information (e.g., a configuration file) that specifies the application 204 to be instrumented.
- the application 204 can be specified using a application name, a file name or URL (universal resource locator) that identifies a file containing an encoded representation of the application 204 .
- the profiling agent 202 is, to the application execution environment 201 , like any other application and is loaded before the application 204 . In other implementations, the profiling agent 202 is a part of the application execution environment 201 rather than a separate application.
- the agent 202 requests (e.g., by way of application program interface (API) or other mechanism) that the application execution environment instrument the instructions of application 204 so that application 204 can be profiled (e.g., profile data collected).
- a profile instrumentation module 206 identifies regions of the instructions of the application 204 to which to add sampling instructions. For example, the regions 210 a and 210 b illustrate where sampling instructions can be inserted into the method 210 .
- Sampling instructions are instructions that, when executed, collect application state samples that capture a snapshot of application's execution state at the time of collection.
- the snapshot identifies the method executing at the time the state sample was collected.
- Other state information about the execution of the method can also be identified from the snapshot.
- other state information can include the method's call stack, local variables, global variables, member variables, instantiated objects.
- the state samples that capture snapshots can be used to access the state of the entire call stack of the executing method (e.g., the variables of any method in the call stack).
- Method information that is not based on execution state can also be derived from a state sample (e.g., the file in which the executing method is defined or the line number of the most-recently executed instruction).
- State samples occur as the application, including sampling instructions, execute. For example, state samples are collected synchronously with respect to an execution thread or process of the application—although collection can still occur within an execution thread of the application that is asynchronous with respect to other execution threads of the application. State samples are collected from each thread of a multi-threaded application as sampling instructions are executed in each thread.
- sampling instructions can be inserted into the instructions of the applications based on features of the instructions such as method entries, at method exits, and flow control structures. For example, a sampling instruction can be inserted at the beginning of an if, if-else, switch statement, or inside any loop (e.g., a for, while, foreach, or until loop), as illustrated by regions 210 a and 210 b . In some implementations, sampling instructions are inserted at any point where execution moves to an instruction in the sequence of instructions that has already been passed (e.g., a backward jump).
- the encoded instructions of the method 210 are instrumented before the instructions are translated into platform dependent instructions (e.g., machine code specific to a microprocessor) or interpreted by the application execution environment.
- the instrumented instructions can be translated into platform dependent instructions by a just-in-time (JIT) compiler 212 , which is used to translate the encoded instructions into platform dependent instructions for execution.
- JIT just-in-time
- the encoded instructions are instrumented after or during translation of an application's encoded representation. In general, any representation corresponding to the instructions of the application can be instrumented.
- An execution manager 220 coordinates execution of an application's instructions on the CPU 214 .
- the execution manager 220 can provide instrumented instructions, translated by the JIT compiler 212 , to the CPU 214 .
- the execution manager 220 can also communicate with the runtime profiler 224 .
- a state sample is collected only if a runtime profiling state flag is set to true. Conversely, if the profiling state flag is set to false, then state samples are not collected and profiling is effectively disabled.
- the profiling state flag can be manipulated (e.g., turned on or turned off) during the execution of the application. For example, the profiling flag can be toggled by the agent 202 or application 204 by way of an application execution environment API for toggling the profiling flag. In other implementations, the profiling flag can be set automatically based on pre-determined criteria.
- the system 200 includes memory 216 , which is used by the application to store information. For example, values used by the application 204 are stored in memory, and call frames corresponding to execution flow of the application are stored in a call stack.
- an executing application can request that portions of memory (e.g., heap memory) be allocated for the application to use (e.g., as an instantiation of a class as an object).
- an application can also request that portions of memory be deallocated (e.g., a deletion of an instantiated object).
- Such requests are typically received and managed by a memory manager 222 .
- the memory manager 222 carries out memory management operations for applications being executed in the application execution environment. These operations can include responding to allocation or deallocation requests by an application or reclaiming unused memory (e.g., garbage collection).
- each collected state sample is either a snapshot of the execution or indicates the occurrence of a memory event (e.g., a memory allocation or deallocation).
- State samples indicating the occurrence of a memory event can be collected by the memory manager 222 .
- the memory manager responds to memory allocation and deallocation requests by the currently executing application, the memory manager collects state samples indicating memory events.
- state sample collection is governed by a profiling state flag, the memory manager checks the flag to determine whether to collect samples.
- a request to profile an application e.g., by the agent 202 ) causes all memory related requests to be redirected to a profiling memory manager that collects state samples indicating that memory events have occurred.
- the runtime profiler 224 provides a mechanism accessing state samples.
- the runtime profiler 224 can be used to access state samples corresponding to snapshots or memory events.
- the runtime profiler 224 also provides profile information derived from the state samples such as CPU utilization, memory utilization, and the like.
- the runtime profiler 224 includes an API 226 that both the application 204 and the agent 202 can use.
- the API 226 is used by the application or the agent, respectively, to access state samples.
- the agent 202 uses the collected state samples to generate the profile information display 104 .
- the API 226 can be used to retrieve values from memory (e.g., corresponding to locally or globally defined variables). Such retrieval can be facilitated by the memory manager 222 .
- the agent 202 can also present the current value of a variable. To do so, the agent 202 requests retrieval of the value of the memory identified by the variable of interest. The value retrieved is only current at retrieval time as the value of the variable may subsequently change as the application is executing.
- state samples are stored completely in memory. Compared to some conventional approaches, this reduces or eliminates profiler information encoding and decoding, inter-process communication, and cross-application synchronization. Additionally, the state samples can reference information about the application and environment (e.g., application execution environment) such as local variables, member variables, invocation stacks, global variables, and memory allocations. Using such references the API 226 can be used to query for further information about the running application (e.g., to retrieve memory values). The state samples are collected in the same execution environment in which the instrumented application is being executed.
- application execution environment e.g., application execution environment
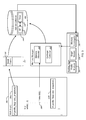
- FIG. 3 is a block diagram showing the generation of state samples.
- An instrumented method 302 is described as an illustrative example.
- the instrumented method 302 includes regions of interest 304 a and 304 b , that have been instrumented to include sampling instructions. As shown, each region includes statements that check a profile flag and conditionally collect a state sample capturing a snapshot of the application's execution (e.g., the sample is collected by calling take_snapshot method).
- a state sample is collected.
- a state sample is collected if both the flag is set to true, and a sufficiently minimum interval of time has elapsed since the last collection.
- the take_snapshot method can check an elapsed time, and if the elapsed time does not exceed a specified value, the step of capturing a state sample can be skipped, even if the profile_flag is set to true.
- the specified value can be adjusted by the application execution environment, the agent or the application being profiled.
- a state sample capturing a snapshot of application execution includes the stack frame 310 of the currently executing method, or, in other implementations, a stack frame corresponding to the particular method being executed.
- the stack frame 310 is copied from a stack 312 and recorded as a state sample 340 .
- invoking the take_snapshot method causes the topmost stack frame 310 on the stack 312 , which corresponds to the stack frame of the method 302 being executed, to be recorded in a collection of state samples 314 .
- the stack frame 310 generally includes run-time information corresponding to the executed method. For example, the stack frame identifies information about method's name, the method's return address, received parameters, local variables, dynamically sized stack variables or other run-time information stored in the stack frame 310 . This information is contained or can be derived from the captured snapshot. In some implementations, a snapshot includes one or more pointers to the aforementioned information. In addition to the stack frame, each state sample 340 includes a timestamp 318 . In some implementations, the stack frame of any method is a method information object that includes a reference to information about the method (e.g., call stack, method name, parameters or variables). In such implementations, the method information object is copied to the collection of state samples as a snapshot state sample.
- the method information object is copied to the collection of state samples as a snapshot state sample.
- State samples are collected in a state sample collection 314 , which can be recorded entirely in a temporary memory structure. In other words, it is not necessary to store the state sample collection in non-volatile memory (e.g., a file stored on a hard disk). From the state samples and their respective timestamps, profile information can be derived, such as what method is being executed, how often a method has executed and for how long a method executes.
- non-volatile memory e.g., a file stored on a hard disk.
- state samples about memory management events are collected during profiling. These state samples generally include information about when memory allocations have been requested by the application and when memory deallocations have occurred (e.g., explicit deallocations requested by the application, garbage collection, or deallocations implied by memory management schemes such as reference counting).
- the program statement 306 illustrates an instantiation of a new object, which requires a memory allocation.
- a memory allocator 320 allocates the necessary memory. If the requesting application is being profiled a state sample identifying the occurrence of the memory event can be recorded to the sample collection 314 .
- Other memory events such as when unused memory is reclaimed (e.g., by the garbage collector 322 ) can also be recorded as sample within the sample collection 314 .
- the state sample collection 314 is accessed by the profiling agent 202 .
- the profiling agent uses the collected state samples to derive profiling information that can be presented to a user.
- the profiling agent 202 includes a profile analysis module 326 , a graph module 328 and a memory interrogator module 330 .
- the state sample collection 314 is accessed by the profiling agent 202 .
- the profiling agent uses the collected state samples derive profiling information that can be presented to a user.
- the profiling agent 202 includes a profile analysis module 326 , a graph module 328 and a memory interrogator module 330 .
- the profile analysis module 326 can determine run-time information for the executing application from state samples.
- Run-time information includes information about the amount of execution used by the application, the application execution environment or an operating system on which the application execution environment is running
- Run-time information can also include information about CPU utilization, the relative amount of execution or wait time used by various hardware and software components of the application, application execution environment or operating system.
- the profile analysis module 326 can use the state samples in the state sample collection 314 to derive information related to the execution of an application.
- profiling information can include call stack information (e.g., a list of stack frames located in the state sample collection 314 ), memory event information, or other information.
- Call stack information can be derived from state samples and are used to describe a path of execution through methods of an application.
- Memory event information can include a list of objects in memory, the number of currently allocated objects, and the number of object allocations and deallocations.
- variable types can be organized into groups. For example, similar types (e.g., integers, strings, and classes) can be grouped together into sets. The size of the types can also be presented.
- the graph module 328 can generate graphs using state samples and information derived by the profile analysis module 326 .
- the graph module 328 can create one or more pie charts, timelines, or other graphical representations derived from the state samples, such as the graphical representations illustrated in FIG. 1 .
- the memory interrogator module 330 can access memory locations and can display their values. For example, the memory interrogator module 330 can access the value of a variable of a running application. The value, at the time of access, can be displayed as a part of the profiling information. For example, the memory interrogator module 330 can display the value of variables x, y, or the object q in method 302 .
- FIG. 4 is a flowchart showing a process 400 for generating and presenting profiling information based on collected state samples. Note that some or all of the steps in process 400 are executed in the application execution environment managing the execution of the application being executed. A plurality of instructions, generally corresponding to the application to be profiled, is received (step 410 ).
- Regions in the received instructions are identified based on flow control structures (step 420 ).
- the profile instrumentation module 206 can also identify regions of the instructions based on flow control structures specified by the instructions.
- Each of the identified regions is instrumented with sampling instructions (step 430 ) such that when the instructions are executed, state samples can be collected. For example, sampling instructions are added to the identified regions. The added instructions can check a profile state flag and cause a state sample to be collected.
- the instrumented instructions are translated into corresponding instrumented machine instructions (step 440 ).
- the instrumented instructions are translated by a JIT compiler 212 into machine dependent instructions.
- the translated instrumented machine instructions are executed (step 450 ).
- the CPU 214 can execute the instrument instructions.
- state samples are collected (step 460 ).
- the collected state samples are recorded in the state sample collection 314 .
- the state samples are used to present profile information during the execution of the application (step 470 ).
- the profiling agent 202 can access information contained in the state sample collection 314 .
- the profiling agent can also present profile information using the profile analysis module 326 , the graph module 328 , the memory interrogator module 330 , or some combination thereof.
- step 420 , step 430 , or both can occur after step 440 .
- the JIT compiler 212 can first translate the instructions into machine dependent instructions, and then the regions of interest can be identified and instrumented.
- Embodiments of the subject matter and the functional operations described in this specification can be implemented in digital electronic circuitry, or in computer software, firmware, or hardware, including the structures disclosed in this specification and their structural equivalents, or in combinations of one or more of them.
- Embodiments of the subject matter described in this specification can be implemented as one or more computer program products, i.e., one or more modules of computer program instructions encoded on a tangible program carrier for execution by, or to control the operation of, data processing apparatus.
- the tangible program carrier can be a computer readable medium.
- the computer readable medium can be a machine-readable storage device, a machine-readable storage substrate, a memory device, a composition of matter or a combination of one or more of them.
- data processing apparatus encompasses all apparatus, devices, and machines for processing data, including by way of example a programmable processor, a computer, or multiple processors or computers.
- the apparatus can include, in addition to hardware, code that creates an execution environment for the computer program in question, e.g., code that constitutes processor firmware, a protocol stack, a database management system, an operating system, or a combination of one or more of them.
- a computer program (also known as a program, software, software application, script, or code) can be written in any form of programming language, including compiled or interpreted languages, or declarative or procedural languages, and it can be deployed in any form, including as a stand-alone program or as a module, component, subroutine, or other unit suitable for use in a computing environment.
- a computer program does not necessarily correspond to a file in a file system.
- a program can be stored in a portion of a file that holds other programs or data (e.g., one or more scripts stored in a markup language document), in a single file dedicated to the program in question, or in multiple coordinated files (e.g., files that store one or more modules, sub-programs, or portions of code).
- a computer program can be deployed to be executed on one computer or on multiple computers that are located at one site or distributed across multiple sites and interconnected by a communication network.
- the processes and logic flows described in this specification can be performed by one or more programmable processors executing one or more computer programs to perform functions by operating on input data and generating output.
- the processes and logic flows can also be performed by, and apparatus can also be implemented as, special purpose logic circuitry, e.g., an FPGA (field programmable gate array) or an ASIC (application-specific integrated circuit).
- processors suitable for the execution of a computer program include, by way of example, both general and special purpose microprocessors, and any one or more processors of any kind of digital computer.
- a processor will receive instructions and data from a read-only memory or a random access memory or both.
- the essential elements of a computer are a processor for performing instructions and one or more memory devices for storing instructions and data.
- a computer will also include, or be operatively coupled to receive data from or transfer data to, or both, one or more mass storage devices for storing data, e.g., magnetic, magneto-optical disks, or optical disks.
- mass storage devices for storing data, e.g., magnetic, magneto-optical disks, or optical disks.
- a computer need not have such devices.
- a computer can be embedded in another device, e.g., a mobile telephone, a personal digital assistant (PDA), a mobile audio or video player, a game console, a Global Positioning System (GPS) receiver, to name just a few.
- PDA personal digital assistant
- GPS Global Positioning System
- Computer-readable media suitable for storing computer program instructions and data include all forms of non-volatile memory, media and memory devices, including by way of example semiconductor memory devices, e.g., EPROM, EEPROM, and flash memory devices; magnetic disks, e.g., internal hard disks or removable disks; magneto-optical disks; and CD-ROM and DVD-ROM disks.
- semiconductor memory devices e.g., EPROM, EEPROM, and flash memory devices
- magnetic disks e.g., internal hard disks or removable disks
- magneto-optical disks e.g., CD-ROM and DVD-ROM disks.
- the processor and the memory can be supplemented by, or incorporated in, special purpose logic circuitry.
- embodiments of the subject matter described in this specification can be implemented on a computer having a display device, e.g., a CRT (cathode ray tube) or LCD (liquid crystal display) monitor, for displaying information to the user and a keyboard and a pointing device, e.g., a mouse or a trackball, by which the user can provide input to the computer.
- a display device e.g., a CRT (cathode ray tube) or LCD (liquid crystal display) monitor
- keyboard and a pointing device e.g., a mouse or a trackball
- Other kinds of devices can be used to provide for interaction with a user as well; for example, feedback provided to the user can be any form of sensory feedback, e.g., visual feedback, auditory feedback, or tactile feedback; and input from the user can be received in any form, including acoustic, speech, or tactile input.
- Embodiments of the subject matter described in this specification can be implemented in a computing system that includes a back-end component, e.g., as a data server, or that includes a middleware component, e.g., an application server, or that includes a front-end component, e.g., a client computer having a graphical user interface or a Web browser through which a user can interact with an implementation of the subject matter described is this specification, or any combination of one or more such back-end, middleware, or front-end components.
- the components of the system can be interconnected by any form or medium of digital data communication, e.g., a communication network. Examples of communication networks include a local area network (“LAN”) and a wide area network (“WAN”), e.g., the Internet.
- LAN local area network
- WAN wide area network
- the computing system can include clients and servers.
- a client and server are generally remote from each other and typically interact through a communication network.
- the relationship of client and server arises by virtue of computer programs running on the respective computers and having a client-server relationship to each other.
Abstract
Description
Claims (24)
Priority Applications (1)
| Application Number | Priority Date | Filing Date | Title |
|---|---|---|---|
| US11/756,519 US8074207B1 (en) | 2007-05-31 | 2007-05-31 | Application profiling |
Applications Claiming Priority (1)
| Application Number | Priority Date | Filing Date | Title |
|---|---|---|---|
| US11/756,519 US8074207B1 (en) | 2007-05-31 | 2007-05-31 | Application profiling |
Publications (1)
| Publication Number | Publication Date |
|---|---|
| US8074207B1 true US8074207B1 (en) | 2011-12-06 |
Family
ID=45034532
Family Applications (1)
| Application Number | Title | Priority Date | Filing Date |
|---|---|---|---|
| US11/756,519 Active 2030-03-21 US8074207B1 (en) | 2007-05-31 | 2007-05-31 | Application profiling |
Country Status (1)
| Country | Link |
|---|---|
| US (1) | US8074207B1 (en) |
Cited By (18)
| Publication number | Priority date | Publication date | Assignee | Title |
|---|---|---|---|---|
| US20090083716A1 (en) * | 2007-09-20 | 2009-03-26 | Fujitsu Microelectronics Limited | Profiling method and program |
| US20090228875A1 (en) * | 2008-03-04 | 2009-09-10 | Devries Alex | Method and System for Reducing Disk Allocation by Profiling Symbol Usage |
| US20130076755A1 (en) * | 2011-09-27 | 2013-03-28 | Microsoft Corporation | General representations for data frame animations |
| US20130152054A1 (en) * | 2011-12-13 | 2013-06-13 | International Business Machines Corporation | Setting breakpoints in optimized instructions |
| US20130215124A1 (en) * | 2008-12-15 | 2013-08-22 | LeoNouvus USA Inc. | Media Action Script Acceleration Apparatus |
| US20130215123A1 (en) * | 2008-12-15 | 2013-08-22 | Leonovus Usa Inc. | Media Action Script Acceleration Apparatus, System and Method |
| US20130227531A1 (en) * | 2012-02-24 | 2013-08-29 | Zynga Inc. | Methods and Systems for Modifying A Compiler to Generate A Profile of A Source Code |
| US20130227388A1 (en) * | 2012-02-28 | 2013-08-29 | Microsoft Corporation | Persistent Storage of Profile Data for Script Compilation |
| US20130222397A1 (en) * | 2008-12-15 | 2013-08-29 | Leonovus Usa Inc. | Media Action Script Acceleration Method |
| US20130249917A1 (en) * | 2012-03-26 | 2013-09-26 | Microsoft Corporation | Profile data visualization |
| US20130263094A1 (en) * | 2012-03-29 | 2013-10-03 | International Business Machines Corporation | Setting breakpoints in optimized instructions |
| US20140282416A1 (en) * | 2013-03-14 | 2014-09-18 | Adobe Systems Incorporated | Method and system of visually combining profiling data from instrumentation and sampling |
| US20140282175A1 (en) * | 2013-03-14 | 2014-09-18 | Adobe Systems Incorporated | Method and system of visually depicting hierarchical data through selective colorization |
| US20140281434A1 (en) * | 2013-03-15 | 2014-09-18 | Carlos Madriles | Path profiling using hardware and software combination |
| US20150052403A1 (en) * | 2013-08-19 | 2015-02-19 | Concurix Corporation | Snapshotting Executing Code with a Modifiable Snapshot Definition |
| US20160154636A1 (en) * | 2013-05-06 | 2016-06-02 | International Business Machines Corporation | Inserting implicit sequence points into computer program code to support debug operations |
| US9507655B2 (en) * | 2014-10-31 | 2016-11-29 | AppDynamics, Inc. | Tracking asynchronous entry points for an application |
| US10050797B2 (en) | 2013-08-19 | 2018-08-14 | Microsoft Technology Licensing, Llc | Inserting snapshot code into an application |
Citations (11)
| Publication number | Priority date | Publication date | Assignee | Title |
|---|---|---|---|---|
| US5539907A (en) * | 1994-03-01 | 1996-07-23 | Digital Equipment Corporation | System for monitoring computer system performance |
| US5732273A (en) * | 1995-08-11 | 1998-03-24 | Digital Equipment Corporation | System for monitoring compute system performance |
| US6002872A (en) * | 1998-03-31 | 1999-12-14 | International Machines Corporation | Method and apparatus for structured profiling of data processing systems and applications |
| US6507805B1 (en) * | 1997-12-12 | 2003-01-14 | International Business Machines Corporation | Method and system for compensating for instrumentation overhead in trace data by detecting minimum event times |
| US6560722B1 (en) * | 1999-12-30 | 2003-05-06 | Texas Instruments Incorporated | Developing and deploying real-time high-performance applications with DSPs |
| US20030105857A1 (en) * | 2001-11-30 | 2003-06-05 | Yury Kamen | Dynamic object usage pattern learning and efficient caching |
| US6691254B2 (en) * | 1999-06-03 | 2004-02-10 | Microsoft Corporation | Method and apparatus for analyzing performance of data processing system |
| US6751789B1 (en) * | 1997-12-12 | 2004-06-15 | International Business Machines Corporation | Method and system for periodic trace sampling for real-time generation of segments of call stack trees augmented with call stack position determination |
| US7047521B2 (en) * | 2001-06-07 | 2006-05-16 | Lynoxworks, Inc. | Dynamic instrumentation event trace system and methods |
| US7290246B2 (en) * | 2002-04-04 | 2007-10-30 | Texas Instruments Incorporated | Power profiling system and method for correlating runtime information |
| US7496907B2 (en) * | 2003-08-06 | 2009-02-24 | International Business Machines Corporation | Method and system for profile normalization in an autonomic software system |
-
2007
- 2007-05-31 US US11/756,519 patent/US8074207B1/en active Active
Patent Citations (11)
| Publication number | Priority date | Publication date | Assignee | Title |
|---|---|---|---|---|
| US5539907A (en) * | 1994-03-01 | 1996-07-23 | Digital Equipment Corporation | System for monitoring computer system performance |
| US5732273A (en) * | 1995-08-11 | 1998-03-24 | Digital Equipment Corporation | System for monitoring compute system performance |
| US6507805B1 (en) * | 1997-12-12 | 2003-01-14 | International Business Machines Corporation | Method and system for compensating for instrumentation overhead in trace data by detecting minimum event times |
| US6751789B1 (en) * | 1997-12-12 | 2004-06-15 | International Business Machines Corporation | Method and system for periodic trace sampling for real-time generation of segments of call stack trees augmented with call stack position determination |
| US6002872A (en) * | 1998-03-31 | 1999-12-14 | International Machines Corporation | Method and apparatus for structured profiling of data processing systems and applications |
| US6691254B2 (en) * | 1999-06-03 | 2004-02-10 | Microsoft Corporation | Method and apparatus for analyzing performance of data processing system |
| US6560722B1 (en) * | 1999-12-30 | 2003-05-06 | Texas Instruments Incorporated | Developing and deploying real-time high-performance applications with DSPs |
| US7047521B2 (en) * | 2001-06-07 | 2006-05-16 | Lynoxworks, Inc. | Dynamic instrumentation event trace system and methods |
| US20030105857A1 (en) * | 2001-11-30 | 2003-06-05 | Yury Kamen | Dynamic object usage pattern learning and efficient caching |
| US7290246B2 (en) * | 2002-04-04 | 2007-10-30 | Texas Instruments Incorporated | Power profiling system and method for correlating runtime information |
| US7496907B2 (en) * | 2003-08-06 | 2009-02-24 | International Business Machines Corporation | Method and system for profile normalization in an autonomic software system |
Non-Patent Citations (6)
| Title |
|---|
| Malony et al. "Tracing Application Program Execution on the Cray X-MP and Cray 2", 1990, IEEE, pp. 60-73. * |
| Metz et al., "Efficient Instrumentation for Performance Profiling", 2003. * |
| Moore et al., "Profiling Interrupt Handler Performance Through Kernel Instrumentation", 2003. * |
| Tia Newhall, "Performance Measurement of Interpreted, Just-in-Time Compiled, and Dynamically Compiled Executions", 1999. * |
| Valgrind Developers, http://valgrind.org/docs/manual/mc-tech-docs.html, Printed Jun. 2006. |
| YourKit, LLC, http://www.yourkit.com/features/index.jsp, Printed May 2007. |
Cited By (29)
| Publication number | Priority date | Publication date | Assignee | Title |
|---|---|---|---|---|
| US20090083716A1 (en) * | 2007-09-20 | 2009-03-26 | Fujitsu Microelectronics Limited | Profiling method and program |
| US20090228875A1 (en) * | 2008-03-04 | 2009-09-10 | Devries Alex | Method and System for Reducing Disk Allocation by Profiling Symbol Usage |
| US20130215124A1 (en) * | 2008-12-15 | 2013-08-22 | LeoNouvus USA Inc. | Media Action Script Acceleration Apparatus |
| US20130215123A1 (en) * | 2008-12-15 | 2013-08-22 | Leonovus Usa Inc. | Media Action Script Acceleration Apparatus, System and Method |
| US20130222397A1 (en) * | 2008-12-15 | 2013-08-29 | Leonovus Usa Inc. | Media Action Script Acceleration Method |
| US20130076755A1 (en) * | 2011-09-27 | 2013-03-28 | Microsoft Corporation | General representations for data frame animations |
| US8943480B2 (en) * | 2011-12-13 | 2015-01-27 | International Business Machines Corporation | Setting breakpoints in optimized instructions |
| US20130152054A1 (en) * | 2011-12-13 | 2013-06-13 | International Business Machines Corporation | Setting breakpoints in optimized instructions |
| US20130227531A1 (en) * | 2012-02-24 | 2013-08-29 | Zynga Inc. | Methods and Systems for Modifying A Compiler to Generate A Profile of A Source Code |
| US20130227388A1 (en) * | 2012-02-28 | 2013-08-29 | Microsoft Corporation | Persistent Storage of Profile Data for Script Compilation |
| US20130249917A1 (en) * | 2012-03-26 | 2013-09-26 | Microsoft Corporation | Profile data visualization |
| US20130263094A1 (en) * | 2012-03-29 | 2013-10-03 | International Business Machines Corporation | Setting breakpoints in optimized instructions |
| US8990780B2 (en) * | 2012-03-29 | 2015-03-24 | International Business Machines Corporation | Setting breakpoints in optimized instructions |
| US20140282416A1 (en) * | 2013-03-14 | 2014-09-18 | Adobe Systems Incorporated | Method and system of visually combining profiling data from instrumentation and sampling |
| US20140282175A1 (en) * | 2013-03-14 | 2014-09-18 | Adobe Systems Incorporated | Method and system of visually depicting hierarchical data through selective colorization |
| US10613965B2 (en) * | 2013-03-14 | 2020-04-07 | Adobe Inc. | Method and system of visually combining profiling data from instrumentation and sampling |
| US10496658B2 (en) * | 2013-03-14 | 2019-12-03 | Adobe Inc. | Method and system of visually depicting hierarchical data through selective colorization |
| US20140281434A1 (en) * | 2013-03-15 | 2014-09-18 | Carlos Madriles | Path profiling using hardware and software combination |
| US20160154637A1 (en) * | 2013-05-06 | 2016-06-02 | International Business Machines Corporation | Inserting implicit sequence points into computer program code to support debug operations |
| US9910648B2 (en) * | 2013-05-06 | 2018-03-06 | International Business Machines Corporation | Inserting implicit sequence points into computer program code to support debug operations |
| US9916143B2 (en) * | 2013-05-06 | 2018-03-13 | International Business Machines Corporation | Inserting implicit sequence points into computer program code to support debug operations |
| US20160154636A1 (en) * | 2013-05-06 | 2016-06-02 | International Business Machines Corporation | Inserting implicit sequence points into computer program code to support debug operations |
| US10664252B2 (en) | 2013-05-06 | 2020-05-26 | International Business Machines Corporation | Inserting implicit sequence points into computer program code to support debug operations |
| US9465721B2 (en) * | 2013-08-19 | 2016-10-11 | Microsoft Technology Licensing, Llc | Snapshotting executing code with a modifiable snapshot definition |
| US10050797B2 (en) | 2013-08-19 | 2018-08-14 | Microsoft Technology Licensing, Llc | Inserting snapshot code into an application |
| US20150052403A1 (en) * | 2013-08-19 | 2015-02-19 | Concurix Corporation | Snapshotting Executing Code with a Modifiable Snapshot Definition |
| US9507655B2 (en) * | 2014-10-31 | 2016-11-29 | AppDynamics, Inc. | Tracking asynchronous entry points for an application |
| US20170147483A1 (en) * | 2014-10-31 | 2017-05-25 | AppDynamics, Inc. | Tracking asynchronous entry points for an application |
| US10067862B2 (en) * | 2014-10-31 | 2018-09-04 | Cisco Technology, Inc. | Tracking asynchronous entry points for an application |
Similar Documents
| Publication | Publication Date | Title |
|---|---|---|
| US8074207B1 (en) | Application profiling | |
| US8522209B2 (en) | Method and system for integrating profiling and debugging | |
| US8356286B2 (en) | Method and system for providing on-demand profiling infrastructure for profiling at virtual machines | |
| US8196116B2 (en) | Tracing objects in object-oriented programming model | |
| US7904493B2 (en) | Method and system for object age detection in garbage collection heaps | |
| Lange et al. | JEWEL: Design and implementation of a distributed measurement system | |
| US7971010B2 (en) | Mechanism for performing loitering trace of objects that cause memory leaks in a post-garbage collection heap | |
| US8667471B2 (en) | Method and system for customizing profiling sessions | |
| US8832665B2 (en) | Method and system for tracing individual transactions at the granularity level of method calls throughout distributed heterogeneous applications without source code modifications including the detection of outgoing requests | |
| US8336033B2 (en) | Method and system for generating a hierarchical tree representing stack traces | |
| US10339031B2 (en) | Efficient method data recording | |
| US20080243969A1 (en) | Method and system for customizing allocation statistics | |
| EP2956862B1 (en) | Call stacks for asynchronous programs | |
| US8522213B2 (en) | Debugger and debugging methods using breakpoints conditioned on the static identity of data | |
| Chen et al. | Multithreading in Java: Performance and scalability on multicore systems | |
| US7103877B1 (en) | System and method for characterizing program behavior by sampling at selected program points | |
| US9027011B1 (en) | Using method-profiling to dynamically tune a virtual machine for responsiveness | |
| US7900196B2 (en) | Method and apparatus for monitoring for conditions during execution of code | |
| US20070143678A1 (en) | Method and apparatus for persistently resolving events to event source | |
| US8533710B1 (en) | Using observed thread activity to dynamically tune a virtual machine for responsiveness | |
| US8903776B2 (en) | Caching socket connections while ensuring that there are file descriptors available for the applications | |
| US10310830B2 (en) | Shader profiler | |
| US8566812B1 (en) | Using observed object patterns to dynamically tune a virtual machine for responsiveness | |
| Inoue et al. | How a Java VM can get more from a hardware performance monitor | |
| Reiss | Event-based performance analysis |
Legal Events
| Date | Code | Title | Description |
|---|---|---|---|
| AS | Assignment |
Owner name: ADOBE SYSTEMS INCORPORATED, CALIFORNIA Free format text: ASSIGNMENT OF ASSIGNORS INTEREST;ASSIGNOR:REILLY, THOMAS;REEL/FRAME:019388/0772 Effective date: 20070530 |
|
| STCF | Information on status: patent grant |
Free format text: PATENTED CASE |
|
| FEPP | Fee payment procedure |
Free format text: PAYOR NUMBER ASSIGNED (ORIGINAL EVENT CODE: ASPN); ENTITY STATUS OF PATENT OWNER: LARGE ENTITY |
|
| FPAY | Fee payment |
Year of fee payment: 4 |
|
| AS | Assignment |
Owner name: ADOBE INC., CALIFORNIA Free format text: CHANGE OF NAME;ASSIGNOR:ADOBE SYSTEMS INCORPORATED;REEL/FRAME:048867/0882 Effective date: 20181008 |
|
| MAFP | Maintenance fee payment |
Free format text: PAYMENT OF MAINTENANCE FEE, 8TH YEAR, LARGE ENTITY (ORIGINAL EVENT CODE: M1552); ENTITY STATUS OF PATENT OWNER: LARGE ENTITY Year of fee payment: 8 |
|
| MAFP | Maintenance fee payment |
Free format text: PAYMENT OF MAINTENANCE FEE, 12TH YEAR, LARGE ENTITY (ORIGINAL EVENT CODE: M1553); ENTITY STATUS OF PATENT OWNER: LARGE ENTITY Year of fee payment: 12 |