US8073218B2 - Method for detecting bio signal features in the presence of noise - Google Patents
Method for detecting bio signal features in the presence of noise Download PDFInfo
- Publication number
- US8073218B2 US8073218B2 US12/284,999 US28499908A US8073218B2 US 8073218 B2 US8073218 B2 US 8073218B2 US 28499908 A US28499908 A US 28499908A US 8073218 B2 US8073218 B2 US 8073218B2
- Authority
- US
- United States
- Prior art keywords
- signal
- coefficients
- wavelet transform
- detecting
- bio
- Prior art date
- Legal status (The legal status is an assumption and is not a legal conclusion. Google has not performed a legal analysis and makes no representation as to the accuracy of the status listed.)
- Expired - Fee Related, expires
Links
Images


Classifications
-
- A—HUMAN NECESSITIES
- A61—MEDICAL OR VETERINARY SCIENCE; HYGIENE
- A61B—DIAGNOSIS; SURGERY; IDENTIFICATION
- A61B5/00—Measuring for diagnostic purposes; Identification of persons
- A61B5/72—Signal processing specially adapted for physiological signals or for diagnostic purposes
- A61B5/7203—Signal processing specially adapted for physiological signals or for diagnostic purposes for noise prevention, reduction or removal
-
- A—HUMAN NECESSITIES
- A61—MEDICAL OR VETERINARY SCIENCE; HYGIENE
- A61B—DIAGNOSIS; SURGERY; IDENTIFICATION
- A61B5/00—Measuring for diagnostic purposes; Identification of persons
- A61B5/24—Detecting, measuring or recording bioelectric or biomagnetic signals of the body or parts thereof
- A61B5/316—Modalities, i.e. specific diagnostic methods
-
- A—HUMAN NECESSITIES
- A61—MEDICAL OR VETERINARY SCIENCE; HYGIENE
- A61B—DIAGNOSIS; SURGERY; IDENTIFICATION
- A61B5/00—Measuring for diagnostic purposes; Identification of persons
- A61B5/72—Signal processing specially adapted for physiological signals or for diagnostic purposes
- A61B5/7235—Details of waveform analysis
- A61B5/7253—Details of waveform analysis characterised by using transforms
- A61B5/726—Details of waveform analysis characterised by using transforms using Wavelet transforms
-
- A—HUMAN NECESSITIES
- A61—MEDICAL OR VETERINARY SCIENCE; HYGIENE
- A61B—DIAGNOSIS; SURGERY; IDENTIFICATION
- A61B5/00—Measuring for diagnostic purposes; Identification of persons
- A61B5/72—Signal processing specially adapted for physiological signals or for diagnostic purposes
- A61B5/7235—Details of waveform analysis
- A61B5/7239—Details of waveform analysis using differentiation including higher order derivatives
-
- G—PHYSICS
- G06—COMPUTING; CALCULATING OR COUNTING
- G06F—ELECTRIC DIGITAL DATA PROCESSING
- G06F2218/00—Aspects of pattern recognition specially adapted for signal processing
- G06F2218/02—Preprocessing
- G06F2218/04—Denoising
- G06F2218/06—Denoising by applying a scale-space analysis, e.g. using wavelet analysis
Definitions
- This invention relates to methods for detecting signal features from a biological (bio) signal in the presence of noise.
- An electrocardiogram is a graphic produced by an electrocardiograph, which records the electrical activity (a signal) of the heart over time. Electrical waves cause the heart muscle to pump. These waves pass through the body and can be measured at electrodes (electrical contacts) attached to the skin. Electrodes on different sides of the heart measure the activity of different parts of the heart muscle. An EKG displays the voltage (a signal) between pairs of these electrodes, and the muscle activity that they measure, from different directions. This display indicates the overall rhythm of the heart, and weaknesses in different parts of the heart muscle. It is a way to measure and diagnose abnormal rhythms of the heart, particularly abnormal rhythms caused by damage to the conductive tissue that carries electrical signals, or abnormal rhythms caused by levels of salts, such as potassium, that are too high or low.
- the ability to analyze an EKG signal and detect variances therein provides the ability to monitor the physiological condition of a heart. For instance, accurate detection of variances in an EKG signal allows for the detection of heart events, such as heartbeat detection, arrhythmias, ischemias, and a myriad of other events. To detect variances in the EKG signal, it is necessary to minimize or eliminate noise, which also causes variances in an EKG signal, but does not correspond to a physiological event of the heart. Otherwise, the noise variance may be misconstrued as a heart event. In turn, this can lead to a potential misdiagnosis, false positive, missed event, or failure to detect other rhythms; among other undesirable results. In particular, noise can lead to false identification of R waves, resulting in the detection of more heartbeats than what actually occurred. Misidentification may occur when, for example, baseline drift is present in the signal.
- One known method of removing low frequency noise involves using a low pass filter followed by a length transform, which computes the length of a curve within a given time window. When the length exceeds a predetermined threshold, the curve is identified as being an R wave. When baseline drift is present, portions of the curve that should be flat are instead sloped. This may increase the calculated curve length and lead to misidentification of the curve as an R wave.
- baseline drift may add noise to the length transform, reducing the transform's definition and therefore causing a failure to perceive smaller peaks, which results in underreporting of R waves. Accordingly, a need exists for techniques which are able to detect heartbeats, along with signal features of other bio signals (such as brain waves), in the presence of noise.
- a first example embodiment of the present invention relates to a computer-based method for detecting features in a digitally sampled bio signal.
- the method includes the steps of applying a wavelet transform to the bio signal to generate a list of wavelet transform coefficients, ranking the coefficients according to value, and removing at least one low value coefficient.
- the method further includes the steps of performing an inverse wavelet transform using the remaining coefficients to generate a reconstructed signal, and detecting feature locations using the reconstructed signal.
- a second example embodiment of the present invention relates to a computer-based method for detecting features in a digitally sampled bio signal.
- the method includes the steps of applying a wavelet transform to the bio signal to generate a list of wavelet transform coefficients, ranking the coefficients according to frequency, and removing at least one low frequency coefficient.
- the method further includes the steps of performing an inverse wavelet transform using the remaining coefficients to generate a reconstructed signal, and detecting feature locations using the reconstructed signal.
- a third example embodiment of the present invention relates to a device for detecting features in a digitally sampled bio signal.
- the device includes a communications arrangement configured to receive the bio signal, a processor, and a memory.
- the memory includes instructions configuring the processor to apply a wavelet transform to the bio signal to generate a list of wavelet transform coefficients, rank the coefficients according to value, and remove at least one low value coefficient.
- the instructions further configure the processor to perform an inverse wavelet transform using the remaining coefficients to generate a reconstructed signal, and detect feature locations using the reconstructed signal.
- a fourth example embodiment of the present invention relates to a device for detecting features in a digitally sampled bio signal.
- the device includes a communications arrangement configured to receive the bio signal, a processor, and a memory.
- the memory includes instructions configuring the processor to apply a wavelet transform to the bio signal to generate a list of wavelet transform coefficients, rank the coefficients according to frequency, and remove at least one low frequency coefficient.
- the instructions further configure the processor to perform an inverse wavelet transform using the remaining coefficients to generate a reconstructed signal, and detect feature locations using the reconstructed signal.
- a fifth example embodiment of the present invention relates to a computer-readable medium having stored thereon a series of instructions executable by a processor for detecting features in a digitally sampled bio signal.
- the instructions are configured to cause the processor to perform the steps of applying a wavelet transform to the bio signal to generate a list of wavelet transform coefficients, ranking the coefficients according to value, and removing at least one low value coefficient.
- the instructions are further configured to cause the processor to perform the steps of performing an inverse wavelet transform using the remaining coefficients to generate a reconstructed signal, and detecting feature locations using the reconstructed signal.
- a sixth example embodiment of the present invention relates to a computer-readable medium having stored thereon a series of instructions executable by a processor for detecting features in a digitally sampled bio signal.
- the instructions are configured to cause the processor to perform the steps of applying a wavelet transform to the bio signal to generate a list of wavelet transform coefficients, ranking the coefficients according to frequency, and removing at least one low frequency coefficient.
- the instructions are further configured to cause the processor to perform the steps of performing an inverse wavelet transform using the remaining coefficients to generate a reconstructed signal, and detecting feature locations using the reconstructed signal.
- FIG. 1 shows an example of a method for detecting bio signal features in the presence of noise according to an example embodiment of the present invention.
- FIG. 2 shows an example of a digitally sampled bio signal.
- FIG. 3 shows the signal of FIG. 2 after performing an inverse wavelet transform using high value coefficients according to an example embodiment of the present invention.
- FIG. 4 shows the signal of FIG. 3 after performing a derivative operation according to an example embodiment of the present invention.
- FIG. 5 shows the signal of FIG. 4 after performing signal rectification according to an example embodiment of the present invention.
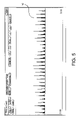
- FIG. 6 shows the signal of FIG. 5 after performing a length transform according to an example embodiment of the present invention.
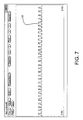
- FIG. 7 shows the signal of FIG. 6 after performing thresholding according to an example embodiment of the present invention.
- FIG. 8 shows an example of another method for detecting bio signal features in the presence of noise according to an example embodiment of the present invention.
- FIG. 9 shows the signal of FIG. 2 after performing an inverse wavelet transform using high frequency coefficients according to an example embodiment of the present invention.
- FIG. 10 shows the signal of FIG. 9 after performing filtering and rectification according to an example embodiment of the present invention.
- FIG. 11 shows the signal of FIG. 10 after performing thresholding according to an example embodiment of the present invention.
- FIG. 12 shows an example of another method for detecting bio signal features in the presence of noise according to an example embodiment of the present invention.
- FIG. 13 shows an example of a method for selecting wavelet coefficients according to an example embodiment of the present invention.
- FIG. 14 shows an example of another method for selecting wavelet coefficients according to an example embodiment of the present invention.
- FIG. 15 shows an example of a system for detecting bio signal features in the presence of noise according to an example embodiment of the present invention.
- the present invention relates to detecting features of bio signals in the presence of noise, such as baseline drift.
- noise such as baseline drift.
- An example system and methods will be described below with reference to the detection of heartbeats in an EKG signal.
- the example system and methods may be implemented in hardware, software, or a combination thereof.
- FIG. 1 shows an example of a method 100 for detecting bio signal features (heartbeats) in the presence of noise according to an example embodiment of the present invention.
- a digitally sampled EKG signal may be received, e.g., in a computing device performing the method 100 .
- an analog signal is sampled, it can be converted into digital form using an analog-to-digital converter.
- the EKG signal may be stored as an array of voltage values, each associated with a corresponding time value. Other storage structures are also possible.
- An example of an EKG signal 10 is shown in FIG. 2 .
- the EKG signal 10 includes periodic spikes (e.g., R waves) which may correspond to heartbeats. However, differentiating noise from actual heartbeats using conventional techniques may be difficult since noise and R waves may be of similar frequency and magnitude.
- At least one lowest value coefficient is removed from consideration. It may be desirable to remove the lowest value components in order to focus on more prevalent signal features. It may be preferable to remove as many low value components as possible. However, removing too many coefficients may result in detection errors. Thus, the number of high value coefficients to retain may be critical to detection accuracy. As will be discussed below, an iterative technique may be utilized to select the high value coefficients to be retained.
- an inverse wavelet transform may be performed on the coefficients that remain after removing the low value coefficient(s).
- the inverse transform may generate a reconstructed version of the EKG signal, except that the features corresponding to the removed coefficients may no longer be present.
- the reconstructed signal similar to the EKG signal, may be represented as a time-based function, e.g., as a one-dimensional array of values.
- FIG. 3 shows a reconstructed signal 12 , which represents the signal 10 after performing an inverse wavelet transform using only high value coefficients. As seen in FIG. 3 , the spikes are substantially preserved while low frequency components have been removed. This is illustrated by a flatness of the reconstructed signal 12 between each spike.
- a mathematical derivative of the reconstructed signal may be taken.
- the derivative may amplify spikes in the reconstructed signal, since spikes have high derivative values.
- taking the derivative may be advantageous, it is optional and, in other embodiments, the taking of the derivative may not be performed.
- FIG. 4 shows a derivative signal 14 , which represents a derivative of the reconstructed signal 12 .
- the derivative signal 14 may include spikes in both the positive and negative directions, respectively indicating sharp upwards and downwards transitions in the reconstructed signal 12 .
- the derivative signal may be rectified. Rectification converts negative values into positive values and may be used to simplify signal analysis.
- FIG. 5 shows a rectified signal 16 , which represents the derivative signal 14 after being rectified. As seen in FIG. 5 , rectification may produce a series of spikes grouped closely together. Each group may indicate the location of a heartbeat.
- a length transform may be applied to the rectified derivative.
- Length transforms are a mathematical operation in which a sliding window is passed through a function, e.g., the rectified signal. The intersection of the function with the window as it slides across the function may determine the output of the length transform.
- the length transform may smooth the rectified signal by grouping together peaks that are near each other. A size of the window may affect the smoothing ability of the length transform. If the window size is too small, not enough smoothing may occur and peaks may not be grouped together. If the window size is too large, peaks which are not located near each other may be grouped together. That is, a large window size may result in the combining of different heartbeats.
- the selection of the window size may be influenced by the periodic nature of the function being analyzed. For instance, human heartbeats are generally spaced one second apart, i.e., sixty beats per minute. Based on this fact, a default window size may be ten percent of one second. The default window size may also be adjusted according to each individual. For example, athletes often have lower heart rates than the rest of the population, so data recorded from an athlete may be subjected to a larger window size, since there is less risk of combining heartbeats.
- FIG. 6 shows a transformed signal 18 which includes peaks 20 and represents a length transform of the rectified signal 16 .
- heartbeat locations may be determined by, for example, locating peak maximums ( 180 ) or applying a thresholding procedure ( 190 ).
- peak maximums may be located by taking a derivative of the transformed signal and determining locations where the derivative goes from positive to negative.
- Another technique for locating peak maximums may be to evaluate the slope of the transformed signal directly to determine when the slope changes direction.
- a thresholding procedure may be performed by limiting the maximum value of the transformed signal.
- a cutoff value may be determined as a function of the maximum value of any peak. For example, the cutoff value may be half of the maximum value. Signal values exceeding the cutoff value may be converted into the cutoff value.
- FIG. 7 shows a thresholded signal 22 , which represents the transformed signal 18 after applying thresholding. As seen in FIG. 7 , thresholding may flatten each peak to produce a substantially square wave.
- heartbeat locations may be determined by locating middle values of the thresholded signal.
- One technique for locating middle values is to take the middle value between endpoints of the base of each square wave. That is, taking half the distance from a beginning of a peak pulse to an end of the peak pulse.
- the middle value may be located as a function of the maximum value. Starting with a left portion of a peak, a point may be located which has a value which is a function of the maximum value. In one embodiment, the function may be simply half the maximum value, e.g., the cutoff value. A similarly valued point may be located on a right portion of the same peak. The distance between the two points may be determined and the middle value selected to be half the distance.
- an inverse wavelet transform may be performed on the coefficients that remain after removing the low frequency coefficient(s).
- the inverse transform may generate a reconstructed version of the EKG signal, except that the features corresponding to the removed coefficients may no longer be present.
- FIG. 9 shows a reconstructed signal 30 , which represents the signal 10 after performing an inverse wavelet transform using only high frequency coefficients.
- the reconstructed signal may be rectified so that negative values are converted into positive values. Although rectification of the reconstructed signal may not be necessary, it may be preferable to perform signal analysis on only positive values.
- the rectified signal may be filtered through a low pass filter, e.g., a low pass box car.
- the filtered signal may be rectified. This step may not be necessary if the reconstructed signal was rectified prior to filtering. Rather, it will be appreciated that rectification can occur after filtering instead of before. While rectifying prior to filtering may yield similar final results compared to rectifying after filtering, it should be noted that intermediate results of both types of filtering may differ. That is to say that a rectified reconstructed signal may differ slightly from a rectified filtered signal, but not to the extent of affecting the number of heartbeats detected in either case.
- FIG. 10 shows a filtered and rectified signal 32 , which represents the reconstructed signal 30 after being rectified and low pass filtered.
- a thresholding procedure may be applied to the filtered and rectified signal.
- a middle value corresponding to a heartbeat may be located. The thresholding procedure and the locating of the middle value may be performed in a manner similar to that described above with reference to steps 190 and 192 of the method 100 .
- FIG. 11 shows a thresholded signal 34 , which represents the filtered and rectified signal 32 after thresholding.
- FIG. 12 shows an example of a method 300 for detecting bio signal features (heartbeats) in the presence of noise according to an example embodiment of the present invention.
- a digitally sampled EKG signal may be received.
- a baseline of the EKG signal may be fitted using, for example, a polynomial function.
- the baseline fit may be subtracted from the EKG signal to generate a flat-baselined signal.
- the fitting and subtracting may be performed in accordance with a technique described in U.S. patent application Ser. No. 12/284,932 titled Method for Reducing Baseline Drift in a Biological Signal, (in name of Toth et al) filed even date herewith, the entire disclosure of which is hereby incorporated by reference, and which describes a method for removing baseline drift by fitting a piecewise cubic function to the baseline of a bio signal and subtracting the cubic function from the bio signal.
- a discrete wavelet transform may be applied to the flat-baselined signal to form a two-dimensional array of coefficients.
- the best coefficients may be selected to be retained. As discussed above, coefficients may be selected based on value or frequency. Unselected coefficients may be removed from further consideration.
- an inverse wavelet transform may be applied to the selected coefficients to generate a reconstructed signal.
- heartbeat locations may be located using the reconstructed signal, e.g., by detecting peak maximums or using a combination of thresholding and middle value location.
- the example coefficient selecting methods may be used in conjunction with any of the methods 100 , 200 and 300 previously described.
- FIG. 13 shows an example of a method 400 for selecting wavelet coefficients according to an example embodiment of the present invention.
- a digitally sampled EKG signal may be received.
- a discrete wavelet transform may be performed using the EKG signal.
- all but one row of coefficients e.g., the row with the highest value or the highest frequency coefficients, may be removed.
- a single set of remaining coefficients may serve as initial coefficients for an iterative coefficient selection process, as described below.
- an inverse wavelet transform may be performed on the remaining coefficients to generate a reconstructed signal.
- heartbeat locations may be determined, e.g., using peak maximums or thresholding/middle value location, on the reconstructed signal.
- a determination may be performed whether results of the heartbeat location determination are satisfactory.
- One statistical factor is missing beats, which may be indicated by a change in the number of beats detected. For example, if beats were previously occurring once per second and now occur once every two seconds, this may indicate that beats are missing, e.g., being underreported.
- an additional coefficient may be added to the remaining coefficients. For instance, if the addition is being performed for the first time, the remaining coefficients may only include the highest row of coefficients plus a coefficient from the next highest row.
- the method 400 then returns to 440 , where an inverse wavelet transform may be performed using the remaining coefficients. In this manner, additional coefficients may be added to the remaining coefficients until a result of a heartbeat location detection is satisfactory.
- FIG. 14 shows an example of a method 500 for selecting coefficients according to an example embodiment of the present invention.
- the method 500 may initially proceed in a manner similar to that of steps 410 to 450 of the method 400 .
- a digitally sampled EKG signal may be received.
- a discrete wavelet transform may be performed on the EKG signal.
- all but one row of coefficients e.g., the highest value or the highest frequency coefficients, may be removed.
- an inverse wavelet transform may be performed on the remaining coefficients to generate a reconstructed signal.
- heartbeats may be located using the reconstructed signal.
- an additional coefficient may be added to the remaining coefficients.
- the additional coefficient may be added based on frequency or value.
- an inverse wavelet transform may be performed using the remaining coefficients to generate a reconstructed signal.
- heartbeat locations may be located on the reconstructed signal.
- a determination of whether the result of a current heartbeat location determination is substantially better than a previous result may be performed.
- the determination may be a function of one or more clinical factors. For example, the total number of heartbeats detected in the current result may be compared to the number of heartbeats detected in a previous result. Initially, using few coefficients may result in under-reporting. As coefficients are added, more heartbeats may be detected. Thus, if the current result shows an increase in the number of heartbeats, this may be an indication that the current result is substantially better. However, if too many coefficients are added, there may be over-reporting. This may be due to the presence of low frequency or low value coefficients associated with noise, which may be confused with actual heartbeats. Thus, a stop condition may be included in the definition of what constitutes a substantial improvement according to the present invention.
- the stop condition may be a function of a rate of change in the number of heartbeats detected. Initially, the change rate may be high, but as coefficients are added, the change rate may begin to slow. Thus, a plateau in the change rate may define a stop condition.
- the stop condition may be a function of whether the number of heartbeats detected lies within an expected range of values. The stop condition may not be imposed until the number of heartbeats detected is near or exceeds the expected range.
- the current result may only be compared to an immediately preceding result. Alternatively, in other embodiments, the current result may be compared to a plurality of previous results to determine a general trend in the results. If the current result is not substantially better, then the method 500 is complete. However, if the current result is substantially better, the method 500 may return to 560 , where an additional coefficient may be added to the remaining coefficients. In this manner, additional coefficients may be added to the remaining coefficients until a result of a heartbeat location determination no longer provides a substantial improvement over a previous result.
- coefficients may be added in groups based on, e.g., similar value or similar frequency.
- an initial set of remaining coefficients need not be limited to a single row of coefficients, but may include any number of coefficients, e.g., a set of rows comprising the highest value or highest frequency coefficients.
- FIG. 15 shows an example of a system for detecting bio signal features (heartbeats) in the presence of noise according to an example embodiment of the present invention.
- the system may include a device 600 , which may include a processor 610 , a memory 620 , a communications arrangement 630 and a user interface 640 .
- the device 600 may be configured to perform any of the methods 100 , 200 , 300 , 400 and 500 previously described.
- the processor 610 may be configured to execute instructions 622 located in the memory 620 .
- the instructions 622 may include instructions for detecting heartbeats and selecting wavelet coefficients according to the methods 100 to 500 .
- the processor 610 may include a microprocessor, an integrated circuit or series of integrated circuits, analog, digital, and other hardware components.
- the memory 620 may be a computer-readable medium including any type of readable or writable memory, include RAM, ROM, flash memory, an optical or electromagnetic drive, a compact disc, etc.
- the memory 620 may also include data 624 used in performing any of the previously described methods 100 to 500 .
- the data 624 may include digital values, e.g., x-y coordinates, corresponding to an EKG signal.
- the data 624 may also include a workspace for storing wavelet transform coefficients, reconstructed signals, derivative signals, thresholding signals, length transform data, remaining coefficients, and removed coefficients.
- the communications arrangement 630 may include any combination of hardware or software components for communicating with a data source such as a data collection device 650 or a computing device 660 .
- the data source may be configured to collect the digital signal and transmit it to the device 100 via the communications arrangement 630 .
- the communications arrangement 630 may be in wired and/or wireless communication with the data source.
- the communications arrangement 630 may wirelessly communicate with the device 650 .
- the communications arrangement 630 may also be in wired communication with the device 660 via a network 662 , which may be a local area network, a wide area network, a telephone network, the Internet, etc.
- Data may be collected and transmitted to the device 600 in substantially real time.
- the device 650 may include sensor electrodes for generating EKG signals.
- An analog EKG signal may be processed and converted into a digital signal, then transmitted.
- Data collection may also be done any time after the analog signal is recorded.
- analog or digital signals may be stored in a database on the device 660 , batch processed, and transmitted together.
- the device 660 may, similar to the device 650 , include sensors for measuring EKG signals.
- the device 660 may be configured to communicate with an external sensing device.
- data may be transmitted to the device via manual input, a storage device such as a CD-ROM, or any other input arrangement.
- one or more of the methods 100 to 500 may be implemented in the active patient management system as a software program stored in a computer-readable medium such as hard drive memory, flash memory, floppy disk memory, optically-encoded memory (e.g., a compact disk, DVD-ROM, DVD ⁇ R, CD-ROM, CD ⁇ R, holographic disk), a thermomechanical memory (e.g., scanning-probe-based data-storage), or any type of machine-readable (computer-readable) storage medium.
- a computer-readable medium such as hard drive memory, flash memory, floppy disk memory, optically-encoded memory (e.g., a compact disk, DVD-ROM, DVD ⁇ R, CD-ROM, CD ⁇ R, holographic disk), a thermomechanical memory (e.g., scanning-probe-based data-storage), or any type of machine-readable (computer-readable) storage medium.
- a computer-readable medium such as hard drive memory, flash memory, floppy disk memory, optically-encoded memory (e.
Abstract
Description
Claims (33)
Priority Applications (1)
| Application Number | Priority Date | Filing Date | Title |
|---|---|---|---|
| US12/284,999 US8073218B2 (en) | 2008-09-25 | 2008-09-25 | Method for detecting bio signal features in the presence of noise |
Applications Claiming Priority (1)
| Application Number | Priority Date | Filing Date | Title |
|---|---|---|---|
| US12/284,999 US8073218B2 (en) | 2008-09-25 | 2008-09-25 | Method for detecting bio signal features in the presence of noise |
Publications (2)
| Publication Number | Publication Date |
|---|---|
| US20100074482A1 US20100074482A1 (en) | 2010-03-25 |
| US8073218B2 true US8073218B2 (en) | 2011-12-06 |
Family
ID=42037715
Family Applications (1)
| Application Number | Title | Priority Date | Filing Date |
|---|---|---|---|
| US12/284,999 Expired - Fee Related US8073218B2 (en) | 2008-09-25 | 2008-09-25 | Method for detecting bio signal features in the presence of noise |
Country Status (1)
| Country | Link |
|---|---|
| US (1) | US8073218B2 (en) |
Cited By (2)
| Publication number | Priority date | Publication date | Assignee | Title |
|---|---|---|---|---|
| US20140086346A1 (en) * | 2012-09-21 | 2014-03-27 | Samsung Electronics Co., Ltd. | Method and system for removal of baseline wander and power-line interference |
| US9364160B2 (en) | 2012-03-28 | 2016-06-14 | Qualcomm Incorporated | Systems and methods for ECG monitoring |
Families Citing this family (4)
| Publication number | Priority date | Publication date | Assignee | Title |
|---|---|---|---|---|
| US20130101047A1 (en) * | 2011-10-19 | 2013-04-25 | Sony Corporation | Context reduction of significance map coding of 4x4 and 8x8 transform coefficient in hm4.0 |
| US9380953B2 (en) * | 2014-01-29 | 2016-07-05 | Biosense Webster (Israel) Ltd. | Hybrid bipolar/unipolar detection of activation wavefront |
| US9936919B2 (en) * | 2015-09-25 | 2018-04-10 | Intel Corporation | Devices, systems, and methods for determining heart rate of a subject from noisy electrocardiogram data |
| CN111603174B (en) * | 2020-05-11 | 2022-05-27 | 杭州柔谷科技有限公司 | Blood oxygen detection method and device, electronic equipment and storage medium |
Citations (14)
| Publication number | Priority date | Publication date | Assignee | Title |
|---|---|---|---|---|
| US20020099686A1 (en) | 2000-07-27 | 2002-07-25 | Schwartz Eric L. | Method and apparatus for analyzing a patient medical information database to identify patients likely to experience a problematic disease transition |
| US6470320B1 (en) | 1997-03-17 | 2002-10-22 | The Board Of Regents Of The University Of Oklahoma | Digital disease management system |
| US6533724B2 (en) | 2001-04-26 | 2003-03-18 | Abiomed, Inc. | Decision analysis system and method for evaluating patient candidacy for a therapeutic procedure |
| US20030101076A1 (en) | 2001-10-02 | 2003-05-29 | Zaleski John R. | System for supporting clinical decision making through the modeling of acquired patient medical information |
| US6658287B1 (en) * | 1998-08-24 | 2003-12-02 | Georgia Tech Research Corporation | Method and apparatus for predicting the onset of seizures based on features derived from signals indicative of brain activity |
| US20040015337A1 (en) | 2002-01-04 | 2004-01-22 | Thomas Austin W. | Systems and methods for predicting disease behavior |
| US20040078232A1 (en) | 2002-06-03 | 2004-04-22 | Troiani John S. | System and method for predicting acute, nonspecific health events |
| US20040103001A1 (en) | 2002-11-26 | 2004-05-27 | Mazar Scott Thomas | System and method for automatic diagnosis of patient health |
| US20040236188A1 (en) | 2003-05-19 | 2004-11-25 | Ge Medical Systems Information | Method and apparatus for monitoring using a mathematical model |
| US20050119534A1 (en) | 2003-10-23 | 2005-06-02 | Pfizer, Inc. | Method for predicting the onset or change of a medical condition |
| US20060025931A1 (en) | 2004-07-30 | 2006-02-02 | Richard Rosen | Method and apparatus for real time predictive modeling for chronically ill patients |
| US20060173663A1 (en) | 2004-12-30 | 2006-08-03 | Proventys, Inc. | Methods, system, and computer program products for developing and using predictive models for predicting a plurality of medical outcomes, for evaluating intervention strategies, and for simultaneously validating biomarker causality |
| US20060224416A1 (en) | 2005-03-29 | 2006-10-05 | Group Health Plan, Inc., D/B/A Healthpartners | Method and computer program product for predicting and minimizing future behavioral health-related hospital admissions |
| US7397936B2 (en) * | 2003-08-13 | 2008-07-08 | Siemens Medical Solutions Usa, Inc. | Method and system for wavelet based detection of colon polyps |
-
2008
- 2008-09-25 US US12/284,999 patent/US8073218B2/en not_active Expired - Fee Related
Patent Citations (14)
| Publication number | Priority date | Publication date | Assignee | Title |
|---|---|---|---|---|
| US6470320B1 (en) | 1997-03-17 | 2002-10-22 | The Board Of Regents Of The University Of Oklahoma | Digital disease management system |
| US6658287B1 (en) * | 1998-08-24 | 2003-12-02 | Georgia Tech Research Corporation | Method and apparatus for predicting the onset of seizures based on features derived from signals indicative of brain activity |
| US20020099686A1 (en) | 2000-07-27 | 2002-07-25 | Schwartz Eric L. | Method and apparatus for analyzing a patient medical information database to identify patients likely to experience a problematic disease transition |
| US6533724B2 (en) | 2001-04-26 | 2003-03-18 | Abiomed, Inc. | Decision analysis system and method for evaluating patient candidacy for a therapeutic procedure |
| US20030101076A1 (en) | 2001-10-02 | 2003-05-29 | Zaleski John R. | System for supporting clinical decision making through the modeling of acquired patient medical information |
| US20040015337A1 (en) | 2002-01-04 | 2004-01-22 | Thomas Austin W. | Systems and methods for predicting disease behavior |
| US20040078232A1 (en) | 2002-06-03 | 2004-04-22 | Troiani John S. | System and method for predicting acute, nonspecific health events |
| US20040103001A1 (en) | 2002-11-26 | 2004-05-27 | Mazar Scott Thomas | System and method for automatic diagnosis of patient health |
| US20040236188A1 (en) | 2003-05-19 | 2004-11-25 | Ge Medical Systems Information | Method and apparatus for monitoring using a mathematical model |
| US7397936B2 (en) * | 2003-08-13 | 2008-07-08 | Siemens Medical Solutions Usa, Inc. | Method and system for wavelet based detection of colon polyps |
| US20050119534A1 (en) | 2003-10-23 | 2005-06-02 | Pfizer, Inc. | Method for predicting the onset or change of a medical condition |
| US20060025931A1 (en) | 2004-07-30 | 2006-02-02 | Richard Rosen | Method and apparatus for real time predictive modeling for chronically ill patients |
| US20060173663A1 (en) | 2004-12-30 | 2006-08-03 | Proventys, Inc. | Methods, system, and computer program products for developing and using predictive models for predicting a plurality of medical outcomes, for evaluating intervention strategies, and for simultaneously validating biomarker causality |
| US20060224416A1 (en) | 2005-03-29 | 2006-10-05 | Group Health Plan, Inc., D/B/A Healthpartners | Method and computer program product for predicting and minimizing future behavioral health-related hospital admissions |
Cited By (2)
| Publication number | Priority date | Publication date | Assignee | Title |
|---|---|---|---|---|
| US9364160B2 (en) | 2012-03-28 | 2016-06-14 | Qualcomm Incorporated | Systems and methods for ECG monitoring |
| US20140086346A1 (en) * | 2012-09-21 | 2014-03-27 | Samsung Electronics Co., Ltd. | Method and system for removal of baseline wander and power-line interference |
Also Published As
| Publication number | Publication date |
|---|---|
| US20100074482A1 (en) | 2010-03-25 |
Similar Documents
| Publication | Publication Date | Title |
|---|---|---|
| US8233972B2 (en) | System for cardiac arrhythmia detection and characterization | |
| US9050007B1 (en) | Extraction of cardiac signal data | |
| US8064991B2 (en) | Method of fetal and maternal ECG identification across multiple EPOCHS | |
| US8718753B2 (en) | Motion and noise artifact detection for ECG data | |
| US7727159B2 (en) | Apparatus and method for detecting blood flow signal free from motion artifact and stress test apparatus using the same | |
| US8543194B2 (en) | System and method of detecting abnormal movement of a physical object | |
| EP2375982B1 (en) | Method and apparatus for the analysis of ballistocardiogram signals | |
| US8073218B2 (en) | Method for detecting bio signal features in the presence of noise | |
| US20130144180A1 (en) | Methods and systems for atrial fibrillation detection | |
| CN110840443B (en) | Electrocardiosignal processing method, electrocardiosignal processing device and electronic equipment | |
| WO2019225662A1 (en) | Instantaneous heartbeat reliability evaluation device, method, and program | |
| US10779769B2 (en) | Method and system for evaluating a noise level of a biosignal | |
| JP6244724B2 (en) | Frequency domain analysis transformation of renal blood flow Doppler signal to determine stress level | |
| US8301230B2 (en) | Method for reducing baseline drift in a biological signal | |
| WO2017174738A1 (en) | Method and display for reliability of the real-time measurements of physiological signals | |
| KR20160008368A (en) | Method and apparatus for processing biosignal using recursive estimation | |
| Hegde et al. | A review on ECG signal processing and HRV analysis | |
| Prabhakararao et al. | Automatic quality estimation of 12-lead ECG for remote healthcare monitoring systems | |
| JP2017086293A (en) | Physiological indicator detection device, physiological indicator detection method and physiological indicator detection processing program | |
| CN109390054A (en) | System, method and readable medium for analyzing cardiac beat signals for estimating atrial fibrillation | |
| EP2836121B1 (en) | Blood gas determination | |
| US11311245B2 (en) | ECG noise-filtering device | |
| CN111685754B (en) | Heart rate calculation method and system for wearable ECG acquisition equipment | |
| US11771358B2 (en) | Rhythmic synchronization of motor neuron discharges and their burst rate variability | |
| US8731647B2 (en) | Method and system for analyzing the cardiac activity of a patient and uses thereof |
Legal Events
| Date | Code | Title | Description |
|---|---|---|---|
| AS | Assignment |
Owner name: AIR PRODUCTS AND CHEMICALS, INC.,PENNSYLVANIA Free format text: ASSIGNMENT OF ASSIGNORS INTEREST;ASSIGNOR:TOTH, MICHAEL S.;REEL/FRAME:021809/0287 Effective date: 20080925 Owner name: AIR PRODUCTS AND CHEMICALS, INC., PENNSYLVANIA Free format text: ASSIGNMENT OF ASSIGNORS INTEREST;ASSIGNOR:TOTH, MICHAEL S.;REEL/FRAME:021809/0287 Effective date: 20080925 |
|
| AS | Assignment |
Owner name: AIR PRODUCTS AND CHEMICALS, INC.,PENNSYLVANIA Free format text: CORRECTIVE ASSIGNMENT TO CORRECT THE CONVEYING PARTY DATA PREVIOUSLY RECORDED ON REEL 021809 FRAME 0287. ASSIGNOR(S) HEREBY CONFIRMS THE CORRECTIVE ASSIGNMENT TO CORRECT THE CONVEYING PARTY DATA PREVIOUSLY RECORDED;ASSIGNORS:TOTH, MICHAEL S.;PETIT, CECILIA ANNA PAULETTE;REEL/FRAME:021874/0241 Effective date: 20080925 Owner name: AIR PRODUCTS AND CHEMICALS, INC., PENNSYLVANIA Free format text: CORRECTIVE ASSIGNMENT TO CORRECT THE CONVEYING PARTY DATA PREVIOUSLY RECORDED ON REEL 021809 FRAME 0287. ASSIGNOR(S) HEREBY CONFIRMS THE CORRECTIVE ASSIGNMENT TO CORRECT THE CONVEYING PARTY DATA PREVIOUSLY RECORDED;ASSIGNORS:TOTH, MICHAEL S.;PETIT, CECILIA ANNA PAULETTE;REEL/FRAME:021874/0241 Effective date: 20080925 |
|
| STCF | Information on status: patent grant |
Free format text: PATENTED CASE |
|
| FPAY | Fee payment |
Year of fee payment: 4 |
|
| FEPP | Fee payment procedure |
Free format text: MAINTENANCE FEE REMINDER MAILED (ORIGINAL EVENT CODE: REM.); ENTITY STATUS OF PATENT OWNER: LARGE ENTITY |
|
| LAPS | Lapse for failure to pay maintenance fees |
Free format text: PATENT EXPIRED FOR FAILURE TO PAY MAINTENANCE FEES (ORIGINAL EVENT CODE: EXP.); ENTITY STATUS OF PATENT OWNER: LARGE ENTITY |
|
| STCH | Information on status: patent discontinuation |
Free format text: PATENT EXPIRED DUE TO NONPAYMENT OF MAINTENANCE FEES UNDER 37 CFR 1.362 |
|
| FP | Lapsed due to failure to pay maintenance fee |
Effective date: 20191206 |