US8068898B2 - Fluorescence lifetime spectrometer (FLS) and methods of detecting diseased tissues - Google Patents
Fluorescence lifetime spectrometer (FLS) and methods of detecting diseased tissues Download PDFInfo
- Publication number
- US8068898B2 US8068898B2 US10/469,021 US46902102A US8068898B2 US 8068898 B2 US8068898 B2 US 8068898B2 US 46902102 A US46902102 A US 46902102A US 8068898 B2 US8068898 B2 US 8068898B2
- Authority
- US
- United States
- Prior art keywords
- tissue
- fluorescence
- emission
- fls
- cells
- Prior art date
- Legal status (The legal status is an assumption and is not a legal conclusion. Google has not performed a legal analysis and makes no representation as to the accuracy of the status listed.)
- Expired - Fee Related, expires
Links
Images


Classifications
-
- G—PHYSICS
- G01—MEASURING; TESTING
- G01N—INVESTIGATING OR ANALYSING MATERIALS BY DETERMINING THEIR CHEMICAL OR PHYSICAL PROPERTIES
- G01N21/00—Investigating or analysing materials by the use of optical means, i.e. using sub-millimetre waves, infrared, visible or ultraviolet light
- G01N21/62—Systems in which the material investigated is excited whereby it emits light or causes a change in wavelength of the incident light
- G01N21/63—Systems in which the material investigated is excited whereby it emits light or causes a change in wavelength of the incident light optically excited
- G01N21/64—Fluorescence; Phosphorescence
- G01N21/6408—Fluorescence; Phosphorescence with measurement of decay time, time resolved fluorescence
-
- A—HUMAN NECESSITIES
- A61—MEDICAL OR VETERINARY SCIENCE; HYGIENE
- A61B—DIAGNOSIS; SURGERY; IDENTIFICATION
- A61B5/00—Measuring for diagnostic purposes; Identification of persons
- A61B5/0059—Measuring for diagnostic purposes; Identification of persons using light, e.g. diagnosis by transillumination, diascopy, fluorescence
-
- G—PHYSICS
- G01—MEASURING; TESTING
- G01N—INVESTIGATING OR ANALYSING MATERIALS BY DETERMINING THEIR CHEMICAL OR PHYSICAL PROPERTIES
- G01N21/00—Investigating or analysing materials by the use of optical means, i.e. using sub-millimetre waves, infrared, visible or ultraviolet light
- G01N21/62—Systems in which the material investigated is excited whereby it emits light or causes a change in wavelength of the incident light
- G01N21/63—Systems in which the material investigated is excited whereby it emits light or causes a change in wavelength of the incident light optically excited
- G01N21/64—Fluorescence; Phosphorescence
- G01N21/645—Specially adapted constructive features of fluorimeters
- G01N21/6456—Spatial resolved fluorescence measurements; Imaging
- G01N21/6458—Fluorescence microscopy
-
- G—PHYSICS
- G01—MEASURING; TESTING
- G01N—INVESTIGATING OR ANALYSING MATERIALS BY DETERMINING THEIR CHEMICAL OR PHYSICAL PROPERTIES
- G01N21/00—Investigating or analysing materials by the use of optical means, i.e. using sub-millimetre waves, infrared, visible or ultraviolet light
- G01N21/62—Systems in which the material investigated is excited whereby it emits light or causes a change in wavelength of the incident light
- G01N21/63—Systems in which the material investigated is excited whereby it emits light or causes a change in wavelength of the incident light optically excited
- G01N21/64—Fluorescence; Phosphorescence
- G01N21/6486—Measuring fluorescence of biological material, e.g. DNA, RNA, cells
-
- G—PHYSICS
- G01—MEASURING; TESTING
- G01N—INVESTIGATING OR ANALYSING MATERIALS BY DETERMINING THEIR CHEMICAL OR PHYSICAL PROPERTIES
- G01N21/00—Investigating or analysing materials by the use of optical means, i.e. using sub-millimetre waves, infrared, visible or ultraviolet light
- G01N21/62—Systems in which the material investigated is excited whereby it emits light or causes a change in wavelength of the incident light
- G01N21/63—Systems in which the material investigated is excited whereby it emits light or causes a change in wavelength of the incident light optically excited
- G01N21/64—Fluorescence; Phosphorescence
- G01N2021/6417—Spectrofluorimetric devices
Definitions
- This invention relates to methods and apparatus for collection of the complete fluorescence emission spectrum and the transient decay of a selected spectral band simultaneously with data acquisition times of less than one second.
- Laser-induced fluorescence spectroscopy has been employed to probe complex biological systems, like cells and tissues, for biochemical and morphological alterations associated with early evidence of diseases, potentially leading to non-invasive diagnosis in vivo. Once diagnosed, such tissue may be treated at their earliest stages, reducing or preventing the risk of developing clinically apparent diseases that often have associated morbidity or mortality, like cancer.
- tissue fluorescence spectroscopy has been explored as a non-invasive means of detecting both cancers and pre-neoplasia (pre-malignancy) in vivo.
- tissue fluorescence spectroscopy light is used to probe endogenous biological fluorophores like collagen, elastin, NADPH, and tryptophan. Because tissue is an inhomogeneous medium, fluorescence signals measured in vivo reflect tissue morphology and optical absorption and scattering properties, as well as local biochemistry. These signals provide detailed information regarding tissue microenvironment and disease in a non-invasive way.
- U.S. Pat. No. 6,062,591 discloses an arrangement and method for diagnosis of malignant tissue by fluorescent observation using a stroboscope as a white light source to illuminate tissues through an endoscope, while a laser stimulates the fluorescence.
- U.S. Pat. No. 5,377,676 discloses a method for determining the biodistribution of substances using fluorescence spectroscopy.
- U.S. Pat. No. 5,208,651 discloses an apparatus and method for measuring fluorescence intensities at a plurality of wavelengths.
- Fluorophore lifetimes which depend on both radiative and non-radiative decay mechanisms, are known to be extremely sensitive to the local biochemical environment and to vary with pH and oxygenation, both of which may differ between diseased and normal tissue. This was demonstrated explicitly for NADH, where the average lifetime was found to vary by a factor of approximately six between mitochondrial NADH and NADH in aqueous solution. Further, because fluorophore lifetime does not change with variations in excitation intensity or optical losses from hemoglobin absorption, time-resolved measurements are intensity independent.
- the present invention relates to a portable Fluorescence Lifetime Spectrometer (FLS) designed to be compatible with both laboratory and clinical research studies on biological systems (cells and tissues), and which is useful to successfully discriminate cancerous and pre-cancerous tissues or cells from normal tissues or cells in vivo.
- FLS Fluorescence Lifetime Spectrometer
- the present invention also provides related methods for using the FLS to diagnose, pre-cancerous and cancerous tissues or cells and to distinguish from normal tissues or cells in vivo.
- An object of the present invention is to provide an apparatus for measuring spectral and temporal fluorescence properties of tissue or cells simultaneously to detect precancerous and cancerous tissues in vivo.
- Another object of the present invention is to provide a method for measuring spectral and temporal fluorescence properties of tissue or cells simultaneously in vivo.
- Yet another object of the present invention is to provide a method for detecting precancerous and cancerous tissues or cells in vivo which comprises measuring spectral and temporal fluorescent properties of a tissue or cell sample in vivo simultaneously.
- FIG. 1 shows a schematic of the FLS instrument.
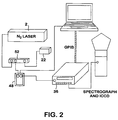
- FIG. 2 shows a schematic of the FLS electrical system design.
- the nitrogen laser provides an initiation pulse that is conditioned via a pulse conditioner containing a fast, monostable, multi-vibrator chip. This pulse is used to control the intensified charge coupled device (ICCD) gate timing via the delay generator.
- ICCD intensified charge coupled device
- FIGS. 3 a and 3 b show instrument response corrected steady state ( FIG. 3 a ) and time-resolved ( FIG. 3 b ) (shown by dotted line) endogenous fluorescence emissions from human skin (337.1 nm excitation). The measurement was made using a fiber optic probe placed on the inside of the forearm and data was acquired in 1 second.
- FIGS. 4( a ) and 4 ( b ) provide exemplary 337.1 nm excited, steady-state ( FIG. 4 a ) and time-resolved ( FIG. 4 b ) tissue autofluorescence curves normalized to peak values for both normal and abnormal lung tissue.
- fluorescence emission spectra from endogenous fluorophores consist of broad bands. Fluorescence spectra recorded from tissues are therefore complicated by overlapping bands from multiple constituent fluorophores. To gain diagnostic value, these complex spectra are corrected for system response, then analyzed or modeled using techniques such as multivariate linear regression, Monte Carlo simulation, and partial least squares discriminant analysis. The intensity of the fluorescence emission from pre-neoplastic and malignant tissues is generally lower than that from normal tissues.
- fluorescence signals typically decay on nanosecond (10 ⁇ 9 seconds) to sub-nanosecond time scales. Increased non-radiative decay leads to decreased quantum yield (ratio of the number of photons emitted to the number of photons absorbed), as well as decreased lifetime.
- quantum yield ratio of the number of photons emitted to the number of photons absorbed
- spectrally resolved measurements are inherently intensity dependant. Accordingly, there is a need for new screening methods and apparatuses which can effectively diagnose pre-malignant (pre-neoplastic) tissues and cells in vivo.
- the present invention relates to an apparatus, called a Fluorescence Lifetime Spectrometer (FLS), which uses fluorescence lifetime spectroscopy.
- FLS Fluorescence Lifetime Spectrometer
- the FLS is capable of collecting the complete fluorescence emission spectrum and the transient decay of a selected spectral band simultaneously with data acquisition times less than one second. This rapid acquisition makes this technique clinically adaptable.
- the FLS is capable of accurately resolving fluorophore lifetimes from hundreds of picoseconds to tens of nanoseconds in duration, with an ultimate temporal resolution of 360 picoseconds.
- the resolution, sensitivity, range, and speed of the FLS are appropriate for detecting endogenous fluorophores in biological systems.
- the FLS is a compact, portable instrument and may be used upon a three-shelf cart system, where one shelf holds a computer which may be used to control FLS detection parameters and data acquisition. A second shelf may be used to hold the optics and detectors. Vibration may be isolated from the cart via a spring platform. Power supplies and peripheral electronics may be located on a separate shelf. For clinical use, the two bottom shelves may be enclosed.
- the apparatus of the present invention measures both the spectral and temporal fluorescence properties of tissue or cells.
- the apparatus of the present invention comprises a primary excitation light source; an optical fiber probe which delivers light to a remote tissue or cell sample and which collects resulting fluorescent emissions from the tissue or cell sample; a means of directing the returning fluorescent emissions from the sample to both spectral and temporal detections schemes; a spectrometer coupled intensified charge coupled device (ICCD) which detects fluorescent emissions from the tissue or cell sample and derives therefrom spectral fluorescence properties of the tissue or cell sample; a photodetector which detects temporal fluorescence emissions output from the sample; and a means connected to the photodetector for transiently digitizing a signal from the photodetector and deriving temporal fluorescence properties of the tissue or cell sample from the signal.
- the tissue or cell sample readings are compared to readings of known tissue types, preferably known normal tissue or cell samples and/or known cancerous or precancerous tissue or cell samples
- the primary excitation light source 2 comprises a compact, pulsed nitrogen pump laser used as a fundamental 337.1 nm excitation source.
- a compact, pulsed nitrogen pump laser used as a fundamental 337.1 nm excitation source.
- solid state lasers can also be used.
- This nitrogen pump laser has a pulsewidth of 4 ns and a spectral bandwidth of 0.1 nm.
- other lasers with pulsewidths ⁇ 5 nm and bandwidths ⁇ 3 nm can be used.
- the nitrogen pump laser is preferably capable of operating between 1 and 20 Hz, and is typically run at 10 Hz, with a total pump energy of 144 ⁇ J/pulse.
- the output of the primary excitation light source 2 is used for sample excitation by delivery of light through an optical fiber probe 8 to a sample.
- the primary excitation light source 2 may also be used for pumping a secondary excitation light source 6 comprising a separate dye laser module capable of producing pulses of laser light in the range 360-950 nm, with pulse widths of 4 ns, bandwidths of 3-10 nm, and an average energy per pulse of 40 ⁇ J at 500 nm for sample excitation.
- the secondary excitation light source 6 output would be used for sample excitation by delivery of the light through an optical fiber probe 8 to a sample.
- the selected excitation light 2 , 6 is delivered into an optical fiber probe 8 by means of a wavelength specific dichroic mirror 12 and a lens 10 .
- the dichroic mirror 12 is located in the pathway of the excitation light and directs the excitation light through an adjacently located lens 10 onto the optical fiber probe 8 .
- the optical fiber probe 8 is preferably a quartz optical fiber probe, about 2.5 m long, 600 ⁇ m diameter. However, the probe may also comprise fiber bundles. Further, length and size of the probe can be varied to be compatible with the endoscope.
- the lens 10 be quartz. However, a glass lens can also be used for wavelengths longer than 400 nm.
- the lens 10 and optical fiber probe 8 preferably have matched numerical apertures of 0.22. This fiber is used to deliver excitation light to the sample and to collect the resulting fluorescence emission from the sample.
- the lens 10 collimates the returning emission, as well as any scattered excitation light.
- the dichroic mirror 12 and an adjacent long pass filter 14 as shown in FIG. 1 may be used to eliminate residual excitation light, allowing only fluorescence emission to pass through the long pass filter 14 .
- the fluorescence emission passing through the long pass filter 14 is then focused via an adjacent glass lens 16 and travels to a beam splitter 20 .
- a portion of the fluorescence emission which passes through the beam splitter is transmitted onto a detection fiber 18 , located adjacent to the lens and linked to the spectrometer coupled ICCD which detects fluorescent emissions output from the tissue or cell sample.
- the detection fiber and the beam splitter 20 are preferably quartz. However, for laser wavelengths greater than 400 nm, glass with reflective coating can also be used. Further, as will be understood by those of skill in the art upon reading this disclosure, other means well known in the art can also be used to transmit the fluorescence emission to the spectrometer coupled ICCD. In the embodiment of FIG.
- a portion of the fluorescence is split off with a beam splitter 20 and directed toward a high-speed avalanche photodiode module 22 located adjacent to the lens 10 which receives and analyzes fluorescent emissions output from the tissue or cell sample.
- the fluorescence intensity as a function of time is detected by the avalanche photodiode module 22 and digitized on a connected oscilloscope 36 .
- the oscilloscope analyzes a signal from the photodetector and derives the temporal fluorescence properties of the sample.
- the oscilloscope 36 is preferably a 1 GHz (5 GS/s) oscilloscope. Oscilloscopes with higher bandwidths can also be used.
- means other than an oscilloscope can be connected to the photodetector for transiently digitizing a signal from the photodetector and deriving temporal fluorescence properties of the tissue or cell sample from the signal.
- the temporal response of the high-speed avalanche photodiode module 22 is preferably optimized for detection from 400-1000 nm, with a rise time of about 300 ps, and a FWHM of about 500 ps.
- the spectrometer coupled ICCD analyzes the signal from the linked detection fiber and derives therefrom spectral fluorescence properties of the tissue or cell sample.
- the tissue or cell sample readings are compared to readings of known tissue types to determine the presence of pre-cancerous or cancerous tissues.
- neutral density filters 30 and 32 are placed in the excitation beam path and before the high-speed avalanche photodiode module to control fluorescence levels arriving at the sample and photodiode 22 , respectively.
- the spectrograph-coupled ICCD 28 collects the fluorescence emission in a single-shot, scan-free manner for fast data acquisition.
- the 1 ⁇ 8 meter (F/3.7) spectrograph is preferably equipped with a 1200 line/mm grating blazed at 350 nm and a fixed entrance slit 24 of 200 ⁇ m.
- the ICCD camera head is preferably thermoelectrically cooled to ⁇ 5° C. to help reduce dark noise associated with the CCD chip.
- the camera's CCD chip is preferably a 1024 ⁇ 128 ⁇ m pixel array, with an area per pixel of 26 ⁇ m 2 .
- the intensifier gate width is set to 100 ns. While the ICCD gate width is variable and could be set to values ranging from 3 ns to infinite duration (continuous operation), gate widths of about 100 ns are most effective at eliminating background light without reducing fluorescence emission intensity. Appropriate delays to compensate for light travel time and intensifier gating are produced using a delay generator, which effectively eliminates background radiation from interfering with the fluorescence spectrum acquisition.
- the design of the nitrogen pump laser must account for pulse-to-pulse jitter, both in time and in intensity.
- the pulse-to-pulse energy stability specification is preferably ⁇ 4% and the temporal jitter specification is ⁇ 40 ns.
- the ICCD camera accumulated signals and jitter would have no effect on the shape of the spectrum.
- the timing jitter in the output pulse of the nitrogen laser is accounted for by triggering the ICCD from the laser itself.
- the oscilloscope is triggered from the high-speed avalanche photodiode module output, which only produces a trigger event when fluorescence light arrives on the high-speed avalanche photodiode module.
- the oscilloscope trigger level is set to a relatively high threshold greater than or equal to the top 20% of the fluorescence signal. This eliminates any nitrogen laser intensity fluctuations greater than 20% from being averaged into the recorded temporal decay.
- the design of the FLS electrical configuration allows for external triggering of the ICCD gate and optimization of the gate timing to the arrival of the fluorescence.
- a near coincident electrical pulse on the main internal control board of the laser is used as an initiation trigger for the ICCD.
- this electrical trigger pulse may not be of the proper magnitude required by the ICCD multi-input/output box 48 (ICCD I/O Box in FIG. 2 ), which is +5 Volts transistor-transistor logic (TTL).
- TTL transistor-transistor logic
- it is highly susceptible to electrical ringing introduced by the spark-gap discharge of the laser.
- this sync-out is conditioned via a high-speed, monostable, non-retriggerable, multi-vibrator.
- This multi-vibrator will condition nominal electrical pulse into stable TTL pulse with a controllable width.
- This circuit is designated the Pulse Conditioner Circuit 52 in FIG. 2 .
- the pump laser may produce considerable electromagnetic interference and radio frequency emission (EMI/RF) noise that can interfere with optical detectors. This noise results from the discharge of the laser's internal high voltage power supplies.
- EMI/RF noise results from the discharge of the laser's internal high voltage power supplies.
- the laser may be enclosed in two Faraday cages that are electrically isolated from the system and from each other.
- the internal cage is constructed of copper mesh
- the external cage is 2 mm thick aluminum
- all holes for cabling and light exit were kept to a maximum diameter of 15 mm.
- all signal and electrical cables should have a minimum of two layers of braided EMI shielding.
- the EMI/RF noise emitted by the laser may greatly interfere with the output signal of the High-speed avalanche photodiode module.
- the pulse conditioner circuit 52 is designed to operate as an electrical filter, and serves two purposes.
- the pulse conditioner circuit conditions the sync-out of the nitrogen laser, as indicated above.
- the multi-vibrator by the nature of its non-retriggerable operation, has the added feature that it filters the noise associated with the sync-out.
- This simple circuit adds a nominal temporal delay to the trigger pulse.
- additional EMI filtering is achieved by introducing three wire wound ferrite coils into the circuit, which help to filter any EMI noise traveling along the center of the Bayonet Connector (BNC) cables.
- BNC Bayonet Connector
- the EMI/RF noise emitted from the nitrogen laser is measured to range above 100 MHZ, where the attenuation provided by the circuit is maximal.
- the noise propagating to the High-speed avalanche photodiode module is greatly attenuated.
- the pulse conditioner circuit powers the High-speed avalanche photodiode module with a stable DC voltage (12.0 ⁇ 0.1 V). This can be achieved by using a small wall mount power supply which also supplies the power needed for the rest of the circuit. Outputs of this pulse conditioning circuit may be operated simultaneously or independently of each other. The ICCD is not affected by radiated electrical noise.
- the software control program of the present invention is designed to be a graphical user interface (GUI) providing instrument parameter flexibility with simplified data collection.
- GUI graphical user interface
- the GUI has two primary functions. First, the software controlled the thermoelectric cooling of the ICCD. This function included restricting data acquisition until a user-defined temperature is reached, monitoring and maintaining this temperature during data collection, and permitting controlled shutdown of the ICCD after use. This software function is necessary to prevent thermal stress on the image intensifier's output optical fibers. Without this control, shearing of these optical fibers from the silicon face-plate of the CCD might occur.
- the software provides a user interface for FLS parameter adjustments and data acquisition.
- the software permits the ICCD to operate in a real-time mode that continuously and simultaneously displays the measured fluorescence emission spectrum and transient decay on-screen.
- This continuous mode operation which is the default mode of the software, provides the user with an immediate gauge of signal levels and variability.
- the user clicks a graphical panel button which changes the ICCD and oscilloscope to accumulate and average modes, respectively.
- Data from a user-defined number of laser pulses is then simultaneously gathered from the ICCD and oscilloscope. This information is then stored as an indexed ASCII file on the computer hard drive.
- the ICCD and oscilloscope are returned to continuous operation and the instrument is immediately prepared for the next measurement.
- ICCD parameters including the number of accumulated emission spectra, exposure time, and chip temperature are accessible through the GUI.
- the parameters of the oscilloscope or other transient digitizer may be changed manually on the instrument itself. While these parameters are easily incorporated into the software design, most can be eliminated to avoid unnecessary complication with the user interface. All graphical data outputs observed by the user are autoscaled to eliminate the need for physical adjustments to the FLS between measurements.
- the software package is designed to provide a user-friendly interface for the FLS without sacrificing the sensitivity and flexibility of the instrument.
- a method for measuring spectral and temporal fluorescence properties of tissue simultaneously is also provided. According to this method an excitation light source is brought into contact with a tissue or cell sample and the tissue or cell sample is excited with the excitation light source to produce fluorescence from the tissue. The fluorescence emitted from the sample is collected and further detected with simultaneous spectral and temporal resolution.
- the method of the present invention is useful in measuring the spectral and temporal properties of a tissue or cells and comparing these to measurements of healthy tissue or cells and/or diseased tissue or cells to determine the existing condition of the tissues.
- the method of the present invention can be used to detect precancerous and cancerous changes in tissues or cells in vivo.
- changes in endogenous fluorescence such as NADPH and flavoprotein content may be detected spectrally and temporally and are indicative of precancerous or cancerous change.
- spectral and temporal fluorescent properties of a tissue or cell sample can be determined in accordance with the method of the present invention and can be compared to a normal, healthy tissue or cells and/or cancerous tissue or cells to identify any changes in endogenous fluorescence of the tissue of cell sample indicative of a precancerous or cancerous change.
- the apparatus has the ability to measure both endogenous and exogenous fluorescence, thus rendering it useful to monitor exogenous fluorescence in photodynamic therapy. Accordingly, the apparatus may be used to monitor drug uptake via detection of exogenous fluorescence, to monitor therapeutic intervention by photodynamic therapy via detection of endogenous and exogenous fluorescence, and to monitor therapeutic intervention with chemopreventative agents via detection of endogenous fluorescence.
- the tissue autofluorescence was examined as a method of non-invasive pre-neoplasia (pre-malignancy) detection in the lung.
- pre-malignancy non-invasive pre-neoplasia
- the intrinsic cellular autofluorescence from SV40 immortalized and distinct tobacco carcinogen-transformed (malignant) human bronchial epithelial cells was examined.
- These cell lines are useful models for studies seeking to distinguish between normal and pre-neoplastic human bronchial epithelial cells.
- the cells were characterized via spectrofluorimetry and confocal fluorescence microscopy.
- the maximum intensities of the EEMs were normalized for comparison and the wavelengths limited for presentation clarity. Two dominant peaks were observed in both the BEAS-2B and BEAS-2B NNK cells. These two peaks occurred at 220/330 and 287/330 nm (excitation/emission wavelengths). These peaks corresponded closely with the peaks observed in the EEM of pure tryptophan (220/350 and 287/350 nm). The peak at longer wavelength excitation is reported to be the result of two closely spaced levels, the 1 L a and 1 L b of the indole moiety, while the shorter wavelength peak is the result of a higher electronic transition.
- Excitation and emission spectra for pure tryptophan in PBS and BEAS-2B and BEAS-2B NNK cells in PBS were determined.
- the spectra were recorded at the maxima of emission or excitation, as determined by the corresponding EEM.
- the autofluorescence spectra recorded from both bronchial epithelial cell lines closely resembled the characteristic fluorescence of the amino acid tryptophan.
- confocal fluorescence microscopy a Leica confocal microscope was used to measure the autofluorescence of individual BEAS-2B and BEAS-2B NNK cells. This highly sensitive spectrophotometer coupled instrument allowed for the detection and spatial localization of distinct fluorophore species and excluded any appreciable contribution from other species, via tunable wavelength discrimination.
- Two differential interference contrast (DIC) images of BEAS-2B cells were determined with corresponding overlays of pseudo-color confocal fluorescence images. The images were collected using an excitation wavelength of 351 nm and emission intensity integration between 426 and 454 nm. The images revealed granular cytoplasmic autofluorescent structures with excitation/emission characteristics that corresponded closely with known NADH values.
- the changes in cellular autofluorescence between immortalized and carcinogen-transformed human bronchial epithelial cells provide evidence of the utility of the apparatus and method of the present invention in noninvasively diagnosing pre-neoplasia in lung tissue using fluorescence spectroscopy and imaging.
- the in vivo FLS measurement protocol facilitated dual wavelength excitations of 337.1 nm and 450 nm, with steady state emission collected from 390 nm to 620 nm and fluorescence lifetime emission limited to 430 nm ⁇ 50 nm or 550 nm ⁇ 50 nm(fwhm) based upon the APD bandpass filter.
- Laser power was limited via quartz neutral density filters and measured prior to each set of experiments for intensity normalization.
- the fluorescence light fluence arriving at the APD was limited to less than 500 mV using glass neutral density filters.
- Neoplastic appearing tissue was measured a minimum of three times while simultaneously collecting the steady-state and time-resolved autofluorescence.
- the fiber was removed from the tissue surface and replaced between each measurement. Normal appearing tissue was measured in a similar manner. Following each set of measurements the interrogated tissue (abnormal and normal) was biopsied for histopathological analysis. All fibers were steam sterilized for 30 minutes prior to clinical use.
- FIG. 4 shows an example of the 337.1 nm excited, steady-state ( FIG. 4 a ) and time-resolved ( FIG. 4 b ) tissue autofluorescence curves normalized to peak values which were generated in these in vivo measurements.
- the steady-state fluorescence emission spectrum depicted in FIG. 4 a of normal tissue shows a peak centered near 440 nm, consistent with NADPH. The portion of the curve in the bluest wavelength range is believed to result from collagen emission.
- the steady-state autofluorescence from the lesion was found to generally decrease in intensity relative to the normal tissue. Further, relative to collagen, the contribution from the NADPH structure was lower in the lesion than in normal tissue.
- FIG. 4 b illustrates that the average fluorescence lifetime of the normal tissue was slightly lower than that of the lesion: 3.6 ⁇ 0.1 nanoseconds vs. 4.4 ⁇ 0.1 nanoseconds.
- the time-domain instrument response of the FLS included distortions introduced by the laser excitation pulse duration and the response of the electronics. It was measured using excitation light at 337.1 nm to induce fluorescence emission at 560 nm from 10 ⁇ 6 M Rose Bengal in deionized water. Rose Bengal in deionized water was well suited for determining the FLS instrument response for two reasons.
- Measured fluorescence spectral data were corrected for solvent contributions by background subtraction of a pre-recorded solvent emission spectrum, and for the non-uniformity of the instrument response by division with the wavelength dependent sensitivity factor S( ⁇ ).
- Fluorescence decays were analyzed by least-squares iterative reconvolution using the Marquardt algorithm (Light Analysis, Quantum Northwest, Inc.) to account for instrument response and to extract lifetimes and amplitudes.
- Intrinsic decays were modeled as multi-exponential decays
- FLS spectral resolution determined by measuring the FWHM of the 507.3 nm ⁇ line of the Hg(Ar) lamp, was found to be 3 nm, which is sufficient to resolve the relatively broad spectral bands associated with endogenous biological fluorophores.
- FLS spectral sensitivity was determined by measuring the SNR of the fluorescence emission from varying concentrations of fluorescein dye molecules in ethanol. Samples in the study ranged from 10 ⁇ 4 -10 ⁇ 7 M in concentration. For each sample, the total fluorescence emission induced by forty laser pulses (337.1 nm; 0.35 ⁇ Joules/pulse) was accumulated by the ICCD, with the intensifier gain set to a value of two. The following Table summarizes these results.
- the FLS is a highly sensitive instrument capable of detecting minute fluorophore concentrations in non-scattering media. This sensitivity was sufficient to detect endogenous fluorophore concentrations in turbid biological systems, as described below.
- the spectral dynamic range (DR) of the FLS was calculated from
- DR S max - N N
- S max was the maximum signal level achievable without ICCD saturation and N was the noise level recorded with the intensifier gain set to a typical value of two.
- the spectral dynamic range of the FLS was determined in this way to be 3 decades.
- the spectral range of the FLS was limited by the long pass filter ( FIG. 1 ) and the spectrograph grating to be 350-800 nm.
- the FLS was used to predict fluorophore lifetimes of a mixture of 9-cyanoanthracene and rhodamine 610.
- the decay from the mixture was best fit by a bi-exponential decay function, with lifetimes of 12.7 ⁇ 0.40 and 2.25 ⁇ 0.39 ns. These values were in reasonable agreement with the lifetime values of the individual fluorophores, 11.7 ⁇ 0.42 and 3.01 ⁇ 0.22 ns.
- the FLS instrument designed, calibrated and characterized above was applied to study systems of interest in biology and medicine.
- the excitation laser wavelength was 337.1 nm and the excitation laser energy was held below 20 ⁇ J/pulse.
- This value of nitrogen laser energy was recently determined to be a threshold below which artifacts due to photobleaching were minimized in studies on biological systems. Indeed, no effects due to photobleaching were observed in the measurements described below.
- these experimental conditions reflect FLS system parameters to be used in future biomedical applications of the instrument.
- the FLS instrument was employed to measure fluorescence lifetimes and amplitudes of several biomolecules known to be present in human cells and tissues, as summarized in the following Table.
- NADH and flavin adenine dinucleotide were dissolved in phosphate buffered saline (PBS) (21-040-CV Lot 21040039, Cellgro, Herndon, Va. USA) to concentrations less than 5 ⁇ 10 ⁇ 6 M.
- PBS phosphate buffered saline
- Tryptophan T-0254, Lot 29H0710, Sigma, St. Louis, Mo.
- elastin from bovine neck ligament, E-1626, Lot 35H710, Sigma, St. Louis, Mo. USA
- Samples were then placed in quartz cuvettes (Type 3, NSC Precision Cells Inc., Farmingdale, N.Y. USA) and the fiber optic probe from the FLS was brought into contact with the sample.
- the FLS instrument was designed to have the sensitivity, speed, and portability required for use in the clinic. In order to demonstrate this capability, the instrument was employed to measure endogenous fluorescence from human skin tissue in vivo. To perform the measurement, the fiber optic probe first was brought into gentle contact with skin on the inside of the forearm. Ten pulses of excitation light at 337.1 nm (4 ⁇ J/pulse) were then delivered to the skin via the fiber optic probe, and the resulting endogenous fluorescence was collected by the same probe and detected with simultaneous spectral and temporal resolution. A bandpass filter centered at 460 ⁇ 5 nm was placed before the High-speed avalanche photodiode module.
- FIG. 3( a ) shows a broad spectrum consistent with structural protein fluorescence
- BEAS-2B The cells studied were previously described and included a line (designated BEAS-2B) derived from normal human bronchial epithelial cells that was immortalized via transduction of the SV40 T antigen (Reddel et al. Cancer res. 1988 48:1904-1090.
- Another line (designated BEAS-2B NNK ) was derived through tobacco-carcinogen induced transformation of BEAS-2B cells following treatment with N-nitrosamine-4-(methylnitrosamino)-1-(3-pyridyl)-1-butanone (NNK) (Langenfeld et al. Oncogene 1996 13:1983-1999).
- BEAS-2B cells retain features of normal human bronchial epithelial cells, but can be continuously passaged in vitro.
- the tobacco carcinogen-transformed BEAS-2B NNK line has acquired characteristics of malignant bronchial epithelial cells including tumorigenicity in athymic mice and enhanced anchorage independent growth. These cell lines have proven useful for identifying carcinogenic and anti-carcinogenic pathways. These lines represent valuable models for studies seeking to distinguish between immortalized and transformed human bronchial epithelial cells.
- non-confluent monolayers of cells were prepared on standard cover slips by plating cells 24 hours prior to imaging. For each cell line, three independent cell cultures were maintained. From each culture, a minimum of two glass cover slips were used. The cover slips were moved from the incubator directly to the microscope, where multiple measurements were taken. All images were taken in culture medium. Visual inspection demonstrated that the presence of media increased the viability of the cells to greater than one hour. No sample was imaged for more than 45 minutes.
- Spectrofluorimetry measurements were performed on the model systems described above to characterize their autofluorescence properties.
- a Perkin-Elmer LS-50 Dual Monochromator Luminescence Spectrometer was used for fluorescence measurements throughout the ultraviolet, visible, and near-infrared regions of the electromagnetic spectrum.
- the instrument contained a Xenon-arc discharge lamp as an excitation light source and a red-enhanced photomultiplier tube (Hamamatsu R928), with an extended range of 200-900 nm, as an emission detector. Emission was collected at a 90-degree angle relative to the excitation light path.
- the wavelength accuracy of the instrument was ⁇ 1.0 nm, and the reproducibility was ⁇ 0.5 nm.
- Fluorescence imaging experiments were performed on a Leica confocal spectrophotometer (Model TCS SP) equipped with an upright Leica research microscope and the necessary optics for differential interference contrast (DIC) and conventional epi-illumination.
- the images presented here were collected with a 63 ⁇ , 1.32 N.A. planapochromatic objective and a 0.9 N.A. condenser.
- the confocal system employed fiber-coupled UV, argon, krypton-argon, and helium-neon lasers, providing excitation sources at wavelengths 351, 364, 488, 514, 568, and 633 nm. Imaging occurred via transmitted and fluorescent light detection, the latter via a tunable spectrophotometer instead of filter cubes.
- the continuously variable spectrophotometer allowed the user to determine the emission spectrum of a given fluorescent signal and to limit fluorescence collection to a precise emission range. This feature ensured that autofluorescence from living cells could be selectively scanned to identify the contributing wavelengths and that accurate fluorophore specific images could be obtained.
- cells were excited sequentially with two wavelengths (351 nm and 488 nm), rather than simultaneously, thus eliminating potential signal crossover between recording channels.
- the emission wavelength ranges detected were 426-454 nm, while exciting with 351 nm, and 530-555 nm, while exciting with 488 nm.
- the microscope, laser, spectrophotometer, image capture, and analysis all were under computer control.
Abstract
Description
S(λ)=(M Lamp(λ))/(T Lamp(λ))
where M(λ) is the measured sample emission and B(λ) is the background emission. M(λ) and B(λ) were measured in units of CCD counts per nanometer, a linear measure of photon numbers arriving at the detector, and S(λ) was unitless. The spectra collected were the result of accumulating the fluorescence emission resulting from 10 or more individual laser pulses, ensuring good signal to noise ratios (SNR). Spectral calibration was tested by recording the emission from the fluorescence standard quinine sulfate and data is depicted in the following Table.
| Lakowicz Data | FLS Measured Data | |
| Wavelength (nm) | (a.u.) | (a.u.) |
| 310 | 0 | — |
| 350 | 4 | — |
| 380 | 18 | — |
| 400 | 151 | 75 |
| 410 | 316 | 206 |
| 420 | 538 | 444 |
| 430 | 735 | 660 |
| 440 | 888 | 807 |
| 445 | 935 | 894 |
| 450 | 965 | 972 |
| 455 | 990 | 993 |
| 457.2 | 1000 | 998 |
| 460 | 998 | 984 |
| 465 | 979 | 951 |
| 470 | 951 | 909 |
| 475 | 916 | 868 |
| 480 | 871 | 844 |
| 490 | 733 | 740 |
| 500 | 616 | 600 |
| 520 | 408 | 381 |
| 550 | 171 | 173 |
| 600 | 19 | 30 |
| 650 | 3 | — |
| 700 | 0 | — |
The spectrum is in good agreement with known literature values, shown as solid circles.
M(t)=F(t)*I(t) (3)
with lifetimes τi and amplitudes αi. Thus, the normalized area under the intrinsic decay curve due to component I (or, the percentage contribution of component I to the overall fluorescence intensity) was given by
| Dye Concentration (M) | |
||
| 1 × 10⁻⁴ | 1.9 × 10⁴ | ||
| 1 × 10⁻⁵ | 1230 | ||
| 1 × 10⁻⁶ | 105 | ||
| 5 × 10⁻⁷ | 29 | ||
| 2.5 × 10⁻⁷ | 16 | ||
| 1 × 10⁻⁷ | 7 | ||
where Smax was the maximum signal level achievable without ICCD saturation and N was the noise level recorded with the intensifier gain set to a typical value of two. The spectral dynamic range of the FLS was determined in this way to be 3 decades. The spectral range of the FLS was limited by the long pass filter (
| Measured | Measur d | Literature (c) | Literature (c) | |
| Lifetime | Error | Lifetime | Error | |
| Fluorophore (a) | (ns) | (ns) | (ns) | (ns) |
| Rose Bengal in | 0.682 | 0.023 | 0.540 | |
| methanol | ||||
| Rose Bengal in | 0.821 | 0.023 | 0.600 | |
| methanol | ||||
| Rose Bengal | 0.859 | 0.024 | 0.850 | 0.030 |
| Rose Bengal | 0.843 | 0.030 | ||
| Rhodamine 610 | 1.67 | 0.030 | 1.52 | 0.050 |
| in H2O | ||||
| Rhodamine 610 | 1.86 | 0.080 | ||
| in H2O | ||||
| Rhodamine 610 | 3.01 | 0.220 | 2.6, 2.85 | 0.050 |
| Rhodamine 610 (b) | 3.56 | 0.100 | 2.79 | 0.050 |
| 9-cyanoanthracene | 11.7 | 0.420 | 11.85 | 0.030 |
| 9- | 14.4 | 0.440 | 14.76 | |
| cyanoanthraceneb | ||||
| 9-CA/R610 Mix | τ1 = 2.25 | 0.390 | ||
| τ2 = 12.7 | 0.400 | |||
| (a) <5 × 10⁻⁶ M in ethanol, unless specified | ||||
| (b) degassed with argon for 20 minutes | ||||
| (c) J. R. Lakowicz, Principles of Fluorescence Spectroscopy 1999. | ||||
| Fluorophore | Measured | Measured | Literature | Literature | |
| <5 × 10⁻⁶ M in | Lifetime | Area | Lifetime | Area | |
| PBS) | T1 | T2 | A1 | A2 | T1 | T2 | A1 | A2 | References |
| Tryptophan | 0.54 | 4.45 | 0.33 | 0.66 | 0.62 | 3.20 | 0.22 | 0.78 | 1 |
| 0.53 | 3.10 | 0.33 | 0.67 | 2 | |||||
| 1.47 | 2.78 | 0.72 | 0.28 | 3 | |||||
| Elastin | 1.63 | 7.36 | 0.36 | 0.64 | 1.7 | 8.3 | 4 | ||
| 1.3 | 5.8 | 4 | |||||||
| 1.4 | 6.7 | 0.58 | 0.42 | 3 | |||||
| 1.12 | 0.27 | 0.73 | 5 | ||||||
| 6.57 |
| FAD | 2.63 | 2.3 | 6 | ||||
| 2.85 | 5 | ||||||
| NADH (free) | 0.36 | 0.3 | 7 | ||||
| 0.26 | 8 | ||||||
| 0.66 | 0.77 | 0.23 | 3 | ||||
| 0.24 | 6 | ||||||
| 0.58 | |||||||
| 0.4 | 0.97 | 0.03 | 5 | ||||
| 0.38 | |||||||
| 1.38 | |||||||
| [1] J. Petrich, M. Chang, D. McDonald, G. Fleming, Journal of the American Chemical Society, 105, 3824-3832 (1983). | |||||||
| [2] A. Szabo, D. Rayner, Journal of th American Chemical Society, 102, 554-563 (1980). | |||||||
| [3] S. Andersson-Engels, J. Johansson, K. Svanberg, S. Svanberg, Photochemistry and Photobiology, Vol. 53, No. 6, pp. 807-814 (1991). | |||||||
| [4] J.-M. Maarek, W. J. Snyder, W. S. Grundfest, SPIE, 2980, 278-285 (1997) | |||||||
| [5] M.-A. Mycek, K. Vishwanath, K. T. Schomacker, N. S. Nishioka, Optical Society of America Technical Digest, 11-13 (2000) | |||||||
| [6] J. R. Lakowicz, Principles of Fluorescence Spectroscopy (Second Edition) New York, Kluwer Academic/Plenum (1999) | |||||||
| [7] K. Konig, M. W. Berns, B. J. Tromberg, Journal of Photochemistry and Photobiology, B, 37, 91-95 (1997) | |||||||
| [8] L. Pfeifer, K. Schmalzigaug, R. Paul, J. Lichey, K. Kemnitz, F. Fink, SPIE, 2627, 129-135 (1995). | |||||||
Corrected Emission=[M(λ)−B(λ)]/[S(λ)] (1)
where M(λ) is the measured sample emission and B(λ) and S(λ) are the background and sensitivity factors. Photobleaching of the cell suspension was not observed, as determined by rescanning several spectra at the completion of each experiment. All measurements were made a minimum of three times, using new cell cultures each time.
Claims (1)
Priority Applications (1)
| Application Number | Priority Date | Filing Date | Title |
|---|---|---|---|
| US10/469,021 US8068898B2 (en) | 2001-03-01 | 2002-02-28 | Fluorescence lifetime spectrometer (FLS) and methods of detecting diseased tissues |
Applications Claiming Priority (4)
| Application Number | Priority Date | Filing Date | Title |
|---|---|---|---|
| US27243801P | 2001-03-01 | 2001-03-01 | |
| US60272438 | 2001-03-01 | ||
| US10/469,021 US8068898B2 (en) | 2001-03-01 | 2002-02-28 | Fluorescence lifetime spectrometer (FLS) and methods of detecting diseased tissues |
| PCT/US2002/005980 WO2002069784A2 (en) | 2001-03-01 | 2002-02-28 | Fluorescence lifetime spectrometer (fls) and methods of detecting diseased tissues |
Related Parent Applications (1)
| Application Number | Title | Priority Date | Filing Date |
|---|---|---|---|
| PCT/US2002/005980 A-371-Of-International WO2002069784A2 (en) | 2001-03-01 | 2002-02-28 | Fluorescence lifetime spectrometer (fls) and methods of detecting diseased tissues |
Related Child Applications (1)
| Application Number | Title | Priority Date | Filing Date |
|---|---|---|---|
| US13/280,557 Continuation US8417324B2 (en) | 2001-03-01 | 2011-10-25 | Fluorescence lifetime spectrometer (FLS) and methods of detecting diseased tissue |
Publications (2)
| Publication Number | Publication Date |
|---|---|
| US20040073119A1 US20040073119A1 (en) | 2004-04-15 |
| US8068898B2 true US8068898B2 (en) | 2011-11-29 |
Family
ID=23039792
Family Applications (2)
| Application Number | Title | Priority Date | Filing Date |
|---|---|---|---|
| US10/469,021 Expired - Fee Related US8068898B2 (en) | 2001-03-01 | 2002-02-28 | Fluorescence lifetime spectrometer (FLS) and methods of detecting diseased tissues |
| US13/280,557 Expired - Fee Related US8417324B2 (en) | 2001-03-01 | 2011-10-25 | Fluorescence lifetime spectrometer (FLS) and methods of detecting diseased tissue |
Family Applications After (1)
| Application Number | Title | Priority Date | Filing Date |
|---|---|---|---|
| US13/280,557 Expired - Fee Related US8417324B2 (en) | 2001-03-01 | 2011-10-25 | Fluorescence lifetime spectrometer (FLS) and methods of detecting diseased tissue |
Country Status (4)
| Country | Link |
|---|---|
| US (2) | US8068898B2 (en) |
| EP (1) | EP1372483A2 (en) |
| JP (1) | JP2005504561A (en) |
| WO (1) | WO2002069784A2 (en) |
Families Citing this family (55)
| Publication number | Priority date | Publication date | Assignee | Title |
|---|---|---|---|---|
| US6992762B2 (en) * | 2002-11-11 | 2006-01-31 | Art Advanced Research Technologies Inc. | Method and apparatus for time resolved optical imaging of biological tissues as part of animals |
| JP4184228B2 (en) * | 2003-10-20 | 2008-11-19 | オリンパス株式会社 | Fluorescence lifetime measuring device |
| DE102004006960B4 (en) * | 2004-02-10 | 2021-03-18 | Heidelberg Engineering Gmbh | Method and arrangement for obtaining and evaluating high-contrast images of the time-resolved fluorescence of moving objects, for example the fundus of the eye |
| JP2005249760A (en) * | 2004-03-01 | 2005-09-15 | Atoo Kk | Method of measuring feeble light spectrum, and instrument therefor |
| US20080255462A1 (en) * | 2004-09-28 | 2008-10-16 | Zila Pharmaceuticals, Inc. | Light stick |
| US20060241501A1 (en) * | 2004-09-28 | 2006-10-26 | Zila Pharmaceuticals, Inc. | Method and apparatus for detecting abnormal epithelial tissue |
| US20090118624A1 (en) * | 2004-09-28 | 2009-05-07 | Zila Pharmaceuticals, Inc. | Device for oral cavity examination |
| MX2007003619A (en) * | 2004-09-28 | 2007-08-02 | Zila Pharm Inc | Methods for detecting abnormal epithelial tissue. |
| FR2878424B1 (en) | 2004-11-26 | 2008-02-01 | Oreal | METHOD FOR OBSERVING A BIOLOGICAL TISSUE, IN PARTICULAR HUMAN SKIN |
| WO2006135769A1 (en) * | 2005-06-10 | 2006-12-21 | The General Hospital Corporation | Fluorescence-lifetime-based tomography |
| WO2007002323A2 (en) * | 2005-06-23 | 2007-01-04 | Epoc, Inc. | System and method for monitoring of end organ oxygenation by measurement of in vivo cellular energy status |
| JP2009504333A (en) * | 2005-08-15 | 2009-02-05 | ザ ボード オブ リージェンツ オブ ザ ユニバーシティー オブ テキサス システム | Needle biopsy imaging system |
| US20070073160A1 (en) * | 2005-09-13 | 2007-03-29 | Children's Medical Center Corporation | Light-guided transluminal catheter |
| US8954134B2 (en) | 2005-09-13 | 2015-02-10 | Children's Medical Center Corporation | Light-guided transluminal catheter |
| DE102006029809B3 (en) * | 2006-06-28 | 2007-11-08 | Ltb Lasertechnik Berlin Gmbh | Melanin detecting method, involves facilitating fluorescence-excitation of melanin by photon absorption, and detecting melanin from emitted spectral fluorescence response by evaluation of number of emitted photons |
| JP4792580B2 (en) * | 2006-07-26 | 2011-10-12 | 国立大学法人北海道大学 | Luminescent lifetime measuring device and measuring method thereof |
| US8417959B2 (en) * | 2006-12-18 | 2013-04-09 | Southwest Research Institute | Biometric device based on luminescence |
| JP5093795B2 (en) * | 2007-01-11 | 2012-12-12 | 株式会社フジクラ | Fluorescence lifetime measuring apparatus, film forming apparatus, and fluorescence lifetime measuring method |
| US8098900B2 (en) * | 2007-03-06 | 2012-01-17 | Honeywell International Inc. | Skin detection sensor |
| KR101279911B1 (en) * | 2007-05-07 | 2013-06-28 | 베러티 인스트루먼트, 인코퍼레이티드 | Calibration of a radiometric optical monitoring system used for fault detection and process monitoring |
| JP5147379B2 (en) * | 2007-12-18 | 2013-02-20 | 花王株式会社 | Method and apparatus for visualizing melanin distribution |
| DE102008018476B4 (en) * | 2008-04-11 | 2022-12-15 | Carl Zeiss Microscopy Gmbh | microscopy device |
| CA2891990C (en) | 2008-05-20 | 2022-07-26 | Ralph Sebastian Dacosta | Device and method for fluorescence-based imaging and monitoring |
| US8954133B1 (en) | 2008-08-08 | 2015-02-10 | The United States Of America As Represented By The Department Of Veterans Affairs | Spectroscopic detection of brain damage |
| JP5415805B2 (en) * | 2009-03-31 | 2014-02-12 | オリンパスメディカルシステムズ株式会社 | Diagnosis support device |
| KR101746010B1 (en) | 2009-05-15 | 2017-06-12 | 프라운호퍼 게젤샤프트 쭈르 푀르데룽 데어 안겐반텐 포르슝 에. 베. | Method and device for detectong tumorous living cell tissue |
| EP2251675A1 (en) * | 2009-05-15 | 2010-11-17 | Fraunhofer-Gesellschaft zur Förderung der angewandten Forschung e.V. | Method for recognising cell tissue with tumours |
| FR2948007B1 (en) * | 2009-07-20 | 2012-06-08 | Chab Lama Al | FIBERED NEEDLE PROBE FOR OPTICAL DIAGNOSIS IN THE DEPTH OF TUMORS. |
| WO2011052491A1 (en) * | 2009-10-29 | 2011-05-05 | Hoya株式会社 | Device for helping diagnosis and method for helping diagnosis |
| JP5437864B2 (en) * | 2010-03-10 | 2014-03-12 | 富士フイルム株式会社 | Operating method of pH measuring device, operating method of detecting device, operating method of biological material analyzing device, and each device |
| JP2011185843A (en) * | 2010-03-10 | 2011-09-22 | Fujifilm Corp | INTRACELLULAR pH IMAGING METHOD USING FLUORESCENCE LIFETIME AND APPARATUS THEREFOR |
| JP2011185842A (en) * | 2010-03-10 | 2011-09-22 | Fujifilm Corp | Method and device for analyzing low oxygen region of biosample by time resolving measurement of light induced self-fluorescence |
| DE102010024732A1 (en) | 2010-06-23 | 2011-12-29 | Siemens Aktiengesellschaft | Method and device for detecting tumor-bearing tissue in the gastrointestinal tract with the aid of an endocapsule |
| JP5776992B2 (en) * | 2010-11-22 | 2015-09-09 | マックス−プランク−ゲゼルシャフト ツル フォルデルング デル ヴィッゼンシャフテン イー.ヴイ. | STED microscopy, STED fluorescence correlation spectroscopy, and STED fluorescence microscope for pulse excitation, continuous deexcitation, and gate recording of spontaneous emission fluorescence |
| EP2699904B1 (en) * | 2011-04-20 | 2017-06-21 | IM Co., Ltd. | Prostate cancer diagnosis device using fractal dimension value, and corresponding method |
| DK3171765T3 (en) | 2014-07-24 | 2021-11-01 | Univ Health Network | COLLECTION AND ANALYSIS OF DATA FOR DIAGNOSTIC PURPOSES |
| DE102014017006B4 (en) * | 2014-11-17 | 2019-07-11 | Technische Universität Ilmenau | Method for the determination and evaluation of time-resolved fluorescence or reflection images on extended three-dimensional surfaces |
| US10359414B2 (en) | 2015-03-09 | 2019-07-23 | The Regents Of The University Of Michigan | Frequency domain discrimination of tissue proteins |
| JP6113386B1 (en) | 2015-08-13 | 2017-04-12 | Hoya株式会社 | Evaluation value calculation apparatus and electronic endoscope system |
| CN106687023B (en) | 2015-08-13 | 2018-12-18 | Hoya株式会社 | Evaluate value calculation apparatus and electronic endoscope system |
| KR102049145B1 (en) * | 2016-04-04 | 2019-11-26 | 스페클립스 주식회사 | System and method for diagnosis of pigmented lesion |
| US10405785B2 (en) * | 2016-08-04 | 2019-09-10 | City University Of Hong Kong | Determination of a concentration of an analyte in a subject |
| IL265763B2 (en) | 2016-10-04 | 2023-04-01 | Univ California | Multi-frequency harmonic acoustography for target identification and border detection |
| CN106844824B (en) * | 2016-11-22 | 2020-05-12 | 电子科技大学 | Radio frequency crystal oscillator residual life estimation method based on accelerated vibration condition |
| JP6362666B2 (en) * | 2016-12-27 | 2018-07-25 | キヤノン株式会社 | Subject information acquisition device |
| EP4306042A3 (en) | 2017-03-22 | 2024-03-27 | Adiuvo Diagnostics PVT Ltd | Device and method for detection and classification of pathogens |
| WO2019059379A1 (en) * | 2017-09-21 | 2019-03-28 | 国立大学法人北海道大学 | Biological body examination device and biological body examination method |
| KR20200083512A (en) * | 2017-11-01 | 2020-07-08 | 더 리전츠 오브 더 유니버시티 오브 캘리포니아 | Imaging method and system for surgical margin evaluation during surgery |
| KR102279688B1 (en) | 2019-03-22 | 2021-07-20 | 스페클립스 주식회사 | Diagnosis method using laser induced breakdown spectroscopy and diagnosis device performing the same |
| EP3772645B1 (en) * | 2019-08-09 | 2023-02-08 | mfd Diagnostics GmbH | Method and device for detecting very low fluorescence |
| CN110916728A (en) * | 2019-12-10 | 2020-03-27 | 武汉大学中南医院 | Puncture biopsy method and device based on optical fiber transmission type fluorescence life guidance |
| CN111504958B (en) * | 2020-03-09 | 2022-12-09 | 哈尔滨工业大学 | Method for detecting fluorescence defect of processing surface layer of soft and brittle optical crystal |
| CN113155795B (en) * | 2021-04-15 | 2023-03-21 | 西北核技术研究所 | Device and method for directly measuring upper energy level fluorescence lifetime of rare earth element doped optical fiber laser |
| CN113995377A (en) * | 2021-09-16 | 2022-02-01 | 上海交通大学 | Smoking damage assessment device and method |
| CN115607110B (en) * | 2022-10-18 | 2023-11-21 | 广州大学 | Mammary gland tumor detection system based on autofluorescence |
Citations (9)
| Publication number | Priority date | Publication date | Assignee | Title |
|---|---|---|---|---|
| US5369496A (en) * | 1989-11-13 | 1994-11-29 | Research Foundation Of City College Of New York | Noninvasive method and apparatus for characterizing biological materials |
| US5713364A (en) * | 1995-08-01 | 1998-02-03 | Medispectra, Inc. | Spectral volume microprobe analysis of materials |
| US5772588A (en) * | 1995-08-29 | 1998-06-30 | Hamamatsu Photonics K.K. | Apparatus and method for measuring a scattering medium |
| US5813987A (en) * | 1995-08-01 | 1998-09-29 | Medispectra, Inc. | Spectral volume microprobe for analysis of materials |
| US6070093A (en) * | 1997-12-02 | 2000-05-30 | Abbott Laboratories | Multiplex sensor and method of use |
| US6201989B1 (en) | 1997-03-13 | 2001-03-13 | Biomax Technologies Inc. | Methods and apparatus for detecting the rejection of transplanted tissue |
| US6280386B1 (en) | 1997-06-16 | 2001-08-28 | The Research Foundation Of The City University Of New York | Apparatus for enhancing the visibility of a luminous object inside tissue and methods for same |
| US6571118B1 (en) * | 1998-05-04 | 2003-05-27 | Board Of Regents, The University Of Texas System | Combined fluorescence and reflectance spectroscopy |
| US20040010192A1 (en) * | 2000-06-15 | 2004-01-15 | Spectros Corporation | Optical imaging of induced signals in vivo under ambient light conditions |
-
2002
- 2002-02-28 WO PCT/US2002/005980 patent/WO2002069784A2/en not_active Application Discontinuation
- 2002-02-28 EP EP02721196A patent/EP1372483A2/en not_active Withdrawn
- 2002-02-28 JP JP2002568972A patent/JP2005504561A/en active Pending
- 2002-02-28 US US10/469,021 patent/US8068898B2/en not_active Expired - Fee Related
-
2011
- 2011-10-25 US US13/280,557 patent/US8417324B2/en not_active Expired - Fee Related
Patent Citations (9)
| Publication number | Priority date | Publication date | Assignee | Title |
|---|---|---|---|---|
| US5369496A (en) * | 1989-11-13 | 1994-11-29 | Research Foundation Of City College Of New York | Noninvasive method and apparatus for characterizing biological materials |
| US5713364A (en) * | 1995-08-01 | 1998-02-03 | Medispectra, Inc. | Spectral volume microprobe analysis of materials |
| US5813987A (en) * | 1995-08-01 | 1998-09-29 | Medispectra, Inc. | Spectral volume microprobe for analysis of materials |
| US5772588A (en) * | 1995-08-29 | 1998-06-30 | Hamamatsu Photonics K.K. | Apparatus and method for measuring a scattering medium |
| US6201989B1 (en) | 1997-03-13 | 2001-03-13 | Biomax Technologies Inc. | Methods and apparatus for detecting the rejection of transplanted tissue |
| US6280386B1 (en) | 1997-06-16 | 2001-08-28 | The Research Foundation Of The City University Of New York | Apparatus for enhancing the visibility of a luminous object inside tissue and methods for same |
| US6070093A (en) * | 1997-12-02 | 2000-05-30 | Abbott Laboratories | Multiplex sensor and method of use |
| US6571118B1 (en) * | 1998-05-04 | 2003-05-27 | Board Of Regents, The University Of Texas System | Combined fluorescence and reflectance spectroscopy |
| US20040010192A1 (en) * | 2000-06-15 | 2004-01-15 | Spectros Corporation | Optical imaging of induced signals in vivo under ambient light conditions |
Non-Patent Citations (1)
| Title |
|---|
| www.tpub.com/neets/tm/111-4.htm. * |
Also Published As
| Publication number | Publication date |
|---|---|
| EP1372483A2 (en) | 2004-01-02 |
| WO2002069784A2 (en) | 2002-09-12 |
| JP2005504561A (en) | 2005-02-17 |
| US20120041315A1 (en) | 2012-02-16 |
| US8417324B2 (en) | 2013-04-09 |
| WO2002069784A3 (en) | 2003-07-10 |
| US20040073119A1 (en) | 2004-04-15 |
Similar Documents
| Publication | Publication Date | Title |
|---|---|---|
| US8068898B2 (en) | Fluorescence lifetime spectrometer (FLS) and methods of detecting diseased tissues | |
| Fang et al. | Time-domain laser-induced fluorescence spectroscopy apparatus for clinical diagnostics | |
| US5467767A (en) | Method for determining if tissue is malignant as opposed to non-malignant using time-resolved fluorescence spectroscopy | |
| Pitts et al. | Design and development of a rapid acquisition laser-based fluorometer with simultaneous spectral and temporal resolution | |
| Marcu | Fluorescence lifetime techniques in medical applications | |
| Kapadia et al. | Laser-induced fluorescence spectroscopy of human colonic mucosa: detection of adenomatous transformation | |
| US5042494A (en) | Method and apparatus for detecting cancerous tissue using luminescence excitation spectra | |
| EP0732889B1 (en) | Laser-induced differential normalized fluorescence for cancer diagnosis | |
| US5813987A (en) | Spectral volume microprobe for analysis of materials | |
| Brennan et al. | Near-infrared Raman spectrometer systems for human tissue studies | |
| US4930516A (en) | Method for detecting cancerous tissue using visible native luminescence | |
| Pfefer et al. | Temporally and spectrally resolved fluorescence spectroscopy for the detection of high grade dysplasia in Barrett's esophagus | |
| Glanzmann et al. | Time-resolved spectrofluorometer for clinical tissue characterization during endoscopy | |
| US5687730A (en) | Apparatus for detecting the presence of abnormal tissue within a target tissue beneath the skin of a patient | |
| EP0842412A1 (en) | Optical microprobes and methods for spectral analysis of materials | |
| Tunnell et al. | Instrumentation for multi-modal spectroscopic diagnosis of epithelial dysplasia | |
| Nishioka | Laser-induced fluorescence spectroscopy | |
| KR20090104224A (en) | Multi-modality early cancer detection apparatus merged multi-wavelength fluorescence spectroscopy and optical coherence imaging and method using thereof | |
| JP2006300611A (en) | Sample analyzer and sample analyzing method using it | |
| Mycek et al. | Fluorescence spectroscopy for in vivo discrimination of pre-malignant colonic lesions | |
| RU2775461C9 (en) | Device for assessing the composition of immunocompetent cells in tumor tissue by spectral fluorescence methods using a photosensitizer based on chlorin e6 | |
| RU2775461C1 (en) | Device for assessing the composition of immunocompetent cells in tumor tissue by spectral fluorescence methods using a photosensitizer based on chlorin e6 | |
| Fitzmaurice et al. | Raman spectroscopy: development of clinical applications for breast cancer diagnosis | |
| Katz et al. | Optical biopsy-detecting cancer with light | |
| Popenda et al. | Fluorescence lifetime measurements with all-fiber optical setup for non-invasive in-vivo diagnostics |
Legal Events
| Date | Code | Title | Description |
|---|---|---|---|
| AS | Assignment |
Owner name: TRUSTEES OF DARTMOUTH COLLEGE, NEW HAMPSHIRE Free format text: ASSIGNMENT OF ASSIGNORS INTEREST;ASSIGNORS:MYCEK, MARY-ANN;DMITROVSKY, ETHAN;PITTS, JONATHAN;REEL/FRAME:015462/0729 Effective date: 20040507 |
|
| STCF | Information on status: patent grant |
Free format text: PATENTED CASE |
|
| FEPP | Fee payment procedure |
Free format text: PATENT HOLDER CLAIMS MICRO ENTITY STATUS, ENTITY STATUS SET TO MICRO (ORIGINAL EVENT CODE: STOM); ENTITY STATUS OF PATENT OWNER: SMALL ENTITY |
|
| FEPP | Fee payment procedure |
Free format text: PAT HLDR NO LONGER CLAIMS MICRO ENTITY STATE, ENTITY STATUS SET TO SMALL (ORIGINAL EVENT CODE: MTOS); ENTITY STATUS OF PATENT OWNER: SMALL ENTITY |
|
| FPAY | Fee payment |
Year of fee payment: 4 |
|
| AS | Assignment |
Owner name: NATIONAL SCIENCE FOUNDATION, VIRGINIA Free format text: CONFIRMATORY LICENSE;ASSIGNOR:DARTMOUTH COLLEGE;REEL/FRAME:046588/0504 Effective date: 20180703 |
|
| FEPP | Fee payment procedure |
Free format text: MAINTENANCE FEE REMINDER MAILED (ORIGINAL EVENT CODE: REM.); ENTITY STATUS OF PATENT OWNER: SMALL ENTITY |
|
| LAPS | Lapse for failure to pay maintenance fees |
Free format text: PATENT EXPIRED FOR FAILURE TO PAY MAINTENANCE FEES (ORIGINAL EVENT CODE: EXP.); ENTITY STATUS OF PATENT OWNER: SMALL ENTITY |
|
| STCH | Information on status: patent discontinuation |
Free format text: PATENT EXPIRED DUE TO NONPAYMENT OF MAINTENANCE FEES UNDER 37 CFR 1.362 |
|
| FP | Lapsed due to failure to pay maintenance fee |
Effective date: 20191129 |
|
| AS | Assignment |
Owner name: NATIONAL SCIENCE FOUNDATION, VIRGINIA Free format text: CONFIRMATORY LICENSE;ASSIGNOR:TRUSTEES OF DARTMOUTH COLLEGE;REEL/FRAME:052405/0400 Effective date: 20200411 |