US7933828B2 - System and method for displaying and/or analyzing a limit order book - Google Patents
System and method for displaying and/or analyzing a limit order book Download PDFInfo
- Publication number
- US7933828B2 US7933828B2 US11/189,329 US18932905A US7933828B2 US 7933828 B2 US7933828 B2 US 7933828B2 US 18932905 A US18932905 A US 18932905A US 7933828 B2 US7933828 B2 US 7933828B2
- Authority
- US
- United States
- Prior art keywords
- limit
- market
- order
- orders
- limit order
- Prior art date
- Legal status (The legal status is an assumption and is not a legal conclusion. Google has not performed a legal analysis and makes no representation as to the accuracy of the status listed.)
- Active, expires
Links
Images


Classifications
-
- G—PHYSICS
- G06—COMPUTING; CALCULATING OR COUNTING
- G06Q—INFORMATION AND COMMUNICATION TECHNOLOGY [ICT] SPECIALLY ADAPTED FOR ADMINISTRATIVE, COMMERCIAL, FINANCIAL, MANAGERIAL OR SUPERVISORY PURPOSES; SYSTEMS OR METHODS SPECIALLY ADAPTED FOR ADMINISTRATIVE, COMMERCIAL, FINANCIAL, MANAGERIAL OR SUPERVISORY PURPOSES, NOT OTHERWISE PROVIDED FOR
- G06Q40/00—Finance; Insurance; Tax strategies; Processing of corporate or income taxes
- G06Q40/04—Trading; Exchange, e.g. stocks, commodities, derivatives or currency exchange
-
- G—PHYSICS
- G06—COMPUTING; CALCULATING OR COUNTING
- G06Q—INFORMATION AND COMMUNICATION TECHNOLOGY [ICT] SPECIALLY ADAPTED FOR ADMINISTRATIVE, COMMERCIAL, FINANCIAL, MANAGERIAL OR SUPERVISORY PURPOSES; SYSTEMS OR METHODS SPECIALLY ADAPTED FOR ADMINISTRATIVE, COMMERCIAL, FINANCIAL, MANAGERIAL OR SUPERVISORY PURPOSES, NOT OTHERWISE PROVIDED FOR
- G06Q30/00—Commerce
- G06Q30/06—Buying, selling or leasing transactions
- G06Q30/08—Auctions
-
- G—PHYSICS
- G06—COMPUTING; CALCULATING OR COUNTING
- G06Q—INFORMATION AND COMMUNICATION TECHNOLOGY [ICT] SPECIALLY ADAPTED FOR ADMINISTRATIVE, COMMERCIAL, FINANCIAL, MANAGERIAL OR SUPERVISORY PURPOSES; SYSTEMS OR METHODS SPECIALLY ADAPTED FOR ADMINISTRATIVE, COMMERCIAL, FINANCIAL, MANAGERIAL OR SUPERVISORY PURPOSES, NOT OTHERWISE PROVIDED FOR
- G06Q40/00—Finance; Insurance; Tax strategies; Processing of corporate or income taxes
- G06Q40/06—Asset management; Financial planning or analysis
Definitions
- This invention relates in general to trading markets and, more particularly, to a system and method for displaying and/or analyzing a limit order book.
- electronic trading systems have gained a widespread acceptance for trading items.
- electronic trading systems have been created which facilitate the trading of financial instruments such as stocks, bonds, currency, futures, or other suitable financial instruments.
- bids and offers are submitted to the systems by a passive side. These bids and offers are hit and lifted (or taken) by an aggressive side.
- a passive trader may submit a “bid” to buy a particular number of 30 year U.S. Treasury Bonds at a given price.
- an aggressive trader may submit a “hit” in order to indicate a willingness to sell bonds to the first trader at the given price.
- a passive side trader may submit an “offer” to sell a particular number of the bonds at the given price, and then the aggressive side trader may submit a “lift” (or “take”) in response to the offer to indicate a willingness to buy bonds from the passive side trader at the given price.
- the bid, the offer, the hit, and the lift (or take) may be collectively known as “orders.”
- orders the bid, the offer, the hit, and the lift (or take) may be collectively known as “orders.”
- a method of generating a display of a limit order book is provided.
- Data regarding a plurality of limit orders entered onto an electronic market is received and recorded, at least temporarily.
- the data regarding each limit order includes a price and a time associated with that limit order.
- a graphical display is generated that indicates, for each recorded limit order entered into the electronic market within a period of time, the price and the time associated with that limit order.
- the price associated with each limit order is indicated by a first axis of the graphical display and the time associated with each limit order is indicated by a second axis of the graphical display.
- the graphical display may be displayed using an electronic display device.
- a method of analyzing an electronic limit order book is provided.
- Data regarding a plurality of limit orders entered onto an electronic market is received and recorded, at least temporarily.
- the data regarding each limit order includes a price and a time associated with that limit order.
- One or more market indicators regarding the state of the electronic market may be periodically calculated.
- Each of the periodic calculations may include identifying a subset of limit orders for that periodic calculation; determining a market distance for each of the subset of limit orders, the market distance for each limit order comprising the difference between the price of that limit order and a market price; weighting each of the subset of limit orders based at least on the determined market distance for that limit order; and calculating the one or more market indicators based at least on the weighting of each of the subset of limit orders.
- the one or more periodically calculated market indicators may be displayed in a graphical user interface.
- One advantage of certain embodiments of the invention is that systems and methods may be is provided for displaying a limit order book of an electronic trading exchange in a manner that may be used by traders to make trading decisions.
- the system may record and graphically display each bid and offer (and/or other limit orders) entered onto an electronic trading exchange for a particular product over a particular period of time.
- the graphical display may be updated substantially in real time.
- the graphical display may allow a trader or other user to visualize various characteristics of the market environment, such as the number, size and/or density of bids and/or offers are various prices over time.
- the trader may be able to recognize trends in the market, such as buying pressure or selling pressure, for example, and making trading decisions accordingly.
- the graphical display may indicate outstanding unsatisfied supply and demand and/or how aggressive traders are or were in submitting orders. This information may indicate support and/or resistance levels in the market, which information the trader can use to evaluate the probability of a market trend in price and/or consolidation.
- a system may be provided for analyzing a limit order book of an electronic trading exchange for a particular product to use various algorithms to periodically calculate one or more market indicators regarding the state of the limit order book. Such analysis may include weighting each limit order based on the distance of that order's price from a market price, such as the price of the best bid or offer on the market or the price of a recent trade, for example.
- the system may periodically calculate a net market score that may provide a quick summary (e.g., a single number) expressing the extent of buying pressure or selling pressure currently in the market, for example.
- the net market score may be displayed to the trader, either in connection with or separate from the display of the limit order book discussed above, and may be updated periodically.
- the net market score and/or other types of market indicators calculated by the system may be used by a trader for making trading decisions.
- a trader may use the system described herein to identify whether/when an imbalance exists between supply and demand at the current price level. This may be shown via a graphical display and may also be measured using various algorithms to periodically calculate one, or more market indicators.
- the graphical display may indicate the existence of a sparsity of orders in the market, which may indicate a lack of support/buyers (or resistance/sellers).
- a trader viewing the graphical display and/or market indicators may be able to anticipate market turning points as he or she sees the emergence of bids/offers at one or more given price levels. Multiple orders entered onto the market at a given price level may be displayed as increasing density on the graphical display, as many points on the chart may be clustered together.
- the graphical display may indicate the aggressiveness of each side of the market based on how close orders are placed to the “market price,” or the price at which trades were most recently executed. Weighting algorithms may be used to quantify this information in the form of various market indicators. In addition, the graphical display may indicate when market participants become more or less aggressive as shown by increasing/decreasing density of orders at a given price level.
- the display may indicate the existence of latent demand or supply in the market.
- latent demand may be likely to serve as a supporting bid that will continue to rest below the market or may drive the market higher as buyers chase the market upward.
- latent supply may be likely to serve as resistance that will continue to rest above the market or may drive the market lower as seller chase the market downward.
- the current systems and methods may provide a trader information for understanding the strength of supply and demand in a market, as evidenced by the density of limit bids and offers. Such information may indicate whether a market is more or less likely to trend or consolidate, which may providing critical information on which a trader may base his or her trading decisions.
- FIG. 1 illustrates an example trading system according to an embodiment of the present invention
- FIG. 2 illustrates an example graphical plot displaying the limit order book for the trading exchange for a particular product, according to one embodiment of the invention
- FIG. 3 illustrates an example method of generating and displaying a graphical display of a limit order book for a particular product, according to one embodiment of the present invention
- FIG. 4 illustrates a method of calculating and/or displaying one or more market indicators, according to certain embodiments of the invention
- FIG. 5 illustrates an example table illustrating several example sets of weights for limit orders at ten different market distances, according to particular embodiments of the invention.
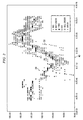
- FIG. 6 illustrates a chart indicating each of the example sets of weights included in the table shown in FIG. 5 .
- FIGS. 1 through 6 of the drawings Example embodiments of the present invention and their advantages are best understood by referring now to FIGS. 1 through 6 of the drawings, in which like numerals refer to like parts.
- a system for analyzing and displaying a limit order book of an electronic trading exchange in a manner that may be used by traders to make trading decisions.
- the system may record and graphically display each bid and offer (and/or other limit orders) entered onto the electronic trading exchange at various prices over a particular period of time, such as a period of time from the present extending back a particular amount of time.
- the graphical display may be updated periodically, and in some embodiments, substantially in real time.
- the graphical display includes a plot indicating the price of the limit orders along a first axis (e.g. vertical axis) and the time that the limit orders were entered onto the market along a second axis (e.g. horizontal axis).
- the plot may be illustrated as a “moving window” display that shifts along the horizontal axis over time.
- a trader viewing the graphical display of the limit order book may visualize various characteristics of the market, such as the number, size and/or density of bids and/or offers are various prices over time.
- the trader may be able to recognize trends in the market, such as buying pressure or selling pressure, for example.
- the system may analyze the limit order book of the electronic trading exchange at a particular instant or over a period of time to periodically calculate one or more market indicators regarding the state of the limit order book. For example, the system may apply various algorithms to the set of limit orders currently on the trading exchange that has a price within a particular distance from a market price (such as the price of the best bid, best offer, or a recent trade, for example).
- various system parameters may be selected or otherwise controlled by a user, such as the trader or an administrator, in one example.
- the user may select various parameters regarding the manner in which individual or groups of limit orders are graphically displayed.
- the set of weights applied to limit orders at various distances from the market price may be selected by the user as desired.
- parameters for determining which limit orders are included in the analysis of the limit order book may be selected by the user as desired.
- the user may select the frequency that the one or more market indicators are calculated.
- the user may select the number of calculated net market scores to be included in a net market score moving average displayed to the user.
- FIG. 1 illustrates an example trading system 10 according to an embodiment of the present invention.
- system 10 may include one or more trader terminals 12 coupled to a trading platform 14 by a communications network 16 .
- a trader 18 may include any entity, such as an individual, group of individuals or firm, that engages in trading activity via trading platform 14 .
- a trader 18 may be an individual investor, a group of investors, a firm (e.g., a brokerage or bank), an institutional investor, a hedger, a speculator, or a market maker (i.e., an individual or firm that submits and/or maintains both bid and ask orders simultaneously for the same instrument).
- a firm e.g., a brokerage or bank
- a market maker i.e., an individual or firm that submits and/or maintains both bid and ask orders simultaneously for the same instrument.
- trading orders 20 may include limit orders 22 and/or one or more other types of orders 20 , such as market orders, limit orders, stop loss orders, day orders, open orders, GTC (“good till cancelled”) orders, “good through” orders, an “all or none” orders, or “any part” orders, for example and not by way of limitation.
- limit orders 22 may include bids and offers.
- limit orders 22 may also include one or more other types of orders.
- limit orders 22 may include any one or more of the following types of orders:
- Trader terminals 12 may provide traders 18 access to engage in trading activity via trading platform 14 .
- a trader terminal 12 may include a computer system and appropriate software to allow a trader 18 to engage in trading activity via trading platform 14 .
- the term “computer” refers to any suitable device operable to accept input, process the input according to predefined rules, and produce output, for example, a personal computer, workstation, network computer, wireless data port, wireless telephone, personal digital assistant, one or more processors within these or other devices, or any other suitable processing device.
- a trader terminal 12 may include a trading order analysis module 26 generally operable to analyze data and provide feedback (e.g., via a graphical user interface) regarding trading orders 20 placed on an electronic trading market managed by trading platform 14 .
- trading order analysis module 26 is generally operable to provide various functionality regarding the analysis and/or other management of data regarding limit orders 22 submitted to such an electronic trading market.
- trading order analysis module 26 may be operable to receive data 28 regarding limit orders placed on an electronic trading market, record such data 28 (at least temporarily), use such data 28 to generate graphical displays representing the limit order book for the electronic trading market (such as a plot of limit orders 22 price versus time, for example), analyze such data 28 to determine one or more market indicators regarding the limit order book for the electronic trading market, display such market indicators to a trader 18 , and/or allow the trader 18 to control various parameters regarding the analysis and display of such data 28 .
- trading order analysis module 26 may additionally or alternatively provide similar functionality regarding other types of trading orders 20 .
- any or all of the functionality described herein as being provided by trading order analysis module 26 at trading terminal 12 may alternatively or additionally be performed or provided by any other portion of trading system 10 , such as trading platform 14 , communications network 16 , or one or more servers associated with one or more trading terminals 12 , such as servers associated with a trading firm (e.g., a brokerage or bank) or other collection of traders 18 , for example.
- a trading firm e.g., a brokerage or bank
- any relevant portion(s) of trading system 10 may include any suitable hardware and/or software appropriate for performing or providing any or all of such functionality.
- Trading order analysis module 26 may include a processor 30 , memory 32 , and/or order analysis software 34 stored in memory 32 .
- Processing unit 32 may execute software 32 to provide any or all of the various functions provided by trading order analysis module 26 .
- Memory 32 may also store, at least temporarily, limit order data 28 , which may be received from trading platform 14 , as discussed below.
- Memory 32 may be coupled to processor 30 and may include one or more databases and other suitable memory devices, such as one or more random access memories (RAMs), read-only memories (ROMs), dynamic random access memories (DRAMs), fast cycle RAMs (FCRAMs), static RAM (SRAMs), field-programmable gate arrays (FPGAs), erasable programmable read-only memories (EPROMs), electrically erasable programmable read-only memories (EEPROMs), microcontrollers, or microprocessors.
- RAMs random access memories
- ROMs read-only memories
- DRAMs dynamic random access memories
- FCRAMs fast cycle RAMs
- SRAMs static RAM
- FPGAs field-programmable gate arrays
- EPROMs erasable programmable read-only memories
- EEPROMs electrically erasable programmable read-only memories
- microcontrollers or microprocessors.
- Trader terminal 12 may also include a display device 36 , such as a monitor, screen, panel display, or any other suitable device operable to display information to a trader 18 .
- display device 36 may be operable to display a graphical user interface 38 , which may be used to display various information regarding trading system 10 , such as output from trading order analysis module 26 regarding limit order data 28 , for example, as discussed herein.
- Graphical user interface 38 may include any suitable software or other executable code for displaying such information via display device 36 .
- Communications network 16 is a communicative platform operable to exchange data or information between trading platform 14 and both and traders 18 .
- Communications network 16 represents an Internet architecture in a particular embodiment of the present invention, which provides traders 18 with the ability to electronically execute trades or initiate transactions to be delivered to an authorized exchange trading floor.
- communications network 16 could be a plain old telephone system (POTS), which traders 18 could use to perform the same operations or functions. Such transactions may be assisted by a broker associated with trading platform 14 or manually keyed into a telephone or other suitable electronic equipment in order to request that a transaction be executed.
- POTS plain old telephone system
- communications system 14 could be any packet data network (PDN) offering a communications interface or exchange between any two nodes in system 10 .
- PDN packet data network
- Communications network 16 may alternatively be any local area network (LAN), metropolitan area network (MAN), wide area network (WAN), wireless local area network (WLAN), virtual private network (VPN), intranet, or any other appropriate architecture or system that facilitates communications in a network or telephonic environment.
- LAN local area network
- MAN metropolitan area network
- WAN wide area network
- WLAN wireless local area network
- VPN virtual private network
- intranet or any other appropriate architecture or system that facilitates communications in a network or telephonic environment.
- Trading platform 14 may comprise a trading architecture that facilitates the management of one or more electronic trading exchanges for one or more tradable instruments or products.
- trading platform 14 may manage or facilitate the trading of trading orders 20 , such as limit orders 22 and/or one or more other types of orders 20 .
- Trading platform 14 may be operable to receive limit orders 22 from traders 18 and manage or process such limit orders 22 such that financial transactions among and between traders 18 may be performed.
- Trading platform 14 may have a link or a connection to a market trading floor, or some other suitable coupling to any suitable element that allows for such transactions to be consummated.
- Trading platform 14 may include a computer, a server, a management center, a single workstation, or a headquartering office for any person, business, or entity that seeks to manage the trading of trading orders 20 . Accordingly, trading platform 14 may include any suitable hardware, software, personnel, devices, components, elements, or objects that may be utilized or implemented for managing or administering one or more electronic trading exchanges. It should be understood that the functionality provided by trading platform 14 may be at least partially manual such that one or more humans may provide various functionality associated with trading platform 14 .
- trading order analysis module 26 may provide various functionality regarding the analysis and/or management of limit order data 28 , which may be received from trading platform 14 , for example.
- trading order analysis module 26 may receive limit order data 28 from trading platform 14 regarding limit orders 22 placed on an electronic trading market managed by trading platform 14 .
- Limit order data 28 may include any data regarding limit orders 22 placed on the electronic trading market, such as the type of the limit order 22 (e.g., bid, offer, hit, or take, for example), the price of the limit order 22 (e.g., bid price or offer price), the size of the limit order 22 , the time the limit order 22 was received by trading platform 14 or entered onto the relevant electronic trading market, the trader 18 that placed the limit order 22 , the account associated with the limit order 22 , and/or an expiration time for the limit order 22 , for example.
- the type of the limit order 22 e.g., bid, offer, hit, or take, for example
- the price of the limit order 22 e.g., bid price or offer price
- the size of the limit order 22 e.g., the time the limit order 22 was received by trading platform 14 or entered onto the relevant electronic trading market
- the trader 18 that placed the limit order 22 e.g., the account associated with the limit order 22
- an expiration time for the limit order 22 e
- Limit order data 28 for a limit order 22 may also include information regarding the status of the limit order 22 , such as whether the limit order 22 has been removed from the market, whether the limit order 22 has entered into a trade state (i.e., is being executed with another trading order 20 ), the beginning and ending time of such a trade state, and/or the details of an executed trade, for example.
- trading platform 14 may communicate such limit order data 28 to trading order analysis module 26 via communications network 16 substantially in real time or otherwise.
- Trading order analysis module 26 may then record such data 28 received from trading platform 14 , at least temporarily, in memory 32 or otherwise, such that data 28 may be used for analyzing the limit order book for the particular product.
- Trading order analysis module 26 may use such received and/or recorded data 28 to generate a periodically updated graphical display representing the limit order book for the particular product, which may be displayed to a trader 18 via graphical user interface 38 .
- trading order analysis module 26 may generate a graphical plot 40 indicating (e.g., using various icons) the price and time of each limit order 22 entered onto the trading exchange for a particular period of time from the present extending back some amount of time.
- Trading order analysis module 26 may continuously or periodically update the plot 40 , which may include adding to the plot representations (e.g., icons) of new limit orders 22 entered onto the exchange, removing from the plot representations (e.g., icons) of limit orders 22 removed from the exchange, or otherwise adding, removing, modifying and/or otherwise updating limit order data 28 to reflect trading activity associated with trading orders 20 .
- An example of such plot 40 and an example method of generating such plot 40 , are shown and discussed below with reference to FIGS. 2 and 3 .
- trading order analysis module 26 may analyze at least a portion of the limit order data 28 received from trading platform 14 to calculate one or more market indicators 42 regarding the limit order book for the trading exchange for the particular product.
- Trading order analysis module 26 may analyze all or a subset of the limit orders 22 currently on the trading exchange to calculate such market indicators 42 .
- Trading order analysis module 26 facilitate or cause the display of such calculated market indicators 42 to a trader 18 , such as via graphical user interface 38 .
- graphical user interface 38 may display the one or more plots 40 concurrently with, or separate from, the one or more market indicators 42 . Example methods of calculating such market indicators 42 are discussed below with reference to FIG. 4 .
- trading order analysis module 26 may provide an interface allowing a trader 18 to control various parameters regarding the analysis and display of limit order data 28 .
- trading order analysis module 26 may allow trader 18 to select one or more of the following:
- trading order analysis module 26 may generate one or more graphical plots 40 indicating (e.g., using various icons) the status of the limit order book for a particular product based on limit order data 28 received from trading platform 14 .
- FIG. 2 illustrates an example plot 40 displaying the limit order book for the trading exchange for a particular product, according to one embodiment of the invention.
- Plot 40 indicates all or a subset of limit orders 22 associated with the trading exchange over a particular time period, such as, for example, (a) all or a subset of limit orders 22 entered onto the exchange during the particular time period, (b) all or a subset of limit orders 22 entered onto the exchange during the particular time period and currently remaining on the exchange, or (c) all or a subset of limit orders 22 entered onto the exchange during the particular time period and either currently remaining on the exchange or traded during the particular time period.
- limit orders 22 removed from the exchange for particular reasons or for any reason, may be removed from the plot 40 .
- plot 40 may indicate the price and time of limit orders 22 using a plot 40 indicating the price of limit orders 22 along a first (in this embodiment, the y-axis) axis and the time of limit orders 22 along a second axis (in this embodiment, the x-axis).
- the “time” of a limit order 22 may refer to any time defined by limit order data 18 regarding the limit order 22 , such as the time that the limit order 22 was received by trading platform 14 from the relevant trader 18 or the time that the limit order 22 was entered onto the relevant exchange by trading platform 14 , for example.
- Each limit order 22 , or a group of limit orders 22 at the same price and time may be represented by one or more icons 50 .
- Icons 50 may include any type of visual representation, which may be defined by any one or more visual parameters, such as shape, size, color, brightness, transparency, opaqueness, and/or flashing, for example.
- icons 50 may indicate one or more parameters in a third dimension.
- plot 40 may be a three-dimensional plot in which a third dimension is used to indicate one or more parameters such as the volume of limit orders 22 , the number of limit orders 22 , and/or the number of different traders 18 having placed one or more limit orders 22 at a particular time and price.
- icons 50 may have a length (or height) in the third dimension indicating the magnitude of such parameters regarding the relevant limit order(s) 22 .
- plot 40 shown in FIG. 2 may be a “moving window” display in which the displayed data (e.g. icons 50 ), shift along the time axis (in this embodiment, horizontally).
- an icon 50 representing a newly placed limit order enters onto plot 40 on right side, shifts across plot 40 from right to left, and exit from the left side plot 40 .
- the duration of time displayed in such a “moving window” plot 40 may be selected and/or modified by a trader 18 as desired.
- the trader 18 may generally control the amount of data they wish to be displayed at any given time.
- different types of limit orders 22 may be represented by different types of icons 50 .
- Different types of icons 50 may refer to icons 50 having at least one different visual parameter, such as those listed above, for example.
- bids and offers have be represented by different types of icons 50 .
- different types of icons 50 are used for bids, offers, buy orders and sell orders.
- bids are represented by yellow triangles
- offers are represented by blue diamonds
- buy orders are represented by orange rectangles
- sell orders are represented by green rectangles.
- a trade initiated by a sell order (which may be referred to as a “hit”) may be indicated by another icon 50 , here, a large red circle. It should be understood that in other embodiments, any one or more types of icons 50 may be used to represent various types of limit orders 22 and/or transactions or trading events regarding such limit orders 22 .
- limit orders 22 placed by different types of traders 18 and/or associated with different types of trading accounts may be represented by different types of icons 50 .
- different types of traders 18 may include one or more of the following: an individual investor, a group of investors, a firm (e.g., a brokerage or bank), an institutional investor, a hedger, a speculator, a market maker, and a non-market maker. Any number of different types of icons 50 may be used to distinguish limit orders 22 placed by any of such different types of traders 18 .
- each limit orders 22 may be indicated by one or more visual parameters of the relevant icon 50 used for that limit order 22 .
- the relative size of each limit orders 22 may be represented by the shape, size, color, brightness, transparency, opaqueness, flashing and/or three-dimensional magnitude of the relevant icon 50 .
- the market distance of each limit order 22 may be indicated by one or more visual parameters of the relevant icon 50 used for that limit order 22 .
- the market distance of each limit order 22 may be represented by the shape, size, color, brightness, transparency, opaqueness, and/or flashing of the relevant icon 50 .
- the “market distance” of a limit order 22 is defined as the difference between the price of the limit order 22 and a market price.
- the market price may be any price generally representing the current market for the relevant product, such as, or at least based on, (a) the price of the best bid or the best offer on the exchange or (b) the price of one or more recently executed trades, for example.
- the size, brightness, or opaqueness of the corresponding icons 50 may decrease, or the transparency of the corresponding icons 50 may increase.
- only limit orders 22 within a particular market distance at the time of each limit order 22 are displayed on plot 40 .
- only limit orders 22 within a particular number of price increments (e.g., ticks) from a current market price are displayed on plot 40 .
- significant outliers may be excluded from plot 40 .
- Multiple limit orders 22 at the same price and time may be represented in any suitable manner to indicate the total size and/or the number of such multiple limit orders 22 .
- a single icon 50 is used to represent the multiple limit orders 22 , and one or more visual parameters of the icon 50 are varied to indicate the total size and/or the number of such multiple limit orders 22 .
- the total size of multiple limit orders 22 at a particular price and time may be indicated by the size, color, brightness, transparency, opaqueness and/or three-dimensional magnitude of the icon 50 .
- the number of the multiple limit orders 22 at the particular price and time may be indicated by such parameters of icon 50 .
- icons 50 representing individual limit orders 22 are at least partially transparent and displayed on top of each other such that each additional limit order 22 at the same price decreases the transparency (or increases the color, brightness, opaqueness or three-dimensional magnitude) of the icon 50 representing the multiple limit orders 22 .
- a graphical display of the limit order book for a particular product may provide a trader 18 various information regarding the current or recent limit order book.
- plot 40 or similar graphical displays may give a trader 18 an indication or characterization of the overall volume of limit orders 22 , the number of traders 18 and/or the density of limit orders 22 at various prices on each side of the market.
- plot 40 or similar graphical displays may give a trader 18 a holistic view or characterization of the limit order book for the product.
- Such visual information or characterizations may allow a trader 18 to relatively quickly and accurately determine or get a sense of the pressure on each side of the market for the product (i.e., the buying pressure and/or selling pressure on the product).
- the trader 18 may be able to use such information to make trading activity decisions, such as whether to buy or sell the product or wait, for example. For example, if the trader 18 identifies a relatively high density of bids entering the market at or near the current market price, the trader 18 may predict that the market price is likely to rise (or at least not fall) in the near future, and the trader 18 may act accordingly. Similarly, if the trader 18 identifies a relatively high density of offers entering the market at or near the current market price, the trader 18 may predict that the market price is likely to fall (or at least not rise) in the near future, and the trader 18 may act accordingly.
- Trading order analysis module 26 and/or graphical user interface 38 may update plot 40 at any suitable frequency and/or in response to particular events.
- plot 40 may be updated periodically at regular intervals, such as every 0.1 second, every 0.5 second, every second or every three seconds, for example.
- plot 40 may be updated each time new limit order data 28 is received, or each time a particular number of data items 28 are received.
- the frequency of updating plot 40 may be limited by the processing speed of the relevant computer hardware and/or software systems.
- trading order analysis module 26 may provide an interface allowing a trader 18 to control various parameters regarding the display of limit order data 28 .
- trading order analysis module 26 may provide an interface allowing a trader 18 to control (a) which icons 50 are used for particular types of limit orders 22 , (b) any one or more of the visual parameters for such icons 50 discussed above, (c) the manner in which multiple limit orders 22 at the same price and time are displayed, (d) which limit orders 22 are displayed in plot 40 (e.g., the maximum market distance for displayed limit orders 22 ), (e) the range of prices and/or the size of price increments displayed along the y-axis of plot 40 , (f) the period of time and/or the size of time increments displayed along the x-axis of plot 40 , and/or (g) the frequency at which plot 40 is updated, for example
- FIG. 3 illustrates an example method of generating and displaying a graphical display of a limit order book for a particular product, according to one embodiment of the present invention.
- an example method of generating plot 40 shown in FIG. 2 or a similar plot is discussed below.
- plot 40 is periodically updated at regular time intervals.
- trading order analysis module 26 receives limit order data 28 for a particular product from trading platform 14 during a particular time interval. Such data 28 may be received via communications network 16 . Such data 28 may include data regarding one or more new limit orders 22 , transactions regarding existing limit orders 22 , or other data regarding existing limit orders 22 or other trading orders 20 . At step 102 , trading order analysis module 26 stores at least a portion of the received limit order data 28 in memory 32 .
- trading order analysis module 26 may analyze at least a portion of a limit order book to calculate one or more market indicators 42 regarding the limit order book that may be used by a trader 18 for making various trading determinations.
- such analysis may include analyzing at least a portion of the limit orders 22 currently on the exchange but not at the current best, or market, price.
- Limit orders 22 included in the analysis may be weighted based at least on the market distance of such limit orders 22 , wherein limit orders 22 having prices close to a market price (i.e., small market distances) are weighted greater than limit orders 22 having prices further from the market price (i.e., greater market distances).
- a market distance for each of the limit orders 22 included in the analysis may be determined.
- the market distance of each limit order 22 may be the difference between the price of that limit order 22 and a market price, which may be the price of the best bid or the best offer on the exchange or the price of one or more recently executed trades, for example.
- each of the limit orders 22 included in the analysis may be weighted based at least on the determined market distance for that limit order 22 .
- the smaller the market distance of a limit order 22 the greater the weight applied to that limit order 22 , and vice versa.
- weighting systems are discussed in greater detail below.
- one or more market indicators 42 are calculated based at least on the weighting of each of the limit orders 22 included in the analysis.
- the weighting is applied to the volume, or size, of the limit orders 22 .
- the volume of each limit order 22 may be multiplied by the weight determined for that limit order 22 , and the resulting weighted order volumes may be used in the calculations of one or more market indicators 42 .
- the weighting is applied to the number of limit orders 22 or traders 18 having limit orders 22 at each price level or market distance. In other words, the weighting may be applied to the density of limit orders 22 at different price levels or market distances.
- Each limit order 22 at a particular price or market distance may have the same weighted value for purposes of calculating certain market indicators 42 .
- the number of limit orders 22 at each particular price level or market distance may be multiplied by the weight determined for that price level or market distance, and the resulting weighted numbers may be used in the calculations of one or more market indicators 42 .
- both the volume, or size, of each limit order and the number of limit orders 22 at each price level or market distance may be weighted and used for calculating certain market indicators 42 .
- such market indicators 42 may depend on a combination of (a) the number, or density, of limit orders at each price level or market distance, and (b) the volume, or size, of each limit order 22 .
- Example market indicators 42 may include one or more of the following: (a) a total bid score, (b) a total bid score moving average, (c) a total offer score, (d) a total offer score moving average, (e) a net market score, and/or (f) a net market score moving average.
- the net market score may provide an indication of whether their is a net selling pressure or a net buying pressure in the relevant market, as well as the magnitude of such selling or buying pressure.
- Example algorithms for calculating such market indicators 42 are discussed below in the section entitled “Calculating Market Indicators.”
- one or more of the market indicators 42 may be displayed to the trader 18 , such as using graphical user interface 38 . Such market indicators 42 may or may not be displayed in connection with plot 40 or another similar display of the limit order book. Steps 200 through 208 may be periodically repeated at each time interval such that the one or more market indicators 42 may be periodically updated to reflect the current state of the market.
- each limit order 22 included in limit order book analysis may be weighted based at least on the determined market distance for that limit order 22 .
- the weighting system includes an algorithm for weighting each limit order 22 based on the market distance.
- MD is the market distance for the relevant limit order 22
- C1, C2 and C3 are any suitable constants (including 0 to 1).
- the weighting system includes a predetermined weight for each of a plurality of market distances.
- FIG. 5 illustrates a table 250 illustrating several example sets of weights for limit orders 22 at ten different market distances.
- Column 252 indicates the market distance, wherein “1” is the shortest market distance and “10” is the greatest market distance included in the analysis.
- Columns 254 , 256 , 258 , 260 , and 262 indicate the relative weighting for limit orders 22 at each of the ten market distances.
- FIG. 6 illustrates a chart 280 indicating each of the example sets of weights shown in columns 254 - 262 of table 250 of FIG. 3 . As shown in FIG. 6 , each of the three example sets of weights increase exponentially with decreasing market distance.
- the weighting system may be determined by trading order analysis module 26 and/or selected by a trader 18 or other user.
- the trader 18 or other user may be provided an interface to select a particular weighting algorithm (such as one of algorithms 1 - 4 shown above, for example), select constants for such an algorithm, or select a particular set of weights (such as one of the sets of weights shown in columns 254262 of table 250 of FIG. 5 , for example).
- the trader 18 may configure various aspects of the weighting system as desired.
- the following algorithm, or variations of such algorithms may be used to determine one or more of the following market indicators 42 : (a) a total bid score, (b) a total bid score moving average, (c) a total offer score, (d) a total offer score moving average, (e) a net market score, and/or (f) a net market score moving average.
- the total bid score may provide a measure of the overall buying pressure in the market for the relevant product.
- the total bid score may be equal to the total sum of all weighted bids in the analysis, wherein each weighted bid is equal to the bid price for each bid multiplied by the weighting for that bid.
- the total bid score may be equal to the total sum of the weighted bid densities at each price level or market distance included in the analysis, wherein the bid density for a particular price level or market distance is equal to either (a) the number of bids (or different traders 18 having existing bids) at that particular price level or market distance multiplied by the weighting for that particular price level or market distance or (b) the volume, or size, of bids at that particular price level or market distance multiplied by the weighting for that particular price level or market distance.
- the total bid score may be represented as:
- Total ⁇ ⁇ bid ⁇ ⁇ score ⁇ ( number ⁇ ⁇ of ⁇ ⁇ bids ⁇ ⁇ at ⁇ ⁇ market ⁇ ⁇ distance * ⁇ weighting ⁇ ⁇ for ⁇ ⁇ that ⁇ ⁇ market ⁇ ⁇ distance ) ⁇ ⁇ or ( 6 ⁇ a )
- Total ⁇ ⁇ bid ⁇ ⁇ score ⁇ ( volume ⁇ ⁇ of ⁇ ⁇ bids ⁇ ⁇ at ⁇ ⁇ market ⁇ ⁇ distance * ⁇ weighting ⁇ ⁇ for ⁇ ⁇ that ⁇ ⁇ market ⁇ ⁇ distance ) ( 6 ⁇ b )
- the total offer score may provide a measure of the overall selling pressure in the market for the relevant product.
- the total offer score may be equal to the total sum of all weighted offers in the analysis, wherein each weighted offer is equal to the offer price for each offer multiplied by the weighting for that offer.
- the total offer score may be equal to the total sum of the weighted offer densities at each price level or market distance included in the analysis, wherein the offer density for a particular price level or market distance is equal to either (a) the number of offers (or different traders 18 having existing offers) at that particular price level or market distance multiplied by the weighting for that particular price level or market distance, or (b) the volume, or size, of offers (or different traders 18 having existing offers) at that particular price level or market distance multiplied by the weighting for that particular price level or market distance.
- the total offer score may be represented as:
- Total ⁇ ⁇ offer ⁇ ⁇ score ⁇ ( number ⁇ ⁇ of ⁇ ⁇ offers ⁇ ⁇ at ⁇ ⁇ market ⁇ ⁇ distance * ⁇ weighting ⁇ ⁇ for ⁇ ⁇ that ⁇ ⁇ market ⁇ ⁇ distance ) ⁇ ⁇ or ( 8 ⁇ a )
- Total ⁇ ⁇ offer ⁇ ⁇ score ⁇ ( volume ⁇ ⁇ of ⁇ ⁇ offers ⁇ ⁇ at ⁇ ⁇ market ⁇ ⁇ distance * ⁇ weighting ⁇ ⁇ for ⁇ ⁇ that ⁇ ⁇ market ⁇ ⁇ distance ) ( 8 ⁇ b )
- the total bid score moving average may provide a measure of the overall buying pressure in the market for the relevant product that captures a larger period of time than an individual total bid score, which may be desirable in some instances.
- the total bid score moving average may be the average of any particular number of periodically calculated total bid scores, which may be represented as:
- Total ⁇ ⁇ bid ⁇ ⁇ score ⁇ ⁇ moving ⁇ ⁇ average ( sum ⁇ ⁇ of ⁇ ⁇ total ⁇ ⁇ bid ⁇ ⁇ scores ) number ⁇ ⁇ of ⁇ ⁇ total ⁇ ⁇ bid ⁇ ⁇ scores ( 9 )
- the total offer score moving average may provide a measure of the overall buying pressure in the market for the relevant product that captures a larger period of time than an individual total offer score, which may be desirable in some instances.
- the total offer score moving average may be the average of any particular number of periodically calculated total offer scores, which may be represented as:
- Total ⁇ ⁇ offer ⁇ ⁇ score ⁇ ⁇ moving ⁇ ⁇ average ( sum ⁇ ⁇ of ⁇ ⁇ total ⁇ ⁇ offer ⁇ ⁇ scores ) number ⁇ ⁇ of ⁇ ⁇ total ⁇ ⁇ offer ⁇ ⁇ scores ( 10 )
- the net market score may provide an indication of whether their is a net selling pressure or a net buying pressure in the relevant market, as well as the magnitude of such selling or buying pressure.
- the met market score moving average may provide a measure of the overall net market pressure that captures a larger period of time than an individual net market score, which may be desirable in some instances.
- the net market score moving average may be the average of any particular number of periodically calculated net market scores, which may be represented as:
- Net ⁇ ⁇ market ⁇ ⁇ score ⁇ ⁇ moving ⁇ ⁇ average ( sum ⁇ ⁇ of ⁇ ⁇ net ⁇ ⁇ market ⁇ ⁇ scores ) number ⁇ ⁇ of ⁇ ⁇ net ⁇ ⁇ market ⁇ ⁇ scores ( 13 )
- the displayed size of a trading order 20 may not represent the actual size of the order.
- a trader 18 may request that the displayed size for a particular trading order 20 may be less than the full size of the order, such that the full size of the order 20 is hidden from other market participants.
- the portion of the order 20 that is not displayed to the market may be referred to as the “hidden order size.”
- trading order analysis module 26 may account for, or attempt to account for, hidden order size of orders 20 used in the calculation of market indicators 42 .
- trading order analysis module 26 may estimate a hidden order size for various displayed orders 20 having an unknown hidden order size based on the known hidden order size of one or more other orders 20 , such as one or more recently traded orders 20 .
- Trading order analysis module 26 may become aware of the actual size of trading orders 20 , including any hidden order size, when trading orders 20 are traded or enter into a trading state.
- trading order analysis module 26 may receive information identifying the hidden order size for trading orders 20 that have traded or entered into a trading state, and use such information to estimate a hidden order size for displayed orders 20 still on the exchange, each of which may or may not have an unknown hidden order size.
- Trading order analysis module 26 may then adjust the volume, or size, of some or all of such displayed trading orders 20 for the purposes of calculating particular market indicators 42 .
- trading order analysis module 26 may determine relationships between the displayed size and the hidden order size for one or more trading orders 20 that have traded or entered into a trading state.
- Trading order analysis module 26 may then use such determined relationships to adjust the volume, or size, of some or all of such displayed trading orders 20 for the purposes of calculating particular market indicators 42 .
- the volume, or size, of particular displayed trading orders 20 may be adjusted on an individual basis or on a group basis.
- the volume or individual trading orders 20 may be adjusted based on any number of parameters, such as the displayed size of the order 20 , the type of order 20 (e.g., particular types of orders 20 may be determined to be statistically associated with particular hidden order sizes, the trader 18 from which the order 20 was received (e.g., particular traders 18 may be determined to be statistically associated with particular hidden order sizes), and whether the order 20 is a buy or sell order, the displayed size of the order 20 , for example.
- the type of order 20 e.g., particular types of orders 20 may be determined to be statistically associated with particular hidden order sizes
- the trader 18 from which the order 20 was received e.g., particular traders 18 may be determined to be statistically associated with particular hidden order sizes
- the order 20 is a buy or sell order, the displayed size of the order 20 , for example.
Abstract
Description
Weight=C1*C2−(C3*MD) (1)
Weight=C1*MD −C2 (2)
Weight=−C1*ln(MD)+C2 (3)
Weight=C1*MD (4)
Total bid score=Σ(bid price*weighting) (5)
Total offer score=Σ(offer price*weighting) (7)
Net market score=total bid score−total offer score (11)
or
Net market score=total offer score−total bid score (12)
Claims (36)
Priority Applications (13)
| Application Number | Priority Date | Filing Date | Title |
|---|---|---|---|
| US11/189,329 US7933828B2 (en) | 2005-07-26 | 2005-07-26 | System and method for displaying and/or analyzing a limit order book |
| EP06788400A EP1920400A4 (en) | 2005-07-26 | 2006-07-24 | System and method for displaying and/or analyzing a limit order book |
| JP2008524054A JP5322642B2 (en) | 2005-07-26 | 2006-07-24 | System and method for displaying and analyzing limit order book |
| PCT/US2006/028806 WO2007016078A2 (en) | 2005-07-26 | 2006-07-24 | System and method for displaying and/or analyzing a limit order book |
| AU2006275972A AU2006275972B2 (en) | 2005-07-26 | 2006-07-24 | System and method for displaying and/or analyzing a limit order book |
| CA002616109A CA2616109A1 (en) | 2005-07-26 | 2006-07-24 | System and method for displaying and/or analyzing a limit order book |
| US12/395,603 US8069108B2 (en) | 2005-07-26 | 2009-02-27 | System and method for displaying and/or analyzing a limit order book |
| JP2011176568A JP2011222054A (en) | 2005-07-26 | 2011-08-12 | System and method for displaying and analyzing limit order book |
| US13/306,369 US8200572B2 (en) | 2005-07-26 | 2011-11-29 | System and method for displaying and/or analyzing a limit order book |
| US13/493,173 US10210571B2 (en) | 2005-07-26 | 2012-06-11 | System and method for displaying and/or analyzing a limit order book |
| US16/258,219 US10909622B2 (en) | 2005-07-26 | 2019-01-25 | System and method for displaying and/or analyzing a limit order book |
| US17/162,438 US11669902B2 (en) | 2005-07-26 | 2021-01-29 | System and method for displaying and/or analyzing a limit order book |
| US18/140,010 US20240078602A1 (en) | 2005-07-26 | 2023-04-27 | System and method for displaying and/or analyzing a limit order book |
Applications Claiming Priority (1)
| Application Number | Priority Date | Filing Date | Title |
|---|---|---|---|
| US11/189,329 US7933828B2 (en) | 2005-07-26 | 2005-07-26 | System and method for displaying and/or analyzing a limit order book |
Related Child Applications (1)
| Application Number | Title | Priority Date | Filing Date |
|---|---|---|---|
| US12/395,603 Division US8069108B2 (en) | 2005-07-26 | 2009-02-27 | System and method for displaying and/or analyzing a limit order book |
Publications (2)
| Publication Number | Publication Date |
|---|---|
| US20070027788A1 US20070027788A1 (en) | 2007-02-01 |
| US7933828B2 true US7933828B2 (en) | 2011-04-26 |
Family
ID=37695526
Family Applications (7)
| Application Number | Title | Priority Date | Filing Date |
|---|---|---|---|
| US11/189,329 Active 2028-08-11 US7933828B2 (en) | 2005-07-26 | 2005-07-26 | System and method for displaying and/or analyzing a limit order book |
| US12/395,603 Active 2026-11-06 US8069108B2 (en) | 2005-07-26 | 2009-02-27 | System and method for displaying and/or analyzing a limit order book |
| US13/306,369 Expired - Fee Related US8200572B2 (en) | 2005-07-26 | 2011-11-29 | System and method for displaying and/or analyzing a limit order book |
| US13/493,173 Active 2027-04-30 US10210571B2 (en) | 2005-07-26 | 2012-06-11 | System and method for displaying and/or analyzing a limit order book |
| US16/258,219 Active 2025-11-23 US10909622B2 (en) | 2005-07-26 | 2019-01-25 | System and method for displaying and/or analyzing a limit order book |
| US17/162,438 Active 2025-09-10 US11669902B2 (en) | 2005-07-26 | 2021-01-29 | System and method for displaying and/or analyzing a limit order book |
| US18/140,010 Pending US20240078602A1 (en) | 2005-07-26 | 2023-04-27 | System and method for displaying and/or analyzing a limit order book |
Family Applications After (6)
| Application Number | Title | Priority Date | Filing Date |
|---|---|---|---|
| US12/395,603 Active 2026-11-06 US8069108B2 (en) | 2005-07-26 | 2009-02-27 | System and method for displaying and/or analyzing a limit order book |
| US13/306,369 Expired - Fee Related US8200572B2 (en) | 2005-07-26 | 2011-11-29 | System and method for displaying and/or analyzing a limit order book |
| US13/493,173 Active 2027-04-30 US10210571B2 (en) | 2005-07-26 | 2012-06-11 | System and method for displaying and/or analyzing a limit order book |
| US16/258,219 Active 2025-11-23 US10909622B2 (en) | 2005-07-26 | 2019-01-25 | System and method for displaying and/or analyzing a limit order book |
| US17/162,438 Active 2025-09-10 US11669902B2 (en) | 2005-07-26 | 2021-01-29 | System and method for displaying and/or analyzing a limit order book |
| US18/140,010 Pending US20240078602A1 (en) | 2005-07-26 | 2023-04-27 | System and method for displaying and/or analyzing a limit order book |
Country Status (6)
| Country | Link |
|---|---|
| US (7) | US7933828B2 (en) |
| EP (1) | EP1920400A4 (en) |
| JP (2) | JP5322642B2 (en) |
| AU (1) | AU2006275972B2 (en) |
| CA (1) | CA2616109A1 (en) |
| WO (1) | WO2007016078A2 (en) |
Cited By (7)
| Publication number | Priority date | Publication date | Assignee | Title |
|---|---|---|---|---|
| US20090171833A1 (en) * | 2005-07-26 | 2009-07-02 | Bandman Jeffrey M | System and method for displaying and/or analyzing a limit order book |
| US8612335B2 (en) | 2007-03-21 | 2013-12-17 | Trading Technologies International, Inc. | System and method for management and analysis of electronic trade orders |
| US8620794B2 (en) | 2007-03-29 | 2013-12-31 | Trading Technologies International, Inc | System and method for chart based order entry |
| US8713478B2 (en) | 2004-03-05 | 2014-04-29 | Trading Technologies International, Inc | System and method for displaying a constant time selection context menu interface |
| US20170192416A1 (en) * | 2014-05-28 | 2017-07-06 | Siemens Aktiengesellschaft | Method and supervisory control device for monitoring an installation |
| US10147144B2 (en) * | 2015-05-11 | 2018-12-04 | Nice Ltd. | Transaction tracking and display |
| US11094015B2 (en) * | 2014-07-11 | 2021-08-17 | BMLL Technologies, Ltd. | Data access and processing system |
Families Citing this family (31)
| Publication number | Priority date | Publication date | Assignee | Title |
|---|---|---|---|---|
| US7689498B2 (en) * | 2000-08-24 | 2010-03-30 | Volbroker Limited | System and method for trading options |
| JP4318913B2 (en) * | 2002-12-26 | 2009-08-26 | 東京エレクトロン株式会社 | Application processing equipment |
| US7587357B1 (en) * | 2003-06-30 | 2009-09-08 | Trading Technologies International Inc. | Repositioning of market information on trading screens |
| US8429059B2 (en) | 2004-06-08 | 2013-04-23 | Rosenthal Collins Group, Llc | Method and system for providing electronic option trading bandwidth reduction and electronic option risk management and assessment for multi-market electronic trading |
| US20110125672A1 (en) * | 2004-06-08 | 2011-05-26 | Rosenthal Collins Group, L.L.C. | Method and system for providing electronic information for risk assesement and management via dynamic total net worth for multi-market electronic trading |
| US20100312718A1 (en) * | 2004-06-08 | 2010-12-09 | Rosenthal Collins Group, L.L.C. | Method and system for providing electronic information for risk assesement and management via net worth for multi-market electronic trading |
| US7912781B2 (en) | 2004-06-08 | 2011-03-22 | Rosenthal Collins Group, Llc | Method and system for providing electronic information for risk assessment and management for multi-market electronic trading |
| US20100114753A1 (en) * | 2004-07-12 | 2010-05-06 | Rosenthal Collins Group, L.L.C. | Method and system for automatic commodities futures contract management and delivery balancing |
| US20100094777A1 (en) * | 2004-09-08 | 2010-04-15 | Rosenthal Collins Group, Llc. | Method and system for providing automatic execution of risk-controlled synthetic trading entities |
| WO2006050397A2 (en) * | 2004-11-01 | 2006-05-11 | Rosenthal Collins Group, Llc | Method and system for providing multiple graphical user interfaces for electronic trading |
| US8589280B2 (en) | 2005-05-04 | 2013-11-19 | Rosenthal Collins Group, Llc | Method and system for providing automatic execution of gray box strategies for electronic trading |
| US7801801B2 (en) * | 2005-05-04 | 2010-09-21 | Rosenthal Collins Group, Llc | Method and system for providing automatic execution of black box strategies for electonic trading |
| US8364575B2 (en) * | 2005-05-04 | 2013-01-29 | Rosenthal Collins Group, Llc | Method and system for providing automatic execution of black box strategies for electronic trading |
| US7774263B1 (en) * | 2005-09-07 | 2010-08-10 | International Securities Exchange, Llc | Linked displayed market and midpoint matching system |
| US7761364B2 (en) * | 2005-09-07 | 2010-07-20 | International Securities Exchange, Llc | Midpoint matching system |
| US7849000B2 (en) * | 2005-11-13 | 2010-12-07 | Rosenthal Collins Group, Llc | Method and system for electronic trading via a yield curve |
| US20110022509A1 (en) * | 2005-11-13 | 2011-01-27 | Rosenthal Collins Group, L.L.C. | Method and system for electronic trading via a yield curve on plural network devices |
| US7921046B2 (en) | 2006-06-19 | 2011-04-05 | Exegy Incorporated | High speed processing of financial information using FPGA devices |
| KR101435140B1 (en) * | 2007-10-16 | 2014-09-02 | 삼성전자 주식회사 | Display apparatus and method |
| US20090144187A1 (en) * | 2007-11-30 | 2009-06-04 | Itg Software Solutions, Inc. | System, method and computer program product for determining undisclosed order volume |
| US10229453B2 (en) | 2008-01-11 | 2019-03-12 | Ip Reservoir, Llc | Method and system for low latency basket calculation |
| US20100010937A1 (en) * | 2008-04-30 | 2010-01-14 | Rosenthal Collins Group, L.L.C. | Method and system for providing risk assessment management and reporting for multi-market electronic trading |
| CA2744746C (en) * | 2008-12-15 | 2019-12-24 | Exegy Incorporated | Method and apparatus for high-speed processing of financial market depth data |
| US8489493B2 (en) * | 2011-04-07 | 2013-07-16 | Omx Technology Ab | Method and arrangement for changing market model in an automated exchange |
| US20130024353A1 (en) * | 2011-09-27 | 2013-01-24 | Intercontinentalexchange, Inc. | Interval price limit |
| US20140324656A1 (en) * | 2013-04-30 | 2014-10-30 | Omx Technology Ab | Order life-cycle visualization |
| CN108334342A (en) * | 2017-07-26 | 2018-07-27 | 阿里巴巴集团控股有限公司 | A kind of information displaying method, device and equipment |
| US20190080409A1 (en) * | 2017-09-12 | 2019-03-14 | Michael J. Burns | System for Generating a Client-Action Based Modeled Market |
| JP7233258B2 (en) * | 2019-03-13 | 2023-03-06 | 株式会社日立製作所 | Abnormal diagnosis device |
| US11263695B2 (en) | 2019-05-14 | 2022-03-01 | Exegy Incorporated | Methods and systems for low latency generation and distribution of trading signals from financial market data |
| US20220261901A1 (en) | 2021-02-16 | 2022-08-18 | Exegy Incorporated | Methods and Systems for Bettering Market Making at Low Latency |
Citations (20)
| Publication number | Priority date | Publication date | Assignee | Title |
|---|---|---|---|---|
| US5297031A (en) * | 1990-03-06 | 1994-03-22 | Chicago Board Of Trade | Method and apparatus for order management by market brokers |
| US5414838A (en) | 1991-06-11 | 1995-05-09 | Logical Information Machine | System for extracting historical market information with condition and attributed windows |
| US6098051A (en) | 1995-04-27 | 2000-08-01 | Optimark Technologies, Inc. | Crossing network utilizing satisfaction density profile |
| US20020019799A1 (en) * | 2000-08-04 | 2002-02-14 | Ginsberg Philip M. | Systems and methods for anonymous electronic trading |
| US20020073017A1 (en) | 2000-09-05 | 2002-06-13 | Robert Bender Consulting Ltd. | Method and system of presenting data and analysis for use in stock market trading |
| US6493681B1 (en) | 1999-08-11 | 2002-12-10 | Proxytrader, Inc. | Method and system for visual analysis of investment strategies |
| US20030009411A1 (en) | 2001-07-03 | 2003-01-09 | Pranil Ram | Interactive grid-based graphical trading system for real time security trading |
| WO2003107121A2 (en) | 2002-06-18 | 2003-12-24 | Tradegraph, Llc | System and method for analyzing and displaying security trade transactions |
| US6766304B2 (en) | 2000-03-02 | 2004-07-20 | Trading Technologies International, Inc. | Click based trading with intuitive grid display of market depth |
| US20050075965A1 (en) | 2001-07-24 | 2005-04-07 | Stephen Cutler | Securities market and market maker activity tracking system and method |
| US20050075963A1 (en) * | 2002-12-09 | 2005-04-07 | Sam Balabon | System and method for execution delayed trading |
| US20050228743A1 (en) | 2004-04-01 | 2005-10-13 | Wave Rules, Llc. | Systems and methods of electronic trading using automatic book updates |
| US20050261999A1 (en) | 2004-05-20 | 2005-11-24 | Rowady E P Jr | Event-driven financial analysis interface and system |
| US20060010066A1 (en) | 2004-07-12 | 2006-01-12 | Rosenthal Collins Group, L.L.C. | Method and system for providing a graphical user interface for electronic trading |
| US20060069635A1 (en) * | 2002-09-12 | 2006-03-30 | Pranil Ram | Method of buying or selling items and a user interface to facilitate the same |
| US20060161495A1 (en) | 2004-12-15 | 2006-07-20 | Orc Software Ab | Graphical user interface to facilitate rapid and reliable electronic trading assessment and execution |
| US20060242040A1 (en) | 2005-04-20 | 2006-10-26 | Aim Holdings Llc | Method and system for conducting sentiment analysis for securities research |
| US20060259394A1 (en) * | 2005-04-05 | 2006-11-16 | Lehman Brothers Inc. | Systems and methods for order analysis, enrichment, and execution |
| US20070100718A1 (en) | 2001-05-14 | 2007-05-03 | Gilbert Andrew C | Systems and methods for financial instrument inspection |
| US20090171833A1 (en) | 2005-07-26 | 2009-07-02 | Bandman Jeffrey M | System and method for displaying and/or analyzing a limit order book |
Family Cites Families (71)
| Publication number | Priority date | Publication date | Assignee | Title |
|---|---|---|---|---|
| US6850907B2 (en) * | 1996-12-13 | 2005-02-01 | Cantor Fitzgerald, L.P. | Automated price improvement protocol processor |
| US5905974A (en) * | 1996-12-13 | 1999-05-18 | Cantor Fitzgerald Securities | Automated auction protocol processor |
| US20020194099A1 (en) | 1997-10-30 | 2002-12-19 | Weiss Allan N. | Proxy asset system and method |
| US6493682B1 (en) | 1998-09-15 | 2002-12-10 | Pendelton Trading Systems, Inc. | Optimal order choice: evaluating uncertain discounted trading alternatives |
| US7599876B1 (en) * | 1999-03-16 | 2009-10-06 | Massachusetts Institute Of Technology | Electronic market-maker |
| US6993504B1 (en) * | 1999-04-09 | 2006-01-31 | Trading Technologies International, Inc. | User interface for semi-fungible trading |
| US7212999B2 (en) * | 1999-04-09 | 2007-05-01 | Trading Technologies International, Inc. | User interface for an electronic trading system |
| US6278982B1 (en) | 1999-04-21 | 2001-08-21 | Lava Trading Inc. | Securities trading system for consolidation of trading on multiple ECNS and electronic exchanges |
| WO2001002930A2 (en) * | 1999-07-01 | 2001-01-11 | Globenet Capital Corporation | Method and apparatus for processing securities transactions |
| US7996296B2 (en) | 1999-07-21 | 2011-08-09 | Longitude Llc | Digital options having demand-based, adjustable returns, and trading exchange therefor |
| US20030093343A1 (en) | 1999-08-31 | 2003-05-15 | Sidley Austin Brown & Wood Llp | Dynamic order visibility system for the trading of assets |
| US7181424B1 (en) | 1999-09-23 | 2007-02-20 | The Nasdaq Stock Market, Inc. | Montage for automated market system |
| US7035819B1 (en) * | 1999-09-24 | 2006-04-25 | D.E. Shaw & Company | Method and system for facilitating automated interaction of marketable retail orders and professional trading interest at passively determined prices |
| US7430533B1 (en) * | 2000-01-11 | 2008-09-30 | Itg Software Solutions, Inc. | Automated batch auctions in conjunction with continuous financial markets |
| US7162447B1 (en) * | 2000-02-02 | 2007-01-09 | Itg Software Solutions, Inc. | Method and system for obtaining a discovered price |
| JP3765958B2 (en) * | 2000-02-07 | 2006-04-12 | ケンテックス株式会社 | Stock investment analysis chart showing stock trading order data |
| US20010037284A1 (en) | 2000-03-27 | 2001-11-01 | Finkelstein Ephraim Brian | Negotiated right exchange system and method |
| US7472087B2 (en) | 2000-04-10 | 2008-12-30 | Stikine Technology, Llc | Trading program for interacting with market programs on a platform |
| US7685052B2 (en) * | 2000-06-01 | 2010-03-23 | Pipeline Financial Group, Inc. | Confidential block trading system and method |
| US8069106B2 (en) * | 2000-06-01 | 2011-11-29 | Pipeline Financial Group, Inc. | Block trading system and method providing price improvement to aggressive orders |
| US6983259B1 (en) * | 2000-06-23 | 2006-01-03 | Ebs Group Limited | Anonymous trading system |
| US20020059126A1 (en) * | 2000-06-27 | 2002-05-16 | John Ricciardi | System and method for a selecting an investment item |
| AU2002223957A1 (en) * | 2000-09-28 | 2002-04-08 | Hiren Parikh | Real-time trading system |
| US7184984B2 (en) | 2000-11-17 | 2007-02-27 | Valaquenta Intellectual Properties Limited | Global electronic trading system |
| US7720744B2 (en) * | 2000-12-07 | 2010-05-18 | Bgc Partners, Inc. | Systems and methods for shifting bids and offers in a trading interface |
| AU2002247235A1 (en) | 2001-02-26 | 2002-09-12 | Richard Himmelstein | Electronic bartering system with facilitating tools |
| US6879964B2 (en) | 2001-03-07 | 2005-04-12 | The Vanguard Group, Inc. | Investment company that issues a class of conventional shares and a class of exchange-traded shares in the same fund |
| US7392217B2 (en) * | 2001-05-09 | 2008-06-24 | Bgc Partners, Inc. | Systems and methods for controlling traders from manipulating electronic trading markets |
| US20020194105A1 (en) | 2001-05-18 | 2002-12-19 | Andrew Klein | Process of and system for trading securities and options and markets related thereto |
| US20060020538A1 (en) * | 2001-06-28 | 2006-01-26 | Pranil Ram | Tabs based drag and drop graphical trading interface |
| US20030004853A1 (en) | 2001-06-28 | 2003-01-02 | Pranil Ram | Graphical front end system for real time security trading |
| US7653584B2 (en) * | 2001-06-29 | 2010-01-26 | Chicago Board Options Exchange, Incorporated | Automated execution system having participation |
| WO2003010629A2 (en) | 2001-07-24 | 2003-02-06 | Stephen Cutler | Securities market and market maker activity tracking system and method |
| EP1321870A1 (en) | 2001-12-14 | 2003-06-25 | Deutsche Börse Ag | Integrated order pre-matching system |
| US7587346B2 (en) | 2002-01-07 | 2009-09-08 | The Nasdaq Omx Group, Inc. | Automated market system with selectable match-off of order flow |
| US7085070B2 (en) * | 2002-05-14 | 2006-08-01 | Olympus Corporation | Zoom lens and electronic imaging device having the same |
| DE10221637A1 (en) * | 2002-05-15 | 2003-12-04 | Siemens Ag | Automatically determining graphical representation of projects in planning involves automatically computing predicted business contributions of various projects based on project data in database |
| JP3955802B2 (en) * | 2002-08-02 | 2007-08-08 | クォンツ・リサーチ株式会社 | Contract information providing device, contract information providing method, and contract information providing program |
| US20040078317A1 (en) * | 2002-10-17 | 2004-04-22 | Allen Anne E. | Method and system for generating a dual quote |
| US7752116B2 (en) * | 2002-10-30 | 2010-07-06 | Nasdaq Liffe Markets, Llc | Liquidity engine for futures trading exchange |
| US7523064B2 (en) * | 2002-11-13 | 2009-04-21 | Trading Technologies International, Inc. | System and method for facilitating trading of multiple tradeable objects in an electronic trading environment |
| JP4464281B2 (en) * | 2002-12-09 | 2010-05-19 | バラボン,サム | Systems and methods for buying and selling higher or lower than the market price |
| GB2414835A (en) * | 2003-01-02 | 2005-12-07 | Ebs Group Ltd | Method and apparatus for deriving benchmarks for trading instruments |
| US20040143541A1 (en) * | 2003-01-15 | 2004-07-22 | Fleischer Mark O. | Limit move insurance |
| US7693775B2 (en) * | 2003-01-21 | 2010-04-06 | Lavaflow, Inc. | Automated system for routing orders for financial instruments based upon undisclosed liquidity |
| US7653580B2 (en) * | 2003-02-12 | 2010-01-26 | Water Street Advisers, Inc. | Method for evaluating differences in the past performance of an asset-class population of book-valued investments |
| US20040177025A1 (en) * | 2003-02-27 | 2004-09-09 | Spoonhower Daniel J. | Real-time recommendations |
| US7613650B2 (en) * | 2003-04-24 | 2009-11-03 | Chicago Board Options Exchange, Incorporated | Hybrid trading system for concurrently trading securities or derivatives through both electronic and open-outcry trading mechanisms |
| NZ525956A (en) * | 2003-05-16 | 2005-10-28 | Deep Video Imaging Ltd | Display control system for use with multi-layer displays |
| US20040254876A1 (en) * | 2003-06-13 | 2004-12-16 | Joshua Coval | Schemes for simulating a financial market |
| US7904371B2 (en) * | 2003-06-27 | 2011-03-08 | Jpmorgan Chase Bank, N.A. | Method and system for initiating pairs trading across multiple markets having automatic foreign exchange price hedge |
| US7587357B1 (en) * | 2003-06-30 | 2009-09-08 | Trading Technologies International Inc. | Repositioning of market information on trading screens |
| US7499883B2 (en) * | 2003-07-31 | 2009-03-03 | Marketaxess Holdings Inc. | Electronic inquiry lists for financial products |
| WO2005017678A2 (en) * | 2003-08-06 | 2005-02-24 | Water Street Advisers, Inc. | Method for evaluating relative investment performance from internal benchmarks |
| US7908570B2 (en) * | 2003-12-05 | 2011-03-15 | Trading Technologies International, Inc. | Method and system for displaying a cursor on a trading screen |
| US10832321B2 (en) * | 2003-12-12 | 2020-11-10 | Gfi Group, Inc. | Apparatus, method and system for providing an electronic marketplace for trading credit default swaps and other financial instruments, including a trade management service system |
| US7707092B1 (en) * | 2004-06-17 | 2010-04-27 | Marc S. Freed | System and method for ranking investment performance |
| US20050289042A1 (en) * | 2004-06-24 | 2005-12-29 | Friesen Richard W | Auction merger system |
| US20060036532A1 (en) * | 2004-07-14 | 2006-02-16 | Silverman Andrew F | Methods and apparatus for executing small size orders |
| US7571135B2 (en) * | 2004-07-15 | 2009-08-04 | New York Stock Exchange | System and method for determining and applying parity in a hybrid auction market |
| US7856395B2 (en) * | 2004-08-10 | 2010-12-21 | Microtick, Llc | Short-term option trading system |
| US20060085319A1 (en) * | 2004-10-19 | 2006-04-20 | Rishi Nangalia | Methods and apparatus for routing options orders |
| EP1677182B1 (en) * | 2004-12-28 | 2014-04-23 | Sony Mobile Communications Japan, Inc. | Display method, portable terminal device, and display program |
| JP3981387B2 (en) * | 2005-02-04 | 2007-09-26 | 有限会社増田経済研究所 | Stock index display |
| JP2008541238A (en) * | 2005-05-05 | 2008-11-20 | アーキペラゴ ホールディングス インコーポレイテッド | Auction and transfer of unpriced orders |
| AU2006244483B2 (en) * | 2005-05-05 | 2012-05-31 | Nyse Group, Inc. | Tracking liquidity order |
| AU2006244566A1 (en) * | 2005-05-06 | 2006-11-16 | Archipelago Holdings, Inc. | Passive liquidity order |
| US20070005481A1 (en) * | 2005-06-29 | 2007-01-04 | Vijay Kedia | Real time graphical user interface for on-line trading |
| US20070118455A1 (en) * | 2005-11-18 | 2007-05-24 | Albert William J | System and method for directed request for quote |
| US7580881B2 (en) * | 2005-12-29 | 2009-08-25 | Trading Technologies International, Inc. | System and method for a trading interface incorporating a chart |
| KR102125834B1 (en) * | 2013-11-29 | 2020-06-23 | 삼성전자주식회사 | A mobile terminal and a method for managing power thereof |
-
2005
- 2005-07-26 US US11/189,329 patent/US7933828B2/en active Active
-
2006
- 2006-07-24 AU AU2006275972A patent/AU2006275972B2/en active Active
- 2006-07-24 WO PCT/US2006/028806 patent/WO2007016078A2/en active Application Filing
- 2006-07-24 CA CA002616109A patent/CA2616109A1/en not_active Abandoned
- 2006-07-24 JP JP2008524054A patent/JP5322642B2/en active Active
- 2006-07-24 EP EP06788400A patent/EP1920400A4/en not_active Withdrawn
-
2009
- 2009-02-27 US US12/395,603 patent/US8069108B2/en active Active
-
2011
- 2011-08-12 JP JP2011176568A patent/JP2011222054A/en active Pending
- 2011-11-29 US US13/306,369 patent/US8200572B2/en not_active Expired - Fee Related
-
2012
- 2012-06-11 US US13/493,173 patent/US10210571B2/en active Active
-
2019
- 2019-01-25 US US16/258,219 patent/US10909622B2/en active Active
-
2021
- 2021-01-29 US US17/162,438 patent/US11669902B2/en active Active
-
2023
- 2023-04-27 US US18/140,010 patent/US20240078602A1/en active Pending
Patent Citations (22)
| Publication number | Priority date | Publication date | Assignee | Title |
|---|---|---|---|---|
| US5297031A (en) * | 1990-03-06 | 1994-03-22 | Chicago Board Of Trade | Method and apparatus for order management by market brokers |
| US5414838A (en) | 1991-06-11 | 1995-05-09 | Logical Information Machine | System for extracting historical market information with condition and attributed windows |
| US6098051A (en) | 1995-04-27 | 2000-08-01 | Optimark Technologies, Inc. | Crossing network utilizing satisfaction density profile |
| US6493681B1 (en) | 1999-08-11 | 2002-12-10 | Proxytrader, Inc. | Method and system for visual analysis of investment strategies |
| US6766304B2 (en) | 2000-03-02 | 2004-07-20 | Trading Technologies International, Inc. | Click based trading with intuitive grid display of market depth |
| US20020019799A1 (en) * | 2000-08-04 | 2002-02-14 | Ginsberg Philip M. | Systems and methods for anonymous electronic trading |
| US20020073017A1 (en) | 2000-09-05 | 2002-06-13 | Robert Bender Consulting Ltd. | Method and system of presenting data and analysis for use in stock market trading |
| US20070100718A1 (en) | 2001-05-14 | 2007-05-03 | Gilbert Andrew C | Systems and methods for financial instrument inspection |
| US20030009411A1 (en) | 2001-07-03 | 2003-01-09 | Pranil Ram | Interactive grid-based graphical trading system for real time security trading |
| US20050075965A1 (en) | 2001-07-24 | 2005-04-07 | Stephen Cutler | Securities market and market maker activity tracking system and method |
| WO2003107121A2 (en) | 2002-06-18 | 2003-12-24 | Tradegraph, Llc | System and method for analyzing and displaying security trade transactions |
| US20050228735A1 (en) * | 2002-06-18 | 2005-10-13 | Duquette Douglas R | System and method for analyzing and displaying security trade transactions |
| US20060265317A1 (en) | 2002-06-18 | 2006-11-23 | Trading Technologies International, Inc. | System and method for analyzing and displaying security trade transactions |
| US20060069635A1 (en) * | 2002-09-12 | 2006-03-30 | Pranil Ram | Method of buying or selling items and a user interface to facilitate the same |
| US20050075963A1 (en) * | 2002-12-09 | 2005-04-07 | Sam Balabon | System and method for execution delayed trading |
| US20050228743A1 (en) | 2004-04-01 | 2005-10-13 | Wave Rules, Llc. | Systems and methods of electronic trading using automatic book updates |
| US20050261999A1 (en) | 2004-05-20 | 2005-11-24 | Rowady E P Jr | Event-driven financial analysis interface and system |
| US20060010066A1 (en) | 2004-07-12 | 2006-01-12 | Rosenthal Collins Group, L.L.C. | Method and system for providing a graphical user interface for electronic trading |
| US20060161495A1 (en) | 2004-12-15 | 2006-07-20 | Orc Software Ab | Graphical user interface to facilitate rapid and reliable electronic trading assessment and execution |
| US20060259394A1 (en) * | 2005-04-05 | 2006-11-16 | Lehman Brothers Inc. | Systems and methods for order analysis, enrichment, and execution |
| US20060242040A1 (en) | 2005-04-20 | 2006-10-26 | Aim Holdings Llc | Method and system for conducting sentiment analysis for securities research |
| US20090171833A1 (en) | 2005-07-26 | 2009-07-02 | Bandman Jeffrey M | System and method for displaying and/or analyzing a limit order book |
Non-Patent Citations (9)
| Title |
|---|
| 3DStockCharts.com Launches ECN Super Center; PR Newswire; New York; Oct. 8, 2002; 2-pages. * |
| Australian Examination Report for Application No. 2006275972, dated Jul. 2, 2009 (3 pages). |
| International Preliminary Report on Patentability for International Application No. PCT/US06/28806; dated Mar. 17, 2009 (4 pages). |
| Japanese Office Action with English translation for Application No. 2008-524054, dated Nov. 9, 2010 (7 pages). |
| Making Sense of Technology; Marcus, Daniel; Traders Magazine, v15, n194; Mar. 2002; 3-pages. * |
| Market Makers vs.ECNs; Dorsey, Michael T; Traders Magazine, v13, n173; Oct. 2000; 2-pages. * |
| Nasdaq's New Crown Jewel Will SuperMontage end Fragmentation?; Peter Chapman; Traders Magazine; New York; Jun. 1, 2002; 4-pages. * |
| PCT Notification of Transmittal of the International Search Report and the Written Opinion of the International Searching Authority for International Application No. PCT/US06/28806; 6 pages, Jul. 7, 2008. |
| U.S. Appl. No. 12/395,603, filed Feb. 27, 2009, Bandman et al. |
Cited By (21)
| Publication number | Priority date | Publication date | Assignee | Title |
|---|---|---|---|---|
| US10037125B2 (en) | 2004-03-05 | 2018-07-31 | Trading Technologies International, Inc. | System and method for displaying a constant time selection context menu interface |
| US8713478B2 (en) | 2004-03-05 | 2014-04-29 | Trading Technologies International, Inc | System and method for displaying a constant time selection context menu interface |
| US8200572B2 (en) | 2005-07-26 | 2012-06-12 | Cfph, Llc | System and method for displaying and/or analyzing a limit order book |
| US11669902B2 (en) | 2005-07-26 | 2023-06-06 | Cfph, Llc | System and method for displaying and/or analyzing a limit order book |
| US10909622B2 (en) | 2005-07-26 | 2021-02-02 | Cfph, Llc | System and method for displaying and/or analyzing a limit order book |
| US20090171833A1 (en) * | 2005-07-26 | 2009-07-02 | Bandman Jeffrey M | System and method for displaying and/or analyzing a limit order book |
| US10210571B2 (en) | 2005-07-26 | 2019-02-19 | Cfph, Llc | System and method for displaying and/or analyzing a limit order book |
| US9117244B2 (en) | 2007-03-21 | 2015-08-25 | Trading Technologies International, Inc. | System and method for management and analysis of electronic trade orders |
| US11556984B2 (en) | 2007-03-21 | 2023-01-17 | Trading Technologies International, Inc. | System and method for management and analysis of electronic trade orders |
| US8612335B2 (en) | 2007-03-21 | 2013-12-17 | Trading Technologies International, Inc. | System and method for management and analysis of electronic trade orders |
| US8620794B2 (en) | 2007-03-29 | 2013-12-31 | Trading Technologies International, Inc | System and method for chart based order entry |
| US10373252B2 (en) | 2007-03-29 | 2019-08-06 | Trading Technologies International, Inc. | System and method for chart based order entry |
| US11100583B2 (en) | 2007-03-29 | 2021-08-24 | Trading Technologies International, Inc. | System and method for chart based order entry |
| US11468512B2 (en) | 2007-03-29 | 2022-10-11 | Trading Technologies International, Inc. | System and method for chart based order entry |
| US9646344B2 (en) | 2007-03-29 | 2017-05-09 | Trading Technologies International, Inc. | System and method for chart based order entry |
| US10684617B2 (en) * | 2014-05-28 | 2020-06-16 | Siemens Aktiengesellschaft | Method and supervisory control device for monitoring an installation |
| US20170192416A1 (en) * | 2014-05-28 | 2017-07-06 | Siemens Aktiengesellschaft | Method and supervisory control device for monitoring an installation |
| US11094015B2 (en) * | 2014-07-11 | 2021-08-17 | BMLL Technologies, Ltd. | Data access and processing system |
| US10853889B2 (en) | 2015-05-11 | 2020-12-01 | Nice Ltd. | Transaction tracking and display |
| US11301940B2 (en) | 2015-05-11 | 2022-04-12 | Nice Ltd | Transaction tracking and display |
| US10147144B2 (en) * | 2015-05-11 | 2018-12-04 | Nice Ltd. | Transaction tracking and display |
Also Published As
| Publication number | Publication date |
|---|---|
| US20240078602A1 (en) | 2024-03-07 |
| US20210150627A1 (en) | 2021-05-20 |
| US20120072333A1 (en) | 2012-03-22 |
| US20130097063A1 (en) | 2013-04-18 |
| JP2011222054A (en) | 2011-11-04 |
| WO2007016078A2 (en) | 2007-02-08 |
| EP1920400A2 (en) | 2008-05-14 |
| JP2009508185A (en) | 2009-02-26 |
| US20190172134A1 (en) | 2019-06-06 |
| EP1920400A4 (en) | 2011-04-06 |
| AU2006275972A1 (en) | 2007-02-08 |
| US8200572B2 (en) | 2012-06-12 |
| US10909622B2 (en) | 2021-02-02 |
| AU2006275972B2 (en) | 2011-04-07 |
| US11669902B2 (en) | 2023-06-06 |
| JP5322642B2 (en) | 2013-10-23 |
| WO2007016078A9 (en) | 2007-04-12 |
| WO2007016078A3 (en) | 2009-04-23 |
| US8069108B2 (en) | 2011-11-29 |
| CA2616109A1 (en) | 2007-02-08 |
| US20090171833A1 (en) | 2009-07-02 |
| US10210571B2 (en) | 2019-02-19 |
| US20070027788A1 (en) | 2007-02-01 |
Similar Documents
| Publication | Publication Date | Title |
|---|---|---|
| US11669902B2 (en) | System and method for displaying and/or analyzing a limit order book | |
| US20190114708A1 (en) | Systems and methods for sharing excess profits | |
| US10229456B2 (en) | System and method managing trading using alert messages for outlying trading orders | |
| US8849711B2 (en) | System and method for displaying a combined trading and risk management GUI display | |
| US8682777B1 (en) | Methods and systems for computer-based trading enhanced with market and historical data displayed on live screen | |
| US20090076945A1 (en) | Quick-filling customer asset trading system for booking orders with multiple providers | |
| JP2010118084A (en) | System and method for estimating and optimizing transaction cost | |
| JP2004535007A (en) | Electronic trading method | |
| JP2005530232A5 (en) | ||
| CA2354081A1 (en) | Automated price improvement protocol processor | |
| US20050049954A1 (en) | Portfolio compliance managing techniques | |
| US20120265666A1 (en) | Method and system for interest rate swaps | |
| US7707097B1 (en) | Fully transparent commission calculator and display system | |
| US20180336634A1 (en) | Commission calculator and display | |
| AU2018241057A1 (en) | System and method for displaying and/or analyzing a limit order book | |
| AU2014280900A1 (en) | System and method for displaying and/or analyzing a limit order book | |
| AU2004222811A1 (en) | Automated Price Improvement Protocol Processor |
Legal Events
| Date | Code | Title | Description |
|---|---|---|---|
| AS | Assignment |
Owner name: CFPH, LLC, NEW YORK Free format text: ASSIGNMENT OF ASSIGNORS INTEREST;ASSIGNORS:BANDMAN, JEFFREY M.;ONDYAK, NATHAN J.;SORENSON, EUGENE M.;AND OTHERS;SIGNING DATES FROM 20050628 TO 20050726;REEL/FRAME:017629/0548 Owner name: CFPH, LLC, NEW YORK Free format text: ASSIGNMENT OF ASSIGNORS INTEREST;ASSIGNORS:BANDMAN, JEFFREY M.;ONDYAK, NATHAN J.;SORENSON, EUGENE M.;AND OTHERS;REEL/FRAME:017629/0548;SIGNING DATES FROM 20050628 TO 20050726 |
|
| STCF | Information on status: patent grant |
Free format text: PATENTED CASE |
|
| FPAY | Fee payment |
Year of fee payment: 4 |
|
| MAFP | Maintenance fee payment |
Free format text: PAYMENT OF MAINTENANCE FEE, 8TH YEAR, LARGE ENTITY (ORIGINAL EVENT CODE: M1552); ENTITY STATUS OF PATENT OWNER: LARGE ENTITY Year of fee payment: 8 |
|
| MAFP | Maintenance fee payment |
Free format text: PAYMENT OF MAINTENANCE FEE, 12TH YEAR, LARGE ENTITY (ORIGINAL EVENT CODE: M1553); ENTITY STATUS OF PATENT OWNER: LARGE ENTITY Year of fee payment: 12 |