US7804595B2 - Using optical scattering to measure properties of ultrasound contrast agent shells - Google Patents
Using optical scattering to measure properties of ultrasound contrast agent shells Download PDFInfo
- Publication number
- US7804595B2 US7804595B2 US11/531,998 US53199806A US7804595B2 US 7804595 B2 US7804595 B2 US 7804595B2 US 53199806 A US53199806 A US 53199806A US 7804595 B2 US7804595 B2 US 7804595B2
- Authority
- US
- United States
- Prior art keywords
- microbubble
- light
- uca
- radius
- bubbles
- Prior art date
- Legal status (The legal status is an assumption and is not a legal conclusion. Google has not performed a legal analysis and makes no representation as to the accuracy of the status listed.)
- Expired - Fee Related, expires
Links
Images


Classifications
-
- G—PHYSICS
- G01—MEASURING; TESTING
- G01N—INVESTIGATING OR ANALYSING MATERIALS BY DETERMINING THEIR CHEMICAL OR PHYSICAL PROPERTIES
- G01N21/00—Investigating or analysing materials by the use of optical means, i.e. using sub-millimetre waves, infrared, visible or ultraviolet light
- G01N21/17—Systems in which incident light is modified in accordance with the properties of the material investigated
- G01N21/47—Scattering, i.e. diffuse reflection
-
- A—HUMAN NECESSITIES
- A61—MEDICAL OR VETERINARY SCIENCE; HYGIENE
- A61B—DIAGNOSIS; SURGERY; IDENTIFICATION
- A61B8/00—Diagnosis using ultrasonic, sonic or infrasonic waves
- A61B8/48—Diagnostic techniques
- A61B8/481—Diagnostic techniques involving the use of contrast agent, e.g. microbubbles introduced into the bloodstream
Definitions
- UCAs ultrasound contrast agents
- a basic characterization of UCAs typically involves measurement of their attenuation (scattering and absorption). These measurements provide information about the resonance frequency of the bubbles, and their damping. Some information about bubble populations can also be inferred from the measurements. However, there does not appear to be any correlation between attenuation and UCA performance or functionality. Broadband noise has also been used to obtain information about UCAs and their effect on the environment. Studies have found that a cavitation dose (a measure of initial cavitation activity) correlates very well with hemolysis (the destruction of red blood cells and associated release of hemoglobin) in vitro, suggesting that hemolysis can potentially be used as a measure of cavitational activity.
- a more direct approach to characterizing UCA performance involves determining acoustical backscattering, especially since diagnostic ultrasound is based on detecting backscattered signals.
- detection modalities have been used, including sub-harmonic, second-harmonic, and super-harmonic detection.
- various pulse schemes have increased the signal-to-noise ratio (SNR) of the acoustical data collection system.
- SNR signal-to-noise ratio
- Such modalities are limited because of a fundamental lack of understanding of the physics of ultrasound/microbubble interaction. For example, backscattering signatures are often machine dependent, or concentration dependent, but these dependencies are not well understood.
- a UCA is placed in an imaging volume including either degassed water or a water/gel solution and is illuminated with a light source such as a laser.
- the UCA is exposed to pressure variations (preferably pulses of imaging or therapeutic ultrasound), while the optical scattering data are processed.
- the scattering intensity is related to the radius of the UCA.
- the collected data are processed to provide a radius versus time (RT) relationship.
- the RT relationship is fit to one or more conventional dynamic models using known techniques (such as linear squares).
- the fitted empirical data can be used to determine one or more UCA parameters, such as shear modulus, and shell viscosity.
- Such a technique offers several advantages over imaging and acoustic techniques. Compared to high-speed optical imaging, the major advantage is in data collection; light scattering signals can be collected in real time, over tens, hundreds, and even thousands of acoustic pulses, providing the ability to monitor the evolution of UCAs with successive acoustic pulses. This technique is also relatively inexpensive (since a simple photomultiplier tube is used instead of an expensive high-speed camera). While the present technique alone cannot provide direct visual information regarding UCA dynamics and destruction as can be done in high-speed imaging, the present light scattering technique has advantages in being able to monitor the instantaneous motion of a microbubble.
- a system for implementing the light scattering technique includes a fluid volume into which the UCA can be introduced, a light source for illuminating the UCA, a light sensitive detector for collecting light scattered by the UCA, a pressure source for varying the pressure in the fluid volume, a sensor for measuring actual pressure conditions, and a processor for manipulating the collected data.
- the light source is a laser
- the light sensitive detector is a photomultiplier tube (PMT)
- the pressure source is an imaging or therapeutic ultrasound probe/system
- the sensor is a hydrophone
- the processor is a computing device (in one exemplary embodiment, an oscilloscope is used to manipulate the signal from the PMT before the data are processed by the computing device).
- the processor is configured to generate an RT curve based on the collected data, to fit the curve to one or more pre-defined models, and to calculate one or more parameters based on the fitted RT curve.
- An exemplary method includes the steps of collecting scattering data using a system generally consistent with system described above, while a UCA is exposed to varying pressure conditions.
- An RT curve is generated based on the collected data, and the RT curve is fitted to one or more predefined models. The fitted curve is used to calculate one or more UCA parameters.
- FIG. 1 schematically illustrates exemplary method steps for using scattered light to calculate one or more UCA parameters
- FIG. 2 schematically illustrates an exemplary system for implementing the method steps of FIG. 1 ;
- FIG. 3A graphically illustrates the relationship between scattering intensity and scattering angle
- FIG. 3B graphically illustrates the relationship between bubble radius and scattered light intensity
- FIG. 4A graphically illustrates a simulation for microbubbles with a varying shell parameter
- FIG. 4B graphically illustrates a waterfall plot of the simulated response curve R(t) for various initial bubble sizes and a fixed shell parameter using the same drive amplitude
- FIG. 4C graphically illustrates an exemplary simulation contour map of (R max -R 0 ) vs. R 0 and ⁇ sh ;
- FIG. 4D graphically illustrates the peak in the power spectral density (the main frequency component) of the simulation shown in FIG. 4A ;
- FIGS. 5A-5B , 6 A- 6 B, and 7 A- 7 B graphically illustrate empirical data and model fits for two different types of UCAs, in both water and a xanthan gum gel;
- FIG. 8 summarizes parameters for the data set corresponding to FIGS. 5A-5B , 6 A- 6 B, and 7 A- 7 B;
- FIGS. 9A-9C graphically illustrate the slow evolution of a SonazoidTM microbubble in water, collected using three successive groups of ten pulses;
- FIG. 10 summarizes parameters for the data set corresponding to FIGS. 9A-9C ;
- FIGS. 11A-11D graphically illustrate OptisonTM response curves (i.e., RT curves) to individual (i.e., non-averaged) pressure pulses from diagnostic ultrasound in an aqueous/xanthan gum solution;
- FIG. 12 summarizes response curve parameters for the data set corresponding to FIGS. 11A-11D ;
- FIGS. 13A-13F graphically illustrate RT curves for optical scattering data collected from a SonazoidTM bubble in water, showing individual responses (i.e., non-averaged responses) due to consecutive ultrasound pulses;
- FIG. 14 summarizes response curve parameters for the data set corresponding to FIGS. 13A-13F ;
- FIG. 15 graphically illustrates normalized PSDs from FIGS. 9A-9C ;
- FIG. 16 schematically illustrates yet another exemplary system to collect light scattered by microbubbles during changing pressure conditions
- FIG. 17A illustrates a modified Gaussian pulse used to simulate a driving signal for different dynamic models
- FIG. 17B illustrates typical bubble responses using four different dynamic bubble models
- FIGS. 18A-18C graphically illustrate results provided by three different dynamic models, with varying parameters
- FIGS. 19A showing measured driving pressure pulse
- 19 B shows measured bubble response and fits
- FIG. 20A is a graph showing a change of a shell shear modulus as a function of radius
- FIG. 20B is a graph showing a change of a shell viscosity as a function of radius
- FIG. 21A graphically illustrates a typical effective RT curve of a group of UCA bubbles stimulated using B-Mode ultrasound
- FIG. 21B graphically illustrates the power spectrum corresponding to the data of FIG. 21A ;
- FIG. 21C graphically illustrates power spectrums collected from UCA bubbles collected at different times, using the same acoustic power settings
- FIG. 22 is a composite image graphically illustrating the power spectrum of UCA bubbles driven by different acoustic power settings using B-Mode ultrasound;
- FIGS. 23A and 23B are composites images, with FIG. 23A including RT curves, and FIG. 23B including power spectrums;
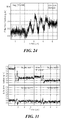
- FIG. 24 graphically illustrates data averaged over 100 consecutive pulses, showing changes to bubble size
- FIG. 25A includes RT curves of the same group of UCA bubbles during the consecutive insonification
- FIG. 25B shows power spectrums corresponding to the data of FIG. 25A ;
- FIG. 26A graphically illustrates an RT curve
- FIG. 26B graphically illustrates a power spectrum corresponding to the data of FIG. 26A ;
- FIG. 27 graphically illustrates a typical RT curve for a mass of UCA bubbles stimulated with Pulse-Doppler Mode ultrasound;
- FIG. 28 graphically illustrates a power spectrum corresponding to the data of FIG. 27 ;
- FIG. 29 is a composite image graphically illustrating the power spectrum of multiple UCA bubbles being driven by different acoustic powers (MI) in a Pulse-Doppler Mode;
- MI acoustic powers
- FIG. 30A graphically illustrates a typical response from a mass of UCA bubbles stimulated by M-Mode ultrasound
- FIG. 30B graphically illustrates a power spectrum corresponding to the data of FIG. 30A ;
- FIG. 31 is a composite image that graphically illustrates consecutive effective RT curves of a mass of UCA bubbles responding to M-Mode stimulation.
- UCA perfluoropropane
- PFB perfluorobutane
- OFFP octafluoropropane
- FIG. 1 schematically illustrates exemplary method steps for using scattered light to calculate one or more UCA parameters.
- the exemplary method steps include collecting light scattered from a UCA while the UCA is exposed to varying pressure conditions, as indicated by a block 10 .
- An RT curve is generated based on the collected data, as indicated by a block 12 , and the RT curve is fitted to one or more predefined models, as indicated by a block 14 .
- the fitted curve is used to calculate one or more UCA parameters, as indicated in a block 16 .
- FIG. 2 schematically illustrates an exemplary system 20 for implementing the method steps of FIG. 1 .
- System 20 includes a fluid volume 22 (for example, implemented using an optically transparent container, such as glass or plastic) into which the UCA can be introduced, a light source 24 for illuminating the UCA, a light sensitive detector 26 for collecting light scattered by the UCA, a pressure source for varying the pressure in the fluid volume (preferably implemented using an ultrasound probe/system 28 ), a sensor 30 for measuring actual pressure conditions, and a processor 32 for manipulating the collected data.
- a fluid volume 22 for example, implemented using an optically transparent container, such as glass or plastic
- a light source 24 for illuminating the UCA
- a light sensitive detector 26 for collecting light scattered by the UCA
- a pressure source for varying the pressure in the fluid volume (preferably implemented using an ultrasound probe/system 28 )
- a sensor 30 for measuring actual pressure conditions
- a processor 32 for manipulating the collected data.
- light source 24 is a laser
- light sensitive detector 26 is a photomultiplier tube (PMT)
- sensor 30 is a hydrophone
- processor 32 is a computing device (an oscilloscope 34 can be used to manipulate the signal from the PMT before the data are processed by the computing device).
- Processor 32 is configured to generate an RT curve based on the collected data, to fit the curve to one or more pre-defined models, and to calculate one or more parameters based on the fitted RT curve.
- a lens 36 may (or may not) be used to direct light scattered by a UCA in the fluid volume toward the PMT.
- a UCA injector 38 (such as a syringe pump or pipette) is used to inject a UCA agent into the fluid volume.
- a scattering angle from about 70 degrees to about 90 degrees is desirable, and the relative orientations of one or more of the injector, light source, and lens can be manipulated to achieve such a scattering angle.
- the laser light source employed in an empirical system was a red helium/neon (HeNe) laser, having a wavelength of 633 nm.
- FIG. 1 Various Figures provided herein graphically depict RT curves generated using light scattered by microbubbles. Such Figures often include both solid lines and dashed lines. Except where otherwise indicated, the solid line refers to empirically collected data, while the dashed line refers to fitted data. Those of ordinary skill in the art will readily recognize that many fitting algorithms and commercial fitting software programs are available. It should also be recognized that many different dynamic models describing microbubble are available, or may become available. Many variables in the model can be measured or estimated, to minimize the number of variables that are fitted. The unknown variables can be limited to shell parameters.
- variables that can be measured include pressure (e.g., as measured by the hydrophone) and bubble radius (which can be measured optically using a microscope or microscope and camera, or with light scattering while the bubble is static). Radius measurements for many UCAs are readily available in the published literature.
- the Mie theory describes light scattering from homogeneous spheres (or bubbles, in the context of the current disclosure) in a homogeneous environment.
- this theory indicates that the intensity of scattered light depends strongly on the observation angle.
- the observation angle should be near the critical angle (about 83 degrees) from forward scattering. This preference is based on a physical-optics approximation, which suggests that the scattered light intensity is a monotonic function of bubble size.
- Calculations and empirical data have indicated the presence of relatively thin shells (i.e., on the order of 10-15 nm), which does not substantially change the relationship between scattering intensity and scattering angle (graphically illustrated in FIG.
- the Mie theory can be usefully applied to UCA (which are not homogenous spheres), as well as to homogeneous spheres.
- the Mie theory also establishes a monotonic relationship between sphere/bubble size and scattered light intensity (larger bubbles result in an increase in the intensity of the scattered light), as indicated in FIG. 3B . Because of the relationship indicated in FIG. 3B , it is straightforward to convert scattered light intensity into a radius.
- the detector collects light from a finite angular distribution, not just at a single angle (the lens being employed to increase the light intensity onto the detector).
- the angular span ranges from approximately 70° to 90°.
- the curve in FIG. 3B shows the relative integrated intensity over this span as a function of bubble size.
- the assumptions for Eq. (1) include following: (1) the motion of the bubble is symmetric; (2) the wavelength of ultrasound is much larger than the bubble radius; (3) no rectified diffusion occurs; and, (4) the bubble contains gas or vapor, which is compressed and behaves according to the gas law, with the polytropic parameter held constant.
- this parameter space covers 0.1 ⁇ R 0 ⁇ 6 mm, 0 ⁇ sh ⁇ 8 nm Pa s, and 0.0235 ⁇ P drive (t) ⁇ 1.2 MPa (peak negative), relevant for thin shelled agents. Because isothermal behavior is assumed, the elasticity terms cancel. Assuming R>> ⁇ (also assumed by Morgan in developing the model), the only term with shell parameters is given by 12 ⁇ sh R ⁇ /R 2 . Hence, the shell parameter can be referred to as the product ⁇ sh . Note that there are initially three unknowns: R 0 , P drive (t), and the product ⁇ sh .
- a calibrated needle hydrophone (the sensor in FIG. 2 ) can be used to measure acoustic driving pressure, as an input to the Morgan bubble dynamics model, thereby decreasing the unknowns by one.
- Most of the initially collected empirical data was obtained from the M-Mode of a diagnostic ultrasound system (the ATL Ultramark 4PlusTM). Empirical data indicate the acoustic driving pressure of the selected ultrasound system falls well within the above-noted parameter space for the driving pressure.
- FIG. 4B graphically illustrates a waterfall plot of the simulated response curve R(t) for various initial bubble sizes and a fixed shell parameter (same drive amplitude). The resonant bubble size is darkened.
- FIG. 4C graphically illustrates a simulation contour map of (R max ⁇ R 0 ) vs. R 0 and ⁇ sh (with the same drive amplitude).
- FIG. 4D graphically illustrates the peak in the power spectral density (the main frequency component) of the simulation in FIG. 4A .
- the resonant bubble size can be seen in FIG. 4B , where the curves appear to bunch together.
- the response curve R(t) has significant fluctuations near resonance.
- the resonant bubble size increases with increasing shell parameter, from about 1.3 ⁇ m to about 2.1 ⁇ m, which is an expected behavior, consistent with the thin shell behaving as a damping mechanism. That is, an increase in damping results in a decrease in resonant frequency, or, equivalently, an increase in resonant size.
- the maximum amplitudes of the two main peaks in FIG. 4A change relative to each other as the shell parameter increases.
- the first peak initially smaller than the second peak, becomes the larger peak for ⁇ sh >0.4 nm Pa s, which is most probably a consequence of the specific pressure pulse used. That is, the pressure pulse has two resonant peaks, near 2.3 MHz and 3.2 MHz. Because the resonance size depends on the shell parameter, as the shell parameter increases, it is possible that first one, and then the other of these resonances are manifest, resulting in a change in the bubble response.
- the power spectral density (PSD) for the example of FIG. 4A is shown in FIG. 4D .
- the peak in the PSD decreases with increasing shell parameter, but levels off quickly. It would be difficult to distinguish between two bubbles with different shell parameters, for ⁇ sh >3 nm Pa s, using only the PSD; however, the PSD might be used to determine when the shell breaks.
- the PSD is the frequency response of the system driven by the measured pressure pulse, and thus, includes the spectral characteristics of the driving pulse. It is nevertheless instructive to compare it to the bubble's resonance frequency, obtained from linearizing the equation of motion, setting R ⁇ R 0 (1+ ⁇ ), expanding relevant terms in a binomial expansion, and neglecting second-order and higher terms. This leads to the frequency of oscillation, f r , as follows:
- f r 1 2 ⁇ ⁇ ⁇ 3 ⁇ ⁇ ⁇ ⁇ R 0 2 ⁇ ( P 0 + 2 ⁇ ⁇ R 0 + 2 ⁇ ⁇ R 0 ) - 2 ⁇ ⁇ + 6 ⁇ ⁇ ⁇ ⁇ ⁇ R 0 3 - ( 4 ⁇ ⁇ + 12 ⁇ ⁇ sh / R 0 ) 2 ⁇ 2 ⁇ R 0 4 ( 3 )
- the linear resonance frequency, f r is approximately 3.5 MHz.
- the following empirical study employed a system generally consistent with that shown in FIG. 2 .
- the study involved injecting individual microbubbles into a region of interest, insonifying the microbubble with ultrasound, and collecting light scattered from the microbubble.
- the region of interest is the small volume of liquid where the ultrasound and laser illumination intersect a microbubble.
- the liquid was filtered (0.2 ⁇ m porosity) and de-ionized (having >18 M ⁇ resistance) water.
- UCAs were injected manually into the water-filled vessel that contained a small amount of a water soluble gum (e.g., xanthan gum).
- a water soluble gum e.g., xanthan gum
- the xanthan gum increased the viscosity of the liquid slightly, so that after injection, the microbubble came to rest and remained relatively stationary.
- the microbubble was then imaged with a back-lit LED, microscope, and CCD camera to verify that there was indeed a single bubble in the region of interest.
- the fluid vessel was then repositioned so that the bubble was at the center of the laser beam/ultrasound probe focus.
- Empirical data indicate that there was no major difference in measurements between experiments conducted in water and the xanthan gum mixtures, except that the added xanthan gum yielded higher noise levels.
- the xanthan gum gel preparation was performed as follows: 2.6 grams BT food grade xanthan gum powder, 12 g glycol, and 600 g water (slightly degassed) were combined. First, the powder and glycol were mixed and poured into a beaker, and the water was then poured into the beaker very slowly over a stick to minimize the trapping of bubbles. The mixture was stirred slowly for up to an hour using a magnetic stir bar to make it homogeneous. The gel was finally poured slowly into the experimentation vessel. Because of the possibilities of contamination and bacterial growth, a new gel was made prior to the start of each experiment. If more viscous gels are used, removing trapped bubbles becomes much more difficult and requires centrifuging the solution for up to 3 hours.
- the beam waist at the region of interest i.e., where the microbubble, the laser beam, and the ultrasound intersect
- the light scattered from the bubble was then focused with a 5 cm lens onto a PMT detector (Hamamatsu, Model 2027TM).
- the main function of the collecting lens was to increase the signal/noise (covering the angles 70°-90°).
- the PMT was biased at 21000 V.
- a HeNe line filter was placed against the PMT cathode window to block other sources of light.
- the output of the PMT was conveyed directly to a high-speed digital oscilloscope (LeCroy), and then to a personal computer for post-processing.
- LeCroy high-speed digital oscilloscope
- the varying pressure conditions were supplied using an imaging ultrasound probe (placed directly in the fluid vessel, although an externally disposed transducer can also be employed, so long as the fluid vessel wall is acoustically transparent).
- Data collection was performed in a sequence mode, where high-resolution data files are collected during each ultrasound pulse.
- the total data collected are limited by the available memory of the oscilloscope.
- data sequence records of 40 consecutive acoustic pulses were collected before transferring the file to the computing device.
- Each segment included a 5 ms long window, with a resolution of 4 ns.
- the segments were separated by about 1 ms (triggered by the source transducer). Appropriate delays in triggering were used to ensure that the bubble response was centered in the segment window.
- the imaging ultrasound probe (the Ultramark 4PlusTM) was operated in the M-Mode at about 1 kHz pulse repetition frequency (PRF).
- PRF pulse repetition frequency
- a calibrated needle hydrophone monitored the acoustic pressure.
- the hydrophone was placed at an angle relative to the pulse.
- the relative angle between the transducer and hydrophone had to be measured, and then a separate water tank was used to determine the hydrophone response as a function of the angle of the ultrasound probe.
- This hydrophone response as a function of the angle expressed as a multiplicative factor, was then used in all subsequent data analyses.
- FIGS. 5A-5B , 6 A- 6 C, and 7 A- 7 D graphically illustrate data and model fits for OptisonTM and SonazoidTM UCAs, in water and diluted aqueous xanthan gum gel.
- the light scattering model and data both produce an intensity versus time I(t) that must be converted to a radius versus time R(t).
- the scattered intensity is found by subtracting the background intensity from the total intensity.
- the model generates a relative value, so a multiplicative scaling factor must be found to match the model to the data. Once the scaling factor is found, it is unchanged for all subsequent experiments.
- the relationship described above for FIG. 3B can be used to convert the relative intensity to a radius.
- FIG. 5A graphically illustrates an RT curve generated using an OptisonTM UCA pulsed with the Ultramark 4PlusTM in water
- FIG. 5B graphically illustrates an RT curve generated using an OptisonTM UCA pulsed with the Ultramark 4PlusTM in the water/xanthan gum solution.
- the Morgan model discussed above is arguably not the most accurate model to use for encapsulated microbubbles, the overall good fit to the data suggests that the empirical data is indeed based on measuring the pulsations of individual encapsulated microbubbles.
- the experiments were repeated in the diluted aqueous/xanthan gum gel mixture.
- the diluted gel mixture was sufficiently viscous to enable a UCA to be manually injected into the region of interest. The UCA could then be examined under a microscope to ensure that the agent in the region of interest was an individual microbubble (as opposed to a mass of microbubbles).
- each UCA would remain in the region of interest for several minutes, indicating that the bubbles were shelled and stable.
- diluted xanthan gum gel did not affect the dynamics adversely, and the fit is remarkably good.
- the measured peak negative pressure and fitted initial bubble radius, R 0 are 340 kPa and 1.5 ⁇ m, respectively. As with the previous data, these bubbles also exhibit nearly linear oscillations.
- FIGS. 6A , 6 B, 7 A, and 7 B Sample response curves from a single element transducer (i.e., a transducer configured for therapeutic ultrasound rather than for imaging ultrasound) are shown in FIGS. 6A , 6 B, 7 A, and 7 B. These experiments were performed both in water and aqueous xanthan gum gel mixtures.
- FIG. 6A (OptisonTM), data from a ten-cycle tone burst were averaged over 37 pulses.
- FIG. 6B (OptisonTM), data from a ten-cycle tone burst were averaged over 40 pulses.
- FIG. 7A (SonazoidTM), data from a ten-cycle tone burst were averaged over 5 pulses.
- OptisonTM OptisonTM
- the pressure amplitude employed was approximately 130 kPa. This pressure amplitude is lower than the fragmentation thresholds found in the literature for the UCAs utilized. The studies providing the thresholds were looking at relatively fast destruction mechanisms, not slow decay mechanisms. A more relevant comparison is likely to be the slow decay of backscattered signals for UCAs subjected to clinical ultrasound.
- FIGS. 9A-9C graphically illustrate the slow evolution of a SonazoidTM microbubble in water, collected in three successive groups of ten pulses. Significantly, a good fit was obtained without having to change the shell parameter; it was kept constant at 2.0 nm Pa s. However, R 0 was increased between groups (from 1.2 to 1.9 ⁇ m; see Table II in FIG. 10 ). That is, the SonazoidTM microbubble appears to be growing with successive pulses. This slow growth phenomenon was not observed with OptisonTM bubbles. Two physical interpretations can be made. First, the lipid shell may have been partially compromised before the experiment began. Although possible, this trend has been observed from many different datasets. Second, during expansion or compression, the lipid shell may alternatively become semi-permeable.
- FIGS. 9A-9C show successive segments in one sequence of data. At about 1 ms between segments (equal to the burst PRF), the total elapsed time is about 30 ms.
- FIGS. 9A-9C A summary of the parameters for FIGS. 9A-9C is provided in Table II ( FIG. 10 ).
- Table II FIG. 10 Previously reported data indicates that SonazoidTM microbubbles dissolve after each pulse; however, such data were generated using about twice the pressure amplitude. It is likely that at those higher pressures, gas may be forced through the shell during compression.
- FIGS. 11A-11D graphically illustrate OptisonTM response curves (i.e., RT curves) for individual (i.e., non-averaged) pressure pulses from the Ultramark 4PlusTM in the diluted aqueous/xanthan gum solution/gel.
- OptisonTM response curves i.e., RT curves
- FIGS. 11A-11C the microbubble response comes from consecutive pulses. A single pulse is skipped, and then the data illustrated in FIG. 11D were collected.
- the Figures illustrate the dynamical response from pulses 1 , 2 , 3 , and 5 .
- FIGS. 11B-11D There appears to be a second series of oscillations developing in FIGS. 11B-11D . These signals may be due to the arrival of a second microbubble.
- the Morgan model corresponds to the data rather well.
- the fit is for a 1.5 ⁇ m radius bubble, with a shell parameter of 6.0 nm Pa s.
- FIG. 11B the fit is still acceptable; however, there are large amplitude “spikes” in the dataset. Such spikes were often observed immediately before, or during microbubble destruction, and may be related to a crumpling of the shell (shell crumpling has been previously observed).
- FIGS. 11C and 11D the model must be adjusted by decreasing the shell parameter (keeping the radius fixed). That is, the shell of the microbubble from which the scattered light was collected appears to be compromised.
- Table III FIG. 12 ).
- FIGS. 13A-13F graphically illustrate RT curves for optical scattering data collected from a SonazoidTM bubble in water, while the bubble was undergoing an evolution during consecutive pulses (one pulse is not shown between the last two pulses, i.e., a pulse was skipped between the RT curves of FIGS. 13E and 13F ).
- the shell parameter is fixed, but the ambient bubble radius was increased from 0.8 ⁇ m to 1.2 ⁇ m to maintain a good fit (i.e., to achieve the fit indicated by the dashed line).
- the SonazoidTM bubble appears to absorb air from its surroundings before the shell is broken.
- pulse number 5 i.e., FIG. 13E
- the shell is compromised.
- Light scattering data may also be suited to fast analysis by examining the spectrum of the signals.
- PSD power spectral densities
- FIG. 15 graphically illustrates normalized PSDs. There are significant fundamental peaks in the PSDs of FIG. 15 , related to the (real) resonance frequency of the system. Furthermore, apparent sub-harmonic and harmonic components were often observed. A more thorough analysis of these signals may eventually lead to better information about the response curves, or R(t) that could be used to optimize the agents for imaging and therapy.
- the collected data i.e., the RT curves
- the number of variables being fitted can be minimized by acquiring data corresponding to as many of the model variables as possible.
- ambient pressure can be measured using a hydrophone while the scattered light is collected, eliminating pressure as a variable.
- the initial radius of a microbubble can be measured optically (i.e., using a microscope and a camera), or literature-based values can be used for the initial radius, eliminating yet another variable.
- the only unknown variables involved in the fitting process relate to shell parameters, which to date, have been difficult to empirically measure. The following discussion is related to additional models.
- the de Jong's model, Church's model, Hoff's model, and Sarkar's model are each based on the general RPNNP equation (i.e., Eq. (1)), which as noted above, describes the response of a spherical bubble to a time-varying pressure field in an incompressible liquid.
- ⁇ th 1 ⁇ 0 ⁇ ⁇ ⁇ p 0 ⁇ L ⁇ a 2 ⁇ Im ⁇ ( 1 ⁇ ) ( 6 )
- ⁇ ⁇ 4 ⁇ ⁇ L ⁇ 0 ⁇ ⁇ L ⁇ R 2 ( 8 )
- ⁇ L is the liquid shear viscosity.
- the shell friction parameter is:
- ⁇ f 12 ⁇ ⁇ s ⁇ d se ⁇ 0 ⁇ ⁇ L ⁇ R 3 ( 9 )
- ⁇ s is the shell shear viscosity.
- the polytrophic exponent is:
- FIG. 16 is based on the system of FIG. 2 , and includes an optional microscope 42 , an optional CCD camera 44 , and an optional monitor 46 to enable the radius of the microbubble to be empirically measured, generally as discussed above.
- the highly diluted SonovueTM suspensions were injected into the region of interest (ROI defined herein as being a small volume 52 where the ultrasound and laser beams intersected with SonovueTM bubbles) using a syringe pump 68 (e.g., a 74900TM series, Cole-Parmer Instrument Co., Vernon Hills, Ill., USA) at a rate of 10 ml/h with a tube (0.5 mm inner-diameter).
- a syringe pump 68 e.g., a 74900TM series, Cole-Parmer Instrument Co., Vernon Hills, Ill., USA
- the driving acoustic pulses were sent from a probe of a diagnostic ultrasound instrument 58 (e.g., an Ultramark 4PlusTM, ATL-Philips, USA) operated in M-Mode at 1-kHz pulse-repetition-frequency (PRF) and monitored using a calibrated needle hydrophone 60 (e.g., from NTR Systems Inc., Seattle, Wash., USA).
- An HeNe laser 54 (Melles Griot, Carlsbad, Calif., USA) was used as a light source. The waist of the laser beam was focused to less than 100 ⁇ m at the ROI by a lens (not shown).
- the scattered light signals from the microbubbles in the ROI were collected and focused by another lens 66 onto a photo-multiplier tube (PMT) detector 56 (e.g., a Hamamatsu, Model 2027TM).
- PMT photo-multiplier tube
- the output signals from the PMT and the hydrophone were recorded using a high-speed digital oscilloscope 64 (e.g., from LeCroy, Chestnut Ridge, N.Y., USA) in sequence mode provided by a function generator 70 , and then transferred to a computer 62 waiting from post-processing using a MatLab program (Mathworks Inc., Natick, Wash., USA).
- a pulse generator 72 can be triggered by the function generator to produce a pulse signal applied to a phase adjuster 74 , to produce light pulses with an LED 76 that are focused by a lens 78 into volume 52 .
- FIGS. 17A and 17B graphically illustrate the response of a 1.5 ⁇ m radius bubble subject to a 2.5 MHz modified Gaussian pulse with a peak negative pressure of 0.2 MPa.
- FIG. 17A illustrates the modified Gaussian pulse is used to simulate the driving signal
- FIG. 17B illustrates typical bubble responses using the four above noted dynamic bubble models. The parameters used for the simulation are given below.
- each model appears to provide substantially similar results within a certain parameter range.
- the selected shell parameters e.g., shell viscosity q, and shell shear modulus Gs
- FIGS. 18A-18C graphically illustrate results provided by these three models with varying parameters.
- Each of the three models provides substantially the same result with appropriately selected parameters ( FIG. 18A ), whereas the simulation results become different from each other with increasing Gs (e.g., Gs>50 Mpa; FIG.
- FIG. 19B graphically illustrates that the empirically measured scatter light RT curve for a SonovueTM bubble can be fitted reasonably well to each of the four models.
- the fitted initial radius for each model converts to 1.54 ⁇ m, which agrees with the manufacturer's data.
- the fitting results can not follow the measured non-linear response, which suggests that a better model is needed in order to satisfactorily account for the non-linear response of a SonovueTM bubble.
- the SonovueTM bubble's non-linear behavior might result from the change of bubble shell parameters during its oscillation.
- SonovueTM shell parameters e.g., shear modulus Gs and shear viscosity ⁇ s , and bubble initial radius (R 0 )
- R 0 bubble initial radius
- FIGS. 20A and 20B graphically illustrate that both shell shear modulus and shear viscosity increase with increasing initial radius, which implies the shell properties of UCA bubbles are not homogeneous, and may be related the bubble size.
- FIG. 20A graphically illustrates the change of the shell shear modulus as a function of radius
- FIG. 20B graphically illustrates the change of the shell viscosity as a function of radius.
- UCA bubbles When studying multiple UCA bubbles, the analysis is more complex, concerning both optics and acoustics.
- the properties of UCA bubbles can be estimated by its distribution profile, provided by the manufacturers. The profiles can be described with a known statistics algorithm, such as Gaussian distribution, to make it simpler to model distribution of UCA bubbles, and therefore analyze the statistical characteristics of UCA bubbles.
- the statistics package Once the statistics package is determined, the properties, such as mean and variation, can be applied to the model to perform simulation.
- UCA bubbles are so small that there are about half a billion of them in a single milliliter. For OptisonTM, there are 5 ⁇ 10 8 -8 ⁇ 10 8 individual bubbles per milliliter. Since so many bubbles are involved, it is difficult to know the number of bubbles in the region of interest.
- the measured acoustic pressure may not correctly describe the actual acoustic field that activates the UCA bubbles, since the UCA cloud alters the acoustic driving field. Further, the driving pressure is attenuated inside the UCA cloud. This obvious impact is indeed observed in the measurement of acoustic pressure in the field. However, the acoustic measurement is necessary to monitor the pressure level outside the targeted UCA cloud. The pressure signals also trigger data collecting events, which means that the pressure measurement cannot be used to describe the pressure on each individual UCA bubble for modeling and data fitting, as it was in the single UCA studies described above.
- the laser beam is affected similarly, in that a mass of bubbles scatters light differently than an individual bubble.
- the UCA bubbles in the path of the laser beam are not homogeneously distributed.
- the laser beam itself is not homogeneous either, having a transverse intensity distribution. This does not impact individual UCA bubbles; however, the inhomogeneous cross-distribution of the laser beam means that a UCA bubble at the center of the laser beam encounters more light than a UCA bubble near the edge of the laser beam.
- the effective RT curves discussed above are modified, to achieve an effective RT curve.
- the effective RT curves are computed from the light scattering data, based on the assumption that each UCA bubble is separated far enough from its neighboring bubbles such that there is no attenuation to the incident light intensity on each UCA bubble. It is also assumed that the laser beam is homogeneous, which means each UCA bubble scatters laser light as if there is only one UCA bubble in the region.
- the effective scattered light intensity of the collected data combines the contributions from every bubble.
- the multiple bubble study employed an HDI 5000TM ultrasound system, which is able to operate in many modalities, including B-Mode, M-Mode and Pulse-Doppler Mode, each of which was used in the multiple bubble study.
- the HDI 5000TM system (probe) functions as an acoustic source; and, each modality features a different pulse length and central frequency. Every modality can provide either low or high power.
- the intact UCA bubbles' response to acoustic driving pulses, and the destruction of the UCA bubbles, are of great interest in revealing the UCA bubbles' properties. Since today's diagnostic ultrasound systems perform harmonic imaging with UCA bubbles mainly in a B-Mode at extremely low power, much of the data collected in the multiple bubble study were obtained using the B-Mode at a low driving power (MI).
- MI driving power
- FIG. 21B graphically illustrates the power spectrum of the UCA bubbles' response.
- the UCA cloud will scatter some of the incident acoustic beam, which will result in the attenuation of the acoustic pressure on the UCA bubbles in the path of acoustic beam.
- the UCA bubbles are not homogeneously driven, which further complicates the analysis of the collected data.
- the region of interest upon which the PMT is focused is very small, it is assumed that all the UCA bubbles are homogeneously activated. Note that as indicated in FIG. 21A , the effective expansion of the UCA bubbles is relatively small (i.e., the expansion is only about 5% of their ambient sizes).
- the harmonic response of each example is slightly different, possibly due to the difference of the specific local UCA bubbles.
- the UCA bubbles respond to the acoustic source, even though the driving pulses are very weak.
- the power spectrum reveals strong fundamental components, while a harmonic component is observed as well.
- the harmonic component can be particularly significant, as the solid line indicates.
- the fundamental frequency of the UCA bubbles' response is shifted relative to the frequency of the driving pressure, as will be noted in FIG. 21B .
- the response of the second group of UCA bubbles indicates different spectral characteristics in the power spectrum. That is, the feature of the fundamental component in the power spectrum of the UCA bubbles' response is different.
- FIG. 22 is a composite graph illustrating the power spectrum of UCA bubbles driven by different acoustic power (MI) settings, using the B-Mode.
- MI acoustic power
- the + sign refers to the middle level of MI for the HDI 5000TM system, between two consecutive defined MI settings.
- the selection of MI is based on the smallest step of power increase starting from the lowest available value, but the step is greater between the last two highest powers.
- the fundamental frequency of the bubbles' response varies.
- the fundamental component at about 2 MHz of the bubbles' response shifts to a lower frequency.
- the fundamental frequency seems to match satisfactorily (though not perfectly) the acoustic driving frequency.
- the harmonic frequency components vary based on driving power, which can be observed in both low and high power drive settings. There seems no great advantage to use higher driving power settings to generate harmonic components.
- a second harmonic frequency shift (at about 4 MHz) basically follows the trend of the fundamental frequency. When the fundamental frequency shifts toward a lower frequency, the corresponding second harmonic frequency also shifts toward a lower frequency.
- the sub-harmonic component (at about 1 MHz) can be identified in most of the examples, but the power of sub-harmonic component is very weak.
- the harmonic components at 3 MHz, 5 MHz and 7 MHz can be identified, especially for examples employing a higher driving power.
- the various examples illustrated in FIG. 22 do not suggest that the generation of harmonic components in the response of the bubbles to an acoustic driving is highly dependent on the power of operation employed during the insonification, while the bubbles are intact.
- FIGS. 23A and 23B are composites. The development of UCA bubbles during consecutive insonification in one data sequence (collection) is graphically illustrated as RT curves in FIG. 23A , and as power spectrums in FIG. 23B . Each sub-figure in the composite represents an averaged result over the duration of a consecutive activation.
- FIGS. 23A and 23B were collected with an MI of 0.05+.
- the effective radius of the UCA bubbles continues to increase during insonification.
- the magnitude of the forced oscillation builds up initially and then slows. It appears that none of the UCA bubbles were burst during the activation, because there is no significant sudden increase of effective radius that would indicate breaching of the shell.
- the fundamental frequency of responses of the UCA bubbles does not change, which suggests that there is no significant physical change to the bubbles in this area.
- the gain of ambient effective radius of the UCA bubbles in the area suggests that the increase in light scattering is primarily due to an adjustment of the spatial distribution of bubbles in the area. If the bubbles are closely packed, their expansion is limited by the proximity of neighboring bubbles. As the UCA bubbles oscillate with the acoustic wave, they also interact with one another as well, and thereby alter the spatial distribution characteristics.
- FIG. 23A the effective radius of the bubbles, after an acoustic pulse, is larger than before the acoustic pulse, although the difference is not particularly significant in these examples.
- FIG. 24 graphically illustrates data averaged over 100 consecutive pulses.
- the ambient effective radius before the acoustic pulses is about 9 ⁇ m, and the ambient effective radius after the acoustic pulses is about 9.5 ⁇ m.
- the data provide no indication that any bubbles are being ruptured, which suggests that the acoustic driving power contributes to the increase of the UCA bubbles' scattering capability. That there is no bubble destruction, or physical change in the bubbles, suggests that the change of the spatial distribution of the bubbles is the key factor in the observed increase in the light scattering capability of the UCA bubbles in the area.
- FIGS. 23A and 23B show the development of UCA bubbles during insonification at extremely low driving power. It should be noted that UCA bubbles can break even at very low acoustic power levels. As is known, when gas bubbles are released (by the breaking of a shell) and are driven by acoustic pulse, such gas bubbles can suddenly grow in size tremendously.
- FIG. 25A includes RT curves of the same group of UCA bubbles during the consecutive insonification, while FIG. 25B shows the corresponding power spectrums.
- segments 260 and 262 Four consecutive segments (UCA bubbles' response to acoustic pulses) are shown in the Figures.
- the RT curves actually reveal a change in the dynamics of the UCA bubbles, when compared with the RT curve of FIG. 20A .
- the breaking of the UCA bubbles is clearly illustrated with the sudden increase of effective radius in segments 261 and 263 .
- the breakage can also be visualized in the power spectrums of FIG. 25B .
- the fundamental, harmonic, and sub-harmonic frequencies are clearly seen in segments 260 and 262 .
- the broad increases of the power spectrum in segments 261 and 263 are symbolic of the sudden increases of the effective radius and the breakups of UCA bubbles.
- the harmonic frequency is generated by UCA bubbles responding to acoustical pressure. If the second harmonic component is sufficiently strong, the RT curve should reflect this phenomenon, which is shown in FIGS. 26A and 26B , with FIG. 26A corresponding to the RT curves, and FIG. 26B corresponding to the power spectrum.
- the waveform of the second harmonic component can clearly be observed, coupled with the fundamental frequency waveform.
- the second harmonic component is apparent.
- the power level of the second harmonic component is comparable with that of the fundamental component.
- a typical response of masses of UCA bubbles to the Pulse-Doppler Mode is graphically illustrated as an effective RT curve in FIG. 27 .
- Pulse-Doppler Mode is different than the B-Mode, in both its higher central frequency (about 2.4 MHz) and longer pulse length.
- MI acoustic driving power
- FIG. 28 graphically illustrates the corresponding power spectrum, enabling the harmonic responses of UCA bubbles to be observed when stimulated in the Pulse-Doppler Mode.
- the second harmonic power and even higher harmonic power sometimes could be very strong.
- the detailed profile varies and may reflect the specialty of the local UCA bubbles.
- the fundamental frequency component profiles resemble one another in these examples, while their details differ between data sets, as discussed above with respect to FIG. 21 (B-Mode).
- the fundamental frequency of the response of the UCA bubbles does not shift, as was observed in the B-Mode.
- FIG. 29 is a composite graphically illustrating the power spectrum of multiple UCA bubbles being driven by different acoustic power (MI) in the Pulse-Doppler Mode.
- MI acoustic power
- FIG. 30B graphically illustrates a corresponding power spectrum.
- the M-Mode features a central frequency of 2.4 MHz, with a shorter pulse length.
- MI extremely high power
- FIG. 31 is a composite image that graphically illustrates consecutive effective RT curves of a mass of UCA bubbles responding to M-Mode stimulation.
- FIG. 30B graphically illustrates a corresponding power spectrum.
- the M-Mode features a central frequency of 2.4 MHz, with a shorter pulse length
- the first acoustic pulse destroys a significant amount of UCA bubbles, and brings down the effective RT from about 28 ⁇ m, before the acoustic pulse, to about 20 ⁇ m just after. It was enlightening to note that a single pulse can indeed destroy UCA bubbles. It is also observed that the UCA bubbles oscillate with the driving pulse while they are breaking. The second acoustic pulse (segment 2 ) causes more breakage, and brings down the effective RT from about 21 ⁇ m to about 18 ⁇ m. Even though the degree of destruction decreases, the third acoustic pulse (segment 3 ) and the fourth acoustic pulse (segment 4 ) continue breaking bubbles.
- UCA bubbles have been studied mainly using acoustical methods.
- the acoustic driving source will increase the background noise in the signal corresponding to the response of the UCA bubbles.
- An intrinsic property of acoustic transducers is the band-pass filtering of detected signals (the response of the UCA bubbles), which causes the spectral characteristics outside the pass band to be lost.
- the light scattering technique discussed above has been developed. The light scattering technique disclosed herein can be used to study the properties of individual UCA bubbles, or masses of UCA bubbles, when such bubbles are driven by acoustic pulses.
- UCA bubbles are so small, it is difficult to use light scattering techniques in UCA research, because the light scattering data collected are so noisy.
- Several techniques can be used to reduce noise.
- One technique involves focusing a laser beam to increase the incident light intensity, changing the beam width from about 3 mm to about 0.2 mm in diameter, which results in a 225-times increase in the incident light power density.
- Another technique is to use a collecting lens to cover a wide angle, and to collect more scattered light.
- the SNR can also be increased using signal processing techniques in data processing, including both averaging and filtering techniques.
- Empirical data indicates that the Mie theory is valid not only for homogeneous spheres, but also for coated spheres, such as UCA bubbles. Empirical data have confirmed that the thin-shelled UCA bubbles resemble homogeneous spheres in regard to scattering light. This result facilitates the processing and modeling of the light scattering data.
- the single bubble study also illustrates that UCA bubbles oscillate with driving pulses stably, even when the driving strength is weak.
- the pulse length of the acoustic driving is longer, such as the examples with a single element transducer (HIFU transducer)
- the UCA bubble's oscillation tends to be stable when the acoustic driving pressure is stable.
- the driving strength is strong
- UCA bubbles will eventually be destroyed.
- the results from the multiple bubble study indicate that the harmonic components of UCA bubbles' response can be generated at an extremely low driving pressure. This finding indicates that harmonic components can be generated whenever bubbles are forced to oscillate. Indeed, the oscillation will be slight when the driving pressure is weak. Therefore, the SNR becomes a critical factor at relatively lower driving pressure levels. In some cases, higher harmonic components, such as second, third, and even fourth harmonic components, can be very significant, compared to the fundamental components.
- the multiple bubble study also revealed that the response of a group of UCA bubbles can be different at a low driving pressure as compared with a higher driving pressure.
- the self-resonant oscillation is comparable to the forced oscillation, so that the power spectrum of the combined oscillation of UCA bubbles is different than that of the acoustic driving pressure.
- the forced oscillation is strong, it dominates, and the power spectrum of the response of the mass of UCA bubbles resembles that of the driving pressure.
- UCA bubbles are vulnerable, and are easy to break, even at an extremely low pressure.
- a sudden increase of effective radius indicates the destruction of one or more UCA bubbles, and the release of their inner gas core.
- the corresponding power spectrum confirms this finding.
- a particularly strong acoustic driving pressure can destroy many UCA bubbles with a single pulse. The surviving bubbles are further destroyed in a second pulse. Significantly, the UCA bubbles respond to the driving pulse even while they are being destroyed.
- Such static light scattering particle sizing instruments can be modified by incorporating a pressure generator configured to induce pressure changes in a sampling volume in which the particles from which the scattered light is being collected are disposed.
- a pressure generator configured to induce pressure changes in a sampling volume in which the particles from which the scattered light is being collected are disposed.
- an ultrasound imaging probe can be inserted into the sampling volume, such that when the ultrasound imaging probe is energized, the particles in the sampling volume will experience changing pressure conditions.
- Ultrasound instruments or ultrasound transducers can be also positioned externally of, but acoustically coupled to, the sampling volume.
- a sensor configured to measure the pressure changes in the sampling volume (such as the hydrophone described above) will also be added to the existing static light scattering particle sizing instruments.
- the processing required to generate the RT curves, to fit the curves to dynamic models, and to derive shell parameters can be implemented by an additional processor, or the processor for the static light scattering particle sizing instrument can be modified (i.e., reprogrammed) to implement the additional functions.
- Yet another aspect of collecting scattered light from one or more microbubbles during changing pressure conditions is that the resulting data can be used to differentiate different types of microbubbles based on their different compressibility (as microbubbles of different compressibility will exhibit different changes in their respective diameters), because as discussed above, light scattering can be used to detect changes in diameters. Bubbles having a larger radius will scatter more light than bubbles having a smaller radius, and bubbles that are less compressible will exhibit larger radii than bubbles which are more compressible, during increased pressure conditions, enabling light scattering data to be used to differentiate microbubbles based on their compressibility.
Abstract
Description
where R0 is the initial bubble radius, ρL is the density of a Newtonian liquid, P0 is the ambient pressure, Pv is the vapor pressure, σ is the surface tension, γ is the polytropic exponent of the gas, δ is the damping coefficient, Pa is the amplitude of the incident acoustic pressure, ω is the angular frequency of driving signal, and Pg is the gas pressure inside the bubble (Pg=P0−Pv+2σ/R0).
where R is radius of the bubble, R0 is initial radius of the bubble, P0=1.01×10⁵ Pa is the ambient pressure, Pdrive(t) is the acoustic driving pressure, p=1000 kg/m3 is the liquid density, γ≈1 is the ratio of specific heats, c=1500 m/s is the sound speed in the liquid, σ=0.051 N/m2 is the surface tension coefficient, χ=0 is the shell elasticity, μ=0.001 Pa s is fluid shear viscosity, μsh is the UCA shell shear viscosity, and ε is the UCA shell thickness.
where Sp=6Gsdse(R/R0)3, and Gs is the shell shear modulus, and dse is the shell thickness. The total damping parameter is given by:
δtot=δth+δR+δη+δf (5)
and thermal damping constant is given by:
and the viscosity damping constant is given by:
where ηL is the liquid shear viscosity. The shell friction parameter is:
where ηs is the shell shear viscosity. The polytrophic exponent is:
Church's Model:
where ρs is the shell density, σ1 is the surface tension of the gas-shell interface, σ2 is the surface tension of the shell-liquid interface, PG,eq=P0 for the surface layer permeable to gas, and:
Hoff's Model:
Sarkar's Model:
This model assumes the encapsulation of a contrast agent to be an interface of infinitesimal thickness with complex interface Theological properties. The interfacial tension, σi, and dilatational viscosity κs are unknown interface and shell parameters.
P div =P 0 sin [2πf(t−t c)]exp [−π2 h 2 f 2 (t−t c)2] (17)
with tc=5 μs and h=⅓. The results indicate that each model appears to provide substantially similar results in a certain parameter range.
-
- The light scattering technique disclosed herein is an excellent tool to study UCA bubbles.
- UCA bubble dynamics are correctly modeled with various dynamic models.
- Individual UCA bubbles respond to acoustic driving pressure and undergo development during insonification.
- Both the harmonic and sub-harmonic components of the response of an individual UCA bubble can be generated when it is forced to oscillate.
- Imaging an individual UCA bubble with diagnostic ultrasound is feasible.
- The harmonic component of the response of masses of UCA bubbles can be generated when bubbles in the mass are forced to oscillate.
- Light scattering can be used to observe UCA bubbles breaking at an MI=0.04.
- Very strong acoustic pressure can destroy most UCA bubbles in a mass of bubbles in a single acoustic pulse.
Claims (26)
Priority Applications (4)
| Application Number | Priority Date | Filing Date | Title |
|---|---|---|---|
| US11/531,998 US7804595B2 (en) | 2005-09-14 | 2006-09-14 | Using optical scattering to measure properties of ultrasound contrast agent shells |
| US12/497,281 US8264683B2 (en) | 2005-09-14 | 2009-07-02 | Dynamic characterization of particles with flow cytometry |
| US13/528,016 US8441624B2 (en) | 2005-09-14 | 2012-06-20 | Dynamic characterization of particles with flow cytometry |
| US14/138,616 US20140347669A1 (en) | 2005-09-14 | 2013-12-23 | Dynamic Characterization of Particles With Flow Cytometry |
Applications Claiming Priority (2)
| Application Number | Priority Date | Filing Date | Title |
|---|---|---|---|
| US71686105P | 2005-09-14 | 2005-09-14 | |
| US11/531,998 US7804595B2 (en) | 2005-09-14 | 2006-09-14 | Using optical scattering to measure properties of ultrasound contrast agent shells |
Related Child Applications (1)
| Application Number | Title | Priority Date | Filing Date |
|---|---|---|---|
| US12/497,281 Continuation-In-Part US8264683B2 (en) | 2005-09-14 | 2009-07-02 | Dynamic characterization of particles with flow cytometry |
Publications (2)
| Publication Number | Publication Date |
|---|---|
| US20070098232A1 US20070098232A1 (en) | 2007-05-03 |
| US7804595B2 true US7804595B2 (en) | 2010-09-28 |
Family
ID=37996339
Family Applications (1)
| Application Number | Title | Priority Date | Filing Date |
|---|---|---|---|
| US11/531,998 Expired - Fee Related US7804595B2 (en) | 2005-09-14 | 2006-09-14 | Using optical scattering to measure properties of ultrasound contrast agent shells |
Country Status (1)
| Country | Link |
|---|---|
| US (1) | US7804595B2 (en) |
Cited By (10)
| Publication number | Priority date | Publication date | Assignee | Title |
|---|---|---|---|---|
| US20080208059A1 (en) * | 2005-03-11 | 2008-08-28 | Koninklijke Philips Electronics, N.V. | Microbubble Generating Technique For Phase Aberration Correction |
| US20090316151A1 (en) * | 2005-09-14 | 2009-12-24 | University Of Washington | Dynamic characterization of particles with flow cytometry |
| US8767208B2 (en) | 2006-11-03 | 2014-07-01 | Los Alamos National Security, Llc | System and method for measuring particles in a sample stream of a flow cytometer using low-power laser source |
| US8932520B2 (en) | 2007-10-24 | 2015-01-13 | Los Alamos National Security, Llc | Method for non-contact particle manipulation and control of particle spacing along an axis |
| US9074979B2 (en) | 2004-07-29 | 2015-07-07 | Los Alamos National Security, Llc | Ultrasonic analyte concentration and application in flow cytometry |
| US9645080B2 (en) | 2013-04-16 | 2017-05-09 | University Of Washington | Systems, devices, and methods for separating, concentrating, and/or differentiating between cells from a cell sample |
| US9726647B2 (en) | 2015-03-17 | 2017-08-08 | Hemosonics, Llc | Determining mechanical properties via ultrasound-induced resonance |
| US10962524B2 (en) | 2011-02-15 | 2021-03-30 | HomoSonics LLC | Characterization of blood hemostasis and oxygen transport parameters |
| US11287363B2 (en) | 2007-12-19 | 2022-03-29 | Triad National Security, Llc | Particle analysis in an acoustic cytometer |
| US11698364B2 (en) | 2018-06-27 | 2023-07-11 | University Of Washington | Real-time cell-surface marker detection |
Families Citing this family (29)
| Publication number | Priority date | Publication date | Assignee | Title |
|---|---|---|---|---|
| US6618620B1 (en) | 2000-11-28 | 2003-09-09 | Txsonics Ltd. | Apparatus for controlling thermal dosing in an thermal treatment system |
| US8088067B2 (en) * | 2002-12-23 | 2012-01-03 | Insightec Ltd. | Tissue aberration corrections in ultrasound therapy |
| US7611462B2 (en) * | 2003-05-22 | 2009-11-03 | Insightec-Image Guided Treatment Ltd. | Acoustic beam forming in phased arrays including large numbers of transducer elements |
| US7377900B2 (en) * | 2003-06-02 | 2008-05-27 | Insightec - Image Guided Treatment Ltd. | Endo-cavity focused ultrasound transducer |
| US8409099B2 (en) | 2004-08-26 | 2013-04-02 | Insightec Ltd. | Focused ultrasound system for surrounding a body tissue mass and treatment method |
| US20070016039A1 (en) * | 2005-06-21 | 2007-01-18 | Insightec-Image Guided Treatment Ltd. | Controlled, non-linear focused ultrasound treatment |
| CN101313354B (en) | 2005-11-23 | 2012-02-15 | 因赛泰克有限公司 | Hierarchical switching in ultra-high density ultrasound array |
| US8235901B2 (en) * | 2006-04-26 | 2012-08-07 | Insightec, Ltd. | Focused ultrasound system with far field tail suppression |
| US20100030076A1 (en) * | 2006-08-01 | 2010-02-04 | Kobi Vortman | Systems and Methods for Simultaneously Treating Multiple Target Sites |
| US20110021924A1 (en) * | 2007-02-09 | 2011-01-27 | Shriram Sethuraman | Intravascular photoacoustic and utrasound echo imaging |
| EP2479552B1 (en) * | 2007-04-02 | 2015-09-02 | Acoustic Cytometry Systems, Inc. | Methods for enhanced analysis of acoustic field focused cells and particles |
| US8083068B2 (en) | 2007-04-09 | 2011-12-27 | Los Alamos National Security, Llc | Apparatus for separating particles utilizing engineered acoustic contrast capture particles |
| US7837040B2 (en) * | 2007-04-09 | 2010-11-23 | Los Alamos National Security, Llc | Acoustic concentration of particles in fluid flow |
| US8251908B2 (en) * | 2007-10-01 | 2012-08-28 | Insightec Ltd. | Motion compensated image-guided focused ultrasound therapy system |
| US8528406B2 (en) * | 2007-10-24 | 2013-09-10 | Los Alamos National Security, LLP | Method for non-contact particle manipulation and control of particle spacing along an axis |
| US8714014B2 (en) * | 2008-01-16 | 2014-05-06 | Life Technologies Corporation | System and method for acoustic focusing hardware and implementations |
| US8425424B2 (en) | 2008-11-19 | 2013-04-23 | Inightee Ltd. | Closed-loop clot lysis |
| US20100179425A1 (en) * | 2009-01-13 | 2010-07-15 | Eyal Zadicario | Systems and methods for controlling ultrasound energy transmitted through non-uniform tissue and cooling of same |
| US8617073B2 (en) * | 2009-04-17 | 2013-12-31 | Insightec Ltd. | Focusing ultrasound into the brain through the skull by utilizing both longitudinal and shear waves |
| WO2010143072A1 (en) * | 2009-06-10 | 2010-12-16 | Insightec Ltd. | Acoustic-feedback power control during focused ultrasound delivery |
| US9623266B2 (en) * | 2009-08-04 | 2017-04-18 | Insightec Ltd. | Estimation of alignment parameters in magnetic-resonance-guided ultrasound focusing |
| US9177543B2 (en) | 2009-08-26 | 2015-11-03 | Insightec Ltd. | Asymmetric ultrasound phased-array transducer for dynamic beam steering to ablate tissues in MRI |
| EP2489034B1 (en) | 2009-10-14 | 2016-11-30 | Insightec Ltd. | Mapping ultrasound transducers |
| US8932237B2 (en) | 2010-04-28 | 2015-01-13 | Insightec, Ltd. | Efficient ultrasound focusing |
| US9852727B2 (en) | 2010-04-28 | 2017-12-26 | Insightec, Ltd. | Multi-segment ultrasound transducers |
| US9981148B2 (en) | 2010-10-22 | 2018-05-29 | Insightec, Ltd. | Adaptive active cooling during focused ultrasound treatment |
| AU2012326218B2 (en) | 2011-10-17 | 2017-03-09 | Butterfly Network, Inc. | Transmissive imaging and related apparatus and methods |
| US9667889B2 (en) | 2013-04-03 | 2017-05-30 | Butterfly Network, Inc. | Portable electronic devices with integrated imaging capabilities |
| JP6480210B2 (en) * | 2014-02-28 | 2019-03-06 | アークレイ株式会社 | Plasma generating chip, plasma generating apparatus, and plasma spectroscopic analysis method |
Citations (2)
| Publication number | Priority date | Publication date | Assignee | Title |
|---|---|---|---|---|
| US6423007B2 (en) * | 1998-05-26 | 2002-07-23 | Riverside Research Institute | Ultrasonic systems and methods for contrast agent concentration measurement |
| US7374744B2 (en) * | 1994-09-28 | 2008-05-20 | Imcor Pharmaceutical Co. | Harmonic ultrasound imaging with microbubbles |
-
2006
- 2006-09-14 US US11/531,998 patent/US7804595B2/en not_active Expired - Fee Related
Patent Citations (2)
| Publication number | Priority date | Publication date | Assignee | Title |
|---|---|---|---|---|
| US7374744B2 (en) * | 1994-09-28 | 2008-05-20 | Imcor Pharmaceutical Co. | Harmonic ultrasound imaging with microbubbles |
| US6423007B2 (en) * | 1998-05-26 | 2002-07-23 | Riverside Research Institute | Ultrasonic systems and methods for contrast agent concentration measurement |
Non-Patent Citations (25)
| Title |
|---|
| Allen et al., "Dynamics of therapeutic ultrasound contrast agents." Ultrasound in Medicine and Biology vol. 28, No. 6: 805-816, 2002. |
| Barber, Bradley P., and Seth J. Putterman. "Light Scattering Measurements of the Repetitive Supersonic Implosion of a Sonoluminescing Bubble" Physical Review Letters, vol. 69, No. 26. Dec. 28, 1992. pp. 3839-3842. |
| Church, Charles C. "The effects of an elastic solid surface layer on the radial pulsations of gas bubbles" J. Acoust. Soc. Am. 97 (3), Mar. 1995. pp. 1510-1521. |
| Dayton et al., "Optical and acoustical observation of the effects of ultrasound on contrast agents." IEEE Transactions on Ultrasonics, Ferroelectrics, and Frequency Control vol. 46, No. 1: 220-232, 1999. |
| de Jong et al., "Higher harmonics of vibrating gas-filled microspheres. Part one: Simulation." Ultrasonics vol. 32, No. 6: 447-452, 1994. |
| de Jong et al., "Higher harmonics of vibrating gas-filled microspheres. Part two: Measurements." Ultrasonics vol. 32, No.6: 455-458, 1994. |
| de Jong, N., and L. Hoff. "Ultrasound scattering properties of Albunex microspheres" Ultrasonics vol. 31, No. 3. 1993. pp. 175-181. |
| Forsberg et al., "Effect of filling gasses on the backscattering from contrast microbubbles: Theory and in vivo measurements." Ultrasound in Medicine and Biology vol. 25, No. 8: 1203-1211. 1999. |
| Guan et al., "Using light-scattering to measure the response of individual ultrasound contrast microbubbles subjected to pulsed ultrasound in vitro." Journal of the Acoustical Society of America vol. 116, No. 5: 2832-2842, 2004. |
| Hansen, Gary M. "Mie scattering as a technique for the sizing of air bubbles" Applied Optics vol. 24, No. 19. Oct. 1, 1985. pp. 3214-3220. |
| Hoff, Lars, Per C. Sontum, and Jens M. Hovern. "Oscillations of polymeric microbubbles: Effect of the encapsulating shell" J. Acoust. Soc. Am. 107 (4), Apr. 2000. pp. 2272-2280. |
| Holt, Glynn R., and Lawrence A. Crum. "Mie scattering used to determine spherical bubble oscillations" Applied Optics vol. 29, No. 28. Oct. 1, 1990. pp. 4182-4191. |
| Khismatullin, Damir B., and Ali Nadim. "Radial oscillations of encapsulated microbubbles in viscoelastic liquids" Physics of Fluids vol. 14, No. 10. Oct. 2002. pp. 3534-3557. |
| Langley, Dean S., and Philip L. Marston. "Critical-angle scattering of laser light from bubbles in water: measurements, models, and application to sizing of bubbles" Applied Optics vol. 23, No. 7. Apr. 1, 1984. pp. 1044-1054. |
| Marsh, Jon N., Michael S. Hughes, Gary H. Brandenburger, and James G. Miller. "Broadband Measurement of the Scattering-to-Attenuation Ratio for Albunex at 37° C." Ultrasound in Med. & Biol. vol. 25, No. 8. 1999. pp. 1321-1324. |
| Marston, Philip L., Stuart C. Billette, and Cleon E. Dean. "Scattering of light by a coated bubble in water near the critical and Brewster scattering angles" SPIE vol. 925 Ocean Optics IX. 1988. pp. 308-316. |
| Moran, Carmel M., T. Anderson, S.D. Pye, V. Sboros, and W.N. McDicken. "Quantification of Microbubble Destruction of Three Fluorocarbon-Filled Ultrasonic Contrast Agents" Ultrasound in Med. & Biol. vol. 26, No. 4. 2000. pp. 629-639. |
| Morgan, Karen E., John S. Allen, Paul A. Dayton, James E. Chomas, Alexander L. Klibanov, and Katherine W. Ferrara. "Experimental and Theoretical Evaluation of Microbubble Behavior: Effect of Transmitted Phase and Bubble Size" IEEE Transactions on Ultrasonics, Ferroelectrics, and Frequency Control. vol. 47, No. 6. Nov. 2000. pp. 1494-1509. |
| Postema et al., "Ultrasound-induced encapsulated microbubble phenomena." Ultrasound in Medicine and Biology vol. 30, No. 6: 827-840, 2004. |
| Sboros, V., K.V. Ramnarine, C.M. Moran, S.D. Pye, and W.N. McDicken. "Understanding the limitations of ultrasonic backscatter measurements from microbubble populations" Phys. Med. Biol. 47. 2002. pp. 4287-4299. |
| Shi, William T., and Flemming Forsberg. "Ultrasonic Characterization of the Nonlinear Properties of Contrast Microbubbles" Ultrasound in Med. & Biol. vol. 26, No. 1. 2000. pp. 93-104. |
| Van der Meer et al., "Microbubble spectroscopy of ultrasound contrast agents." Journal of the Acoustical Society of America vol. 121, No. 1: 648-656, 2007. |
| Wen-Shiang Chen, Thomas J. Matula, Lawrence A. Crum, The disappearance of ultrasound contrast bubbles: observations of bubble dissolution and cavitation nucleation, Ultrasound in Medicine & Biology, vol. 28, Issue 6, Jun. 2002, pp. 793-803, ISSN 0301-5629, DOI: 10.1016/S0301-5629(02)00517-3. (http://www.sciencedirect.com/science/article/B6TD2-4. * |
| Wolfrum, B., R. Mettin, T. Kurz, and W. Lauterborn. "Observations of pressure-wave-excited contrast agent bubbles in the vicinity of cells" Applied Physics Letters vol. 81, No. 26. Dec. 23, 2002. pp. 5060-5062. |
| Zhang, Dong, Xiu-Fen Gong, Jie-Hui Liu, Li-Zheng Shao, Xiao-Rong Li, and Qing-Lang Zhang. "The Experimental Investigation of Ultrasonic Properties for a Sonicated Contrast Agent and its Application in Biomedicine" Ultrasound in Med. & Biol. vol. 26, No. 2. 2000. pp. 347-351. |
Cited By (21)
| Publication number | Priority date | Publication date | Assignee | Title |
|---|---|---|---|---|
| US9074979B2 (en) | 2004-07-29 | 2015-07-07 | Los Alamos National Security, Llc | Ultrasonic analyte concentration and application in flow cytometry |
| US10537831B2 (en) | 2004-07-29 | 2020-01-21 | Triad National Security, Llc | Ultrasonic analyte concentration and application in flow cytometry |
| US20080208059A1 (en) * | 2005-03-11 | 2008-08-28 | Koninklijke Philips Electronics, N.V. | Microbubble Generating Technique For Phase Aberration Correction |
| US9022939B2 (en) * | 2005-03-11 | 2015-05-05 | Koninklijke Philips N.V. | Microbubble generating technique for phase aberration correction |
| US20090316151A1 (en) * | 2005-09-14 | 2009-12-24 | University Of Washington | Dynamic characterization of particles with flow cytometry |
| US8264683B2 (en) * | 2005-09-14 | 2012-09-11 | University Of Washington | Dynamic characterization of particles with flow cytometry |
| US8441624B2 (en) | 2005-09-14 | 2013-05-14 | University Of Washington | Dynamic characterization of particles with flow cytometry |
| US8767208B2 (en) | 2006-11-03 | 2014-07-01 | Los Alamos National Security, Llc | System and method for measuring particles in a sample stream of a flow cytometer using low-power laser source |
| US9494509B2 (en) | 2006-11-03 | 2016-11-15 | Los Alamos National Security, Llc | System and method for measuring particles in a sample stream of a flow cytometer using low-power laser source |
| US8932520B2 (en) | 2007-10-24 | 2015-01-13 | Los Alamos National Security, Llc | Method for non-contact particle manipulation and control of particle spacing along an axis |
| US11287363B2 (en) | 2007-12-19 | 2022-03-29 | Triad National Security, Llc | Particle analysis in an acoustic cytometer |
| US11287362B2 (en) | 2007-12-19 | 2022-03-29 | Triad National Security, Llc | Particle analysis in an acoustic cytometer |
| US11680940B2 (en) | 2011-02-15 | 2023-06-20 | Hemosonics Llc | Characterization of blood hemostasis and oxygen transport parameters |
| US10962524B2 (en) | 2011-02-15 | 2021-03-30 | HomoSonics LLC | Characterization of blood hemostasis and oxygen transport parameters |
| US9645080B2 (en) | 2013-04-16 | 2017-05-09 | University Of Washington | Systems, devices, and methods for separating, concentrating, and/or differentiating between cells from a cell sample |
| US10794827B2 (en) | 2013-04-16 | 2020-10-06 | University Of Washington | Methods for separating, concentrating, and/or differentiating between cells from a cell sample |
| US9726647B2 (en) | 2015-03-17 | 2017-08-08 | Hemosonics, Llc | Determining mechanical properties via ultrasound-induced resonance |
| US11002712B2 (en) | 2015-03-17 | 2021-05-11 | Hemosonics Llc | Determining mechanical properties via ultrasound-induced resonance |
| US11656206B2 (en) | 2015-03-17 | 2023-05-23 | Hemosonics Llc | Determining mechanical properties via ultrasound-induced resonance |
| US10495613B2 (en) | 2015-03-17 | 2019-12-03 | Hemosonics, Llc | Determining mechanical properties via ultrasound-induced resonance |
| US11698364B2 (en) | 2018-06-27 | 2023-07-11 | University Of Washington | Real-time cell-surface marker detection |
Also Published As
| Publication number | Publication date |
|---|---|
| US20070098232A1 (en) | 2007-05-03 |
Similar Documents
| Publication | Publication Date | Title |
|---|---|---|
| US7804595B2 (en) | Using optical scattering to measure properties of ultrasound contrast agent shells | |
| US8441624B2 (en) | Dynamic characterization of particles with flow cytometry | |
| Ammi et al. | Ultrasonic contrast agent shell rupture detected by inertial cavitation and rebound signals | |
| Frinking et al. | Scattering properties of encapsulated gas bubbles at high ultrasound pressures | |
| Tu et al. | Microbubble sizing and shell characterization using flow cytometry | |
| Guan et al. | Using light scattering to measure the response of individual ultrasound contrast microbubbles subjected to pulsed ultrasound in vitro | |
| Sun et al. | High-frequency dynamics of ultrasound contrast agents | |
| Sojahrood et al. | Pressure dependence of the ultrasound attenuation and speed in bubbly media: Theory and experiment | |
| Hodnett et al. | Measurement techniques in power ultrasonics | |
| Biagi et al. | Stable and transient subharmonic emissions from isolated contrast agent microbubbles | |
| Palanchon et al. | Subharmonic and ultraharmonic emissions for emboli detection and characterization | |
| Chen et al. | Ultrasound contrast agent behavior near the fragmentation threshold | |
| Efthymiou et al. | The effect of resonance on transient microbubble acoustic response: Experimental observations and numerical simulations | |
| Emmer et al. | Radial modulation of single microbubbles | |
| De Jong et al. | Characteristics of contrast agents and 2D imaging | |
| Palanchon et al. | New technique for emboli detection and discrimination based on nonlinear characteristics of gas bubbles | |
| Leighton | A strategy for the development and standardisation of measurement methods for high power/cavitating ultrasonic fields: review of cavitation monitoring techniques | |
| Kothapalli et al. | Unique pumping-out fracturing mechanism of a polymer-shelled contrast agent: an acoustic characterization and optical visualization | |
| Zheng et al. | Predicting backscatter characteristics from micron-and submicron-scale ultrasound contrast agents using a size-integration technique | |
| Sun et al. | Observation of contrast agent response to chirp insonation with a simultaneous optical-acoustical system | |
| JP2007301286A (en) | Bubble detector | |
| Gong et al. | Subharmonic and ultraharmonic emissions based on the nonlinear oscillation of encapsulated microbubbles in ultrasound contrast agents | |
| Leithem et al. | Estimating concentration of ultrasound contrast agents with backscatter coefficients: Experimental and theoretical aspects | |
| Chin et al. | Investigation of the effects of microbubble shell disruption on population scattering and implications for modeling contrast agent behavior | |
| Biagi et al. | Transient subharmonic and ultraharmonic acoustic emission during dissolution of free gas bubbles |
Legal Events
| Date | Code | Title | Description |
|---|---|---|---|
| AS | Assignment |
Owner name: UNIVERSITY OF WASHINGTON, WASHINGTON Free format text: ASSIGNMENT OF ASSIGNORS INTEREST;ASSIGNOR:MATULA, THOMAS;REEL/FRAME:018346/0432 Effective date: 20060925 |
|
| AS | Assignment |
Owner name: UNIVERSITY OF WASHINGTON, WASHINGTON Free format text: ASSIGNMENT OF ASSIGNORS INTEREST;ASSIGNOR:GUAN, JINGFENG;REEL/FRAME:018352/0437 Effective date: 20060925 |
|
| AS | Assignment |
Owner name: NATIONAL INSTITUTES OF HEALTH (NIH), U.S. DEPT. OF Free format text: EXECUTIVE ORDER 9424, CONFIRMATORY LICENSE;ASSIGNOR:UNIVERSITY OF WASHINGTON;REEL/FRAME:021533/0198 Effective date: 20060926 |
|
| AS | Assignment |
Owner name: NATIONAL INSTITUTES OF HEALTH (NIH), U.S. DEPT. OF Free format text: CONFIRMATORY LICENSE;ASSIGNOR:UNIVERSITY OF WASHINGTON / CENTER FOR COMMERCIALIZATION;REEL/FRAME:027112/0365 Effective date: 20110913 |
|
| FPAY | Fee payment |
Year of fee payment: 4 |
|
| FEPP | Fee payment procedure |
Free format text: MAINTENANCE FEE REMINDER MAILED (ORIGINAL EVENT CODE: REM.) |
|
| LAPS | Lapse for failure to pay maintenance fees |
Free format text: PATENT EXPIRED FOR FAILURE TO PAY MAINTENANCE FEES (ORIGINAL EVENT CODE: EXP.); ENTITY STATUS OF PATENT OWNER: SMALL ENTITY |
|
| STCH | Information on status: patent discontinuation |
Free format text: PATENT EXPIRED DUE TO NONPAYMENT OF MAINTENANCE FEES UNDER 37 CFR 1.362 |