US7660200B2 - Method for coherence-filtering of acoustic array signal - Google Patents
Method for coherence-filtering of acoustic array signal Download PDFInfo
- Publication number
- US7660200B2 US7660200B2 US11/376,070 US37607006A US7660200B2 US 7660200 B2 US7660200 B2 US 7660200B2 US 37607006 A US37607006 A US 37607006A US 7660200 B2 US7660200 B2 US 7660200B2
- Authority
- US
- United States
- Prior art keywords
- data
- signal data
- coherence
- signal
- wave
- Prior art date
- Legal status (The legal status is an assumption and is not a legal conclusion. Google has not performed a legal analysis and makes no representation as to the accuracy of the status listed.)
- Active, expires
Links
Images


Classifications
-
- G—PHYSICS
- G01—MEASURING; TESTING
- G01V—GEOPHYSICS; GRAVITATIONAL MEASUREMENTS; DETECTING MASSES OR OBJECTS; TAGS
- G01V1/00—Seismology; Seismic or acoustic prospecting or detecting
- G01V1/28—Processing seismic data, e.g. analysis, for interpretation, for correction
- G01V1/36—Effecting static or dynamic corrections on records, e.g. correcting spread; Correlating seismic signals; Eliminating effects of unwanted energy
- G01V1/364—Seismic filtering
-
- G—PHYSICS
- G01—MEASURING; TESTING
- G01V—GEOPHYSICS; GRAVITATIONAL MEASUREMENTS; DETECTING MASSES OR OBJECTS; TAGS
- G01V2210/00—Details of seismic processing or analysis
- G01V2210/20—Trace signal pre-filtering to select, remove or transform specific events or signal components, i.e. trace-in/trace-out
Definitions
- the present invention relates to a method and system of filtering signal data. More specifically, the present invention relates to a method and system for analyzing signal data collected by an array of receivers, determining the coherence function of the received data, and filtering the received raw data with the coherence function.
- Data collection arrays i.e. a collection of more than one single position point data recorders, are used in the collection of a myriad of data.
- array collected data include radar, seismic, acoustic, sonar, radio waves, to name but a few.
- the data received and recorded by such arrays can include unwanted signals that intermingle with the desired data and distort the final recordings thereby providing skewed results.
- the time lag between signals of the individual recorders is especially important. While the recorded data can be processed and filtered to remove the noise and to extract information from the time lag, there still exists room for significant improvement in processing such data.
- acoustic signals that travel along the formation are often contaminated by other acoustic waves that travel along a different path.
- acoustic waves may travel long the tool body (drill collar) and significantly interfere with the formation signals.
- acoustic waves transmission along the casing may become significant if the casing is poorly bonded with cement. Moreover, this wave transmission may become overwhelmingly large if the casing is detached from cement (i.e., the free-pipe situation).
- the present method disclosed herein involves a method of waveform processing technique utilizing signal coherence of the array data for processing signals having poor signal-to-noise ratio.
- Raw waveform data is first transformed into f-k (frequency-wavenumber) domain.
- a coherence function is then calculated and convolved with the data in the f-k domain, which effectively suppresses non-coherent signals in the data.
- the unwanted part is muted and the wanted part is retained and inverse-transformed to yield the coherence-filtered array waveform data.
- small signals that are hidden in the original data are extracted with much enhanced coherence. Subsequent processing of the data yields reliable information about formation acoustic property.
- the present invention includes a method of processing signal data comprising, obtaining signal data, obtaining a coherence function relating to the signal data, and filtering the signal data with the coherence function thereby producing coherence filtered data.
- the signal data comprises, among other data, downhole acoustic data.
- the filtering of the present method can be performed in the frequency-wavenumber domain.
- the method of can further comprise suppressing unwanted signals from the coherence filtered wave data as well as optionally further comprising converting the coherence filtered wave data into the time domain.
- the step of obtaining signal data comprises, creating a seismic signal within a wellbore casing and recording the resulting wave propagating through the casing.
- the signal data may comprise an array of propagating wave signals.
- the present invention disclosed herein may also include a data analysis system comprising, a transducer array having an array of transducers, and a data processor in communication with the array.
- the array is capable of receiving raw data that is communicated to the processor, wherein the processor calculates a coherence function relating to the raw data and filters the raw data with the coherence function to produce coherence filtered data.
- a downhole sonde on which the array is affixed.
- the data analysis system may further comprise a field truck in communication with the sonde.
- the processor may be housed within the field truck and may be in communication with the field truck.
- the array of the data analysis system can comprise a surface mounted instrument.
- the surface mounted instrument can comprise an accelerometer.
- the data analysis system can further comprise a drilling system comprising a drill string and a drill bit. The array may be disposed on the drill string or optionally on the drill bit.
- FIG. 1 illustrates a flowchart of an embodiment of a method of filtering raw data.
- FIG. 2 a demonstrates a collection of signal data in the time domain collected by a recorder array.
- FIG. 2 b depicts raw data transformed into the f-k plane.
- FIG. 2 c shows filtered data in the f-k plane.
- FIG. 2 d illustrates the convolved f-k data of FIGS. 2 b and 2 c.
- FIG. 2 e shows coherence-filtered data in the time domain.
- FIG. 3 a demonstrates a free pipe model.
- FIG. 3 b is a depiction of modeled data.
- FIG. 3 c shows a plot of the results of a direct semblance calculation as performed on the data of FIG. 3 b.
- FIG. 3 d illustrates the coherence-filtered formation signal f-k spectrum for the P-wave slowness range of FIG. 3 b.
- FIG. 3 e are plots of an inverse f-k transformation of the data of FIG. 3 d.
- FIG. 3 f is a plot of the semblance calculation of the filtered data of FIG. 3 e.
- FIG. 4 demonstrates a comparison of raw versus filtered cased hole acoustic data.
- FIG. 5 compares raw data to filtered data in combination with a correlogram.
- FIG. 6 depicts an embodiment of a data collection system for use with the present method.
- FIG. 7 illustrates an alternative embodiment of a data collection system for use with the present method.
- Disclosed herein is a method of processing signals that may have poor signal-to-noise ratio. This is required so that useful information can be extracted from the signals that would otherwise be deemed unusable by conventional means. While this may be present itself in multiple situations, poor signal-to-noise ratio scenarios are frequently encountered in acoustic logging practice. For example, cased-hole acoustic data logged in free-pipe are often abandoned because the formation signals are usually untraceable due to the presence of predominant casing signals.
- the disclosed method is not limited to acoustic logging applications; it can generally be applied to any array data that comprise propagation wave signals.
- the wave signal array data may comprise seismic waves recorded at different depth levels in a Vertical Seismic Profiling (VSP) survey, or the seismic waves recorded by a geophone array in a surface seismic survey.
- VSP Vertical Seismic Profiling
- the signals may be the earthquake-generated seismic waves recoded at different stations/observatories.
- the wave signals may also be the electromagnetic waves recorded by a sensor array, for example, radar waves recorded by an array of antennas.
- the coherence-filtering technique disclosed herein significantly improves the situation of a poor signal-to-noise ratio.
- coherence-filtering outperforms other currently known techniques.
- the processing technique described herein allows for the acquisition of formation properties through poorly bonded well casing that are unobtainable by conventional techniques.
- the technique disclosed herein has produced several important applications in acoustic logging data processing.
- the present disclosure describes a coherence-filtering technique to significantly enhance the coherence of signal events.
- this technique is especially advantageous when the signals are masked by other overwhelming waves or noises and thus have a poor signal-to-noise ratio.
- the filtering process is performed in the frequency-wavenumber (commonly known as f-k) domain.
- the technique employs a coherence filter constructed from the coherence function of the array wave data.
- non-coherent noises are suppressed and the coherence of the wanted signal(s) is enhanced and can further be separated by either muting the unwanted (coherent) signals or passing the wanted signal(s) in the f-k domain.
- FIG. 1 illustrates an embodiment of the present invention directed to signal processing of acoustic signals received downhole.
- the acoustic wave time series X(t), where t represents time is recorded by an array of receivers equally spaced along the borehole z-axis (step 100 ).
- the wave data in essence are a two-dimensional function of z and t, denoted as X(z,t).
- a very useful property of the f-k transform is that a linear moveout of slowness s for a wave signal in the z-t domain corresponds to a linear trend of the wave energy that can be traced to the center of the f-k plane, where k and f are respectively the horizontal and vertical coordinate of the rectangular coordinate system in the f-k plane. This property allows for delineating the moveout and dispersion (i.e., change of wave slowness or velocity with frequency) characteristics of the waveform data in a receiver array.
- the energy density of various wave modes may be closely clustered and smeared by noise, making it difficult to distinguish data trends of the wave modes.
- the receiver array length typically 3.5 ft or 1.07 m
- the receiver array length is usually not long enough to allow waves of different moveouts to separate in time and space.
- k Nyquist 2 ⁇ ⁇ 2 ⁇ d ( 2 )
- d receiver spacing
- k Nyquist is only 6.28/ft.
- aliasing usually occurs at higher frequencies.
- the aliased data may overlay with the clustered/noise-smeared f-k data, aggravating the problem.
- the spatial aliasing effects of a wave mode can be alleviated or avoided by applying time shifts in the array data of the wave mode (step 102 ).
- the shifted wave signal will then have almost no moveout in the array and, by applying the f-k transform to the data (step 106 ), its trend (or energy density contour) in the f-k plane will have an infinite slope. In other words, the data trend will lie on, or very close to, the frequency axis, and will therefore not be aliased in the f-k plane.
- this technique has been developed to better delineate data trends in the f-k domain than the straightforward f-k transform.
- the mathematical basis of the coherence-filtering technique is to approximate the spectral array data, as obtained by Fourier-transforming the acoustic wave traces, by a number of propagation wave modes,
- M ( ⁇ 1) is the total of wave modes in array
- a p , k p ⁇ s p
- s p are respectively the spectral amplitude, wavenumber, and slowness of the pth wave mode.
- step 104 the question is posed if the data is comprised of a single wave mode or multiple wave mode. If the array data is comprised primarily of a single wave mode (e.g., in dipole acoustic logging, the dipole-flexural wave is the only mode that dominates the data.), then a single-mode coherence function can be constructed in the f-k domain (step 110 ), as given by (Tang and Cheng, 2004):
- Equation (5) is essentially a semblance/coherence stacking of the array data in the f-k domain. A property of the coherence function defined in equation (5) is that it is mainly applicable for single-mode data.
- the coherence will be biased toward the dominant wave mode that has the highest amplitude or coherence, resulting in underestimating the contribution from other wave modes. Nevertheless, this property, if properly used, can significantly enhance the coherence of a designated wave mode.
- a multiple-mode coherence function should be used (step 108 ).
- Equation (7) is called forward prediction because the receiver whose data is being predicted is ahead of the receiver(s) whose data are used to predict. To in crease data redundancy, the complex conjugate of equation (4) is taken and then combined with equation (6) to yield another prediction:
- the (dimensionless) modulus of the function inside ⁇ is large and the coherence function value is low; the function approaches zero if k is far away from k p . Therefore, the high-value region of the coherence function effectively delineates the trajectories/trends of the coherent part of the data in the f-k plane, especially when the data contain several propagation modes.
- the data coherence function as computed from equation (5) (single mode) or equation (9) (multiple mode), versus the data energy density, as obtained from the direct f-k transform (equation (1)).
- the f-k data density reflects the wave energy distribution in the f-k plane.
- a region with high energy density may not necessarily mean that the data there is coherent.
- the coherence function is a measure of data coherence in the f-k plane. Even in regions where the data energy density is low, the coherence function value can still be quite significant as long as the data are coherent in these regions. (An example of comparing the wave energy density and coherence is given in FIG. 2 b and FIG. 2 c .) Therefore, the data coherence function, compared to the data energy density, can better delineate data trends in the f-k domain.
- a coherence-filtering processing can be performed (step 114 ).
- a property of (two-dimensional) Fourier transform filtering or convolving the data X(z,t) in the z-t domain with a filter (the coherence filter) is equivalent to multiplying the f-k transformed data X(k, ⁇ ) with the filter's f-k spectrum in the f-k domain.
- step 116 further processing can be done to reject/suppress unwanted signals.
- the dominant ringing casing waves are very coherent and should be suppressed in order to pick the formation signal of much smaller amplitude.
- the condition for separating the wanted from unwanted signals is that they should have distinctively different propagation velocity (or slowness) values. For formations with intermediate and slow velocities, this condition is satisfied. For instance, if the formation slowness is greater than 80 ⁇ s/ft, as compared to the typical casing slowness 57 ⁇ s/ft, then the casing waves can be effectively suppressed (step 118 ).
- the first is a data rejection method that uses a known fan-filtering technique in the f-k plane (e.g., Yilmaz, 1987) (step 120 ).
- the fan-shaped region is bounded by two (left and right) lines originating from the center of the f-k plane. This region should cover the data trend of the unwanted signal (step 124 ).
- the slowness value can be set to ⁇ 20 ⁇ s/ft for the left line, and 20 ⁇ s/ft for the right line. Then, rejecting the data by muting the value of X cfil (k, ⁇ ) within the fan suppresses the unwanted casing signal.
- the second method to suppress the unwanted wave signals is a data passing method (step 122 ).
- This method needs to have a rough estimate of the propagation slowness of the wanted wave signal.
- the slowness in equation (3) is used to shift the data and then transform the data to f-k domain.
- the data trend of the wanted signal should now lie in the vicinity of the frequency axis. Because now only one signal is involved, the single-mode coherence function (equation (5)) can be used to filter the data in a fan-shaped region surrounding the frequency axis.
- the slowness corresponding to the left and right lines of the fan can be set to ⁇ 30 ⁇ s/ft and 30 ⁇ s/ft, respectively.
- the X cfil (k, ⁇ ) data in the fan primarily contains only one signal and the signal coherence should be much enhanced. Then passing the data in the fan and muting the data outside the fan yields the wanted signal.
- the coherence-filtered f-k spectral data X cfil (k, ⁇ ), either with or without the fan-filtering, are inverse-transformed back in to z-t domain to obtain the coherence-filtered array waveform data, as given by (step 126 ):
- X cfil ⁇ ( z , t ) ⁇ ⁇ X cfil ⁇ ( k , ⁇ ) ⁇ e i ⁇ ( kz - ⁇ ⁇ ⁇ t ) ⁇ d k ⁇ d ⁇ ( 11 ) If time shifts, as given in equation (3), were applied to advance the receiver waveform data prior to transforming the data to f-k domain, the same time shifts should now be applied to delay the filtered data so as to restore the original time position of the wave data (step 128 ). The resulting array data for one array location in depth can then be output (step 130 ) for being processed/analyzed to extract formation acoustic properties for that depth.
- FIGS. 2 a - 2 e demonstrate the coherence filtering procedure using a field dipole data example.
- the data were recorded by a wireline dipole acoustic logging tool.
- the tool consists of a dipole transmitter and an array of receivers that are located about 10 ft above the transmitter and aligned longitudinally along the tool.
- FIG. 2 a is a graphical depiction of raw low-frequency dipole array acoustic data recorded by an array of equally spaced acoustic receivers. This data can also be referred to as received data or a received signal.
- the ordinate represents time and the abscissa represents the distance between the dipole source transmitter and the receivers. Significant noise contamination can be seen from the wave reverberations in the raw data of the near receivers.
- FIG. 2 b The corresponding f-k spectrum is shown in FIG. 2 b where several closely clustered events are exhibited. Since the aliasing effect does not occur for this low-frequency data, no time-shifts were applied to the waveform data before the f-k transform.
- FIG. 2 c shows the resulting plot by applying the coherence function to single-mode scenario of the raw data (equation (5)). As can be seen by comparing the plots of FIGS. 2 b and 2 c , the f-k coherence plot shows a defined data trend unlike the raw f-k data.
- FIG. 2 d illustrates the convolved f-k data of FIGS. 2 b and 2 c . Converting the f-k data of FIG.
- FIG. 3 uses simulated array acoustic data to demonstrate the ability of coherence filtering to extract formation signals through an unbonded casing. This is a free pipe situation with a 0.25-cm thick fluid annulus behind the casing.
- FIG. 3 a illustrates a free-pipe model used to create the array acoustic data and
- FIG. 3 b contains the corresponding modeled data.
- the data of FIG. 3 b is in the time domain, with the ordinate in time units and the abscissa in distance units.
- the data shows strong ringing casing waves with almost no discernible formation arrivals.
- a direct semblance calculation was performed on the data of FIG. 3 b and plotted in FIG. 3 c .
- FIG. 3 d illustrates the coherence-filtered formation signal f-k spectrum for the P-wave slowness range of FIG. 3 b .
- the wave data were shifted using its slowness (102 ⁇ s/ft) so that the data almost lie on the frequency axis.
- Note the bottom event of FIG. 3 d represents the Stoneley-wave energy that falls into the data pass region (the fan filter) and the upper two events belong to the formation P wave.
- the plots of FIG. 3 e are obtained by inverse f-k transforming the data of FIG. 3 d . These plots depict formation P wave plus a low-frequency Stoneley.
- subsequent semblance calculation of the filtered data of FIG. 3 e shows a well-defined formation arrival at 102 ⁇ s/ft.
- the semblance of the formation wave is much enhanced compared to that of the unfiltered data.
- This result points out a useful property of the f-k coherence-filtering technique.
- the unwanted casing wave may not be completely removed from the data of FIG. 3 d due to short array and sparse spatial sampling, the coherence of the unwanted wave is largely eliminated. It is eliminated from both from the f-k data spectrum and from the space-time domain semblance correlogram.
- FIG. 4 uses a field data example to demonstrate the ability of the coherence-filtering technique to extract formation slowness from cased hole acoustic data, even in the free-pipe situation.
- the acoustic data, shown in the Raw Data track include several scenarios: good cement bond (middle), poor cement bond (lower), and poor bond/free pipe (upper).
- the data in the upper free-pipe sections are dominated by casing signals, resulting in inability to pick formation slowness from the semblance correlogram, which is shown in the Correlogram (raw data) track.
- coherence filtering the data suppresses the casing signals and enhances the formation wave coherence.
- the enhanced coherence enables picking the formation slowness with high confidence even in the free pipe situation (Correlogram (filtered data)).
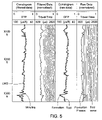
- FIG. 5 demonstrates the advantages of coherence filtering for logging while drilling (LWD) acoustic data for suppressing tool-wave effects.
- LWD acoustic data is often contaminated by tool waves that travel along an associated drill collar.
- the tool waves generate a significant semblance value and interfere with the picking of formation slowness. This example may seem trivial because the tool waves are small relative to the formation waves, as compared to the cased hole example in FIG. 4 where formation waves are almost indistinguishable in the free-pipe section.
- the f-k data from LWD tools are even more hampered compared to those from wireline tools, due to a fewer number of receivers (six, versus eight, the typical number of receivers of a wireline tool) and sparser sampling (0.75 ft, versus 0.5 ft; the Nyquist wavenumber k Nyquist is now even lower, which is only 4.2/ft, versus 6.28/ft of the wireline case).
- the example in FIG. 5 shows that the coherence-filtering technique is still effective despite the increased adversities.
- the Raw Data track of FIG. 5 displays the LWD data (receiver 1 ) in VDL, which shows that the data are contaminated by tool waves.
- the tool waves produce a strong semblance in the Correlogram (raw data) track and interfere with the picking of formation slowness.
- Filtered Data normalized
- track coherence filtering suppresses the tool wave and removes its semblance from the Correlogram (filtered data) track.
- the enhanced formation signal coherence allows for picking the formation slowness in areas dominated by tool waves as can be seen from the agreement between the picked LWD slowness (curve) and the wireline-measured slowness (markers).
- FIG. 6 A data collection system 4 utilizing an embodiment of the method of the present disclosure is illustrated in FIG. 6 .
- the data collection system 4 as shown comprises a sonde 10 connect by wireline 8 to a field truck 6 .
- Signal data is collected by a sonde 10 disposed within a wellbore 14 , where the wellbore 14 pierces a formation 16 .
- An array of transducers 12 is disposed on the sonde 10 , the transducers 12 are capable of receiving and recording downhole signals transmitted to the receivers from within the formation 16 .
- the transducers 12 can be capable of transmitting a signal in addition to receiving a signal.
- the raw recorded data received by the transducers 12 can be stored within the sonde 10 for later retrieval or processing, or can be transmitted to the field truck 6 via the wireline 8 or telemetry.
- the method of coherence filtering can be performed within the sonde 10 , field truck 6 , or the associated processor 18 .
- the processor 18 may be a computer, or microprocessor, with memory capable of running programmed instructions.
- the processor 18 may also have permanent data storage and hard copy output capabilities.
- the processor 18 may be a separate unit or may be located in an enclosure attached to the field truck 6 or any other suitable enclosure commonly used in the art.
- Combining the data collection system 4 with a processor 18 or other means of processing the signal data, such as manually, comprises a data analysis system.
- FIG. 7 illustrates an alternative data collection system 4 a for use in logging while drilling operations.
- the drilling system 25 comprises a drill string 26 having multiple elements and terminating on its lower end at a drill bit 27 .
- Transducers 28 for receiving signal data are shown on the drill string 26 and on the drill bit 27 .
- the transducers 28 can be any type of device capable of receiving signal data while being disposed within the confines of a wellbore 14 .
- the signal data collected by the drilling string transducers 28 can be transferred to the processor 18 or to data recording devices (not shown) within the field truck 6 .
- processing means can also be included within the drill string 26 for storing the collected signal data and/or processing the data in accordance with the method described herein.
- a surface mounted transducer 20 such as an accelerometer
- an accelerometer can be found in U.S. Pat. No. 6,062,081, issued to Schendel on May 16, 2000.
- the surface transducer 20 communicates with the processor 18 wherein coherence filtering is accomplished.
- the filtering process can also take place within the immediate confines of the surface transducer 20 .
Abstract
Description
X cfil(k,ω)=X(k,ω)·coh(k,ω).
Wherein coh(k,ω) represents a coherence function of one or more than one wave mode and X(k,ω) represents signal data.
X(k,ω)=∫∫X(z,t)e −i(k=−ωt) dzdt, (1)
where ω=2πf is the angular frequency and k is the axial wavenumber.
where d is receiver spacing. For a typical receiver spacing of d=0.5 ft (0.1524 m), kNyquist is only 6.28/ft. For this low value of kNyquist, aliasing usually occurs at higher frequencies. For example, a 10-kHz compressional wave with an 8000 ft/s velocity has a wavenumber of k=7.85/ft (>6.28/ft), resulting in the aliasing of the wave data, that is, the data beyond k=6.28/ft will wrap around from k=−6.28/ft in the f-k plane. The aliased data may overlay with the clustered/noise-smeared f-k data, aggravating the problem.
Δt=s(n−1)d,(n=1,2, . . . ,N), (3)
The shifted wave signal will then have almost no moveout in the array and, by applying the f-k transform to the data (step 106), its trend (or energy density contour) in the f-k plane will have an infinite slope. In other words, the data trend will lie on, or very close to, the frequency axis, and will therefore not be aliased in the f-k plane.
where M (≧1) is the total of wave modes in array; Ap, kp=ωsp, and sp are respectively the spectral amplitude, wavenumber, and slowness of the pth wave mode. This approximation is a quite accurate description for acoustic logging data that primarily consist of guided wave modes in the borehole, such as pseudo-Rayleigh and Stoneley waves in monopole logging, flexural wave in dipole logging, and screw wave in quadrupole logging, and the like. Even for refracted (compressional and shear, or P and S) head waves along the borehole, the propagation-mode approximation is still valid because the receiver array is typically several wavelengths away from the source such that the wave amplitude Ap of the waves does not vary significantly across the array.
where * denotes taking the complex conjugate of the data and ∥·∥ denotes taking the modulus of the complex quantity inside. For the data described by equation (4), we see that if the wavenumber variable k attains the value of kp, the wavenumber the propagation mode, then the phase of Xn*(ω)eik(n−1)d≈Ape[i(k−k
a 0 e ik
where a0=1; other coefficients ap (p=1, . . . ,M) (note these coefficients are dimensionless) need to be solved from the array data. By combining equations (4) and (6), it is easily shown (see Tang and Cheng, 2004) that data at receiver n, as described by equation (4), can be predicted by a linear combination of the data from other receivers, as given by:
Equation (8) is called backward prediction because the receiver whose data is being predicted is behind the receiver(s) whose data are used to predict. Equations (7) and (8) are then combined and simultaneously solved using the Kumaresan/Tufts (known as the KT) method to yield the coefficients ap (p=1, . . . ,M). Tufts, D. W., and Kumaresan, R., 1982, Estimation of Frequencies of Multiple Sinusoids: Making Linear Prediction Perform Like Maximum Likelihood, Proc. IEEE, 70, 75-89. With the coefficients known in equation (6), we replace the wave mode wavenumber kp with the wavenumber variable k in this equation and use it to construct a multiple-mode coherence function:
Since the polynomial function in equation (9) has the same functional form as that in equation (6), the function approaches zero when the k variable hits one of the roots kp, (p=1, . . . ,M) of equation (6); the coherence function in equation (9) will then approach a maximum value of 1. For other values of k, the (dimensionless) modulus of the function inside ∥·∥ is large and the coherence function value is low; the function approaches zero if k is far away from kp. Therefore, the high-value region of the coherence function effectively delineates the trajectories/trends of the coherent part of the data in the f-k plane, especially when the data contain several propagation modes.
X cfil(k,ω)=X(k,ω)·coh(k,ω) (10)
If time shifts, as given in equation (3), were applied to advance the receiver waveform data prior to transforming the data to f-k domain, the same time shifts should now be applied to delay the filtered data so as to restore the original time position of the wave data (step 128). The resulting array data for one array location in depth can then be output (step 130) for being processed/analyzed to extract formation acoustic properties for that depth. The same processing is then performed for all depths of interest (
Claims (18)
X cfil(k,ω)=X(k,ω)·coh(k,ω)
X cfil(k,ω)=X(k,ω)·coh(k,ω)
Priority Applications (1)
| Application Number | Priority Date | Filing Date | Title |
|---|---|---|---|
| US11/376,070 US7660200B2 (en) | 2005-06-15 | 2006-03-15 | Method for coherence-filtering of acoustic array signal |
Applications Claiming Priority (2)
| Application Number | Priority Date | Filing Date | Title |
|---|---|---|---|
| US69088005P | 2005-06-15 | 2005-06-15 | |
| US11/376,070 US7660200B2 (en) | 2005-06-15 | 2006-03-15 | Method for coherence-filtering of acoustic array signal |
Publications (2)
| Publication Number | Publication Date |
|---|---|
| US20060287830A1 US20060287830A1 (en) | 2006-12-21 |
| US7660200B2 true US7660200B2 (en) | 2010-02-09 |
Family
ID=37574489
Family Applications (1)
| Application Number | Title | Priority Date | Filing Date |
|---|---|---|---|
| US11/376,070 Active 2026-04-27 US7660200B2 (en) | 2005-06-15 | 2006-03-15 | Method for coherence-filtering of acoustic array signal |
Country Status (1)
| Country | Link |
|---|---|
| US (1) | US7660200B2 (en) |
Cited By (16)
| Publication number | Priority date | Publication date | Assignee | Title |
|---|---|---|---|---|
| US20110188345A1 (en) * | 2010-02-04 | 2011-08-04 | Smith International, Inc. | Downhole Sonic Logging Tool Including Irregularly Spaced Receivers |
| US8121791B2 (en) | 2008-01-08 | 2012-02-21 | Exxonmobil Upstream Research Co. | Spectral shaping inversion and migration of seismic data |
| US20150276955A1 (en) * | 2013-11-06 | 2015-10-01 | Robert H. Brune | Method and System for Extending Spatial Wavenumber Spectrum Of Seismic Wavefields On Land Or Water Bottom Using Rotational Motion |
| US20180045845A1 (en) * | 2016-08-10 | 2018-02-15 | Schlumberger Technology Corporation | Method and system for processing sonic data acquired with a downhole tool |
| US10975687B2 (en) | 2017-03-31 | 2021-04-13 | Bp Exploration Operating Company Limited | Well and overburden monitoring using distributed acoustic sensors |
| US11053791B2 (en) | 2016-04-07 | 2021-07-06 | Bp Exploration Operating Company Limited | Detecting downhole sand ingress locations |
| US11098576B2 (en) | 2019-10-17 | 2021-08-24 | Lytt Limited | Inflow detection using DTS features |
| US11162353B2 (en) | 2019-11-15 | 2021-11-02 | Lytt Limited | Systems and methods for draw down improvements across wellbores |
| US11199084B2 (en) | 2016-04-07 | 2021-12-14 | Bp Exploration Operating Company Limited | Detecting downhole events using acoustic frequency domain features |
| US11199085B2 (en) | 2017-08-23 | 2021-12-14 | Bp Exploration Operating Company Limited | Detecting downhole sand ingress locations |
| US11333636B2 (en) | 2017-10-11 | 2022-05-17 | Bp Exploration Operating Company Limited | Detecting events using acoustic frequency domain features |
| US11466563B2 (en) | 2020-06-11 | 2022-10-11 | Lytt Limited | Systems and methods for subterranean fluid flow characterization |
| US11473424B2 (en) | 2019-10-17 | 2022-10-18 | Lytt Limited | Fluid inflow characterization using hybrid DAS/DTS measurements |
| US11593683B2 (en) | 2020-06-18 | 2023-02-28 | Lytt Limited | Event model training using in situ data |
| US11643923B2 (en) | 2018-12-13 | 2023-05-09 | Bp Exploration Operating Company Limited | Distributed acoustic sensing autocalibration |
| US11859488B2 (en) | 2018-11-29 | 2024-01-02 | Bp Exploration Operating Company Limited | DAS data processing to identify fluid inflow locations and fluid type |
Families Citing this family (8)
| Publication number | Priority date | Publication date | Assignee | Title |
|---|---|---|---|---|
| US7639562B2 (en) * | 2006-05-31 | 2009-12-29 | Baker Hughes Incorporated | Active noise cancellation through the use of magnetic coupling |
| US8036879B2 (en) * | 2007-05-07 | 2011-10-11 | Qnx Software Systems Co. | Fast acoustic cancellation |
| WO2009154851A1 (en) * | 2008-06-18 | 2009-12-23 | Exxonmobil Upstream Research Company | Seismic fluid prediction via expanded avo anomalies |
| EP2751599A4 (en) * | 2011-11-18 | 2016-06-29 | Geco Technology Bv | Coherent noise attenuation |
| US20150272506A1 (en) * | 2012-10-10 | 2015-10-01 | Westerngeco Llc | Wave equation processing |
| AU2014201420A1 (en) * | 2013-03-22 | 2014-10-09 | Cgg Services Sa | Method and device for attenuating random noise in seismic data |
| WO2016053582A1 (en) * | 2014-10-01 | 2016-04-07 | Halliburton Energy Services, Inc. | Trace downsampling of distributed acoustic sensor data |
| US11435493B2 (en) | 2017-06-15 | 2022-09-06 | Halliburton Energy Services, Inc. | Enhanced waveform analysis for target modes of borehole waves |
Citations (6)
| Publication number | Priority date | Publication date | Assignee | Title |
|---|---|---|---|---|
| US4706225A (en) * | 1984-01-19 | 1987-11-10 | Compagnie Francaise Des Petroles | Process for obtaining and processing seismic data measured at an exploratory well |
| US5089989A (en) * | 1989-06-12 | 1992-02-18 | Western Atlas International, Inc. | Method and apparatus for measuring the quality of a cement to a casing bond |
| US5237538A (en) * | 1992-02-20 | 1993-08-17 | Mobil Oil Corporation | Method for removing coherent noise from an array of seismic traces |
| US5392213A (en) * | 1992-10-23 | 1995-02-21 | Exxon Production Research Company | Filter for removal of coherent noise from seismic data |
| US6062081A (en) | 1995-09-05 | 2000-05-16 | Texas Components Corporation | Extended range accelerometer |
| US6427124B1 (en) * | 1997-01-24 | 2002-07-30 | Baker Hughes Incorporated | Semblance processing for an acoustic measurement-while-drilling system for imaging of formation boundaries |
-
2006
- 2006-03-15 US US11/376,070 patent/US7660200B2/en active Active
Patent Citations (6)
| Publication number | Priority date | Publication date | Assignee | Title |
|---|---|---|---|---|
| US4706225A (en) * | 1984-01-19 | 1987-11-10 | Compagnie Francaise Des Petroles | Process for obtaining and processing seismic data measured at an exploratory well |
| US5089989A (en) * | 1989-06-12 | 1992-02-18 | Western Atlas International, Inc. | Method and apparatus for measuring the quality of a cement to a casing bond |
| US5237538A (en) * | 1992-02-20 | 1993-08-17 | Mobil Oil Corporation | Method for removing coherent noise from an array of seismic traces |
| US5392213A (en) * | 1992-10-23 | 1995-02-21 | Exxon Production Research Company | Filter for removal of coherent noise from seismic data |
| US6062081A (en) | 1995-09-05 | 2000-05-16 | Texas Components Corporation | Extended range accelerometer |
| US6427124B1 (en) * | 1997-01-24 | 2002-07-30 | Baker Hughes Incorporated | Semblance processing for an acoustic measurement-while-drilling system for imaging of formation boundaries |
Non-Patent Citations (5)
| Title |
|---|
| Block, Cheng, and Duckworth, Velocity Analysis of Multireceiver Full Waveform Acoustic Logging Data in Open and Cased Holes, 56th Ann. Internat. Mtg., Soc. of Expl. Geophys., 1986, Session BHG2.5. |
| Tubman, K.M., Cheng, C.H., & Toksoz, M.N., 1984, Synthetic Full-waveform Acoustic Logs in Cased Boreholes, II-Poorly Bonded Casing, Geophysics, 51, 902-913. |
| Tubman, K.M., Cheng, C.H., & Toksoz, M.N., 1984, Synthetic Full-waveform Acoustic Logs in Cased Boreholes, II—Poorly Bonded Casing, Geophysics, 51, 902-913. |
| Valero, Skelton, Almeida, Stammeijer & Omerod, Processing of Monopole Sonic Waveforms Through Cased Hole, 73rd Ann. Internat. Mtg., Soc. of Expl. Geophys., 2003, 285-288. |
| White, Roy E. "Signal and Noise Estimation from Seismic Reflection Data Using Spectral Coherence Methods." Proceedings of the IEEE, vol. 72. No. 10, Oct. 1984. * |
Cited By (20)
| Publication number | Priority date | Publication date | Assignee | Title |
|---|---|---|---|---|
| US8121791B2 (en) | 2008-01-08 | 2012-02-21 | Exxonmobil Upstream Research Co. | Spectral shaping inversion and migration of seismic data |
| US8542553B2 (en) | 2010-02-04 | 2013-09-24 | Schlumberger Technology Corporation | Downhole sonic logging tool including irregularly spaced receivers |
| US20110188345A1 (en) * | 2010-02-04 | 2011-08-04 | Smith International, Inc. | Downhole Sonic Logging Tool Including Irregularly Spaced Receivers |
| US20150276955A1 (en) * | 2013-11-06 | 2015-10-01 | Robert H. Brune | Method and System for Extending Spatial Wavenumber Spectrum Of Seismic Wavefields On Land Or Water Bottom Using Rotational Motion |
| US11199084B2 (en) | 2016-04-07 | 2021-12-14 | Bp Exploration Operating Company Limited | Detecting downhole events using acoustic frequency domain features |
| US11053791B2 (en) | 2016-04-07 | 2021-07-06 | Bp Exploration Operating Company Limited | Detecting downhole sand ingress locations |
| US11530606B2 (en) | 2016-04-07 | 2022-12-20 | Bp Exploration Operating Company Limited | Detecting downhole sand ingress locations |
| US11215049B2 (en) | 2016-04-07 | 2022-01-04 | Bp Exploration Operating Company Limited | Detecting downhole events using acoustic frequency domain features |
| US20180045845A1 (en) * | 2016-08-10 | 2018-02-15 | Schlumberger Technology Corporation | Method and system for processing sonic data acquired with a downhole tool |
| US11002871B2 (en) * | 2016-08-10 | 2021-05-11 | Schlumberger Technology Corporation | Method and system for processing sonic data acquired with a downhole tool |
| US10975687B2 (en) | 2017-03-31 | 2021-04-13 | Bp Exploration Operating Company Limited | Well and overburden monitoring using distributed acoustic sensors |
| US11199085B2 (en) | 2017-08-23 | 2021-12-14 | Bp Exploration Operating Company Limited | Detecting downhole sand ingress locations |
| US11333636B2 (en) | 2017-10-11 | 2022-05-17 | Bp Exploration Operating Company Limited | Detecting events using acoustic frequency domain features |
| US11859488B2 (en) | 2018-11-29 | 2024-01-02 | Bp Exploration Operating Company Limited | DAS data processing to identify fluid inflow locations and fluid type |
| US11643923B2 (en) | 2018-12-13 | 2023-05-09 | Bp Exploration Operating Company Limited | Distributed acoustic sensing autocalibration |
| US11473424B2 (en) | 2019-10-17 | 2022-10-18 | Lytt Limited | Fluid inflow characterization using hybrid DAS/DTS measurements |
| US11098576B2 (en) | 2019-10-17 | 2021-08-24 | Lytt Limited | Inflow detection using DTS features |
| US11162353B2 (en) | 2019-11-15 | 2021-11-02 | Lytt Limited | Systems and methods for draw down improvements across wellbores |
| US11466563B2 (en) | 2020-06-11 | 2022-10-11 | Lytt Limited | Systems and methods for subterranean fluid flow characterization |
| US11593683B2 (en) | 2020-06-18 | 2023-02-28 | Lytt Limited | Event model training using in situ data |
Also Published As
| Publication number | Publication date |
|---|---|
| US20060287830A1 (en) | 2006-12-21 |
Similar Documents
| Publication | Publication Date | Title |
|---|---|---|
| US7660200B2 (en) | Method for coherence-filtering of acoustic array signal | |
| US7492664B2 (en) | Method for processing acoustic reflections in array data to image near-borehole geological structure | |
| Hornby | Imaging of near-borehole structure using full-waveform sonic data | |
| Rector III et al. | The use of drill-bit energy as a downhole seismic source | |
| US8208341B2 (en) | Processing of combined surface and borehole seismic data | |
| US7512034B2 (en) | Drill noise seismic data acquisition and processing methods | |
| US4926391A (en) | Signal processing to enable utilization of a rig reference sensor with a drill bit seismic source | |
| US6718266B1 (en) | Determination of dipole shear anisotropy of earth formations | |
| US8395965B2 (en) | Method of determining properties of the earth | |
| US5050130A (en) | Signal processing to enable utilization of a rig reference sensor with a drill bit seismic source | |
| US9121965B2 (en) | Low frequency passive seismic data acquisition and processing | |
| US6956790B2 (en) | Borehole sonic data processing method | |
| EP0273722B1 (en) | Signal processing to enable utilization of a rig reference sensor with a drill bit seismic source | |
| US20120269035A1 (en) | Evaluating Prospects from P-Wave Seismic Data Using S-Wave Vertical Shear Profile Data | |
| CA2610997C (en) | Method for coherence-filtering of acoustic array signal | |
| Park et al. | Seismic characterization of geotechnical sites by multichannel analysis of surface waves (MASW) method | |
| US8238195B2 (en) | Method for 3-C 3-D wavefield decomposition | |
| Esmersoy et al. | Sonic imaging: a tool for high-resolution reservoir description | |
| US20130094325A1 (en) | Look-ahead seismic while drilling | |
| WO2021137704A1 (en) | Virtual rvsp check shot from downhole seismic sources using seismic interferometry | |
| GB2461363A (en) | Methods and systems for processing acoustic waveform data | |
| Wang et al. | Extracting the weak signal of the drill-bit from seismic while drilling data | |
| BRPI0611826B1 (en) | METHOD FOR ACOUSTIC SYSTEM SIGNAL COHERENCE FILTRATION | |
| Chen et al. | Single-well profiling tool with a variable downhole source/receiver spacer | |
| Poletto et al. | Joint use of transmitted and reflected waves in tunnel SWD |
Legal Events
| Date | Code | Title | Description |
|---|---|---|---|
| AS | Assignment |
Owner name: BAKER HUGHES INCORPORATED,TEXAS Free format text: ASSIGNMENT OF ASSIGNORS INTEREST;ASSIGNOR:TANG, XIAO MING;REEL/FRAME:017693/0753 Effective date: 20060206 Owner name: BAKER HUGHES INCORPORATED, TEXAS Free format text: ASSIGNMENT OF ASSIGNORS INTEREST;ASSIGNOR:TANG, XIAO MING;REEL/FRAME:017693/0753 Effective date: 20060206 |
|
| FEPP | Fee payment procedure |
Free format text: PAYOR NUMBER ASSIGNED (ORIGINAL EVENT CODE: ASPN); ENTITY STATUS OF PATENT OWNER: LARGE ENTITY |
|
| STCF | Information on status: patent grant |
Free format text: PATENTED CASE |
|
| FPAY | Fee payment |
Year of fee payment: 4 |
|
| FPAY | Fee payment |
Year of fee payment: 8 |
|
| MAFP | Maintenance fee payment |
Free format text: PAYMENT OF MAINTENANCE FEE, 12TH YEAR, LARGE ENTITY (ORIGINAL EVENT CODE: M1553); ENTITY STATUS OF PATENT OWNER: LARGE ENTITY Year of fee payment: 12 |