US7523016B1 - Detecting anomalies - Google Patents
Detecting anomalies Download PDFInfo
- Publication number
- US7523016B1 US7523016B1 US11/618,607 US61860706A US7523016B1 US 7523016 B1 US7523016 B1 US 7523016B1 US 61860706 A US61860706 A US 61860706A US 7523016 B1 US7523016 B1 US 7523016B1
- Authority
- US
- United States
- Prior art keywords
- values
- characteristic
- monitored
- unusual
- value
- Prior art date
- Legal status (The legal status is an assumption and is not a legal conclusion. Google has not performed a legal analysis and makes no representation as to the accuracy of the status listed.)
- Active
Links
Images


Classifications
-
- H—ELECTRICITY
- H04—ELECTRIC COMMUNICATION TECHNIQUE
- H04L—TRANSMISSION OF DIGITAL INFORMATION, e.g. TELEGRAPHIC COMMUNICATION
- H04L63/00—Network architectures or network communication protocols for network security
- H04L63/14—Network architectures or network communication protocols for network security for detecting or protecting against malicious traffic
- H04L63/1408—Network architectures or network communication protocols for network security for detecting or protecting against malicious traffic by monitoring network traffic
- H04L63/1416—Event detection, e.g. attack signature detection
-
- G—PHYSICS
- G06—COMPUTING; CALCULATING OR COUNTING
- G06F—ELECTRIC DIGITAL DATA PROCESSING
- G06F21/00—Security arrangements for protecting computers, components thereof, programs or data against unauthorised activity
- G06F21/30—Authentication, i.e. establishing the identity or authorisation of security principals
- G06F21/31—User authentication
- G06F21/316—User authentication by observing the pattern of computer usage, e.g. typical user behaviour
-
- G—PHYSICS
- G06—COMPUTING; CALCULATING OR COUNTING
- G06F—ELECTRIC DIGITAL DATA PROCESSING
- G06F21/00—Security arrangements for protecting computers, components thereof, programs or data against unauthorised activity
- G06F21/50—Monitoring users, programs or devices to maintain the integrity of platforms, e.g. of processors, firmware or operating systems
- G06F21/55—Detecting local intrusion or implementing counter-measures
- G06F21/552—Detecting local intrusion or implementing counter-measures involving long-term monitoring or reporting
-
- G—PHYSICS
- G06—COMPUTING; CALCULATING OR COUNTING
- G06Q—INFORMATION AND COMMUNICATION TECHNOLOGY [ICT] SPECIALLY ADAPTED FOR ADMINISTRATIVE, COMMERCIAL, FINANCIAL, MANAGERIAL OR SUPERVISORY PURPOSES; SYSTEMS OR METHODS SPECIALLY ADAPTED FOR ADMINISTRATIVE, COMMERCIAL, FINANCIAL, MANAGERIAL OR SUPERVISORY PURPOSES, NOT OTHERWISE PROVIDED FOR
- G06Q30/00—Commerce
-
- H—ELECTRICITY
- H04—ELECTRIC COMMUNICATION TECHNIQUE
- H04L—TRANSMISSION OF DIGITAL INFORMATION, e.g. TELEGRAPHIC COMMUNICATION
- H04L63/00—Network architectures or network communication protocols for network security
- H04L63/14—Network architectures or network communication protocols for network security for detecting or protecting against malicious traffic
- H04L63/1408—Network architectures or network communication protocols for network security for detecting or protecting against malicious traffic by monitoring network traffic
- H04L63/1425—Traffic logging, e.g. anomaly detection
Definitions
- This instant specification relates to anomaly detection.
- Anomalous activity can occur in various contexts.
- opportunities may exist for people to commit fraud, which can be viewed as anomalous activity relative to valid selections of online advertisements.
- two competitors A and B may both purchase advertisements (“ads”) that are displayed on a website whenever a user searches for relevant keywords.
- A may wish to sabotage B by writing a software program that clicks on B's ads until B's daily ad budget is exhausted and only A's ads are shown to subsequent users.
- systems and methods for identifying anomalous activity are described.
- systems and methods are described, in which patterns of unusual behavior can be identified by aggregating logged, or sampled, data into cells and annotating each cell with statistically derived measures of how extreme the cell is relative to, for example, historical behavior of corresponding characteristics or relative to, for example, behavior of characteristics from a general population.
- Cells that have more than a predefined number of such annotations can be identified as anomalous and can be investigated by a user or outright acted upon in an automatic, pre-defined way.
- a method which includes monitoring characteristics of sampled data associated with one or more transaction components of a plurality of transaction components and determining whether a value for a first monitored characteristic is unusual based on whether the value is located within a predefined portion of a distribution of values for the first monitored characteristic. The method also includes identifying the sampled data associated with the one or more transaction components as unusual if a predetermined number of values for the monitored characteristics of the sampled data are determined to be unusual.
- a method includes aggregating network data into entries including network activity for network transaction components during a period of time, annotating each entry with statistically derived measures of how anomalous the entry is relative to other entries, and identifying annotated entries that have annotations specifying that the entry is anomalous if a number of the annotations exceeds a predetermined threshold.
- a system in yet other implementations, includes means for storing entries that include characteristics of sampled data associated with one or more entities, and means for determining whether selected sampled data associated with an entity is anomalous. The determining is based on calculating a distribution of values for one or more characteristics of the selected sampled data, determining whether the one or more characteristics of the selected sampled data have values categorized as unusual based on the distribution, and identifying the selected sampled data as improbable if a predetermined number of the one or more characteristics are categorized as unusual.
- a method in another implementation, includes sampling values from one or more signals associated with an object and determining whether a sampled value for a signal is unusual based on whether the sampled value is located within a predetermined portion of a distribution of values for the signal. The method also includes identifying the object as unusual if a predetermined number of signals are determined to be unusual.
- Unusual clusters of data e.g., network traffic
- characteristics e.g., number of page views per user, number of cookies per network address, etc.
- An intuitive interface can be provided for browsing clusters of unusual sampled data.
- Unusual characteristics can be annotated using bit vectors that describe the anomaly in an easy to read fashion.
- a bound on anomalous sampled data can be estimated as a function of a number of characteristics that are noted as anomalous.
- FIG. 1 schematically illustrates an example system that can be used for detecting anomalous patterns of network traffic.
- FIG. 2A is a table of example network log entries.
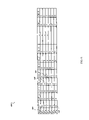
- FIG. 2B is a table of example aggregated indexed log entries.
- FIG. 2C is a table of example derived characteristics.
- FIG. 3A is an example histogram of characteristic values.
- FIG. 3B is an example graph of a standard deviation test.
- FIG. 3C is an illustration of example slope test graphs.
- FIG. 4 is a flowchart showing an exemplary method for building normal distributions used to determine the improbability of characteristic values.
- FIG. 5 is a flowchart for an example method for identifying abnormal characteristic values.
- FIG. 6 is an example table of improbable entries.
- FIG. 7 is a flowchart for an example method for generating and refining lists.
- FIG. 8 is an example set of clusters displayed in a user interface.
- FIG. 9 is a schematic diagram of a general computer system.
- Certain implementations of systems and techniques are described, which can detect anomalous clusters of data sampled at various points in time across multiple signals. The detection can be accomplished, for example, by searching for data characteristics that are statistically improbable. In certain situations, patterns of unusual behavior identify anomalous sampled data. If the anomaly is widespread, many streams of sampled data may exhibit substantially similar patterns of unusual behavior, and the sampled data can be grouped into similar categories for analysis by a user or can be handled in an automated way.
- patterns of unusual behavior are identified by aggregating logged, or sampled, data into cells and annotating each cell with statistically derived measures of how extreme the cell is relative to, for example, historical behavior of corresponding characteristics or relative to, for example, behavior of characteristics from a general population.
- Cells that have more than a predefined number of such annotations can be identified as anomalous and can be investigated by a user or outright acted upon in an automatic, pre-defined way.
- the sampled data includes network traffic that is sampled at various points in time across multiple characteristics, which can include characteristics, such as a number of page views per user, a number of cookies per network address, etc.
- the systems and techniques are not limited to detection of anomalies in network traffic, but can be used to monitor or detect anomalies in various contexts in which multiple characteristics can be sampled, or logged. Additional example contexts are listed below after the following detailed description of an implementation based on detecting anomalies in network traffic.
- FIG. 1 schematically illustrates an example system 100 that can be used for detecting anomalous patterns of network traffic.
- the system 100 can include clients, such as clients 102 a - c , as well as a web server 104 , an anomaly detection device 106 , and a network 108 . Though a client-server architecture is shown, other architectures are possible.
- clients 102 a - c can send and receive network traffic to and from the web server 104 across the network 108 , as illustrated by arrows 110 a - c .
- a user viewing a web page that is displayed on the client 102 a can click on an advertisement (“ad”) displayed on the web page.
- the ad may include a hyperlink to a landing page 112 that is stored on the web server 104 .
- a landing page 112 is a target web page that may be displayed if an advertisement is selected (e.g., clicked) by a user.
- network traffic such as internet traffic
- communicated to and from clients 102 a - c can include various characteristics that can be logged by the anomaly detection device 106 .
- characteristics of the network traffic going to and from client 102 a can include the Internet Protocol (IP) address of client 102 a , domain names and web pages requested by users of client 102 a , the date and time of the requests, identifiers associated with ads displayed to users of client 102 a , and identifiers associated with ads selected by users of client 102 a.
- IP Internet Protocol
- the example anomaly detection device 106 can include a network traffic monitor 114 , an anomaly detector component 116 , and a database 118 .
- the network traffic monitor 114 can, for example, log network traffic, such as the characteristics described above, and store the values of these characteristics as network log entries 120 in the database 118 .
- the anomaly detector component 116 can process the network log entries 120 in order to search for statistically improbable values in the characteristic data.
- the anomaly detector component 116 can refer to rule definitions 122 , which can define criteria for determining which characteristic values are improbable. For example, a rule used to determine the improbability of the number of ad selections associated with one IP address can state that the highest (e.g., highest 2.5%) and the lowest (e.g., lowest 2.5%) of values of a general population of values can be interpreted as improbable.
- the anomaly detector component 116 can aggregate characteristic values and store aggregated indexed log entries 124 in, for example, the database 118 .
- characteristic values can be aggregated by time period and by client IP address, in order to store metrics, such as the number of ad impressions per IP address per time period (e.g., a client with a particular IP address may have had 15 ad impressions displayed on it between 1 pm and 1:59 pm).
- the anomaly detector component 116 can derive other metrics from the aggregated indexed log entries 124 and store these metrics as derived characteristics 126 in, for example, the database 118 .
- characteristics in the aggregated indexed log entries 124 might include counts of ad impressions and counts of ads clicked by users, both of which are associated with a particular IP address.
- the anomaly detector component 116 can create new, derived characteristics, such as click-through rate, by dividing the number of ads clicked by the number of ad impressions.
- the anomaly detector component 116 builds lists 128 that include groups, or clusters, which are anomalous in similar ways. For example, several clients associated with IP addresses may exhibit extremely high click-through rates in a particular time period. The lists 128 can be displayed to a user for further examination. Lists can be generated using improbable entries 130 . Improbable entries 130 can be used to identify keys that have unusual values for several characteristics.
- FIG. 2A is a table 200 of network log entries 120 which are examples of characteristics that can be logged by the network traffic monitor 114 .
- the entries are indexed by source IP address 202 (e.g., an IP address of a client which initiated some network traffic).
- the table 200 shows traffic logged from two IP addresses, IP 1 and IP 2 .
- Logged information which is associated with a particular IP address can include destination IP addresses 204 and requested web page identifiers 206 of web pages requested by users associated with that particular IP.
- the table 200 includes “D 1 ” and “D 2 ” as example destinations 204 and “page 1 ,” “page 2 ” and “page 3 ” as example requested web pages 206 .
- a time value 208 such as the time of the request, can be stored for each entry in the log.
- the network log entries 120 can include information, for example, related to advertisements, such as ad impressions 210 and ads clicked 212 .
- AD 1 and AD 2 are ad impressions that were displayed on the “page 1 ” web page to a user associated with IP address IP 1
- AD 2 , AD 3 , and AD 4 are ad impressions that were displayed on the “page 2 ” to a user associated with IP address IP 2
- the table 200 also shows that a user who viewed the “page 1 ” clicked on the AD 1 ad, and that during “Hour 1 ” no ads were clicked on while the “page 2 ” was displayed.
- FIG. 2B is a table 240 of example aggregated indexed log entries 124 .
- the anomaly detector component 116 can aggregate network log entries 120 , for example, by IP address and by time period.
- the table 240 shows data aggregated from the example table 200 .
- table 200 contains multiple records associated with IP 1 , each having individual ad impression lists, ad click counts and other metrics associated with particular requests.
- Corresponding records in table 240 show aggregated values related to IP 1 for particular time periods, such as a count of unique destinations visited 242 , a count of the number of web pages visited 244 , a count of ad impressions 246 , and a count of ads clicked 248 .
- time periods such as a count of unique destinations visited 242 , a count of the number of web pages visited 244 , a count of ad impressions 246 , and a count of ads clicked 248 .
- time periods such as a count of unique destinations visited 242 , a count of the number of web pages visited 244 , a count of ad impressions 246 , and a count of ads clicked 248 .
- FIG. 2C is a table 260 of example derived characteristics 126 .
- the anomaly detector component 116 can also derive new characteristics by performing calculations involving aggregated characteristics (or unaggregated characteristics).
- the table 260 shows derived characteristic values computed using aggregated values from table 240 .
- Derived characteristics 126 can include characteristics, such as click-through rate 262 , IP frequency 264 , and cost-per-click 266 .
- the click-through rate can be calculated for a particular IP address for a particular time period by dividing the number of ads clicked by the number of ads shown. For example, for IP address IP 1 for “Hour 1 ,” the click-through rate 262 can be calculated as 2 divided by 4, (2 ads clicked divided by 4 ads shown) or a value of 0.5.
- IP frequency is a derived characteristic that can be calculated by totaling the number of clicks from an IP address during a certain time period.
- IP frequency for IP 1 for “Hour 1 ” is 2 and the IP frequency for IP 2 for “Hour 1 ” is 0.
- Other derived characteristics can be calculated, such as cost-per-click, which can be calculated by totaling the sum of click costs divided by the total number of clicks from a particular IP address.
- FIG. 3A is an example histogram 300 of characteristic values. Values for a particular characteristic, such as IP frequency, can be displayed in a histogram in order to illustrate the distribution of values for the characteristic over a time period.
- the x-axis 302 quantifies the values of the characteristic
- the y-axis 304 represents the frequency of occurrence of particular values within the population.
- column 306 of the histogram illustrates that the characteristic had a value of “100” 400 times in the population.
- the distribution of characteristic values will occur as displayed in the histogram 300 , with most of the values clustered in the center.
- a quantile-low value (Q L ) 308 can be determined to identify characteristic values that are improbably low.
- the Q L value 308 in histogram 300 is a value at which 2.5% of the population values are below Q L and 97.5% of the values are above Q L . This can indicate that if a characteristic has a value below the Q L value 308 , it is improbabilistically low.
- a quantile-high value (Q H ) 310 can identify characteristic values that are improbably high.
- the Q H value 310 is set so that 2.5% of the population values are above Q H and 97.5% of the values are below Q H .
- the values of Q L and Q H specify a confidence level.
- a Q L value of 2.5% results in a confidence level of 97.5%, as illustrated by arrow 312 .
- a confidence level of 97.5% means that there is a 97.5% probability that a characteristic value will be above Q L .
- arrow 314 illustrates that there is a 97.5% confidence level that characteristic values will be below the Q H value.
- the Q L and Q H values can be adjusted to create different confidence levels. For example, Q L and Q H can be set to 1% to create confidence levels of 99%.
- FIG. 3B is an example graph 340 of a standard deviation test.
- the previously-discussed FIG. 3A displayed characteristic values for a population as a whole, across all keys (e.g., click-through rate for all logged IP addresses).
- characteristic values can also be compared for a single key, by comparing current and historical values for a selected characteristic of a particular key, such as the click-through rate for a particular IP address. For example, click-through rate values can be compared for a particular IP for all days within the past month.
- historical values for a characteristic for a particular key can be plotted on a graph 340 , and a line 342 can be fitted to the points.
- the line can illustrate the trending behavior of the values.
- a new characteristic value 344 can be compared to the predicted trend of the existing values. If a new value exceeds the predicted trend of the previous values, the new characteristic value can be identified as improbable.
- the IP frequency associated with a particular IP address may trend slightly upward at a known slope over a certain time period. If new values for IP frequency for that IP address are much larger, the standard deviation test can identify the IP address for further investigation, because it deviates beyond a predetermined value from the value predicted by the trend line. Although this example describes using a standard deviation test, other techniques can be used to determine whether values are improbable.
- FIG. 3C is an illustration 360 of slope test graphs.
- values for a selected characteristic of a particular key can be plotted and fitted to a line.
- the anomaly detector component 116 may calculate a slope of the line, which gives an indication of a rate of change for the characteristic over time.
- lines that are relatively flat indicate relatively little change in characteristic values over time. Lines that have relatively steep slopes, however, are indicative of characteristic values that are changing a relatively high amount over a period of time, which can be an indicator of fraud.
- graph 362 displays a line 364 , which has been fitted to example values for a characteristic for a particular IP address (IP 1 in this example).
- Graphs 372 and 382 show values for the same characteristic, but for other IP addresses (IP 2 and IP 3 , respectively).
- a line 374 has been fit to the characteristic values associated with IP 2
- a line 384 has been fit to the characteristic values associated with IP 3 .
- the slope of a line, such as line 374 can be calculated, as illustrated by slope 386 , as the change in the y-value (e.g., the change in characteristic value) divided by the change in the x-value (e.g., the change in time).
- Line 384 has a slope which is relatively steep, as compared to the slope of line 364 , which is relatively flat.
- Line 374 also has a steep slope, where the slope is negative (e.g., the characteristic values are getting smaller over time).
- Steep slopes can be indicative of fraud because the characteristic value is changing relatively rapidly over time. Slopes can be calculated for each key (e.g., all IP addresses) within a population, and the keys associated with the slopes that exceed a threshold can be further examined (e.g., as possibly associated with fraud).
- FIG. 4 is a flowchart showing an example method 400 for generating distributions (which in some implementations can be used to determine improbability of characteristic values).
- network traffic is logged, for example, by the network traffic monitor 114 .
- the logged traffic can be stored, for example in network log entries 120 , as illustrated in FIG. 2A .
- network traffic is indexed and aggregated (e.g., by the network traffic monitor 114 ) based on selected keys.
- the indexed and aggregated data can be stored, for example, as the aggregated indexed log entries 124 .
- FIG. 2B illustrates example aggregated indexed log entries.
- Data can be indexed by IP address, by landing page 112 , or by another logged characteristic.
- Data can be aggregated by time period, such as by hour, day, week, month, year, or other characteristic.
- derived characteristics are extracted from the aggregated indexed log entries (e.g., by the anomaly detector component 116 ). Derived characteristics, such as IP frequency, click-through rate, and cost-per-click, can be derived from other characteristics, as described above in association with the FIG. 2C . Derived characteristics then can be stored, for example, in the database 118 .
- one or more distributions can be generated (e.g., by the anomaly detector component 116 ) and used for determining if received characteristic values are improbable.
- the sequence of steps starting with step 408 uses characteristics from a current population of keys (e.g., IP addresses), while the sequence of steps starting with step 414 uses a characteristic for a particular key (e.g., a single IP address) over a historical time period.
- a current population of keys e.g., IP addresses
- a characteristic for a particular key e.g., a single IP address
- steps 408 and 414 are dashed in FIG. 4 to indicate they are optional steps.
- the steps beginning with step 408 can be performed, and in other implementations, the steps beginning with step 412 can be performed. Additionally, any combination of the optional steps can be performed, or other methods to detect anomalies can be substituted for the dashed steps of FIG. 4 .
- a distribution is generated (e.g., by the anomaly detector component 116 ) based on the range of values for a particular characteristic obtained from multiple keys.
- a second type of distribution is generated (e.g., by anomaly detector component 116 ) based on a range of values for a characteristic for a single key over a time period.
- a histogram is created (e.g., by the anomaly detector 116 ) using values for a selected characteristic across all keys. For example, values for a characteristic, such as IP frequency, can be graphed for all IP addresses for a particular time period.
- FIG. 3A is an example histogram.
- threshold values are determined above or below which characteristic values are identified as improbable.
- the anomaly detector 116 can determine that the quantile-low (Q L ) 308 and quantile-high (Q H ) 310 values in FIG. 3A are threshold values.
- a Q L value of 2.5% means that 97.5% of the population values for the selected characteristic are higher than Q L . Values lower than Q L can be identified as improbable. Similarly, values higher than a Q H value can be identified as improbable.
- step 412 values, such as the Q L and Q H values, are stored (e.g., by the anomaly detector 116 ) for use in determining an improbability of new characteristic values.
- Steps 414 - 420 may provide an alternate or additional processing flow to steps 408 - 412 .
- current and historical values are compared for a selected characteristic for a particular key.
- the anomaly detector component 116 can compare IP frequency values that have been recorded daily for the past month for a particular IP address.
- the anomaly detector component 116 can perform slope, variance, and standard deviation comparisons using the current and historical values for the particular key.
- step 416 a slope of a line fitted to the historical values for the selected key is determined, as shown for example in FIG. 3C .
- the anomaly detector component 116 can, in another method described below, compare a new slope value to historical slope values to determine if new characteristic values are improbable.
- the slope value determined in step 416 is stored.
- a variance value is determined (e.g., by the anomaly detector 116 ) for the historical data for a particular key.
- Unusual variance in historical data may indicate fraud. For example, if a fraudulent user created a software program to automate repetitive selection of advertisements, certain characteristics, such as click-through rate, may be extremely uniform, and the historical data for particular keys may show extremely little or no variance compared to other keys in the population.
- the variance value determined in step 418 is stored.
- step 420 mean and standard deviation values are determined.
- the anomaly detector 116 can identify a new characteristic value which is greater than an identified standard deviation from the mean of historical values as improbable.
- step 412 the mean and standard deviation values determined in step 420 are stored.
- step 412 determination is made (e.g., by the anomaly detector component 116 , in step 422 , whether there are unprocessed characteristics. If there are no more unprocessed characteristics, the method ends. If there are more characteristics, they can be processed as described above starting with step 408 , step 414 , or both steps.
- FIG. 5 is a flowchart for an example method 500 for identifying abnormal characteristic values.
- the method 500 is performed by the anomaly detector component 116 .
- a key such as an IP address
- a user may designate other keys, such as a network domain or a particular web site address.
- a characteristic associated with the key is identified. For example, an IP frequency value for a particular IP address can be selected.
- tests can be performed to determine whether a value for the selected characteristic is improbable based on, for example, a threshold, such as the saved threshold values of step 412 of FIG. 4 .
- a threshold such as the saved threshold values of step 412 of FIG. 4 .
- the value for the selected characteristic for the selected key is compared to one or more threshold values, such as a Q L threshold value or a Q H threshold value.
- the value for the selected characteristic can also be compared to historical values for the selected key using variance, standard deviation, slope, or other tests, such as the tests described in FIGS. 3B-3C . If a test indicates that the characteristic value is improbable, the value can be identified as improbable in step 540 . If none of the tests indicate that the characteristic value is improbable, the value is identified as probable in step 550 .
- step 560 a test is performed to determine whether there are remaining unprocessed characteristics to be processed for the selected key. If there are unprocessed characteristics, step 520 is performed and another characteristic is identified. If there are no unprocessed characteristics, step 570 is performed.
- step 570 a test is performed to determine whether there are remaining keys to process. If there are remaining keys to process, step 510 is performed and another key is identified. If there are no remaining keys to process the method ends.
- FIG. 6 is an example table 600 of improbable entries 130 .
- the output of the method 500 described above can be stored in the table 600 .
- values can be stored for each key of the table 600 .
- values can be stored for each key of the table 600 .
- two binary values are stored.
- a key can be an IP address
- a first characteristic (C 1 ) associated with that key can be IP frequency
- a second characteristic (C 2 ) associated with that key can be click-through rate.
- a first binary value can be stored to indicate whether a characteristic value for a particular key is lower than a first threshold (e.g., the Q L threshold).
- a first threshold e.g., the Q L threshold
- a value of “one” can indicate that the characteristic value is lower than the Q L threshold
- a value of “zero” can indicate that the characteristic value is higher than the Q L threshold.
- a “one” value 602 can indicate that the value for characteristic C 1 of an IP address IP 6 is lower than a Q L threshold.
- a value lower than the Q L threshold may indicate anomalous activity for this characteristic.
- a “zero” value 604 can indicate that the value for characteristic C 1 for IP address IP 1 is not below a Q L threshold.
- a second value (e.g., a binary value) can be stored to indicate whether the characteristic value is higher than a second threshold (e.g., the Q H threshold).
- a second threshold e.g., the Q H threshold.
- a “one” value 606 can indicate that the value for characteristic C 2 for IP address IP 2 is higher than a Q H threshold.
- a value higher than the Q H threshold may indicate anomalous activity for characteristic C 2 .
- a “zero” value 608 can indicate that for IP address IP 4 , the value for characteristic C 2 was not higher than a Q H threshold.
- the number of samples in the histogram can influence the accuracy of the identifying a characteristic value as improbable. For example, if a histogram included 500 samples as opposed to five samples, a value that falls within the top 20% of the former histogram is more likely to actually be in the top 20% of the total population because the number of samples increases the trustworthiness of the determination.
- a confidence interval is the statistical method used to capture the concept of “trustworthiness” in this context.
- the system can compute a statistical confidence interval for a characteristic value if the system has some a-priori information describing the distribution from which the characteristic value came. For example, if the value came from a Binomial distribution, the system can use a binomial test to determine a statistical confidence level.
- the confidence interval for I y is less than the confidence interval for I x because the former is more trustworthy because it is part of a larger sampling group.
- the system can compare the upper bound of the confidence interval against the left cutoff on a histogram for C x , and the lower bound against the right cutoff of the histogram.
- the system uses a substantially similar technique to increase the probability that when a characteristic is identified as unusual, the system accounts for sufficient sampling accuracy.
- the anomaly detector component 116 can sort the entries to identify entries that have the greatest amount of values indicating anomalies (e.g., “one” values). The entries that have the greatest amount of values indicating anomalies are likely improbable and may indicate fraudulent activity.
- the anomaly detector component can examine the improbable entries 130 and determine if there are entries that are improbable in similar ways. For example, entries, such as the example entries shown in FIG. 6 , may have similar patterns of binary values. Sets of entries that are unusual in similar ways can be stored lists, such as a cluster list 822 of FIG. 8 .
- the cluster list can display clusters of characteristics that have substantially similar abnormal values.
- a cluster list such as the cluster list 822 , can include a cluster id used to identify a cluster of similar entries, a number of “hot bits,” which indicates how many abnormal characteristics are included in the entries of the cluster, how many entries are in the cluster, and other information (more fully described in association with FIG. 8 ) related to the cluster.
- the cluster list is displayed to a user for further investigation (e.g., a final determination that the anomalous activity is fraudulent, modifications of system responses, such as discarding clicks from an IP address associated with anomalous activity, etc.)
- FIG. 7 is a flowchart for an example method 700 for generating and refining lists.
- the method 700 is performed by the anomaly detector component 116 .
- clusters are generated.
- a cluster can be described as a permutation of abnormal characteristic values, where the permutation is exhibited for one or more keys.
- the improbability index entries associated with IP addresses IP 5 and IP 6 indicate that these two IP addresses have the same permutations of characteristics that have abnormal values (e.g., for both IP addresses, the first characteristic was abnormally low and the second, third and fourth characteristics were abnormally high).
- the following six clusters of three or more abnormal characteristics can be generated from the example data in the table 600 : ⁇ C 1 _L, C 2 _H, C 3 _H, C 4 _H ⁇ , ⁇ C 1 _L, C 2 _H, C 4 _H ⁇ , ⁇ C 1 _L, C 2 _H, C 3 _H ⁇ , ⁇ C 1 _L, C 3 _H, C 4 _H ⁇ , ⁇ C 2 _H, C 3 _H, C 4 _H ⁇ , ⁇ C 1 _H, C 3 _L, C 4 _L ⁇ .
- the following algorithm can be used to generate the permutations:
- correlated characteristics can be excluded from lists. For example, one characteristic might be related to cookies and another characteristic may be related to logins. Since logins can involve cookies, an unusually high login count may correlate to an unusually high cookie count. Therefore only one characteristic (either related to cookies or logins) is included in the cluster because the characteristics are correlated.
- clusters of at least a minimum size are generated.
- clusters of three characteristics or greater are generated.
- a count of keys (e.g., IP addresses or web sites) associated with each cluster can be identified.
- two IP addresses IP 5 and IP 6
- the cluster ⁇ C 1 _H, C 3 _L, C 4 _L ⁇ is associated with one key (IP 1 )
- the cluster ⁇ C 1 _L, C 2 _H, C 4 _H ⁇ is associated with three keys (IP 3 , IP 5 , and IP 6 ).
- step 730 it is determined if there are unprocessed clusters. If there are additional clusters to process, step 740 is performed. If there are no remaining unprocessed clusters, the method ends.
- step 740 an unprocessed cluster is selected.
- step 750 a determination is made (e.g., by the anomaly detector component 116 ) if the selected cluster is subsumed by other clusters. Subsumed clusters can be subsets of other clusters.
- the clusters ⁇ C 1 _L, C 2 _H, C 3 _H ⁇ , ⁇ C 1 _L, C 2 _H, C 4 _H ⁇ , ⁇ C 1 _L, C 3 _H, C 4 _H ⁇ , and ⁇ C 2 _H, C 3 _H, C 4 _H ⁇ are subsumed in the cluster ⁇ C 1 _L, C 2 _H, C 3 _H, C 4 _H ⁇ . If the selected cluster is subsumed by another cluster, step 760 is performed, and the selected cluster is discarded. After the cluster is discarded, the step 730 may be repeated to check for additional unprocessed clusters.
- step 770 is performed.
- the selected cluster is examined for homogeneity. For example, the anomaly detector component 116 can compare corresponding characteristics for all keys associated with the selected cluster to ensure that the keys have similar values for corresponding characteristics. For example, a key with an extremely high cost-per-click rate can be considered to be dissimilar to a key with an extremely low cost-per-click rate.
- a variance value can be calculated for each characteristic of keys associated with the cluster. If the selected cluster has a variance level for one or more characteristics that is higher than a threshold, then step 760 can be performed, and the selected cluster can be discarded. After discarding the cluster at the step 760 , the method 700 can return to the step 730 to determine if there are additional unprocessed clusters.
- step 780 can be performed.
- a determination is made (e.g., by anomaly detector component 116 ) if the cluster is likely to appear in the population.
- a probability of the natural occurrence of a cluster can be calculated. For example, consider a cluster ⁇ C 2 _H, C 3 _H, C 4 _H ⁇ . Probabilities can be calculated for each component of the cluster. For example, it can be determined how many times in the population the characteristic C 2 was abnormally high.
- the probability of the selected cluster can be determined, for example, by multiplying together the individual probabilities of the constituent components of the cluster (for example, the probability of C 2 _H multiplied by the probability of C 3 _H multiplied by the probability of C 4 _H).
- the calculated probability value for the selected cluster can be used to calculate an expected cluster size (e.g., the number of keys associated with the cluster).
- the expected size of a cluster that naturally occurs in the population can be given by, for example, a Poisson distribution, with a lambda parameter value equal to the probability value for the selected cluster.
- Upper and lower (e.g., 5%) confidence intervals can be calculated for this Poisson distribution, and if the cluster size is either below or, respectively, above this confidence interval, then the cluster can be discarded in step 760 . After discarding the cluster at the step 760 , the method 700 can return to the step 730 to determine if there are additional unprocessed clusters.
- FIG. 8 is an example set of clusters displayed in a user interface 800 .
- the user interface 800 can be used to view generated lists 128 .
- a run identifier 802 and run date 804 can be displayed which can be used to distinguish generated lists 128 , for example on printed reports.
- a “Stats” value 806 can indicate a key that is used for cluster generation, such as IP addresses, landing pages, etc.
- a confidence interval 808 can indicate the Q L and Q H thresholds used to generate the clusters.
- the user interface 800 can include a rule list 810 having rules that define when characteristics are anomalous.
- the rule list 810 can include rule names, such as “Char 1 _Fit_H” 814 and “Char 1 _Slope_L” 816 as shown in column 812 .
- the name “Char 1 _Fit_H” 814 can be a rule that defines when a variance, such as the variance determined by the variance tests discussed in association with FIG. 5 , to be abnormally high.
- the name “Char 1 _Slope_L” can be associated with a rule that defines when a slope, such as the slope determined by the slope tests discussed in FIG. 4 , to be abnormally low.
- the rule list 810 can include rule definitions, such as those shown by column 816 .
- a rule definition 818 can define content of the rule 814 .
- the rule definition 818 describes a line-fit test which determines if a line fit to historical values is abnormally above a predicted line.
- the rule definition 818 defines tests to see if there are, for example, at least 4 samples of the characteristic “Char 1 ,” and if the value of “Char 1 ” is more than, for example, five linear-fit error units above the predicted linear value of the samples.
- a rule definition 820 can define the rule 816 .
- the rule definition 820 can include a test to see if there are at least 4 samples of characteristic “Char 1 ”. If a slope calculated using the new and historical values of “Char 1 ” is less than a threshold value, the value for the characteristic can be marked as abnormal.
- a cluster list 822 can display clusters of characteristics that have substantially similar abnormal values.
- the user interface 800 includes a cluster id column 824 that displays an identifier that is used to distinguish clusters. Also, a “hot bits” column 826 can be displayed that indicates how many abnormal characteristics are included in the cluster.
- a cluster definition column 828 displays the specific combinations of abnormal characteristics that define a cluster.
- a cluster definition 830 defines the rules that are included in the cluster with cluster id 486995.
- the cluster definition 830 includes abnormal characteristics Char 1 _H, Char 2 _H, and Char 3 _H (and additional abnormal characteristics truncated for ease of illustration).
- the user interface 800 can include a cluster size column 832 that displays the number of keys (e.g., IP addresses) that have abnormal values according to the cluster definition.
- a cluster size 834 indicates that two IP addresses have associated abnormal values that match the cluster definition 830 .
- the cluster list 822 can display other statistics for keys that are associated with the cluster, such as a page view count 836 (e.g., the cluster with cluster id 487000 was viewed 131 times), an advertisement impression count 838 (e.g., the cluster with cluster id 487000 has 945 impressions), an advertisement click count 840 (e.g., the cluster with cluster id 487000 has 240 clicks) and an advertisement click revenue total 842 (e.g., the cluster with cluster id 487000 has a revenue total of $296.17).
- a page view count 836 e.g., the cluster with cluster id 487000 was viewed 131 times
- an advertisement impression count 838 e.g., the cluster with cluster id 487000 has 945 impressions
- an advertisement click count 840 e.g., the cluster with cluster id 487000 has 240 clicks
- an advertisement click revenue total 842 e.g., the cluster with cluster id 487000 has a revenue total of $2
- FIG. 9 is a schematic diagram of a computer system 900 .
- the system 900 can be used for the operations described in association with any of the methods described previously, according to one implementation. Though a computing system is shown, the proposed methods can be implemented in other electronic devices.
- the system 900 includes a processor 910 , a memory 920 , a storage device 930 , and an input/output device 940 . Each of the components 910 , 920 , 930 , and 940 are interconnected using a system bus 950 .
- the processor 910 is capable of processing instructions for execution within the system 900 . In one implementation, the processor 910 is a single-threaded processor. In another implementation, the processor 910 is a multi-threaded processor.
- the processor 910 is capable of processing instructions stored in the memory 920 or on the storage device 930 to display graphical information for a user interface on the input/output device 940 .
- the memory 920 stores information within the system 900 .
- the memory 920 is a computer-readable medium.
- the memory 920 is a volatile memory unit.
- the memory 920 is a non-volatile memory unit.
- the storage device 930 is capable of providing mass storage for the system 900 .
- the storage device 930 is a computer-readable medium.
- the storage device 930 may be a floppy disk device, a hard disk device, an optical disk device, or a tape device.
- the input/output device 940 provides input/output operations for the system 900 .
- the input/output device 940 includes a keyboard and/or pointing device.
- the input/output device 940 includes a display unit for displaying graphical user interfaces.
- the features described can be implemented in digital electronic circuitry, or in computer hardware, firmware, software, or in combinations of them.
- the apparatus can be implemented in a computer program product tangibly embodied in an information carrier, e.g., in a machine-readable storage device or in a propagated signal, for execution by a programmable processor; and method steps can be performed by a programmable processor executing a program of instructions to perform functions of the described implementations by operating on input data and generating output.
- the described features can be implemented advantageously in one or more computer programs that are executable on a programmable system including at least one programmable processor coupled to receive data and instructions from, and to transmit data and instructions to, a data storage system, at least one input device, and at least one output device.
- a computer program is a set of instructions that can be used, directly or indirectly, in a computer to perform a certain activity or bring about a certain result.
- a computer program can be written in any form of programming language, including compiled or interpreted languages, and it can be deployed in any form, including as a stand-alone program or as a module, component, subroutine, or other unit suitable for use in a computing environment.
- Suitable processors for the execution of a program of instructions include, by way of example, both general and special purpose microprocessors, and the sole processor or one of multiple processors of any kind of computer.
- a processor will receive instructions and data from a read-only memory or a random access memory or both.
- the essential elements of a computer are a processor for executing instructions and one or more memories for storing instructions and data.
- a computer will also include, or be operatively coupled to communicate with, one or more mass storage devices for storing data files; such devices include magnetic disks, such as internal hard disks and removable disks; magneto-optical disks; and optical disks.
- Storage devices suitable for tangibly embodying computer program instructions and data include all forms of non-volatile memory, including by way of example semiconductor memory devices, such as EPROM, EEPROM, and flash memory devices; magnetic disks such as internal hard disks and removable disks; magneto-optical disks; and CD-ROM and DVD-ROM disks.
- semiconductor memory devices such as EPROM, EEPROM, and flash memory devices
- magnetic disks such as internal hard disks and removable disks
- magneto-optical disks and CD-ROM and DVD-ROM disks.
- the processor and the memory can be supplemented by, or incorporated in, ASICs (application-specific integrated circuits).
- ASICs application-specific integrated circuits
- the features can be implemented on a computer having a display device such as a CRT (cathode ray tube) or LCD (liquid crystal display) monitor for displaying information to the user and a keyboard and a pointing device such as a mouse or a trackball by which the user can provide input to the computer.
- a display device such as a CRT (cathode ray tube) or LCD (liquid crystal display) monitor for displaying information to the user and a keyboard and a pointing device such as a mouse or a trackball by which the user can provide input to the computer.
- the features can be implemented in a computer system that includes a back-end component, such as a data server, or that includes a middleware component, such as an application server or an Internet server, or that includes a front-end component, such as a client computer having a graphical user interface or an Internet browser, or any combination of them.
- the components of the system can be connected by any form or medium of digital data communication such as a communication network. Examples of communication networks include, e.g., a LAN, a WAN, and the computers and networks forming the Internet.
- the computer system can include clients and servers.
- a client and server are generally remote from each other and typically interact through a network, such as the described one.
- the relationship of client and server arises by virtue of computer programs running on the respective computers and having a client-server relationship to each other.
- an alert can be transmitted to a user for investigation.
- an email can be transmitted to a user stating that an IP address IP x has an unusually high click-through rate for advertisements.
- the alert may include a percentage that indicates how unusual a particular networking characteristic is in a distribution of the all of the logged network traffic.
- the email transmitted to the user can include a percentage indicating that the click-through rate for IP x is in the 99 th percentile of all logged click-through rates.
- the above described systems and methods can be used to detect various forms of networking fraud, such as click fraud, denial of service fraud, and also used in other computer-aided anomaly detection, where there are distinct streams of activity characterized by particular signals, or characteristics.
- the systems and techniques can be used to detect anomalies contexts other than fraud, such as in a nuclear power plant context.
- a nuclear power plant can produce electricity using heat from a controlled nuclear reaction.
- the nuclear reaction can produce heat that boils water, and the resulting steam can rotate a turbine that produces electricity using a dynamo.
- Power plants can be extremely large, complicated ensembles and may be monitored for dangerous or failure conditions.
- One or more control panels at the nuclear power plant may display or log various characteristics to be monitored, such as temperature and pressure at various points in the reactor, water coolant temperature and pressure (for water cooled reactors), temperature and diameter of the graphite rods (for graphite cooled reactors), pressure of CO 2 (for gas cooled reactors), concentration of lead any leaked around the plant (for lead cooled reactors), concentration of potentially dangerous water vapors around the reactor (for sodium cooled reactors), radiation output at various points in the reactor, by particle type (alpha, gamma, etc.), steam pressure in the pressure vessel, rotational speed of the electrical generator shaft, amount of water leaving the condenser as a result of steam condensation, and electrical power (watts) demand for output points from the nuclear power plant.
- water coolant temperature and pressure for water cooled reactors
- temperature and diameter of the graphite rods for graphite cooled reactors
- pressure of CO 2 for gas cooled reactors
- concentration of lead any leaked around the plant for lead cooled reactors
- the described system and methods can be used to record the range of each measure across multiple similar power plants and used to record the historical range of each measure for the particular power plant that is monitored. Additionally, cutoffs, or thresholds, can be computed for these measures as described. In certain implementations, if the recorded value of a measure exceeds its cutoff, an alert can be output. The more alerts that are output, the greater the probability that the nuclear plant is experiencing an anomalous event.
- different automated responses are generated based on a function of the number of alerts output. For example, if three alerts are output that indicate three characteristics are anomalous, an interface can output an automated response to warn an operator. If five alerts are output, the power plant can initiate a shutdown.
- the systems and methods can be used in an air traffic control context, where the measured metrics can include inflow and outflow of passengers or planes, weight or number of luggage per passenger, etc.
- the systems and methods can be used in a greenhouse context, where the measured metrics can be temperature, CO 2 concentration, etc. Accordingly, other implementations are within the scope of the following claims.
Abstract
Description
-
- Generate all permutations P1, . . . , Pp of the anomalous, non-correlated bits of Ix Consider only those permutations of some minimum size (e.g., 3)
- For each permutation Py in {P1, . . . , Pp}
- Insert a record containing Ix in a hashtable using Py as the key
- If Py is already keyed in the hashtable, add Ix to the Py record
- End For
Claims (20)
Priority Applications (1)
| Application Number | Priority Date | Filing Date | Title |
|---|---|---|---|
| US11/618,607 US7523016B1 (en) | 2006-12-29 | 2006-12-29 | Detecting anomalies |
Applications Claiming Priority (1)
| Application Number | Priority Date | Filing Date | Title |
|---|---|---|---|
| US11/618,607 US7523016B1 (en) | 2006-12-29 | 2006-12-29 | Detecting anomalies |
Publications (1)
| Publication Number | Publication Date |
|---|---|
| US7523016B1 true US7523016B1 (en) | 2009-04-21 |
Family
ID=40550460
Family Applications (1)
| Application Number | Title | Priority Date | Filing Date |
|---|---|---|---|
| US11/618,607 Active US7523016B1 (en) | 2006-12-29 | 2006-12-29 | Detecting anomalies |
Country Status (1)
| Country | Link |
|---|---|
| US (1) | US7523016B1 (en) |
Cited By (201)
| Publication number | Priority date | Publication date | Assignee | Title |
|---|---|---|---|---|
| US20070192217A1 (en) * | 2006-01-31 | 2007-08-16 | O'kelley Charles Brian | Entity linking in open exchange platforms |
| US20070198350A1 (en) * | 2006-01-31 | 2007-08-23 | O'kelley Charles Brian | Global constraints in open exchange platforms |
| US20080209274A1 (en) * | 2002-09-17 | 2008-08-28 | International Business Machines Corporation | Device, System and Method for Predictive Failure Analysis |
| US20080250497A1 (en) * | 2007-03-30 | 2008-10-09 | Netqos, Inc. | Statistical method and system for network anomaly detection |
| US20080267207A1 (en) * | 2007-04-27 | 2008-10-30 | Yahoo! Inc. | Context-sensitive, self-adjusting targeting models |
| US20090012852A1 (en) * | 2007-07-03 | 2009-01-08 | Right Media, Inc. | Data marketplace and broker fees |
| US20090013031A1 (en) * | 2007-07-03 | 2009-01-08 | Right Media, Inc. | Inferring legitimacy of web-based resource requests |
| US20090012853A1 (en) * | 2007-07-03 | 2009-01-08 | Right Media, Inc. | Inferring legitimacy of advertisement calls |
| US20090018907A1 (en) * | 2007-07-11 | 2009-01-15 | Right Media, Inc. | Managing impression defaults |
| US20090024971A1 (en) * | 2007-07-16 | 2009-01-22 | Willner Barry E | Cursor path vector analysis for detecting click fraud |
| US20090024460A1 (en) * | 2007-07-16 | 2009-01-22 | Willner Barry E | Cursor path vector analysis for detecting click fraud |
| US20090024461A1 (en) * | 2007-07-16 | 2009-01-22 | Willner Barry E | Cursor path vector analysis for detecting click fraud |
| US20090299967A1 (en) * | 2008-06-02 | 2009-12-03 | Microsoft Corporation | User advertisement click behavior modeling |
| US20100100615A1 (en) * | 2008-10-17 | 2010-04-22 | Samsung Electronics Co., Ltd. | Apparatus and method for managing advertisement application |
| US7761558B1 (en) * | 2006-06-30 | 2010-07-20 | Google Inc. | Determining a number of users behind a set of one or more internet protocol (IP) addresses |
| US20110016015A1 (en) * | 2009-07-15 | 2011-01-20 | Alvaro Bolivar | System and method for verifying bidding price |
| US7895227B1 (en) * | 2007-04-27 | 2011-02-22 | Intuit Inc. | System and method for detecting trends in network-based content |
| US7920983B1 (en) | 2010-03-04 | 2011-04-05 | TaKaDu Ltd. | System and method for monitoring resources in a water utility network |
| US20110099169A1 (en) * | 2009-10-22 | 2011-04-28 | Verisign, Inc. | Method and system for clustering transactions in a fraud detection system |
| US20110099628A1 (en) * | 2009-10-22 | 2011-04-28 | Verisign, Inc. | Method and system for weighting transactions in a fraud detection system |
| US20110125658A1 (en) * | 2009-11-25 | 2011-05-26 | Verisign, Inc. | Method and System for Performing Fraud Detection for Users with Infrequent Activity |
| US20110208714A1 (en) * | 2010-02-19 | 2011-08-25 | c/o Microsoft Corporation | Large scale search bot detection |
| US8103543B1 (en) | 2006-09-19 | 2012-01-24 | Gere Dev. Applications, LLC | Click fraud detection |
| US20120023566A1 (en) * | 2008-04-21 | 2012-01-26 | Sentrybay Limited | Fraudulent Page Detection |
| US8341106B1 (en) | 2011-12-07 | 2012-12-25 | TaKaDu Ltd. | System and method for identifying related events in a resource network monitoring system |
| US20130117282A1 (en) * | 2011-11-08 | 2013-05-09 | Verisign, Inc. | System and method for detecting dns traffic anomalies |
| US8583386B2 (en) | 2011-01-18 | 2013-11-12 | TaKaDu Ltd. | System and method for identifying likely geographical locations of anomalies in a water utility network |
| US20140325643A1 (en) * | 2013-04-26 | 2014-10-30 | Palo Alto Research Center Incorporated | Detecting anomalies in work practice data by combining multiple domains of information |
| US9053519B2 (en) | 2012-02-13 | 2015-06-09 | TaKaDu Ltd. | System and method for analyzing GIS data to improve operation and monitoring of water distribution networks |
| US20150244733A1 (en) * | 2014-02-21 | 2015-08-27 | Verisign Inc. | Systems and methods for behavior-based automated malware analysis and classification |
| US9276840B2 (en) | 2013-10-30 | 2016-03-01 | Palo Alto Research Center Incorporated | Interest messages with a payload for a named data network |
| US9311377B2 (en) | 2013-11-13 | 2016-04-12 | Palo Alto Research Center Incorporated | Method and apparatus for performing server handoff in a name-based content distribution system |
| US9363179B2 (en) | 2014-03-26 | 2016-06-07 | Palo Alto Research Center Incorporated | Multi-publisher routing protocol for named data networks |
| US9363086B2 (en) | 2014-03-31 | 2016-06-07 | Palo Alto Research Center Incorporated | Aggregate signing of data in content centric networking |
| US20160173508A1 (en) * | 2013-09-27 | 2016-06-16 | Emc Corporation | Dynamic malicious application detection in storage systems |
| US9374304B2 (en) | 2014-01-24 | 2016-06-21 | Palo Alto Research Center Incorporated | End-to end route tracing over a named-data network |
| US9379979B2 (en) | 2014-01-14 | 2016-06-28 | Palo Alto Research Center Incorporated | Method and apparatus for establishing a virtual interface for a set of mutual-listener devices |
| US9391777B2 (en) | 2014-08-15 | 2016-07-12 | Palo Alto Research Center Incorporated | System and method for performing key resolution over a content centric network |
| US9390289B2 (en) | 2014-04-07 | 2016-07-12 | Palo Alto Research Center Incorporated | Secure collection synchronization using matched network names |
| US9391896B2 (en) | 2014-03-10 | 2016-07-12 | Palo Alto Research Center Incorporated | System and method for packet forwarding using a conjunctive normal form strategy in a content-centric network |
| US9401864B2 (en) | 2013-10-31 | 2016-07-26 | Palo Alto Research Center Incorporated | Express header for packets with hierarchically structured variable-length identifiers |
| US9407549B2 (en) | 2013-10-29 | 2016-08-02 | Palo Alto Research Center Incorporated | System and method for hash-based forwarding of packets with hierarchically structured variable-length identifiers |
| US9407432B2 (en) | 2014-03-19 | 2016-08-02 | Palo Alto Research Center Incorporated | System and method for efficient and secure distribution of digital content |
| US9426113B2 (en) | 2014-06-30 | 2016-08-23 | Palo Alto Research Center Incorporated | System and method for managing devices over a content centric network |
| US9444722B2 (en) | 2013-08-01 | 2016-09-13 | Palo Alto Research Center Incorporated | Method and apparatus for configuring routing paths in a custodian-based routing architecture |
| US9451032B2 (en) | 2014-04-10 | 2016-09-20 | Palo Alto Research Center Incorporated | System and method for simple service discovery in content-centric networks |
| US9456054B2 (en) | 2008-05-16 | 2016-09-27 | Palo Alto Research Center Incorporated | Controlling the spread of interests and content in a content centric network |
| US9455835B2 (en) | 2014-05-23 | 2016-09-27 | Palo Alto Research Center Incorporated | System and method for circular link resolution with hash-based names in content-centric networks |
| US9462006B2 (en) | 2015-01-21 | 2016-10-04 | Palo Alto Research Center Incorporated | Network-layer application-specific trust model |
| US9467492B2 (en) | 2014-08-19 | 2016-10-11 | Palo Alto Research Center Incorporated | System and method for reconstructable all-in-one content stream |
| US9473576B2 (en) | 2014-04-07 | 2016-10-18 | Palo Alto Research Center Incorporated | Service discovery using collection synchronization with exact names |
| US9471544B1 (en) | 2012-05-24 | 2016-10-18 | Google Inc. | Anomaly detection in a signal |
| US9473475B2 (en) | 2014-12-22 | 2016-10-18 | Palo Alto Research Center Incorporated | Low-cost authenticated signing delegation in content centric networking |
| US9473405B2 (en) | 2014-03-10 | 2016-10-18 | Palo Alto Research Center Incorporated | Concurrent hashes and sub-hashes on data streams |
| US9497282B2 (en) | 2014-08-27 | 2016-11-15 | Palo Alto Research Center Incorporated | Network coding for content-centric network |
| US9503358B2 (en) | 2013-12-05 | 2016-11-22 | Palo Alto Research Center Incorporated | Distance-based routing in an information-centric network |
| US9503365B2 (en) | 2014-08-11 | 2016-11-22 | Palo Alto Research Center Incorporated | Reputation-based instruction processing over an information centric network |
| US9516144B2 (en) | 2014-06-19 | 2016-12-06 | Palo Alto Research Center Incorporated | Cut-through forwarding of CCNx message fragments with IP encapsulation |
| US9536059B2 (en) | 2014-12-15 | 2017-01-03 | Palo Alto Research Center Incorporated | Method and system for verifying renamed content using manifests in a content centric network |
| US9535968B2 (en) | 2014-07-21 | 2017-01-03 | Palo Alto Research Center Incorporated | System for distributing nameless objects using self-certifying names |
| US9537719B2 (en) | 2014-06-19 | 2017-01-03 | Palo Alto Research Center Incorporated | Method and apparatus for deploying a minimal-cost CCN topology |
| US9553812B2 (en) | 2014-09-09 | 2017-01-24 | Palo Alto Research Center Incorporated | Interest keep alives at intermediate routers in a CCN |
| US9552493B2 (en) | 2015-02-03 | 2017-01-24 | Palo Alto Research Center Incorporated | Access control framework for information centric networking |
| US9571368B2 (en) | 2013-02-04 | 2017-02-14 | International Business Machines Corporation | Analysis of variance in network page access |
| US9590948B2 (en) | 2014-12-15 | 2017-03-07 | Cisco Systems, Inc. | CCN routing using hardware-assisted hash tables |
| US9590887B2 (en) | 2014-07-18 | 2017-03-07 | Cisco Systems, Inc. | Method and system for keeping interest alive in a content centric network |
| US9602596B2 (en) | 2015-01-12 | 2017-03-21 | Cisco Systems, Inc. | Peer-to-peer sharing in a content centric network |
| US9609014B2 (en) | 2014-05-22 | 2017-03-28 | Cisco Systems, Inc. | Method and apparatus for preventing insertion of malicious content at a named data network router |
| US9614742B1 (en) | 2013-03-14 | 2017-04-04 | Google Inc. | Anomaly detection in time series data |
| US9621354B2 (en) | 2014-07-17 | 2017-04-11 | Cisco Systems, Inc. | Reconstructable content objects |
| US9626413B2 (en) | 2014-03-10 | 2017-04-18 | Cisco Systems, Inc. | System and method for ranking content popularity in a content-centric network |
| US9628499B1 (en) * | 2012-08-08 | 2017-04-18 | Google Inc. | Statistics-based anomaly detection |
| US9633204B2 (en) * | 2015-05-07 | 2017-04-25 | Paypal, Inc. | Method and system for log aggregation |
| US9660825B2 (en) | 2014-12-24 | 2017-05-23 | Cisco Technology, Inc. | System and method for multi-source multicasting in content-centric networks |
| US9678998B2 (en) | 2014-02-28 | 2017-06-13 | Cisco Technology, Inc. | Content name resolution for information centric networking |
| US9686194B2 (en) | 2009-10-21 | 2017-06-20 | Cisco Technology, Inc. | Adaptive multi-interface use for content networking |
| US9692674B1 (en) | 2013-12-30 | 2017-06-27 | Google Inc. | Non-parametric change point detection |
| US9699198B2 (en) | 2014-07-07 | 2017-07-04 | Cisco Technology, Inc. | System and method for parallel secure content bootstrapping in content-centric networks |
| WO2017060778A3 (en) * | 2015-09-05 | 2017-07-20 | Nudata Security Inc. | Systems and methods for detecting and scoring anomalies |
| US9716622B2 (en) | 2014-04-01 | 2017-07-25 | Cisco Technology, Inc. | System and method for dynamic name configuration in content-centric networks |
| US9729616B2 (en) | 2014-07-18 | 2017-08-08 | Cisco Technology, Inc. | Reputation-based strategy for forwarding and responding to interests over a content centric network |
| US9729662B2 (en) | 2014-08-11 | 2017-08-08 | Cisco Technology, Inc. | Probabilistic lazy-forwarding technique without validation in a content centric network |
| EP3223495A1 (en) * | 2016-03-21 | 2017-09-27 | Light Cyber Ltd | Detecting an anomalous activity within a computer network |
| US9794238B2 (en) | 2015-10-29 | 2017-10-17 | Cisco Technology, Inc. | System for key exchange in a content centric network |
| US9800637B2 (en) | 2014-08-19 | 2017-10-24 | Cisco Technology, Inc. | System and method for all-in-one content stream in content-centric networks |
| US9807205B2 (en) | 2015-11-02 | 2017-10-31 | Cisco Technology, Inc. | Header compression for CCN messages using dictionary |
| US9832123B2 (en) | 2015-09-11 | 2017-11-28 | Cisco Technology, Inc. | Network named fragments in a content centric network |
| US9832116B2 (en) | 2016-03-14 | 2017-11-28 | Cisco Technology, Inc. | Adjusting entries in a forwarding information base in a content centric network |
| US9832291B2 (en) | 2015-01-12 | 2017-11-28 | Cisco Technology, Inc. | Auto-configurable transport stack |
| US9836540B2 (en) | 2014-03-04 | 2017-12-05 | Cisco Technology, Inc. | System and method for direct storage access in a content-centric network |
| US9842204B2 (en) | 2008-04-01 | 2017-12-12 | Nudata Security Inc. | Systems and methods for assessing security risk |
| US9846881B2 (en) | 2014-12-19 | 2017-12-19 | Palo Alto Research Center Incorporated | Frugal user engagement help systems |
| US9882964B2 (en) | 2014-08-08 | 2018-01-30 | Cisco Technology, Inc. | Explicit strategy feedback in name-based forwarding |
| US9912776B2 (en) | 2015-12-02 | 2018-03-06 | Cisco Technology, Inc. | Explicit content deletion commands in a content centric network |
| US9916457B2 (en) | 2015-01-12 | 2018-03-13 | Cisco Technology, Inc. | Decoupled name security binding for CCN objects |
| US9916601B2 (en) | 2014-03-21 | 2018-03-13 | Cisco Technology, Inc. | Marketplace for presenting advertisements in a scalable data broadcasting system |
| US9930146B2 (en) | 2016-04-04 | 2018-03-27 | Cisco Technology, Inc. | System and method for compressing content centric networking messages |
| US9935791B2 (en) | 2013-05-20 | 2018-04-03 | Cisco Technology, Inc. | Method and system for name resolution across heterogeneous architectures |
| US9949301B2 (en) | 2016-01-20 | 2018-04-17 | Palo Alto Research Center Incorporated | Methods for fast, secure and privacy-friendly internet connection discovery in wireless networks |
| US9946743B2 (en) | 2015-01-12 | 2018-04-17 | Cisco Technology, Inc. | Order encoded manifests in a content centric network |
| US9946864B2 (en) | 2008-04-01 | 2018-04-17 | Nudata Security Inc. | Systems and methods for implementing and tracking identification tests |
| US9954678B2 (en) | 2014-02-06 | 2018-04-24 | Cisco Technology, Inc. | Content-based transport security |
| US9954795B2 (en) | 2015-01-12 | 2018-04-24 | Cisco Technology, Inc. | Resource allocation using CCN manifests |
| US9959156B2 (en) | 2014-07-17 | 2018-05-01 | Cisco Technology, Inc. | Interest return control message |
| US9977809B2 (en) | 2015-09-24 | 2018-05-22 | Cisco Technology, Inc. | Information and data framework in a content centric network |
| US9979739B2 (en) | 2013-01-16 | 2018-05-22 | Palo Alto Networks (Israel Analytics) Ltd. | Automated forensics of computer systems using behavioral intelligence |
| US9986034B2 (en) | 2015-08-03 | 2018-05-29 | Cisco Technology, Inc. | Transferring state in content centric network stacks |
| US9992097B2 (en) | 2016-07-11 | 2018-06-05 | Cisco Technology, Inc. | System and method for piggybacking routing information in interests in a content centric network |
| US9992281B2 (en) | 2014-05-01 | 2018-06-05 | Cisco Technology, Inc. | Accountable content stores for information centric networks |
| US9990487B1 (en) | 2017-05-05 | 2018-06-05 | Mastercard Technologies Canada ULC | Systems and methods for distinguishing among human users and software robots |
| US10003520B2 (en) | 2014-12-22 | 2018-06-19 | Cisco Technology, Inc. | System and method for efficient name-based content routing using link-state information in information-centric networks |
| US10003507B2 (en) | 2016-03-04 | 2018-06-19 | Cisco Technology, Inc. | Transport session state protocol |
| US10007776B1 (en) | 2017-05-05 | 2018-06-26 | Mastercard Technologies Canada ULC | Systems and methods for distinguishing among human users and software robots |
| US10009266B2 (en) | 2016-07-05 | 2018-06-26 | Cisco Technology, Inc. | Method and system for reference counted pending interest tables in a content centric network |
| US10009446B2 (en) | 2015-11-02 | 2018-06-26 | Cisco Technology, Inc. | Header compression for CCN messages using dictionary learning |
| EP3343422A1 (en) * | 2016-12-30 | 2018-07-04 | Capital One Services, LLC | Systems and methods for detecting resources responsible for events |
| US10021222B2 (en) | 2015-11-04 | 2018-07-10 | Cisco Technology, Inc. | Bit-aligned header compression for CCN messages using dictionary |
| US10027578B2 (en) | 2016-04-11 | 2018-07-17 | Cisco Technology, Inc. | Method and system for routable prefix queries in a content centric network |
| EP3242240A4 (en) * | 2015-02-04 | 2018-07-18 | Nippon Telegraph and Telephone Corporation | Malicious communication pattern extraction device, malicious communication pattern extraction system, malicious communication pattern extraction method and malicious communication pattern extraction program |
| US10033639B2 (en) | 2016-03-25 | 2018-07-24 | Cisco Technology, Inc. | System and method for routing packets in a content centric network using anonymous datagrams |
| US10033642B2 (en) | 2016-09-19 | 2018-07-24 | Cisco Technology, Inc. | System and method for making optimal routing decisions based on device-specific parameters in a content centric network |
| US10038633B2 (en) | 2016-03-04 | 2018-07-31 | Cisco Technology, Inc. | Protocol to query for historical network information in a content centric network |
| US20180218369A1 (en) * | 2017-02-01 | 2018-08-02 | Google Inc. | Detecting fraudulent data |
| US10043016B2 (en) | 2016-02-29 | 2018-08-07 | Cisco Technology, Inc. | Method and system for name encryption agreement in a content centric network |
| US10051071B2 (en) | 2016-03-04 | 2018-08-14 | Cisco Technology, Inc. | Method and system for collecting historical network information in a content centric network |
| US10063414B2 (en) | 2016-05-13 | 2018-08-28 | Cisco Technology, Inc. | Updating a transport stack in a content centric network |
| US10067948B2 (en) | 2016-03-18 | 2018-09-04 | Cisco Technology, Inc. | Data deduping in content centric networking manifests |
| US10069933B2 (en) | 2014-10-23 | 2018-09-04 | Cisco Technology, Inc. | System and method for creating virtual interfaces based on network characteristics |
| US10069729B2 (en) | 2016-08-08 | 2018-09-04 | Cisco Technology, Inc. | System and method for throttling traffic based on a forwarding information base in a content centric network |
| US10075401B2 (en) | 2015-03-18 | 2018-09-11 | Cisco Technology, Inc. | Pending interest table behavior |
| US10075402B2 (en) | 2015-06-24 | 2018-09-11 | Cisco Technology, Inc. | Flexible command and control in content centric networks |
| US10075521B2 (en) | 2014-04-07 | 2018-09-11 | Cisco Technology, Inc. | Collection synchronization using equality matched network names |
| US10078062B2 (en) | 2015-12-15 | 2018-09-18 | Palo Alto Research Center Incorporated | Device health estimation by combining contextual information with sensor data |
| US10084764B2 (en) | 2016-05-13 | 2018-09-25 | Cisco Technology, Inc. | System for a secure encryption proxy in a content centric network |
| US10089651B2 (en) | 2014-03-03 | 2018-10-02 | Cisco Technology, Inc. | Method and apparatus for streaming advertisements in a scalable data broadcasting system |
| US10091330B2 (en) | 2016-03-23 | 2018-10-02 | Cisco Technology, Inc. | Interest scheduling by an information and data framework in a content centric network |
| US10089655B2 (en) | 2013-11-27 | 2018-10-02 | Cisco Technology, Inc. | Method and apparatus for scalable data broadcasting |
| US10097346B2 (en) | 2015-12-09 | 2018-10-09 | Cisco Technology, Inc. | Key catalogs in a content centric network |
| US10097521B2 (en) | 2015-11-20 | 2018-10-09 | Cisco Technology, Inc. | Transparent encryption in a content centric network |
| US10098051B2 (en) | 2014-01-22 | 2018-10-09 | Cisco Technology, Inc. | Gateways and routing in software-defined manets |
| US10101801B2 (en) | 2013-11-13 | 2018-10-16 | Cisco Technology, Inc. | Method and apparatus for prefetching content in a data stream |
| US10103989B2 (en) | 2016-06-13 | 2018-10-16 | Cisco Technology, Inc. | Content object return messages in a content centric network |
| US10116605B2 (en) | 2015-06-22 | 2018-10-30 | Cisco Technology, Inc. | Transport stack name scheme and identity management |
| US20180316727A1 (en) * | 2017-04-30 | 2018-11-01 | Splunk Inc. | Enabling user definition of anomaly action rules in a network security system |
| US10122624B2 (en) | 2016-07-25 | 2018-11-06 | Cisco Technology, Inc. | System and method for ephemeral entries in a forwarding information base in a content centric network |
| US10127373B1 (en) | 2017-05-05 | 2018-11-13 | Mastercard Technologies Canada ULC | Systems and methods for distinguishing among human users and software robots |
| US10129365B2 (en) | 2013-11-13 | 2018-11-13 | Cisco Technology, Inc. | Method and apparatus for pre-fetching remote content based on static and dynamic recommendations |
| US10135948B2 (en) | 2016-10-31 | 2018-11-20 | Cisco Technology, Inc. | System and method for process migration in a content centric network |
| US10148572B2 (en) | 2016-06-27 | 2018-12-04 | Cisco Technology, Inc. | Method and system for interest groups in a content centric network |
| US10172068B2 (en) | 2014-01-22 | 2019-01-01 | Cisco Technology, Inc. | Service-oriented routing in software-defined MANETs |
| US10204013B2 (en) | 2014-09-03 | 2019-02-12 | Cisco Technology, Inc. | System and method for maintaining a distributed and fault-tolerant state over an information centric network |
| US10212248B2 (en) | 2016-10-03 | 2019-02-19 | Cisco Technology, Inc. | Cache management on high availability routers in a content centric network |
| US10212196B2 (en) | 2016-03-16 | 2019-02-19 | Cisco Technology, Inc. | Interface discovery and authentication in a name-based network |
| US10237189B2 (en) | 2014-12-16 | 2019-03-19 | Cisco Technology, Inc. | System and method for distance-based interest forwarding |
| US10243851B2 (en) | 2016-11-21 | 2019-03-26 | Cisco Technology, Inc. | System and method for forwarder connection information in a content centric network |
| US10242414B2 (en) | 2012-06-12 | 2019-03-26 | TaKaDu Ltd. | Method for locating a leak in a fluid network |
| US10257271B2 (en) | 2016-01-11 | 2019-04-09 | Cisco Technology, Inc. | Chandra-Toueg consensus in a content centric network |
| US10263965B2 (en) | 2015-10-16 | 2019-04-16 | Cisco Technology, Inc. | Encrypted CCNx |
| US10305864B2 (en) | 2016-01-25 | 2019-05-28 | Cisco Technology, Inc. | Method and system for interest encryption in a content centric network |
| US10305865B2 (en) | 2016-06-21 | 2019-05-28 | Cisco Technology, Inc. | Permutation-based content encryption with manifests in a content centric network |
| US10313227B2 (en) | 2015-09-24 | 2019-06-04 | Cisco Technology, Inc. | System and method for eliminating undetected interest looping in information-centric networks |
| US10320675B2 (en) | 2016-05-04 | 2019-06-11 | Cisco Technology, Inc. | System and method for routing packets in a stateless content centric network |
| US10320760B2 (en) | 2016-04-01 | 2019-06-11 | Cisco Technology, Inc. | Method and system for mutating and caching content in a content centric network |
| US10333840B2 (en) | 2015-02-06 | 2019-06-25 | Cisco Technology, Inc. | System and method for on-demand content exchange with adaptive naming in information-centric networks |
| US10341372B2 (en) * | 2017-06-12 | 2019-07-02 | International Business Machines Corporation | Clustering for detection of anomalous behavior and insider threat |
| US10355999B2 (en) | 2015-09-23 | 2019-07-16 | Cisco Technology, Inc. | Flow control with network named fragments |
| US10356106B2 (en) | 2011-07-26 | 2019-07-16 | Palo Alto Networks (Israel Analytics) Ltd. | Detecting anomaly action within a computer network |
| US20190238396A1 (en) * | 2018-01-29 | 2019-08-01 | Cisco Technology, Inc. | Using random forests to generate rules for causation analysis of network anomalies |
| US10404450B2 (en) | 2016-05-02 | 2019-09-03 | Cisco Technology, Inc. | Schematized access control in a content centric network |
| US10425503B2 (en) | 2016-04-07 | 2019-09-24 | Cisco Technology, Inc. | Shared pending interest table in a content centric network |
| US10430839B2 (en) | 2012-12-12 | 2019-10-01 | Cisco Technology, Inc. | Distributed advertisement insertion in content-centric networks |
| US10447805B2 (en) | 2016-10-10 | 2019-10-15 | Cisco Technology, Inc. | Distributed consensus in a content centric network |
| US10454820B2 (en) | 2015-09-29 | 2019-10-22 | Cisco Technology, Inc. | System and method for stateless information-centric networking |
| US10516684B1 (en) * | 2016-04-21 | 2019-12-24 | Instart Logic, Inc. | Recommending and prioritizing computer log anomalies |
| US10547589B2 (en) | 2016-05-09 | 2020-01-28 | Cisco Technology, Inc. | System for implementing a small computer systems interface protocol over a content centric network |
| US10610144B2 (en) | 2015-08-19 | 2020-04-07 | Palo Alto Research Center Incorporated | Interactive remote patient monitoring and condition management intervention system |
| US10636052B2 (en) * | 2013-03-13 | 2020-04-28 | Eversight, Inc. | Automatic mass scale online promotion testing |
| CN111310139A (en) * | 2020-01-21 | 2020-06-19 | 腾讯科技(深圳)有限公司 | Behavior data identification method and device and storage medium |
| US10701038B2 (en) | 2015-07-27 | 2020-06-30 | Cisco Technology, Inc. | Content negotiation in a content centric network |
| US10708302B2 (en) * | 2015-07-27 | 2020-07-07 | Swisscom Ag | Systems and methods for identifying phishing web sites |
| US10742596B2 (en) | 2016-03-04 | 2020-08-11 | Cisco Technology, Inc. | Method and system for reducing a collision probability of hash-based names using a publisher identifier |
| US10956412B2 (en) | 2016-08-09 | 2021-03-23 | Cisco Technology, Inc. | Method and system for conjunctive normal form attribute matching in a content centric network |
| US10958674B2 (en) | 2017-04-30 | 2021-03-23 | Splunk Inc. | User interface for defining anomaly action rules in a network security system |
| US10999304B2 (en) | 2018-04-11 | 2021-05-04 | Palo Alto Networks (Israel Analytics) Ltd. | Bind shell attack detection |
| US11041839B2 (en) | 2015-06-05 | 2021-06-22 | Mueller International, Llc | Distribution system monitoring |
| US11070569B2 (en) | 2019-01-30 | 2021-07-20 | Palo Alto Networks (Israel Analytics) Ltd. | Detecting outlier pairs of scanned ports |
| US20210295379A1 (en) * | 2020-03-17 | 2021-09-23 | Com Olho It Private Limited | System and method for detecting fraudulent advertisement traffic |
| US11184376B2 (en) | 2019-01-30 | 2021-11-23 | Palo Alto Networks (Israel Analytics) Ltd. | Port scan detection using destination profiles |
| US11184378B2 (en) | 2019-01-30 | 2021-11-23 | Palo Alto Networks (Israel Analytics) Ltd. | Scanner probe detection |
| US11184377B2 (en) | 2019-01-30 | 2021-11-23 | Palo Alto Networks (Israel Analytics) Ltd. | Malicious port scan detection using source profiles |
| US11255835B2 (en) | 2013-03-15 | 2022-02-22 | Mueller International, Llc | Systems for measuring properties of water in a water distribution system |
| US11263069B1 (en) * | 2013-06-21 | 2022-03-01 | Amazon Technologies, Inc. | Using unsupervised learning to monitor changes in fleet behavior |
| US11316872B2 (en) | 2019-01-30 | 2022-04-26 | Palo Alto Networks (Israel Analytics) Ltd. | Malicious port scan detection using port profiles |
| US11392435B2 (en) | 2018-06-07 | 2022-07-19 | Hewlett-Packard Development Company, L.P. | Evaluation of a performance parameter of a monitoring service |
| US11392446B2 (en) | 2019-03-15 | 2022-07-19 | Ebay Inc. | Cross-correlation of metrics for anomaly root cause identification |
| US11436656B2 (en) | 2016-03-18 | 2022-09-06 | Palo Alto Research Center Incorporated | System and method for a real-time egocentric collaborative filter on large datasets |
| US11509680B2 (en) | 2020-09-30 | 2022-11-22 | Palo Alto Networks (Israel Analytics) Ltd. | Classification of cyber-alerts into security incidents |
| US11725366B2 (en) | 2020-07-16 | 2023-08-15 | Mueller International, Llc | Remote-operated flushing system |
| US11729207B2 (en) * | 2020-06-12 | 2023-08-15 | Vmware, Inc. | Hierarchical novelty detection using intended states for network security |
| US11799880B2 (en) | 2022-01-10 | 2023-10-24 | Palo Alto Networks (Israel Analytics) Ltd. | Network adaptive alert prioritization system |
| US11856264B2 (en) * | 2016-11-15 | 2023-12-26 | Google Llc | Systems and methods for reducing download requirements |
Citations (9)
| Publication number | Priority date | Publication date | Assignee | Title |
|---|---|---|---|---|
| US5263120A (en) | 1991-04-29 | 1993-11-16 | Bickel Michael A | Adaptive fast fuzzy clustering system |
| US5715397A (en) * | 1994-12-02 | 1998-02-03 | Autoentry Online, Inc. | System and method for data transfer and processing having intelligent selection of processing routing and advanced routing features |
| US6298351B1 (en) | 1997-04-11 | 2001-10-02 | International Business Machines Corporation | Modifying an unreliable training set for supervised classification |
| US6907436B2 (en) | 2000-10-27 | 2005-06-14 | Arizona Board Of Regents, Acting For And On Behalf Of Arizona State University | Method for classifying data using clustering and classification algorithm supervised |
| US20050193281A1 (en) * | 2004-01-30 | 2005-09-01 | International Business Machines Corporation | Anomaly detection |
| US20060161592A1 (en) | 2004-12-22 | 2006-07-20 | Levent Ertoz | Identification of anomalous data records |
| US20060242706A1 (en) | 2005-03-11 | 2006-10-26 | Ross Robert B | Methods and systems for evaluating and generating anomaly detectors |
| US20060293777A1 (en) | 2005-06-07 | 2006-12-28 | International Business Machines Corporation | Automated and adaptive threshold setting |
| US20080077515A1 (en) * | 2006-09-18 | 2008-03-27 | Fair Isaac Corporation | Self-Calibrating Fraud Detection |
-
2006
- 2006-12-29 US US11/618,607 patent/US7523016B1/en active Active
Patent Citations (9)
| Publication number | Priority date | Publication date | Assignee | Title |
|---|---|---|---|---|
| US5263120A (en) | 1991-04-29 | 1993-11-16 | Bickel Michael A | Adaptive fast fuzzy clustering system |
| US5715397A (en) * | 1994-12-02 | 1998-02-03 | Autoentry Online, Inc. | System and method for data transfer and processing having intelligent selection of processing routing and advanced routing features |
| US6298351B1 (en) | 1997-04-11 | 2001-10-02 | International Business Machines Corporation | Modifying an unreliable training set for supervised classification |
| US6907436B2 (en) | 2000-10-27 | 2005-06-14 | Arizona Board Of Regents, Acting For And On Behalf Of Arizona State University | Method for classifying data using clustering and classification algorithm supervised |
| US20050193281A1 (en) * | 2004-01-30 | 2005-09-01 | International Business Machines Corporation | Anomaly detection |
| US20060161592A1 (en) | 2004-12-22 | 2006-07-20 | Levent Ertoz | Identification of anomalous data records |
| US20060242706A1 (en) | 2005-03-11 | 2006-10-26 | Ross Robert B | Methods and systems for evaluating and generating anomaly detectors |
| US20060293777A1 (en) | 2005-06-07 | 2006-12-28 | International Business Machines Corporation | Automated and adaptive threshold setting |
| US20080077515A1 (en) * | 2006-09-18 | 2008-03-27 | Fair Isaac Corporation | Self-Calibrating Fraud Detection |
Non-Patent Citations (3)
| Title |
|---|
| Artificial Neural Networks for Misuse Detection, by James Candy, in Proceedings of the 1998 National Information Systems Security Conference (NISSC'98), pp. 443-456, Oct. 5-8 1998. Arlington, VA. |
| NSOM: A Real-Time Network-Based Instrusion Detection System Using Self-Organizing Maps, by Labib et al., for Department of Applied Science, University of California, Davis, 6 pages, 2002. |
| Unsupervised learning techniques for an intrusion detection system, by Zanero et al., for Dipartimento di Elettronica e Informazione, Politecnico di Milano, Copyright 2004, 8 pages. |
Cited By (282)
| Publication number | Priority date | Publication date | Assignee | Title |
|---|---|---|---|---|
| US20080209274A1 (en) * | 2002-09-17 | 2008-08-28 | International Business Machines Corporation | Device, System and Method for Predictive Failure Analysis |
| US7739549B2 (en) * | 2002-09-17 | 2010-06-15 | International Business Machines Corporation | Device, system and method for predictive failure analysis |
| US20070198350A1 (en) * | 2006-01-31 | 2007-08-23 | O'kelley Charles Brian | Global constraints in open exchange platforms |
| US20070192217A1 (en) * | 2006-01-31 | 2007-08-16 | O'kelley Charles Brian | Entity linking in open exchange platforms |
| US9152977B2 (en) | 2006-06-16 | 2015-10-06 | Gere Dev. Applications, LLC | Click fraud detection |
| US8661119B1 (en) * | 2006-06-30 | 2014-02-25 | Google Inc. | Determining a number of users behind a set of one or more internet protocol (IP) addresses |
| US7761558B1 (en) * | 2006-06-30 | 2010-07-20 | Google Inc. | Determining a number of users behind a set of one or more internet protocol (IP) addresses |
| US8682718B2 (en) | 2006-09-19 | 2014-03-25 | Gere Dev. Applications, LLC | Click fraud detection |
| US8103543B1 (en) | 2006-09-19 | 2012-01-24 | Gere Dev. Applications, LLC | Click fraud detection |
| US20080250497A1 (en) * | 2007-03-30 | 2008-10-09 | Netqos, Inc. | Statistical method and system for network anomaly detection |
| US8601575B2 (en) * | 2007-03-30 | 2013-12-03 | Ca, Inc. | Statistical method and system for network anomaly detection |
| US7895227B1 (en) * | 2007-04-27 | 2011-02-22 | Intuit Inc. | System and method for detecting trends in network-based content |
| US20080267207A1 (en) * | 2007-04-27 | 2008-10-30 | Yahoo! Inc. | Context-sensitive, self-adjusting targeting models |
| US7698410B2 (en) * | 2007-04-27 | 2010-04-13 | Yahoo! Inc. | Context-sensitive, self-adjusting targeting models |
| US20090013031A1 (en) * | 2007-07-03 | 2009-01-08 | Right Media, Inc. | Inferring legitimacy of web-based resource requests |
| US20090012853A1 (en) * | 2007-07-03 | 2009-01-08 | Right Media, Inc. | Inferring legitimacy of advertisement calls |
| US20090012852A1 (en) * | 2007-07-03 | 2009-01-08 | Right Media, Inc. | Data marketplace and broker fees |
| US20090018907A1 (en) * | 2007-07-11 | 2009-01-15 | Right Media, Inc. | Managing impression defaults |
| US8935175B2 (en) * | 2007-07-16 | 2015-01-13 | International Business Machines Corporation | Cursor path vector analysis for detecting click fraud |
| US20090024461A1 (en) * | 2007-07-16 | 2009-01-22 | Willner Barry E | Cursor path vector analysis for detecting click fraud |
| US20090024460A1 (en) * | 2007-07-16 | 2009-01-22 | Willner Barry E | Cursor path vector analysis for detecting click fraud |
| US20090024971A1 (en) * | 2007-07-16 | 2009-01-22 | Willner Barry E | Cursor path vector analysis for detecting click fraud |
| US8935176B2 (en) * | 2007-07-16 | 2015-01-13 | International Business Machines Corporation | Cursor path vector analysis for detecting click fraud |
| US8938395B2 (en) * | 2007-07-16 | 2015-01-20 | International Business Machines Corporation | Cursor path vector analysis for detecting click fraud |
| US10997284B2 (en) | 2008-04-01 | 2021-05-04 | Mastercard Technologies Canada ULC | Systems and methods for assessing security risk |
| US9842204B2 (en) | 2008-04-01 | 2017-12-12 | Nudata Security Inc. | Systems and methods for assessing security risk |
| US10839065B2 (en) | 2008-04-01 | 2020-11-17 | Mastercard Technologies Canada ULC | Systems and methods for assessing security risk |
| US11036847B2 (en) | 2008-04-01 | 2021-06-15 | Mastercard Technologies Canada ULC | Systems and methods for assessing security risk |
| US9946864B2 (en) | 2008-04-01 | 2018-04-17 | Nudata Security Inc. | Systems and methods for implementing and tracking identification tests |
| US8806622B2 (en) * | 2008-04-21 | 2014-08-12 | Sentrybay Limited | Fraudulent page detection |
| US20120023566A1 (en) * | 2008-04-21 | 2012-01-26 | Sentrybay Limited | Fraudulent Page Detection |
| US10104041B2 (en) | 2008-05-16 | 2018-10-16 | Cisco Technology, Inc. | Controlling the spread of interests and content in a content centric network |
| US9456054B2 (en) | 2008-05-16 | 2016-09-27 | Palo Alto Research Center Incorporated | Controlling the spread of interests and content in a content centric network |
| US8639570B2 (en) * | 2008-06-02 | 2014-01-28 | Microsoft Corporation | User advertisement click behavior modeling |
| US20090299967A1 (en) * | 2008-06-02 | 2009-12-03 | Microsoft Corporation | User advertisement click behavior modeling |
| US9406070B2 (en) * | 2008-10-17 | 2016-08-02 | Samsung Electronics Co., Ltd. | Apparatus and method for managing advertisement application |
| US20100100615A1 (en) * | 2008-10-17 | 2010-04-22 | Samsung Electronics Co., Ltd. | Apparatus and method for managing advertisement application |
| US20110016015A1 (en) * | 2009-07-15 | 2011-01-20 | Alvaro Bolivar | System and method for verifying bidding price |
| US7953647B2 (en) * | 2009-07-15 | 2011-05-31 | Ebay Inc. | System and method for verifying bidding price |
| US9686194B2 (en) | 2009-10-21 | 2017-06-20 | Cisco Technology, Inc. | Adaptive multi-interface use for content networking |
| US20110099628A1 (en) * | 2009-10-22 | 2011-04-28 | Verisign, Inc. | Method and system for weighting transactions in a fraud detection system |
| US8566322B1 (en) | 2009-10-22 | 2013-10-22 | Symantec Corporation | Method and system for clustering transactions in a fraud detection system |
| US8195664B2 (en) | 2009-10-22 | 2012-06-05 | Symantec Corporation | Method and system for clustering transactions in a fraud detection system |
| US20110099169A1 (en) * | 2009-10-22 | 2011-04-28 | Verisign, Inc. | Method and system for clustering transactions in a fraud detection system |
| US8321360B2 (en) | 2009-10-22 | 2012-11-27 | Symantec Corporation | Method and system for weighting transactions in a fraud detection system |
| US10467687B2 (en) | 2009-11-25 | 2019-11-05 | Symantec Corporation | Method and system for performing fraud detection for users with infrequent activity |
| US20110125658A1 (en) * | 2009-11-25 | 2011-05-26 | Verisign, Inc. | Method and System for Performing Fraud Detection for Users with Infrequent Activity |
| US20110208714A1 (en) * | 2010-02-19 | 2011-08-25 | c/o Microsoft Corporation | Large scale search bot detection |
| US7920983B1 (en) | 2010-03-04 | 2011-04-05 | TaKaDu Ltd. | System and method for monitoring resources in a water utility network |
| US20110215945A1 (en) * | 2010-03-04 | 2011-09-08 | TaKaDu Ltd. | System and method for monitoring resources in a water utility network |
| US9568392B2 (en) | 2010-03-04 | 2017-02-14 | TaKaDu Ltd. | System and method for monitoring resources in a water utility network |
| US8583386B2 (en) | 2011-01-18 | 2013-11-12 | TaKaDu Ltd. | System and method for identifying likely geographical locations of anomalies in a water utility network |
| US10356106B2 (en) | 2011-07-26 | 2019-07-16 | Palo Alto Networks (Israel Analytics) Ltd. | Detecting anomaly action within a computer network |
| US9172716B2 (en) * | 2011-11-08 | 2015-10-27 | Verisign, Inc | System and method for detecting DNS traffic anomalies |
| US20130117282A1 (en) * | 2011-11-08 | 2013-05-09 | Verisign, Inc. | System and method for detecting dns traffic anomalies |
| US8341106B1 (en) | 2011-12-07 | 2012-12-25 | TaKaDu Ltd. | System and method for identifying related events in a resource network monitoring system |
| US9053519B2 (en) | 2012-02-13 | 2015-06-09 | TaKaDu Ltd. | System and method for analyzing GIS data to improve operation and monitoring of water distribution networks |
| US9471544B1 (en) | 2012-05-24 | 2016-10-18 | Google Inc. | Anomaly detection in a signal |
| US10242414B2 (en) | 2012-06-12 | 2019-03-26 | TaKaDu Ltd. | Method for locating a leak in a fluid network |
| US9628499B1 (en) * | 2012-08-08 | 2017-04-18 | Google Inc. | Statistics-based anomaly detection |
| US10430839B2 (en) | 2012-12-12 | 2019-10-01 | Cisco Technology, Inc. | Distributed advertisement insertion in content-centric networks |
| US9979742B2 (en) | 2013-01-16 | 2018-05-22 | Palo Alto Networks (Israel Analytics) Ltd. | Identifying anomalous messages |
| US9979739B2 (en) | 2013-01-16 | 2018-05-22 | Palo Alto Networks (Israel Analytics) Ltd. | Automated forensics of computer systems using behavioral intelligence |
| US9571368B2 (en) | 2013-02-04 | 2017-02-14 | International Business Machines Corporation | Analysis of variance in network page access |
| US20170070411A1 (en) * | 2013-02-04 | 2017-03-09 | International Business Machines Corporation | Analysis of variance in network page access |
| US10652122B2 (en) * | 2013-02-04 | 2020-05-12 | International Business Machines Corporation | Analysis of variance in network page access |
| US10636052B2 (en) * | 2013-03-13 | 2020-04-28 | Eversight, Inc. | Automatic mass scale online promotion testing |
| US9614742B1 (en) | 2013-03-14 | 2017-04-04 | Google Inc. | Anomaly detection in time series data |
| US11307190B2 (en) | 2013-03-15 | 2022-04-19 | Mueller International, Llc | Systems for measuring properties of water in a water distribution system |
| US11255835B2 (en) | 2013-03-15 | 2022-02-22 | Mueller International, Llc | Systems for measuring properties of water in a water distribution system |
| JP2014216009A (en) * | 2013-04-26 | 2014-11-17 | パロ・アルト・リサーチ・センター・インコーポレーテッドPaloAlto ResearchCenterIncorporated | Detecting anomaly in work practice data by combining multiple domains of information |
| US9264442B2 (en) * | 2013-04-26 | 2016-02-16 | Palo Alto Research Center Incorporated | Detecting anomalies in work practice data by combining multiple domains of information |
| US20140325643A1 (en) * | 2013-04-26 | 2014-10-30 | Palo Alto Research Center Incorporated | Detecting anomalies in work practice data by combining multiple domains of information |
| US9935791B2 (en) | 2013-05-20 | 2018-04-03 | Cisco Technology, Inc. | Method and system for name resolution across heterogeneous architectures |
| US11263069B1 (en) * | 2013-06-21 | 2022-03-01 | Amazon Technologies, Inc. | Using unsupervised learning to monitor changes in fleet behavior |
| US9444722B2 (en) | 2013-08-01 | 2016-09-13 | Palo Alto Research Center Incorporated | Method and apparatus for configuring routing paths in a custodian-based routing architecture |
| US9866573B2 (en) * | 2013-09-27 | 2018-01-09 | EMC IP Holding Company LLC | Dynamic malicious application detection in storage systems |
| US20160173508A1 (en) * | 2013-09-27 | 2016-06-16 | Emc Corporation | Dynamic malicious application detection in storage systems |
| US9407549B2 (en) | 2013-10-29 | 2016-08-02 | Palo Alto Research Center Incorporated | System and method for hash-based forwarding of packets with hierarchically structured variable-length identifiers |
| US9276840B2 (en) | 2013-10-30 | 2016-03-01 | Palo Alto Research Center Incorporated | Interest messages with a payload for a named data network |
| US9401864B2 (en) | 2013-10-31 | 2016-07-26 | Palo Alto Research Center Incorporated | Express header for packets with hierarchically structured variable-length identifiers |
| US10101801B2 (en) | 2013-11-13 | 2018-10-16 | Cisco Technology, Inc. | Method and apparatus for prefetching content in a data stream |
| US10129365B2 (en) | 2013-11-13 | 2018-11-13 | Cisco Technology, Inc. | Method and apparatus for pre-fetching remote content based on static and dynamic recommendations |
| US9311377B2 (en) | 2013-11-13 | 2016-04-12 | Palo Alto Research Center Incorporated | Method and apparatus for performing server handoff in a name-based content distribution system |
| US10089655B2 (en) | 2013-11-27 | 2018-10-02 | Cisco Technology, Inc. | Method and apparatus for scalable data broadcasting |
| US9503358B2 (en) | 2013-12-05 | 2016-11-22 | Palo Alto Research Center Incorporated | Distance-based routing in an information-centric network |
| US9692674B1 (en) | 2013-12-30 | 2017-06-27 | Google Inc. | Non-parametric change point detection |
| US9379979B2 (en) | 2014-01-14 | 2016-06-28 | Palo Alto Research Center Incorporated | Method and apparatus for establishing a virtual interface for a set of mutual-listener devices |
| US10098051B2 (en) | 2014-01-22 | 2018-10-09 | Cisco Technology, Inc. | Gateways and routing in software-defined manets |
| US10172068B2 (en) | 2014-01-22 | 2019-01-01 | Cisco Technology, Inc. | Service-oriented routing in software-defined MANETs |
| US9374304B2 (en) | 2014-01-24 | 2016-06-21 | Palo Alto Research Center Incorporated | End-to end route tracing over a named-data network |
| US9954678B2 (en) | 2014-02-06 | 2018-04-24 | Cisco Technology, Inc. | Content-based transport security |
| US9769189B2 (en) * | 2014-02-21 | 2017-09-19 | Verisign, Inc. | Systems and methods for behavior-based automated malware analysis and classification |
| US20150244733A1 (en) * | 2014-02-21 | 2015-08-27 | Verisign Inc. | Systems and methods for behavior-based automated malware analysis and classification |
| US10706029B2 (en) | 2014-02-28 | 2020-07-07 | Cisco Technology, Inc. | Content name resolution for information centric networking |
| US9678998B2 (en) | 2014-02-28 | 2017-06-13 | Cisco Technology, Inc. | Content name resolution for information centric networking |
| US10089651B2 (en) | 2014-03-03 | 2018-10-02 | Cisco Technology, Inc. | Method and apparatus for streaming advertisements in a scalable data broadcasting system |
| US10445380B2 (en) | 2014-03-04 | 2019-10-15 | Cisco Technology, Inc. | System and method for direct storage access in a content-centric network |
| US9836540B2 (en) | 2014-03-04 | 2017-12-05 | Cisco Technology, Inc. | System and method for direct storage access in a content-centric network |
| US9391896B2 (en) | 2014-03-10 | 2016-07-12 | Palo Alto Research Center Incorporated | System and method for packet forwarding using a conjunctive normal form strategy in a content-centric network |
| US9626413B2 (en) | 2014-03-10 | 2017-04-18 | Cisco Systems, Inc. | System and method for ranking content popularity in a content-centric network |
| US9473405B2 (en) | 2014-03-10 | 2016-10-18 | Palo Alto Research Center Incorporated | Concurrent hashes and sub-hashes on data streams |
| US9407432B2 (en) | 2014-03-19 | 2016-08-02 | Palo Alto Research Center Incorporated | System and method for efficient and secure distribution of digital content |
| US9916601B2 (en) | 2014-03-21 | 2018-03-13 | Cisco Technology, Inc. | Marketplace for presenting advertisements in a scalable data broadcasting system |
| US9363179B2 (en) | 2014-03-26 | 2016-06-07 | Palo Alto Research Center Incorporated | Multi-publisher routing protocol for named data networks |
| US9363086B2 (en) | 2014-03-31 | 2016-06-07 | Palo Alto Research Center Incorporated | Aggregate signing of data in content centric networking |
| US9716622B2 (en) | 2014-04-01 | 2017-07-25 | Cisco Technology, Inc. | System and method for dynamic name configuration in content-centric networks |
| US10075521B2 (en) | 2014-04-07 | 2018-09-11 | Cisco Technology, Inc. | Collection synchronization using equality matched network names |
| US9390289B2 (en) | 2014-04-07 | 2016-07-12 | Palo Alto Research Center Incorporated | Secure collection synchronization using matched network names |
| US9473576B2 (en) | 2014-04-07 | 2016-10-18 | Palo Alto Research Center Incorporated | Service discovery using collection synchronization with exact names |
| US9451032B2 (en) | 2014-04-10 | 2016-09-20 | Palo Alto Research Center Incorporated | System and method for simple service discovery in content-centric networks |
| US9992281B2 (en) | 2014-05-01 | 2018-06-05 | Cisco Technology, Inc. | Accountable content stores for information centric networks |
| US10158656B2 (en) | 2014-05-22 | 2018-12-18 | Cisco Technology, Inc. | Method and apparatus for preventing insertion of malicious content at a named data network router |
| US9609014B2 (en) | 2014-05-22 | 2017-03-28 | Cisco Systems, Inc. | Method and apparatus for preventing insertion of malicious content at a named data network router |
| US9455835B2 (en) | 2014-05-23 | 2016-09-27 | Palo Alto Research Center Incorporated | System and method for circular link resolution with hash-based names in content-centric networks |
| US9516144B2 (en) | 2014-06-19 | 2016-12-06 | Palo Alto Research Center Incorporated | Cut-through forwarding of CCNx message fragments with IP encapsulation |
| US9537719B2 (en) | 2014-06-19 | 2017-01-03 | Palo Alto Research Center Incorporated | Method and apparatus for deploying a minimal-cost CCN topology |
| US9426113B2 (en) | 2014-06-30 | 2016-08-23 | Palo Alto Research Center Incorporated | System and method for managing devices over a content centric network |
| US9699198B2 (en) | 2014-07-07 | 2017-07-04 | Cisco Technology, Inc. | System and method for parallel secure content bootstrapping in content-centric networks |
| US9621354B2 (en) | 2014-07-17 | 2017-04-11 | Cisco Systems, Inc. | Reconstructable content objects |
| US10237075B2 (en) | 2014-07-17 | 2019-03-19 | Cisco Technology, Inc. | Reconstructable content objects |
| US9959156B2 (en) | 2014-07-17 | 2018-05-01 | Cisco Technology, Inc. | Interest return control message |
| US10305968B2 (en) | 2014-07-18 | 2019-05-28 | Cisco Technology, Inc. | Reputation-based strategy for forwarding and responding to interests over a content centric network |
| US9929935B2 (en) | 2014-07-18 | 2018-03-27 | Cisco Technology, Inc. | Method and system for keeping interest alive in a content centric network |
| US9729616B2 (en) | 2014-07-18 | 2017-08-08 | Cisco Technology, Inc. | Reputation-based strategy for forwarding and responding to interests over a content centric network |
| US9590887B2 (en) | 2014-07-18 | 2017-03-07 | Cisco Systems, Inc. | Method and system for keeping interest alive in a content centric network |
| US9535968B2 (en) | 2014-07-21 | 2017-01-03 | Palo Alto Research Center Incorporated | System for distributing nameless objects using self-certifying names |
| US9882964B2 (en) | 2014-08-08 | 2018-01-30 | Cisco Technology, Inc. | Explicit strategy feedback in name-based forwarding |
| US9729662B2 (en) | 2014-08-11 | 2017-08-08 | Cisco Technology, Inc. | Probabilistic lazy-forwarding technique without validation in a content centric network |
| US9503365B2 (en) | 2014-08-11 | 2016-11-22 | Palo Alto Research Center Incorporated | Reputation-based instruction processing over an information centric network |
| US9391777B2 (en) | 2014-08-15 | 2016-07-12 | Palo Alto Research Center Incorporated | System and method for performing key resolution over a content centric network |
| US9800637B2 (en) | 2014-08-19 | 2017-10-24 | Cisco Technology, Inc. | System and method for all-in-one content stream in content-centric networks |
| US9467492B2 (en) | 2014-08-19 | 2016-10-11 | Palo Alto Research Center Incorporated | System and method for reconstructable all-in-one content stream |
| US10367871B2 (en) | 2014-08-19 | 2019-07-30 | Cisco Technology, Inc. | System and method for all-in-one content stream in content-centric networks |
| US9497282B2 (en) | 2014-08-27 | 2016-11-15 | Palo Alto Research Center Incorporated | Network coding for content-centric network |
| US10204013B2 (en) | 2014-09-03 | 2019-02-12 | Cisco Technology, Inc. | System and method for maintaining a distributed and fault-tolerant state over an information centric network |
| US11314597B2 (en) | 2014-09-03 | 2022-04-26 | Cisco Technology, Inc. | System and method for maintaining a distributed and fault-tolerant state over an information centric network |
| US9553812B2 (en) | 2014-09-09 | 2017-01-24 | Palo Alto Research Center Incorporated | Interest keep alives at intermediate routers in a CCN |
| US10715634B2 (en) | 2014-10-23 | 2020-07-14 | Cisco Technology, Inc. | System and method for creating virtual interfaces based on network characteristics |
| US10069933B2 (en) | 2014-10-23 | 2018-09-04 | Cisco Technology, Inc. | System and method for creating virtual interfaces based on network characteristics |
| US9536059B2 (en) | 2014-12-15 | 2017-01-03 | Palo Alto Research Center Incorporated | Method and system for verifying renamed content using manifests in a content centric network |
| US9590948B2 (en) | 2014-12-15 | 2017-03-07 | Cisco Systems, Inc. | CCN routing using hardware-assisted hash tables |
| US10237189B2 (en) | 2014-12-16 | 2019-03-19 | Cisco Technology, Inc. | System and method for distance-based interest forwarding |
| US9846881B2 (en) | 2014-12-19 | 2017-12-19 | Palo Alto Research Center Incorporated | Frugal user engagement help systems |
| US9473475B2 (en) | 2014-12-22 | 2016-10-18 | Palo Alto Research Center Incorporated | Low-cost authenticated signing delegation in content centric networking |
| US10003520B2 (en) | 2014-12-22 | 2018-06-19 | Cisco Technology, Inc. | System and method for efficient name-based content routing using link-state information in information-centric networks |
| US9660825B2 (en) | 2014-12-24 | 2017-05-23 | Cisco Technology, Inc. | System and method for multi-source multicasting in content-centric networks |
| US10091012B2 (en) | 2014-12-24 | 2018-10-02 | Cisco Technology, Inc. | System and method for multi-source multicasting in content-centric networks |
| US9916457B2 (en) | 2015-01-12 | 2018-03-13 | Cisco Technology, Inc. | Decoupled name security binding for CCN objects |
| US9832291B2 (en) | 2015-01-12 | 2017-11-28 | Cisco Technology, Inc. | Auto-configurable transport stack |
| US9954795B2 (en) | 2015-01-12 | 2018-04-24 | Cisco Technology, Inc. | Resource allocation using CCN manifests |
| US9602596B2 (en) | 2015-01-12 | 2017-03-21 | Cisco Systems, Inc. | Peer-to-peer sharing in a content centric network |
| US10440161B2 (en) | 2015-01-12 | 2019-10-08 | Cisco Technology, Inc. | Auto-configurable transport stack |
| US9946743B2 (en) | 2015-01-12 | 2018-04-17 | Cisco Technology, Inc. | Order encoded manifests in a content centric network |
| US9462006B2 (en) | 2015-01-21 | 2016-10-04 | Palo Alto Research Center Incorporated | Network-layer application-specific trust model |
| US9552493B2 (en) | 2015-02-03 | 2017-01-24 | Palo Alto Research Center Incorporated | Access control framework for information centric networking |
| US10348751B2 (en) | 2015-02-04 | 2019-07-09 | Nippon Telegraph And Telephone Corporation | Device, system and method for extraction of malicious communication pattern to detect traffic caused by malware using traffic logs |
| EP3242240A4 (en) * | 2015-02-04 | 2018-07-18 | Nippon Telegraph and Telephone Corporation | Malicious communication pattern extraction device, malicious communication pattern extraction system, malicious communication pattern extraction method and malicious communication pattern extraction program |
| US10333840B2 (en) | 2015-02-06 | 2019-06-25 | Cisco Technology, Inc. | System and method for on-demand content exchange with adaptive naming in information-centric networks |
| US10075401B2 (en) | 2015-03-18 | 2018-09-11 | Cisco Technology, Inc. | Pending interest table behavior |
| US9633204B2 (en) * | 2015-05-07 | 2017-04-25 | Paypal, Inc. | Method and system for log aggregation |
| US11041839B2 (en) | 2015-06-05 | 2021-06-22 | Mueller International, Llc | Distribution system monitoring |
| US10116605B2 (en) | 2015-06-22 | 2018-10-30 | Cisco Technology, Inc. | Transport stack name scheme and identity management |
| US10075402B2 (en) | 2015-06-24 | 2018-09-11 | Cisco Technology, Inc. | Flexible command and control in content centric networks |
| US10708302B2 (en) * | 2015-07-27 | 2020-07-07 | Swisscom Ag | Systems and methods for identifying phishing web sites |
| US10701038B2 (en) | 2015-07-27 | 2020-06-30 | Cisco Technology, Inc. | Content negotiation in a content centric network |
| US9986034B2 (en) | 2015-08-03 | 2018-05-29 | Cisco Technology, Inc. | Transferring state in content centric network stacks |
| US10610144B2 (en) | 2015-08-19 | 2020-04-07 | Palo Alto Research Center Incorporated | Interactive remote patient monitoring and condition management intervention system |
| US9749356B2 (en) | 2015-09-05 | 2017-08-29 | Nudata Security Inc. | Systems and methods for detecting and scoring anomalies |
| US10129279B2 (en) | 2015-09-05 | 2018-11-13 | Mastercard Technologies Canada ULC | Systems and methods for detecting and preventing spoofing |
| WO2017060778A3 (en) * | 2015-09-05 | 2017-07-20 | Nudata Security Inc. | Systems and methods for detecting and scoring anomalies |
| IL257849B1 (en) * | 2015-09-05 | 2023-08-01 | Mastercard Tech Canada Ulc | Systems and methods for detecting and scoring anomalies |
| US10212180B2 (en) | 2015-09-05 | 2019-02-19 | Mastercard Technologies Canada ULC | Systems and methods for detecting and preventing spoofing |
| US9749357B2 (en) | 2015-09-05 | 2017-08-29 | Nudata Security Inc. | Systems and methods for matching and scoring sameness |
| US9800601B2 (en) | 2015-09-05 | 2017-10-24 | Nudata Security Inc. | Systems and methods for detecting and scoring anomalies |
| CN108780479B (en) * | 2015-09-05 | 2022-02-11 | 万事达卡技术加拿大无限责任公司 | System and method for detecting and scoring anomalies |
| US10805328B2 (en) * | 2015-09-05 | 2020-10-13 | Mastercard Technologies Canada ULC | Systems and methods for detecting and scoring anomalies |
| US10965695B2 (en) | 2015-09-05 | 2021-03-30 | Mastercard Technologies Canada ULC | Systems and methods for matching and scoring sameness |
| US10749884B2 (en) | 2015-09-05 | 2020-08-18 | Mastercard Technologies Canada ULC | Systems and methods for detecting and preventing spoofing |
| US9979747B2 (en) | 2015-09-05 | 2018-05-22 | Mastercard Technologies Canada ULC | Systems and methods for detecting and preventing spoofing |
| CN108780479A (en) * | 2015-09-05 | 2018-11-09 | 万事达卡技术加拿大无限责任公司 | For to the abnormal system and method for being detected and scoring |
| US9749358B2 (en) | 2015-09-05 | 2017-08-29 | Nudata Security Inc. | Systems and methods for matching and scoring sameness |
| US9813446B2 (en) | 2015-09-05 | 2017-11-07 | Nudata Security Inc. | Systems and methods for matching and scoring sameness |
| US20180191762A1 (en) * | 2015-09-05 | 2018-07-05 | Nudata Security Inc. | Systems and methods for detecting and scoring anomalies |
| US9832123B2 (en) | 2015-09-11 | 2017-11-28 | Cisco Technology, Inc. | Network named fragments in a content centric network |
| US10419345B2 (en) | 2015-09-11 | 2019-09-17 | Cisco Technology, Inc. | Network named fragments in a content centric network |
| US10355999B2 (en) | 2015-09-23 | 2019-07-16 | Cisco Technology, Inc. | Flow control with network named fragments |
| US10313227B2 (en) | 2015-09-24 | 2019-06-04 | Cisco Technology, Inc. | System and method for eliminating undetected interest looping in information-centric networks |
| US9977809B2 (en) | 2015-09-24 | 2018-05-22 | Cisco Technology, Inc. | Information and data framework in a content centric network |
| US10454820B2 (en) | 2015-09-29 | 2019-10-22 | Cisco Technology, Inc. | System and method for stateless information-centric networking |
| US10263965B2 (en) | 2015-10-16 | 2019-04-16 | Cisco Technology, Inc. | Encrypted CCNx |
| US10129230B2 (en) | 2015-10-29 | 2018-11-13 | Cisco Technology, Inc. | System for key exchange in a content centric network |
| US9794238B2 (en) | 2015-10-29 | 2017-10-17 | Cisco Technology, Inc. | System for key exchange in a content centric network |
| US10009446B2 (en) | 2015-11-02 | 2018-06-26 | Cisco Technology, Inc. | Header compression for CCN messages using dictionary learning |
| US9807205B2 (en) | 2015-11-02 | 2017-10-31 | Cisco Technology, Inc. | Header compression for CCN messages using dictionary |
| US10021222B2 (en) | 2015-11-04 | 2018-07-10 | Cisco Technology, Inc. | Bit-aligned header compression for CCN messages using dictionary |
| US10097521B2 (en) | 2015-11-20 | 2018-10-09 | Cisco Technology, Inc. | Transparent encryption in a content centric network |
| US10681018B2 (en) | 2015-11-20 | 2020-06-09 | Cisco Technology, Inc. | Transparent encryption in a content centric network |
| US9912776B2 (en) | 2015-12-02 | 2018-03-06 | Cisco Technology, Inc. | Explicit content deletion commands in a content centric network |
| US10097346B2 (en) | 2015-12-09 | 2018-10-09 | Cisco Technology, Inc. | Key catalogs in a content centric network |
| US10078062B2 (en) | 2015-12-15 | 2018-09-18 | Palo Alto Research Center Incorporated | Device health estimation by combining contextual information with sensor data |
| US10581967B2 (en) | 2016-01-11 | 2020-03-03 | Cisco Technology, Inc. | Chandra-Toueg consensus in a content centric network |
| US10257271B2 (en) | 2016-01-11 | 2019-04-09 | Cisco Technology, Inc. | Chandra-Toueg consensus in a content centric network |
| US9949301B2 (en) | 2016-01-20 | 2018-04-17 | Palo Alto Research Center Incorporated | Methods for fast, secure and privacy-friendly internet connection discovery in wireless networks |
| US10305864B2 (en) | 2016-01-25 | 2019-05-28 | Cisco Technology, Inc. | Method and system for interest encryption in a content centric network |
| US10043016B2 (en) | 2016-02-29 | 2018-08-07 | Cisco Technology, Inc. | Method and system for name encryption agreement in a content centric network |
| US10003507B2 (en) | 2016-03-04 | 2018-06-19 | Cisco Technology, Inc. | Transport session state protocol |
| US10742596B2 (en) | 2016-03-04 | 2020-08-11 | Cisco Technology, Inc. | Method and system for reducing a collision probability of hash-based names using a publisher identifier |
| US10051071B2 (en) | 2016-03-04 | 2018-08-14 | Cisco Technology, Inc. | Method and system for collecting historical network information in a content centric network |
| US10038633B2 (en) | 2016-03-04 | 2018-07-31 | Cisco Technology, Inc. | Protocol to query for historical network information in a content centric network |
| US10469378B2 (en) | 2016-03-04 | 2019-11-05 | Cisco Technology, Inc. | Protocol to query for historical network information in a content centric network |
| US10129368B2 (en) | 2016-03-14 | 2018-11-13 | Cisco Technology, Inc. | Adjusting entries in a forwarding information base in a content centric network |
| US9832116B2 (en) | 2016-03-14 | 2017-11-28 | Cisco Technology, Inc. | Adjusting entries in a forwarding information base in a content centric network |
| US10212196B2 (en) | 2016-03-16 | 2019-02-19 | Cisco Technology, Inc. | Interface discovery and authentication in a name-based network |
| US10067948B2 (en) | 2016-03-18 | 2018-09-04 | Cisco Technology, Inc. | Data deduping in content centric networking manifests |
| US11436656B2 (en) | 2016-03-18 | 2022-09-06 | Palo Alto Research Center Incorporated | System and method for a real-time egocentric collaborative filter on large datasets |
| EP3223495A1 (en) * | 2016-03-21 | 2017-09-27 | Light Cyber Ltd | Detecting an anomalous activity within a computer network |
| US10091330B2 (en) | 2016-03-23 | 2018-10-02 | Cisco Technology, Inc. | Interest scheduling by an information and data framework in a content centric network |
| US10033639B2 (en) | 2016-03-25 | 2018-07-24 | Cisco Technology, Inc. | System and method for routing packets in a content centric network using anonymous datagrams |
| US10320760B2 (en) | 2016-04-01 | 2019-06-11 | Cisco Technology, Inc. | Method and system for mutating and caching content in a content centric network |
| US10348865B2 (en) | 2016-04-04 | 2019-07-09 | Cisco Technology, Inc. | System and method for compressing content centric networking messages |
| US9930146B2 (en) | 2016-04-04 | 2018-03-27 | Cisco Technology, Inc. | System and method for compressing content centric networking messages |
| US10425503B2 (en) | 2016-04-07 | 2019-09-24 | Cisco Technology, Inc. | Shared pending interest table in a content centric network |
| US10027578B2 (en) | 2016-04-11 | 2018-07-17 | Cisco Technology, Inc. | Method and system for routable prefix queries in a content centric network |
| US10841212B2 (en) | 2016-04-11 | 2020-11-17 | Cisco Technology, Inc. | Method and system for routable prefix queries in a content centric network |
| US10516684B1 (en) * | 2016-04-21 | 2019-12-24 | Instart Logic, Inc. | Recommending and prioritizing computer log anomalies |
| US10404450B2 (en) | 2016-05-02 | 2019-09-03 | Cisco Technology, Inc. | Schematized access control in a content centric network |
| US10320675B2 (en) | 2016-05-04 | 2019-06-11 | Cisco Technology, Inc. | System and method for routing packets in a stateless content centric network |
| US10547589B2 (en) | 2016-05-09 | 2020-01-28 | Cisco Technology, Inc. | System for implementing a small computer systems interface protocol over a content centric network |
| US10693852B2 (en) | 2016-05-13 | 2020-06-23 | Cisco Technology, Inc. | System for a secure encryption proxy in a content centric network |
| US10063414B2 (en) | 2016-05-13 | 2018-08-28 | Cisco Technology, Inc. | Updating a transport stack in a content centric network |
| US10084764B2 (en) | 2016-05-13 | 2018-09-25 | Cisco Technology, Inc. | System for a secure encryption proxy in a content centric network |
| US10404537B2 (en) | 2016-05-13 | 2019-09-03 | Cisco Technology, Inc. | Updating a transport stack in a content centric network |
| US10103989B2 (en) | 2016-06-13 | 2018-10-16 | Cisco Technology, Inc. | Content object return messages in a content centric network |
| US10305865B2 (en) | 2016-06-21 | 2019-05-28 | Cisco Technology, Inc. | Permutation-based content encryption with manifests in a content centric network |
| US10581741B2 (en) | 2016-06-27 | 2020-03-03 | Cisco Technology, Inc. | Method and system for interest groups in a content centric network |
| US10148572B2 (en) | 2016-06-27 | 2018-12-04 | Cisco Technology, Inc. | Method and system for interest groups in a content centric network |
| US10009266B2 (en) | 2016-07-05 | 2018-06-26 | Cisco Technology, Inc. | Method and system for reference counted pending interest tables in a content centric network |
| US9992097B2 (en) | 2016-07-11 | 2018-06-05 | Cisco Technology, Inc. | System and method for piggybacking routing information in interests in a content centric network |
| US10122624B2 (en) | 2016-07-25 | 2018-11-06 | Cisco Technology, Inc. | System and method for ephemeral entries in a forwarding information base in a content centric network |
| US10069729B2 (en) | 2016-08-08 | 2018-09-04 | Cisco Technology, Inc. | System and method for throttling traffic based on a forwarding information base in a content centric network |
| US10956412B2 (en) | 2016-08-09 | 2021-03-23 | Cisco Technology, Inc. | Method and system for conjunctive normal form attribute matching in a content centric network |
| US10033642B2 (en) | 2016-09-19 | 2018-07-24 | Cisco Technology, Inc. | System and method for making optimal routing decisions based on device-specific parameters in a content centric network |
| US10897518B2 (en) | 2016-10-03 | 2021-01-19 | Cisco Technology, Inc. | Cache management on high availability routers in a content centric network |
| US10212248B2 (en) | 2016-10-03 | 2019-02-19 | Cisco Technology, Inc. | Cache management on high availability routers in a content centric network |
| US10447805B2 (en) | 2016-10-10 | 2019-10-15 | Cisco Technology, Inc. | Distributed consensus in a content centric network |
| US10721332B2 (en) | 2016-10-31 | 2020-07-21 | Cisco Technology, Inc. | System and method for process migration in a content centric network |
| US10135948B2 (en) | 2016-10-31 | 2018-11-20 | Cisco Technology, Inc. | System and method for process migration in a content centric network |
| US11856264B2 (en) * | 2016-11-15 | 2023-12-26 | Google Llc | Systems and methods for reducing download requirements |
| US11856265B2 (en) * | 2016-11-15 | 2023-12-26 | Google Llc | Systems and methods for reducing download requirements |
| US10243851B2 (en) | 2016-11-21 | 2019-03-26 | Cisco Technology, Inc. | System and method for forwarder connection information in a content centric network |
| US10284581B2 (en) | 2016-12-30 | 2019-05-07 | Capital One Services, Llc | Systems and methods for detecting resources responsible for events |
| US11783028B2 (en) | 2016-12-30 | 2023-10-10 | Capital One Services, Llc | Systems and methods for detecting resources responsible for events |
| US10742671B2 (en) | 2016-12-30 | 2020-08-11 | Capital One Services, Llc | Systems and methods for detecting resources responsible for events |
| US10356110B2 (en) | 2016-12-30 | 2019-07-16 | Capital One Services, Llc | Systems and methods for detecting resources responsible for events |
| EP3343422A1 (en) * | 2016-12-30 | 2018-07-04 | Capital One Services, LLC | Systems and methods for detecting resources responsible for events |
| US20180218369A1 (en) * | 2017-02-01 | 2018-08-02 | Google Inc. | Detecting fraudulent data |
| US10715552B2 (en) * | 2017-04-30 | 2020-07-14 | Splunk Inc. | Enabling user definition of anomaly action rules in a network security system |
| US10958674B2 (en) | 2017-04-30 | 2021-03-23 | Splunk Inc. | User interface for defining anomaly action rules in a network security system |
| US20180316727A1 (en) * | 2017-04-30 | 2018-11-01 | Splunk Inc. | Enabling user definition of anomaly action rules in a network security system |
| US10007776B1 (en) | 2017-05-05 | 2018-06-26 | Mastercard Technologies Canada ULC | Systems and methods for distinguishing among human users and software robots |
| US9990487B1 (en) | 2017-05-05 | 2018-06-05 | Mastercard Technologies Canada ULC | Systems and methods for distinguishing among human users and software robots |
| US10127373B1 (en) | 2017-05-05 | 2018-11-13 | Mastercard Technologies Canada ULC | Systems and methods for distinguishing among human users and software robots |
| US10341372B2 (en) * | 2017-06-12 | 2019-07-02 | International Business Machines Corporation | Clustering for detection of anomalous behavior and insider threat |
| US10771313B2 (en) * | 2018-01-29 | 2020-09-08 | Cisco Technology, Inc. | Using random forests to generate rules for causation analysis of network anomalies |
| US20190238396A1 (en) * | 2018-01-29 | 2019-08-01 | Cisco Technology, Inc. | Using random forests to generate rules for causation analysis of network anomalies |
| US10999304B2 (en) | 2018-04-11 | 2021-05-04 | Palo Alto Networks (Israel Analytics) Ltd. | Bind shell attack detection |
| US11392435B2 (en) | 2018-06-07 | 2022-07-19 | Hewlett-Packard Development Company, L.P. | Evaluation of a performance parameter of a monitoring service |
| US11184376B2 (en) | 2019-01-30 | 2021-11-23 | Palo Alto Networks (Israel Analytics) Ltd. | Port scan detection using destination profiles |
| US11184378B2 (en) | 2019-01-30 | 2021-11-23 | Palo Alto Networks (Israel Analytics) Ltd. | Scanner probe detection |
| US11184377B2 (en) | 2019-01-30 | 2021-11-23 | Palo Alto Networks (Israel Analytics) Ltd. | Malicious port scan detection using source profiles |
| US11070569B2 (en) | 2019-01-30 | 2021-07-20 | Palo Alto Networks (Israel Analytics) Ltd. | Detecting outlier pairs of scanned ports |
| US11316872B2 (en) | 2019-01-30 | 2022-04-26 | Palo Alto Networks (Israel Analytics) Ltd. | Malicious port scan detection using port profiles |
| US11392446B2 (en) | 2019-03-15 | 2022-07-19 | Ebay Inc. | Cross-correlation of metrics for anomaly root cause identification |
| US11886285B2 (en) | 2019-03-15 | 2024-01-30 | Ebay Inc. | Cross-correlation of metrics for anomaly root cause identification |
| CN111310139B (en) * | 2020-01-21 | 2021-04-13 | 腾讯科技(深圳)有限公司 | Behavior data identification method and device and storage medium |
| CN111310139A (en) * | 2020-01-21 | 2020-06-19 | 腾讯科技(深圳)有限公司 | Behavior data identification method and device and storage medium |
| US20210295379A1 (en) * | 2020-03-17 | 2021-09-23 | Com Olho It Private Limited | System and method for detecting fraudulent advertisement traffic |
| US11729207B2 (en) * | 2020-06-12 | 2023-08-15 | Vmware, Inc. | Hierarchical novelty detection using intended states for network security |
| US11725366B2 (en) | 2020-07-16 | 2023-08-15 | Mueller International, Llc | Remote-operated flushing system |
| US11509680B2 (en) | 2020-09-30 | 2022-11-22 | Palo Alto Networks (Israel Analytics) Ltd. | Classification of cyber-alerts into security incidents |
| US11799880B2 (en) | 2022-01-10 | 2023-10-24 | Palo Alto Networks (Israel Analytics) Ltd. | Network adaptive alert prioritization system |
Similar Documents
| Publication | Publication Date | Title |
|---|---|---|
| US7523016B1 (en) | Detecting anomalies | |
| Bornmann et al. | The state of h index research: Is the h index the ideal way to measure research performance? | |
| KR101021411B1 (en) | Self-learning method and system for detecting abnormalities | |
| Johnson et al. | Time between vulnerability disclosures: A measure of software product vulnerability | |
| US8078913B2 (en) | Automated identification of performance crisis | |
| US8918345B2 (en) | Network analysis system | |
| US20060074621A1 (en) | Apparatus and method for prioritized grouping of data representing events | |
| CN111984499A (en) | Fault detection method and device for big data cluster | |
| US20080301090A1 (en) | Detection of abnormal user click activity in a search results page | |
| CN111902805A (en) | Multivariate anomaly detection based on application telemetry | |
| JP5768983B2 (en) | Contract violation prediction system, contract violation prediction method, and contract violation prediction program | |
| Tang et al. | Recommending resolutions for problems identified by monitoring | |
| EP3742700B1 (en) | Method, product, and system for maintaining an ensemble of hierarchical machine learning models for detection of security risks and breaches in a network | |
| US7577888B2 (en) | Self learning signatures | |
| US9235463B2 (en) | Device and method for fault management of smart device | |
| Merrington | Fault diagnosis of gas turbine engines from transient data | |
| Scarabeo et al. | Mining known attack patterns from security-related events | |
| Zeng et al. | Traceark: Towards actionable performance anomaly alerting for online service systems | |
| Tornblad et al. | Characteristics that predict phishing susceptibility: a review | |
| CN112256548B (en) | Abnormal data monitoring method and device, server and storage medium | |
| CN111563527B (en) | Abnormal event detection method and device | |
| Kohlrausch et al. | ARIMA supplemented security metrics for quality assurance and situational awareness | |
| Son et al. | Internet of things system technologies based on quality of experience | |
| Wang et al. | Multimode complex process monitoring using double‐level local information based local outlier factor method | |
| Agarwal et al. | Real-time anomaly detection in epidemic data streams |
Legal Events
| Date | Code | Title | Description |
|---|---|---|---|
| AS | Assignment |
Owner name: GOOGLE INC., CALIFORNIA Free format text: ASSIGNMENT OF ASSIGNORS INTEREST;ASSIGNORS:SURDULESCU, RAZAN;GHARACHORLOO, KOUROSH;REEL/FRAME:021000/0183 Effective date: 20061229 |
|
| AS | Assignment |
Owner name: GOOGLE INC., CALIFORNIA Free format text: CORRECTIVE ASSIGNMENT TO CORRECT THE INVENTOR NAME "RAZAN SURDULESCU" SHOULD BE CHANGED TO "RAZVAN SURDULESCU" PREVIOUSLY RECORDED ON REEL 021000 FRAME 0183;ASSIGNORS:SURDULESCU, RAZVAN;GHARACHORLOO, KOUROSH;REEL/FRAME:021121/0555 Effective date: 20061229 |
|
| STCF | Information on status: patent grant |
Free format text: PATENTED CASE |
|
| FPAY | Fee payment |
Year of fee payment: 4 |
|
| FPAY | Fee payment |
Year of fee payment: 8 |
|
| AS | Assignment |
Owner name: GOOGLE LLC, CALIFORNIA Free format text: CHANGE OF NAME;ASSIGNOR:GOOGLE INC.;REEL/FRAME:044101/0610 Effective date: 20170929 |
|
| MAFP | Maintenance fee payment |
Free format text: PAYMENT OF MAINTENANCE FEE, 12TH YEAR, LARGE ENTITY (ORIGINAL EVENT CODE: M1553); ENTITY STATUS OF PATENT OWNER: LARGE ENTITY Year of fee payment: 12 |