US7492921B2 - System and method for detecting and ranking images in order of usefulness based on vignette score - Google Patents
System and method for detecting and ranking images in order of usefulness based on vignette score Download PDFInfo
- Publication number
- US7492921B2 US7492921B2 US11/032,576 US3257605A US7492921B2 US 7492921 B2 US7492921 B2 US 7492921B2 US 3257605 A US3257605 A US 3257605A US 7492921 B2 US7492921 B2 US 7492921B2
- Authority
- US
- United States
- Prior art keywords
- images
- image
- vignette
- score
- vignette score
- Prior art date
- Legal status (The legal status is an assumption and is not a legal conclusion. Google has not performed a legal analysis and makes no representation as to the accuracy of the status listed.)
- Expired - Fee Related, expires
Links
Images


Classifications
-
- G—PHYSICS
- G06—COMPUTING; CALCULATING OR COUNTING
- G06F—ELECTRIC DIGITAL DATA PROCESSING
- G06F16/00—Information retrieval; Database structures therefor; File system structures therefor
- G06F16/50—Information retrieval; Database structures therefor; File system structures therefor of still image data
- G06F16/58—Retrieval characterised by using metadata, e.g. metadata not derived from the content or metadata generated manually
- G06F16/583—Retrieval characterised by using metadata, e.g. metadata not derived from the content or metadata generated manually using metadata automatically derived from the content
Definitions
- the invention is in the field of automatic media analysis and is related to systems and methods for organizing and ranking images, and particularly to a system and method for detecting useful images and for ranking images in order of usefulness based on how closely each one resembles a “vignette,” or a central object or image surrounded by a featureless or deemphasized background.
- One application is computer interfaces or programs that act upon images, video or motion picture data.
- Text can be easily searched at the touch of a keystroke or the push of a button to find any desired text string. Text that is sorted in order of priority based on one search field can then be re-sorted according to a second search, and so on. The possibilities are virtually limitless.
- embodiments of the invention provide a system and method for detecting useful images and for ranking images in order of usefulness based on a vignette score.
- a vignette score describes how closely each image resembles a vignette image, or a central object or image centered on a blank or low-contrast background. “Vignetted” images are presumed more useful and more “iconic” than non-vignettes, at least in certain circumstances.
- Embodiments of the invention present methods for detecting this class of useful images, and for ranking each member in a group of images according to its vignette score, which estimates how useful it is based on how closely it resembles a vignette.
- Vignette scores can be scaled, normalized, and/or thresholded if desired. However, scaling, normalization and/or thresholding of vignette scores is not necessary because in any given application scores will typically be used primarily for ranking images according to their score relative to other vignettes. For a given method and a given set of images, the order of the vignette scores will not be changed by scaling, normalization, and/or thresholding.
- Variance ratio analysis entails calculation of the ratio of variance between the edge region of the image and the entire image.
- the variance ratio can be used to rank images by their vignette score, such that an image with a high score is more likely to be a vignette.
- the vignette score can be computed by calculating a weighted ratio of variance of the image from more central regions to outlying regions, wherein the weighting is done based on the distance from the boundary. Two experiments are described below.
- Statistical model analysis entails developing a statistical classifier capable of determining a statistical model of each image class based on pre-entered training data consisting of images defined as vignettes and images defined as non-vignettes. Given these statistical classifiers, which respectively act as models of a vignette V and a non-vignette NV, the likelihood that an unknown image was generated by each model can be determined, and the likelihood ratio then serves as another estimate of vignette score. Examples of statistical classifiers include Gaussian mixture models, linear classifiers, and Support Vector Machines (SVMs). These are discussed in more detail in the implementation section below.
- SVMs Support Vector Machines
- Gaussian models are a useful means of classifying unknown data.
- a Gaussian model is determined for each class of to be identified, by computing the mean and covariance from a set of training data from that class. The probability that a class generated a given data point may be computed and the class model that generated an unknown data point with the highest likelihood is designated to be the class of the unknown data.
- a single-Gaussian model can be extended to a Gaussian mixture model by modeling each class likelihood as a weighted sum of several Gaussian functions, with means, covariances, and mixture weights determined by the well-known Expectation-Maximization (EM) algorithm.
- EM Expectation-Maximization
- a Gaussian mixture model includes a single-Gaussian model as above with a single mixture weight of 1.
- Gaussian mixture models are a useful classification scheme that may be employed where one has two classes of data and wishes to determine into which class an item is likely to fall. The distribution of each class of data is modeled as a mixture of Gaussian distributions with appropriate means, covariances, and mixture weights.
- Linear classifiers create decision hyper-planes capable of separating two sets of data having different class memberships.
- a decision hyper-plane is one that separates two sets of data having different class memberships.
- Most classification tasks, however, are not that simple, and often more complex structures are needed in order to make an optimal separation.
- Support Vector Machines project data into a high-dimensional space where decision hyper-planes can then be used to easily determine on which side of the boundary an image lies.
- the SVM thereby makes it possible to separate a set of data into respective groups of interest (in this case, V and NV).
- Yet another approach examines the energy at different spatial frequencies.
- a discrete cosine transform DCT
- similar linear discrete transform as examples, a discrete Fourier transform or a Hadamard transform or a wavelet transform or another linear discrete transform
- the energy in different spatial frequencies can be estimated in any particular region.
- the energy in different spatial frequencies is estimated in the central region, in the edge region, and in the image as a whole.
- a vignette score is calculated as the ratio of mid-frequency energies in the edge region to the mid-frequencies of the entire image. This has the advantage that the variance due to low frequencies (for example, due to a soft-focus horizon line) and the variance due to high frequencies (from texture, quantization, or other noise processes) can be ignored, resulting in a more reliable vignette measure.
- Mid-frequency energy can be efficiently computed from Joint Photographic Experts Group (JPEG)-encoded images, without having to fully reconstruct the image.
- JPEG images are encoded as macroblocks, or non-overlapping 8 ⁇ 8 or 16 ⁇ 16 regions.
- the major frequency components in each macroblock are determined using DCT analysis and then encoded.
- the macroblock period is the size of the macroblock. Energy in frequencies lower than the macroblock period is not explicitly coded.
- Averaging mid-frequency JPEG coefficients over macroblocks in an area yields an estimate of the mid-frequency energy in that area. This can easily be done for macroblocks in the central region and the image as a whole, and the ratio serves as a vignette score. For large image collections, this is much more efficient than fully reconstructing each image and calculating the variance ratio.
- the image is subdivided into edge and central regions, possibly by using square blocks.
- a linear discrete transform is performed on each block, using either a DCT or a discrete Fourier transform or a Hadamard transform or a wavelet transform or another linear discrete transform.
- the result is an array of transform coefficients, which are essentially the frequency coefficients for each block.
- the energy in the middle frequency band is estimated for each block by summing the amplitude or squared amplitude (energy) of frequency coefficients in the middle bands. The resulting amplitudes are separately summed for the edge region and for the entire image, and normalized according to their relative areas.
- a vignette score can then be calculated based on the ratio of mid-frequency energy in the edge region to mid-frequency energy in the entire image. If the frequency components were obtained from JPEG-encoded macroblocks, this may be done without the need for transforming from the frequency domain back into the spatial domain.
- FIG. 1 is a set of images that depicts some possible examples of vignette (V) and non-vignette (NV) images returned as a result of an image search;
- FIG. 2 is a block diagram that illustrates a general purpose computer architecture suitable for performing the methods of the present invention
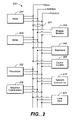
- FIG. 3 is a set of frames that illustrates training frames, inverse discrete cosine transforms of mean feature vectors derived from the training frames, and inverse Hadamard transforms of mean feature vectors derived from the training frames according to the present invention
- FIG. 4 is a diagram that illustrates the setup employed for the experiments in variance ratio analysis, depicting an embodiment utilizing a rectangular central region;
- FIG. 5 is a graph of the fraction of correctly classified vignette images as a function of scaling ratio ⁇ C for one of the experimental runs;
- FIG. 6 is a set of images that shows the images in the first variance ratio analysis experiment that received the lowest variance ratios and thus the highest vignette scores;
- FIG. 7 is a set of images that shows the images in the first variance ratio analysis experiment that received the highest variance ratios and thus the lowest vignette scores;
- FIG. 8 is a diagram that depicts a variance ratio analysis embodiment utilizing a circular central region
- FIG. 9 is a diagram that depicts a embodiment utilizing an elliptical central region.
- embodiments of the invention provide a system and method for detecting useful images and for ranking images in order of usefulness based on a vignette score.
- a vignette score describes how closely each image resembles a vignette image, or a center object or image centered on a blank or low-contrast background. This invention works on the assumption that “vignetted” images can in certain cases be more useful than images that do not have a vignette-like quality.
- V images the first class
- NV Non-Vignette.
- Examples of V images include a person photographed against a featureless backdrop, a flower photographed against an out-of-focus background, and a wedding photo shaded to emphasize the couple in the center.
- FIG. 1 shows some possible examples of V images 100 and of NV images 110 returned as a result of different image search queries 120 .
- Query 121 returned V image 101 and NV image 111 .
- Query 122 returned V image 102 and NV image 112 .
- Query 123 returned V image 103 and NV image 113 .
- the V images are preferable.
- Photographers or image editors will often photograph canonical items in such a way that they are vignetted, that is, emphasized by being central and against a low-contrast or otherwise plain background. Photographers use various techniques to do this, from drop cloths to hide a distracting object, to the common practice of using a limited depth of field to ensure that the image background is not in focus. Similarly, photographers or their editors can emphasize central objects in post-production using a variety of techniques. These include the classical practice of using a small window to selectively expose the center of a photographic print, to physically cropping away distracting edges of the image, to digital tools that simulate or go beyond these techniques.
- Vignette images feature the central region and are more likely to contain canonical, exemplary and useful representations. Vignette images are thus good candidates to use as representative images from a collection or video, as they concisely depict a central object without the clutter of background, and they require less viewer effort to discern the depicted object.
- Methods are presented for detecting this class of useful images and for ranking each member in a group of images according to its vignette score (VS), which summarizes how useful it is based on how closely it resembles a vignette. We present automated methods to determine how much a given image is vignetted by classifying image features.
- VS vignette score
- a vignette score can be increased for many images by applying a Gaussian blur to them, by filtering the outer regions with a low pass filter.
- the image is being blurred by replacing each pixel with an average of its neighbors weighted according to the neighbor's proximity with a Gaussian curve centered on the pixel. This process removes the high frequencies and softens the edges of an image.
- FIG. 2 is a block diagram that illustrates a general purpose computer system 200 suitable for implementing the methods according to the present invention.
- the general purpose computer system 200 includes one or more processors 202 .
- the cursor control device 205 is implemented as a mouse, a joy stick, a series of buttons, or any other input device which allows a user to control position of a cursor or pointer on the display monitor 204 .
- the general purpose computer may also include random access memory 207 , external storage 203 , ROM memory 208 , a keyboard 206 , a network connection 210 and a graphics co-processor 209 .
- the cursor control device 205 and/or the keyboard 206 are possible user interfaces for receiving user input according to the present invention.
- All of the elements of the general purpose computer 200 are optionally tied together by a common bus 201 for transporting data between the various elements.
- the bus 201 typically includes data, address, and control signals.
- the general purpose computer 200 illustrated in FIG. 2 includes a single data bus 201 which ties together all of the elements of the general purpose computer 200 , there is no requirement that there be a single communication bus 201 which connects the various elements of the general purpose computer 200 .
- the one or more processors 202 , RAM 207 , ROM 208 , and graphics co-processor 209 are alternatively tied together with a data bus while the hard disk 203 , network connection 210 , keyboard 206 , display monitor 204 , and cursor control device 205 are connected together with a second data bus (not shown).
- the first data bus 201 and the second data bus (not shown) are linked by a bi-directional bus interface (not shown).
- some of the elements such as the one or more processors 202 and graphics co-processor 209 , are connected to both the first data bus 201 and the second data bus (not shown), and communication between the first and second data bus occurs through the one or more processors 202 and graphics co-processor 209 .
- the methods of the present invention are thus executable on any general purpose computer system such as the 200 illustrated in FIG. 2 , but there is clearly no limitation that this computer system is the only one which can execute the methods of the present invention.
- a number of images are represented or characterized by a single or reduced number of images that are selected using the invention.
- a folder or directory containing a large number of images can be represented by an icon comprising an image or images selected using the invention as most representative of the collection.
- the image sequence in a video clip can be represented by one or more frame determined by the invention as most representative of the images in the video segment. For example, in the file view interface of many operating systems, the first frame in a video file is used to represent that data.
- a search engine may return a large number of images in response to a query. Some of these images will be more satisfactory to a user's information needs while others will be less pertinent.
- This embodiment provides a method for detecting and ranking the most useful images.
- the user In another embodiment applied to collections of stock images, typically the user must rapidly skim a large number of available images.
- This embodiment provides a method for detecting and ranking the images likely to be most applicable to the desired use. The user's information needs are satisfied by the invention's capability of detecting and ranking vignette images.
- Spatial frequency analysis includes, as five sub-classes of embodiments, a DCT, a discrete Fourier transform, a Hadamard transform, a wavelet transform (all of these being examples of linear discrete transforms), and in the case where the image is encoded in the JPEG format, direct application of JPEG coefficients.
- Variance ratio analysis entails calculation of the ratio of variance between the edge region of the image and the entire image. Vignette images will have a small variance of pixels nearest the edge, while NV images will have edge variances that do not differ as significantly from the variances in the center region.
- the variance ratio can be used to rank images by their vignette score, such that an image with a high score is more likely to be a vignette, and thus is preferable, at least for certain applications.
- the vignette score is computed by calculating a weighted ratio of variance of the image from more central regions to outlying regions, wherein the weighting is done based on the distance from the boundary.
- Statistical model analysis entails developing a statistical classifier capable of determining a statistical model of each image class based on pre-entered training data consisting of images defined as vignettes and images defined as non-vignettes. Given these statistical classifiers, which respectively act as models of a vignette V and a non-vignette NV, the likelihood that an unknown image was generated by each model can be determined, and the likelihood ratio then serves as another estimate of vignette score. Examples of statistical classifiers include Gaussian mixture models, linear classifiers, and Support Vector Machines (SVMs). These are discussed in more detail in the implementation section below.
- SVMs Support Vector Machines
- this ratio will be relatively large for an image resembling a vignette and relatively small for an image not as closely resembling a vignette. Therefore this ratio can directly serve as a vignette score. Depending on the exact embodiment, this ratio may directly represent the vignette score VS or may be scaled and normalized so as to be transformed into VS if desired.
- scaling and/or normalization of vignette scores is not always necessary because in a typical application scores will typically be used primarily for ranking images according to their score relative to other images. For a given method and a given set of images, the order of the vignette scores will not be changed by scaling and/or normalization.
- Gaussian models are a useful means of classifying unknown data.
- a Gaussian model is determined for each class of to be identified, by computing the mean and covariance from a set of training data from that class. The probability that a class generated a given data point may be computed and the class model that generated an unknown data point with the highest likelihood is designated to be the class of the unknown data.
- a single-Gaussian model can be extended to a Gaussian mixture model by modeling each class likelihood as a weighted sum of several Gaussian functions, with means, covariances, and mixture weights determined by the well-known Expectation-Maximization (EM) algorithm.
- EM Expectation-Maximization
- a Gaussian mixture model includes a single-Gaussian model as above with a single mixture weight of 1.
- Gaussian mixture models are a useful classification scheme that may be employed where one has two classes of data and wishes to determine into which class an item is likely to fall. The distribution of each class of data is modeled as a mixture of Gaussian distributions with appropriate means, covariances, and mixture weights.
- Linear classifiers create decision hyper-planes capable of separating two sets of data having different class memberships.
- a decision hyper-plane is one that separates two sets of data having different class memberships.
- Most classification tasks, however, are not that simple, and often more complex structures are needed in order to make an optimal separation.
- Support Vector Machines project data into a high-dimensional space where decision hyper-planes can then be used to easily determine on which side of the boundary an image lies.
- the SVM thereby makes it possible to separate a set of data into respective groups of interest (in this case, V and NV).
- SVMs use a set of mathematical functions, known as kernels, to map a set of original data.
- the mapped data are linearly separable and, thus, instead of constructing a complex curve, all we have to do, once the SVM projection process is completed, is to find a hyper-plane that can separate the V data and the NV data.
- the above-described statistical classifiers require low-dimensional features that represent the images. Dimensional reduction is commonly accomplished in the frequency domain, by estimating the energy at different spatial frequencies. Different possible embodiments of spatial frequency analysis entail different techniques for estimating energy at different spatial frequencies.
- One embodiment calls for performing a DCT. In another embodiment, a discrete Fourier transform is performed.
- a third embodiment entails performing a Hadamard transform.
- a fourth embodiment entails performing a wavelet transform.
- FIG. 3 is a set of frames that illustrates training frames, inverse discrete cosine transforms of mean feature vectors derived from the training frames, and inverse Hadamard transforms of mean feature vectors derived from the training frames according to the present invention.
- training frames 301 through 308 represent a series of training images pertaining to a video image class.
- Frame 310 illustrates the inverse discrete cosine transform corresponding to the mean feature vector computed from a plurality of feature vectors extracted from training frames of which training frames 301 through 308 are an example.
- the feature set for video classification is a ten-entry feature set. Thus, only ten transform coefficients from each frame make up the feature vector associated with each training frame.
- Frame 311 represents the inverse discrete cosine transform of the mean feature vector computed from a 100-entry feature vector extracted from each of the training frames 301 through 308 .
- Frame 312 is the inverse discrete cosine transform of a 1000-entry mean feature vector. Frame 312 shows more detail than frame 311 , which itself shows more detail than frame 310 , because of the increased number of coefficients used in the inverse discrete cosine transform.
- Frame 320 represents the inverse Hadamard transform of the mean feature vector derived from the training images.
- Frame 321 represents the inverse Hadamard transform corresponding to a 1000-entry mean feature vector.
- Frame 322 represents the inverse Hadamard transform corresponding to a 1000-entry mean feature vector.
- MPEG frames taken at 1 ⁇ 2-second intervals were decoded and reduced to 64 ⁇ 64 grayscale intensity sub-images.
- the resulting frame images were discrete cosine transform and Hadamard transform coded. Both the coefficients with the highest variance (rank) and the most important principal components were selected as features.
- Gaussian mixture models were trained on the training set using a variable number of dimensions between 1 and 1000.
- FIG. 3 shows samples for one of the feature categories. That category consists of close-ups of people against a lighter (white) background. Note how the images for this class are highly variable in camera angle, lighting, and position, perhaps more than images of a typical news anchor. The mean and covariance were trained using the highest-variance discrete cosine transform and Hadamard transform coefficients.
- GUI graphical user interface
- Embodiments of the present invention include a computer program product which is a storage medium (media) having instructions stored thereon/in which can be used to program a computer to perform any of the processes of the present invention.
- the storage medium can include, but is not limited to, any type of disk including floppy disks, optical discs, DVD, CD-ROMs, microdrive, and magneto-optical disks, ROMs, RAMs, EPROMs, EEPROMs, DRAMs, VRAMs, flash memory devices, magnetic or optical cards, nanosystems (including molecular memory ICs), or any type of media or device suitable for storing instructions and/or data.
- Embodiments of the present invention include software, stored on any one of the computer readable medium (media), for controlling both the hardware of the general purpose/specialized computer or microprocessor, and for enabling the computer or microprocessor to interact with a human operator or other mechanism utilizing the results of the present invention.
- Such software may include, but is not limited to, device drivers, operating systems, and user applications.
- Such computer readable media further includes software for executing the present invention, as described above.
- embodiments of the present invention include software for controlling both the hardware of the general purpose/specialized computer or processor, and for enabling the computer or processor to interact with a human user or other mechanism utilizing the results of embodiments of the present invention.
- Such software may include, but is not limited to, device drivers, operating systems, and user applications.
- Such computer readable media further includes software for performing embodiments of the present invention, as described above.
- Included in the software of the general/specialized computer or processor are software modules for implementing the teachings of the present invention, including, but not limited to, detecting useful images, ranking images in order of usefulness based on how closely each one resembles a “vignette,” and communication of results according to the processes of embodiments of the present invention.
- Embodiments of the present invention may be conveniently implemented using a conventional general purpose or a specialized digital computer or processor programmed according to the teachings of the present disclosure, as will be apparent to those skilled in the computer art.
- the invention is applied to a media organizer.
- a media organizer provides a means to organize digital photos, often through a lightbox-like interface offering the capable to view images, to rearrange them in any desired configuration, to print any or all images as desired, to delete duplicates and unwanted images, and to upload or download any or all images as desired.
- Embodiments of the invention offer the capability to rank the images with numerical ranks in order of usefulness based on their vignette scores, which complements the media organizer's other capabilities.
- the invention is applied to a video database.
- a video database is the rough equivalent of a media organizer for digital video content.
- a video database provides a means to organize video content as described by frames, often through a lightbox-like interface offering the capable to view frames, to rearrange them in any desired configuration, to print any or all frames as desired, to delete duplicates and unwanted videos, and to upload or download any or all videos and/or any or all frames as desired.
- Embodiments of the invention offer the capability to rank the frames and, therefore, the videos that they represent with numerical ranks in order of usefulness based on their vignette scores, which complements the video database's other capabilities.
- the invention offers the capability to use vignette scores for various frames to select the frame that best represents a given video segment.
- the invention is applied to a set of images obtained in an Internet search.
- FIG. 4 is a diagram that illustrates the setup employed for the experiment in variance ratio analysis.
- FIG. 4 depicts an image 400 of length N and width M.
- the experiment used a rectangular central region 402 whose length ⁇ C N and width ⁇ C M are each defined as the same specific fractional scaling ratio ⁇ C , 0 ⁇ C ⁇ 1 of, respectively, the length N and width M of the image 400 .
- the fraction ⁇ C is the same in both width and height, and is expressed as a fraction of the normalized image dimension.
- the central region 402 is a rectangle of dimension ⁇ C N ⁇ C M pixels, centered in the image.
- the central region 402 thus has the same aspect ratio as the original image, though without loss of generality ⁇ C , could be defined to be different in the width, height or any other direction.
- the edge region 404 is defined as all those pixels not in the central region.
- a set of 59 vignette images and 57 non-vignette images were obtained from the Google image search engine using a variety of keywords.
- Three examples of the V images and three examples of the NV images are depicted in FIG. 1 .
- These images were ranked using the variance ratio method in the particular embodiment described above.
- a value for ⁇ C was selected after some preliminary tests of variance ratio were performed to determine the value of ⁇ C that best discriminates between V and NV test images. Images were categorized as looking like vignettes or non-vignettes. Then vignette scores were calculated for each of a small set of images and each of several values of ⁇ C , which was allowed to vary between the values of 0.5 and 1.
- Varying ⁇ C led, predictably enough, to variance in the percentage of correct vignette score classifications received for each different value of ⁇ C . If ⁇ C is too small, effectively most of the image would be edge, while if ⁇ C is too large, effectively most of the image would be center.
- FIG. 6 is a set of images that shows the twelve top-ranked images, with their numerical VS scores and ranks in VS score from 1 to 12.
- FIG. 7 is a set of images that shows the twelve bottom-ranked images, with their numerical VS scores and ranks in VS score from 81 to 70.
- the top-ranked images are, in general, more vignette-like and would be preferable in a search application.
- the bottom-ranked images are generally more busy and have a less obvious central focus.
- Image 81 the image with the poorest vignette score, could actually be considered a vignette.
- the reason why this image achieved a score suggesting it is a non-vignette arises from the high variance of its stark black-on-white border.
- the border effectively “tricked” this particular calculation method into reaching a misleading score.
- This problem could be avoided by use of one or more of the spatial frequency methods described above, or by use of the statistical model, assuming prior training has been performed using a sufficient number of images.
- FIG. 8 is a diagram that depicts an embodiment utilizing a circular central region 802 and with a surrounding edge region 804 .
- FIG. 9 is a diagram that depicts an embodiment utilizing an elliptical central region 902 and with a surrounding edge region R e 904 . Also there is no reason to require a hard boundary between the two regions. The classification of membership in the edge or center may instead be, for example, weighted by distance from the boundary.
- Gaussian mixture models are a useful classification scheme that may be employed where one has two classes of data and wishes to determine into which class an item is likely to fall.
- the distribution of each class of data is modeled as a mixture of Gaussian distributions with appropriate mean, covariances, and mixture weights.
- Any item belonging to a set of Gaussian-distributed data is more likely to belong to the class whose Gaussian distribution has a larger value at that point.
- a typical example involves two single-dimensional Gaussian distributions having different means and variances.
- Distribution A has mean ⁇ A and
- Distribution B has mean ⁇ B .
- the probability of a particular value being produced from distribution A or from distribution B is the vertical position of the distribution relative to the axis at that point. The point is most likely to have come from the distribution having the higher vertical position relative to the axis at the given point.
- a simple statistical model is a multi-dimensional Gaussian distribution.
- vector x represent the features for one frame
- the expression (x ⁇ c )′ is the transform of the difference vector. In practice, it is common to assume a diagonal covariance matrix, i.e.
- the off-diagonal elements of ⁇ c are zero.
- This has several advantages. Most importantly, it reduces the number of free parameters (matrix elements) from d(d ⁇ 1)/2 to d, which is important given the high dimensionality d of the problem (“d” is on the order of 100). This also means that the inverse of the matrix is much simpler to compute and is more robust, because the co-variance matrix is often ill-conditioned when computed from a small number of training samples.
- a set of example training images for each desired class is assembled, and the parameter vectors ⁇ c and ⁇ c are computed. Given an unknown image x, each image class probability is computed, and the image classified by the maximum-likelihood model.
- the log-likelihood alone is a useful measure of similarity to a particular class (the training set) and is used directly in applications such as the video browsers according to embodiments of the present invention.
- More sophisticated models can use Gaussian mixtures, given the expectation-maximization algorithm to estimate the multiple parameters and mixture weights.
- neural network or other types of classifiers are employed.
- a Gaussian mixture model includes a single-Gaussian model with a single mixture weight of 1. For single Gaussians, computing ⁇ c and ⁇ c , is computationally straightforward and is done rapidly on the fly.
- the mean vector is set to the image features and the variance vector (diagonal covariance matrix) set to some ratio of the global variance across all images. Given an unknown frame and several models, the unknown frame is classified by which model produces it with the maximum probability.
- vignettes and non-vignettes features are extracted from V and NV test images. Models are constructed for the images that are vignettes and other models are constructed for the images that are non-vignettes. If features are well chosen, the two Gaussian distributions should have peaks at substantially different locations.
- linear classifiers may be used to create decision hyper-planes capable of separating two sets of data having different class memberships.
- most classification tasks require more complex structures are needed in order to make an optimal separation.
- Support Vector Machines project data into a high-dimensional space where decision hyper-planes can be used to easily determine on which side of the boundary an image lies.
- the boundary demarcates V and NV territory. If data belong either to class V or NV, then a separating line defines a boundary on one side of which all data are V and on the other side of which all data are NV. Any new object is labeled, i.e., classified, as V or as NV according to which side of the boundary it falls upon.
- the input space comprises a number of original data.
- Original data in the current application include original V data and original NV data.
- a complex curve is created to separate the original V data and the original NV data.
- Each original object is individually mapped, i.e., rearranged, using a set of mathematical functions, known as kernels, and producing the set of mapped data.
- the process of rearranging the data is known as mapping or transformation.
- the mapped data are linearly separable and, thus, instead of constructing a complex curve, all that must be done is to find an optimal line that can separate the V data and the NV data.
- the SVM performs classification tasks by constructing hyper-planes in a multi-dimensional space that separates cases of different class labels, in this case, V and NV.
- a linear discrete transform is performed on each block, using either a DCT or a discrete Fourier transform or a Hadamard transform or a wavelet transform or another linear discrete transform.
- the result is an array of transform coefficients, which are essentially the frequency coefficients for each block.
- the result is, according to these examples, an array of transform coefficients, which are essentially the frequency coefficients for each block.
- the energy in the middle frequency band is estimated for each block by summing the amplitude or squared amplitude (energy) of frequency coefficients in the middle bands.
- the resulting amplitudes are separately summed for the edge region and for the entire image, and normalized according to their relative areas.
- a vignette score can then be calculated based on the ratio of mid-frequency energy in the edge region to mid-frequency energy in the entire image. If the frequency components were obtained from JPEG-encoded macroblocks, this may be done without the need for transforming from the frequency domain back into the spatial domain.
Abstract
Description
P(x)=((2π)−d/2|Σc|−1/2)exp(−½(x−μ c)′Σc −1(x−μ c)),
where μc, is the mean feature vector, and Σc is the covariance matrix of the d-dimensional features associated with model c. The expression (x−μc)′ is the transform of the difference vector. In practice, it is common to assume a diagonal covariance matrix, i.e. the off-diagonal elements of μc are zero. This has several advantages. Most importantly, it reduces the number of free parameters (matrix elements) from d(d−1)/2 to d, which is important given the high dimensionality d of the problem (“d” is on the order of 100). This also means that the inverse of the matrix is much simpler to compute and is more robust, because the co-variance matrix is often ill-conditioned when computed from a small number of training samples. Thus, to classify an image using Gaussian mixture models, a set of example training images for each desired class is assembled, and the parameter vectors μc and Σc are computed. Given an unknown image x, each image class probability is computed, and the image classified by the maximum-likelihood model. The log-likelihood alone is a useful measure of similarity to a particular class (the training set) and is used directly in applications such as the video browsers according to embodiments of the present invention. More sophisticated models can use Gaussian mixtures, given the expectation-maximization algorithm to estimate the multiple parameters and mixture weights. As further alternatives, neural network or other types of classifiers are employed. A Gaussian mixture model includes a single-Gaussian model with a single mixture weight of 1. For single Gaussians, computing μc and Σc, is computationally straightforward and is done rapidly on the fly. In the case of a training model from a single image, the mean vector is set to the image features and the variance vector (diagonal covariance matrix) set to some ratio of the global variance across all images. Given an unknown frame and several models, the unknown frame is classified by which model produces it with the maximum probability.
Claims (26)
Priority Applications (2)
| Application Number | Priority Date | Filing Date | Title |
|---|---|---|---|
| US11/032,576 US7492921B2 (en) | 2005-01-10 | 2005-01-10 | System and method for detecting and ranking images in order of usefulness based on vignette score |
| JP2006002143A JP4830492B2 (en) | 2005-01-10 | 2006-01-10 | Method, system, apparatus and program for ranking images by detecting useful images and ranking images in order of usefulness |
Applications Claiming Priority (1)
| Application Number | Priority Date | Filing Date | Title |
|---|---|---|---|
| US11/032,576 US7492921B2 (en) | 2005-01-10 | 2005-01-10 | System and method for detecting and ranking images in order of usefulness based on vignette score |
Publications (2)
| Publication Number | Publication Date |
|---|---|
| US20060153456A1 US20060153456A1 (en) | 2006-07-13 |
| US7492921B2 true US7492921B2 (en) | 2009-02-17 |
Family
ID=36653309
Family Applications (1)
| Application Number | Title | Priority Date | Filing Date |
|---|---|---|---|
| US11/032,576 Expired - Fee Related US7492921B2 (en) | 2005-01-10 | 2005-01-10 | System and method for detecting and ranking images in order of usefulness based on vignette score |
Country Status (2)
| Country | Link |
|---|---|
| US (1) | US7492921B2 (en) |
| JP (1) | JP4830492B2 (en) |
Cited By (18)
| Publication number | Priority date | Publication date | Assignee | Title |
|---|---|---|---|---|
| US20050246625A1 (en) * | 2004-04-30 | 2005-11-03 | Ibm Corporation | Non-linear example ordering with cached lexicon and optional detail-on-demand in digital annotation |
| US20070174872A1 (en) * | 2006-01-25 | 2007-07-26 | Microsoft Corporation | Ranking content based on relevance and quality |
| US20080086468A1 (en) * | 2006-10-10 | 2008-04-10 | Microsoft Corporation | Identifying sight for a location |
| US20090310187A1 (en) * | 2008-06-12 | 2009-12-17 | Harris Scott C | Face Simulation in Networking |
| US7657504B2 (en) | 2006-10-10 | 2010-02-02 | Microsoft Corporation | User interface for displaying images of sights |
| US20140341425A1 (en) * | 2013-05-14 | 2014-11-20 | Google Inc. | Providing visual effects for images |
| US9396214B2 (en) | 2006-01-23 | 2016-07-19 | Microsoft Technology Licensing, Llc | User interface for viewing clusters of images |
| US9715714B2 (en) | 2015-08-17 | 2017-07-25 | Adobe Systems Incorporated | Content creation and licensing control |
| US9734167B2 (en) | 2011-09-21 | 2017-08-15 | Horsetooth Ventures, LLC | Interactive image display and selection system |
| US9846822B2 (en) * | 2015-12-31 | 2017-12-19 | Dropbox, Inc. | Generating and utilizing normalized scores for classifying digital objects |
| US10366433B2 (en) | 2015-08-17 | 2019-07-30 | Adobe Inc. | Methods and systems for usage based content search results |
| US10475098B2 (en) | 2015-08-17 | 2019-11-12 | Adobe Inc. | Content creation suggestions using keywords, similarity, and social networks |
| US10592548B2 (en) | 2015-08-17 | 2020-03-17 | Adobe Inc. | Image search persona techniques and systems |
| US10614366B1 (en) | 2006-01-31 | 2020-04-07 | The Research Foundation for the State University o | System and method for multimedia ranking and multi-modal image retrieval using probabilistic semantic models and expectation-maximization (EM) learning |
| US10853983B2 (en) | 2019-04-22 | 2020-12-01 | Adobe Inc. | Suggestions to enrich digital artwork |
| US10878021B2 (en) | 2015-08-17 | 2020-12-29 | Adobe Inc. | Content search and geographical considerations |
| US11048779B2 (en) | 2015-08-17 | 2021-06-29 | Adobe Inc. | Content creation, fingerprints, and watermarks |
| US11068532B2 (en) | 2011-09-21 | 2021-07-20 | Horsetooth Ventures, LLC | Interactive image display and selection system |
Families Citing this family (15)
| Publication number | Priority date | Publication date | Assignee | Title |
|---|---|---|---|---|
| US20070106627A1 (en) * | 2005-10-05 | 2007-05-10 | Mohit Srivastava | Social discovery systems and methods |
| US20080059991A1 (en) * | 2006-08-31 | 2008-03-06 | Nissim Romano | System and a method for detecting duplications in digital content |
| JP4992081B2 (en) * | 2006-09-20 | 2012-08-08 | 国立大学法人山口大学 | Method for inspecting surface condition of object by image processing and image processing program therefor |
| US7885482B2 (en) | 2006-10-26 | 2011-02-08 | Microsoft Corporation | Coverage-based image relevance ranking |
| US7711193B2 (en) * | 2006-11-07 | 2010-05-04 | Aol Inc. | Recognizing blank and nearly blank images |
| CN101521004B (en) * | 2008-02-29 | 2011-12-14 | 鹏智科技(深圳)有限公司 | Electronic device with image processing function and image processing method thereof |
| US8260062B2 (en) * | 2009-05-07 | 2012-09-04 | Fuji Xerox Co., Ltd. | System and method for identifying document genres |
| US9336241B2 (en) | 2009-08-06 | 2016-05-10 | A.L.D Software Ltd | Method and system for image search |
| RU2012105677A (en) * | 2009-08-06 | 2013-09-20 | Алд Софтвеа Лтд. | METHOD AND SYSTEM FOR SEARCHING AN IMAGE |
| FR2952497B1 (en) * | 2009-11-09 | 2012-11-16 | Canon Kk | METHOD FOR ENCODING AND DECODING AN IMAGE STREAM; ASSOCIATED DEVICES |
| US8442967B2 (en) * | 2010-02-04 | 2013-05-14 | Identix Incorporated | Operator-assisted iterative biometric search |
| CN102193934B (en) * | 2010-03-11 | 2013-05-29 | 株式会社理光 | System and method for searching representative image of image set |
| US8401282B2 (en) * | 2010-03-26 | 2013-03-19 | Mitsubishi Electric Research Laboratories, Inc. | Method for training multi-class classifiers with active selection and binary feedback |
| JP6463095B2 (en) * | 2014-11-25 | 2019-01-30 | キヤノン株式会社 | Image search apparatus and method |
| JP6350571B2 (en) * | 2016-03-23 | 2018-07-04 | トヨタ自動車株式会社 | Image display device |
Citations (3)
| Publication number | Priority date | Publication date | Assignee | Title |
|---|---|---|---|---|
| US4863384A (en) * | 1986-04-10 | 1989-09-05 | Keilty, Goldsmith & Boone | Personalized feedback system utilizing pre-recorded media and method of making same |
| US6125194A (en) * | 1996-02-06 | 2000-09-26 | Caelum Research Corporation | Method and system for re-screening nodules in radiological images using multi-resolution processing, neural network, and image processing |
| US6751354B2 (en) | 1999-03-11 | 2004-06-15 | Fuji Xerox Co., Ltd | Methods and apparatuses for video segmentation, classification, and retrieval using image class statistical models |
Family Cites Families (5)
| Publication number | Priority date | Publication date | Assignee | Title |
|---|---|---|---|---|
| JP2002245411A (en) * | 2001-02-15 | 2002-08-30 | Tamura Electric Works Ltd | Card reader |
| JP2004064700A (en) * | 2002-07-31 | 2004-02-26 | Sony Corp | Image classification apparatus, image classification method, program and recording medium, and image classification system |
| JP2004171375A (en) * | 2002-11-21 | 2004-06-17 | Canon Inc | Image processing method |
| US7620202B2 (en) * | 2003-06-12 | 2009-11-17 | Honda Motor Co., Ltd. | Target orientation estimation using depth sensing |
| US7555718B2 (en) * | 2004-11-12 | 2009-06-30 | Fuji Xerox Co., Ltd. | System and method for presenting video search results |
-
2005
- 2005-01-10 US US11/032,576 patent/US7492921B2/en not_active Expired - Fee Related
-
2006
- 2006-01-10 JP JP2006002143A patent/JP4830492B2/en not_active Expired - Fee Related
Patent Citations (3)
| Publication number | Priority date | Publication date | Assignee | Title |
|---|---|---|---|---|
| US4863384A (en) * | 1986-04-10 | 1989-09-05 | Keilty, Goldsmith & Boone | Personalized feedback system utilizing pre-recorded media and method of making same |
| US6125194A (en) * | 1996-02-06 | 2000-09-26 | Caelum Research Corporation | Method and system for re-screening nodules in radiological images using multi-resolution processing, neural network, and image processing |
| US6751354B2 (en) | 1999-03-11 | 2004-06-15 | Fuji Xerox Co., Ltd | Methods and apparatuses for video segmentation, classification, and retrieval using image class statistical models |
Non-Patent Citations (2)
| Title |
|---|
| Girgensohn, A., Boreczky, J., Wilcox, L. Keyframe-based user interfaces for digital video, IEEE Computer, pp. 61-67,Sep. 2001. |
| Girgensohn, A., Foote, J. Video classification using transform coefficients. Proc. of the International Conference of Acoustics, Speech, and Signal Processing, vol. 6, pp. 3045-3048, Phoenix, Arizona, 1999. |
Cited By (27)
| Publication number | Priority date | Publication date | Assignee | Title |
|---|---|---|---|---|
| US20050246625A1 (en) * | 2004-04-30 | 2005-11-03 | Ibm Corporation | Non-linear example ordering with cached lexicon and optional detail-on-demand in digital annotation |
| US10120883B2 (en) | 2006-01-23 | 2018-11-06 | Microsoft Technology Licensing, Llc | User interface for viewing clusters of images |
| US9396214B2 (en) | 2006-01-23 | 2016-07-19 | Microsoft Technology Licensing, Llc | User interface for viewing clusters of images |
| US20070174872A1 (en) * | 2006-01-25 | 2007-07-26 | Microsoft Corporation | Ranking content based on relevance and quality |
| US7836050B2 (en) * | 2006-01-25 | 2010-11-16 | Microsoft Corporation | Ranking content based on relevance and quality |
| US10614366B1 (en) | 2006-01-31 | 2020-04-07 | The Research Foundation for the State University o | System and method for multimedia ranking and multi-modal image retrieval using probabilistic semantic models and expectation-maximization (EM) learning |
| US20080086468A1 (en) * | 2006-10-10 | 2008-04-10 | Microsoft Corporation | Identifying sight for a location |
| US7657504B2 (en) | 2006-10-10 | 2010-02-02 | Microsoft Corporation | User interface for displaying images of sights |
| US7707208B2 (en) | 2006-10-10 | 2010-04-27 | Microsoft Corporation | Identifying sight for a location |
| US20090310187A1 (en) * | 2008-06-12 | 2009-12-17 | Harris Scott C | Face Simulation in Networking |
| US10459967B2 (en) | 2011-09-21 | 2019-10-29 | Horsetooth Ventures, LLC | Interactive image display and selection system |
| US9734167B2 (en) | 2011-09-21 | 2017-08-15 | Horsetooth Ventures, LLC | Interactive image display and selection system |
| US11068532B2 (en) | 2011-09-21 | 2021-07-20 | Horsetooth Ventures, LLC | Interactive image display and selection system |
| US9881202B2 (en) * | 2013-05-14 | 2018-01-30 | Google Llc | Providing visual effects for images |
| US20140341425A1 (en) * | 2013-05-14 | 2014-11-20 | Google Inc. | Providing visual effects for images |
| US10475098B2 (en) | 2015-08-17 | 2019-11-12 | Adobe Inc. | Content creation suggestions using keywords, similarity, and social networks |
| US10366433B2 (en) | 2015-08-17 | 2019-07-30 | Adobe Inc. | Methods and systems for usage based content search results |
| US9715714B2 (en) | 2015-08-17 | 2017-07-25 | Adobe Systems Incorporated | Content creation and licensing control |
| US10592548B2 (en) | 2015-08-17 | 2020-03-17 | Adobe Inc. | Image search persona techniques and systems |
| US9911172B2 (en) | 2015-08-17 | 2018-03-06 | Adobe Systems Incorporated | Content creation and licensing control |
| US10878021B2 (en) | 2015-08-17 | 2020-12-29 | Adobe Inc. | Content search and geographical considerations |
| US11048779B2 (en) | 2015-08-17 | 2021-06-29 | Adobe Inc. | Content creation, fingerprints, and watermarks |
| US11288727B2 (en) | 2015-08-17 | 2022-03-29 | Adobe Inc. | Content creation suggestions using failed searches and uploads |
| US10255527B2 (en) * | 2015-12-31 | 2019-04-09 | Dropbox, Inc. | Generating and utilizing normalized scores for classifying digital objects |
| US9846822B2 (en) * | 2015-12-31 | 2017-12-19 | Dropbox, Inc. | Generating and utilizing normalized scores for classifying digital objects |
| US20180012109A1 (en) * | 2015-12-31 | 2018-01-11 | Dropbox, Inc. | Generating and utilizing normalized scores for classifying digital objects |
| US10853983B2 (en) | 2019-04-22 | 2020-12-01 | Adobe Inc. | Suggestions to enrich digital artwork |
Also Published As
| Publication number | Publication date |
|---|---|
| JP2006244462A (en) | 2006-09-14 |
| US20060153456A1 (en) | 2006-07-13 |
| JP4830492B2 (en) | 2011-12-07 |
Similar Documents
| Publication | Publication Date | Title |
|---|---|---|
| US7492921B2 (en) | System and method for detecting and ranking images in order of usefulness based on vignette score | |
| US8009921B2 (en) | Context dependent intelligent thumbnail images | |
| Suh et al. | Automatic thumbnail cropping and its effectiveness | |
| Wang et al. | SIMPLIcity: Semantics-sensitive integrated matching for picture libraries | |
| Ravì et al. | Semantic segmentation of images exploiting DCT based features and random forest | |
| Marques et al. | Content-based image and video retrieval | |
| Jabid et al. | Local directional pattern (LDP)–A robust image descriptor for object recognition | |
| US6738494B1 (en) | Method for varying an image processing path based on image emphasis and appeal | |
| US7194134B2 (en) | Hierarchical, probabilistic, localized, semantic image classifier | |
| US20030128877A1 (en) | Method and system for processing images for themed imaging services | |
| JP2011154687A (en) | Method and apparatus for navigating image data set, and program | |
| US8463050B2 (en) | Method for measuring the dissimilarity between a first and a second images and a first and second video sequences | |
| Daniilidis et al. | Computer Vision--ECCV 2010: 11th European Conference on Computer Vision, Heraklion, Crete, Greece, September 5-11, 2010, Proceedings, Part V | |
| Harding et al. | Visual saliency from image features with application to compression | |
| Joint et al. | PIRIA: a general tool for indexing, search, and retrieval of multimedia content | |
| JP2004517416A (en) | Coded pattern and method for extracting the code | |
| Konak | A content-based image retrieval system for texture and color queries | |
| White et al. | ImageGREP: Fast visual pattern matching in image databases | |
| Shao et al. | Automatic image annotation for semantic image retrieval | |
| Gao et al. | Spatial multi-scale gradient orientation consistency for place instance and Scene category recognition | |
| Sarin et al. | Holistic feature extraction for automatic image annotation | |
| Bors et al. | Image retrieval based on query by saliency content | |
| Cinque et al. | Retrieval of images using rich-region descriptions | |
| Seo et al. | ROI-based medical image retrieval using human-perception and MPEG-7 visual descriptors | |
| Da Rugna et al. | Blur identification in image processing |
Legal Events
| Date | Code | Title | Description |
|---|---|---|---|
| AS | Assignment |
Owner name: FUJI XEROX CO., LTD., JAPAN Free format text: ASSIGNMENT OF ASSIGNORS INTEREST;ASSIGNOR:FOOTE, JONATHAN T.;REEL/FRAME:016167/0331 Effective date: 20050105 |
|
| AS | Assignment |
Owner name: FUJI XEROX CO., LTD., JAPAN Free format text: ASSIGNMENT OF ASSIGNORS INTEREST;ASSIGNOR:FOOTE, JONATHAN T.;REEL/FRAME:021383/0717 Effective date: 20050105 |
|
| FEPP | Fee payment procedure |
Free format text: PAYOR NUMBER ASSIGNED (ORIGINAL EVENT CODE: ASPN); ENTITY STATUS OF PATENT OWNER: LARGE ENTITY |
|
| STCF | Information on status: patent grant |
Free format text: PATENTED CASE |
|
| FPAY | Fee payment |
Year of fee payment: 4 |
|
| FPAY | Fee payment |
Year of fee payment: 8 |
|
| FEPP | Fee payment procedure |
Free format text: MAINTENANCE FEE REMINDER MAILED (ORIGINAL EVENT CODE: REM.); ENTITY STATUS OF PATENT OWNER: LARGE ENTITY |
|
| LAPS | Lapse for failure to pay maintenance fees |
Free format text: PATENT EXPIRED FOR FAILURE TO PAY MAINTENANCE FEES (ORIGINAL EVENT CODE: EXP.); ENTITY STATUS OF PATENT OWNER: LARGE ENTITY |
|
| STCH | Information on status: patent discontinuation |
Free format text: PATENT EXPIRED DUE TO NONPAYMENT OF MAINTENANCE FEES UNDER 37 CFR 1.362 |
|
| FP | Lapsed due to failure to pay maintenance fee |
Effective date: 20210217 |