US7276376B2 - Analyzing method of a blood coagulation reaction - Google Patents
Analyzing method of a blood coagulation reaction Download PDFInfo
- Publication number
- US7276376B2 US7276376B2 US10/307,922 US30792202A US7276376B2 US 7276376 B2 US7276376 B2 US 7276376B2 US 30792202 A US30792202 A US 30792202A US 7276376 B2 US7276376 B2 US 7276376B2
- Authority
- US
- United States
- Prior art keywords
- reaction
- item
- blood coagulation
- time
- value
- Prior art date
- Legal status (The legal status is an assumption and is not a legal conclusion. Google has not performed a legal analysis and makes no representation as to the accuracy of the status listed.)
- Active, expires
Links
Images


Classifications
-
- G—PHYSICS
- G01—MEASURING; TESTING
- G01N—INVESTIGATING OR ANALYSING MATERIALS BY DETERMINING THEIR CHEMICAL OR PHYSICAL PROPERTIES
- G01N33/00—Investigating or analysing materials by specific methods not covered by groups G01N1/00 - G01N31/00
- G01N33/48—Biological material, e.g. blood, urine; Haemocytometers
- G01N33/483—Physical analysis of biological material
- G01N33/487—Physical analysis of biological material of liquid biological material
- G01N33/49—Blood
- G01N33/4905—Determining clotting time of blood
-
- G—PHYSICS
- G01—MEASURING; TESTING
- G01N—INVESTIGATING OR ANALYSING MATERIALS BY DETERMINING THEIR CHEMICAL OR PHYSICAL PROPERTIES
- G01N21/00—Investigating or analysing materials by the use of optical means, i.e. using sub-millimetre waves, infrared, visible or ultraviolet light
- G01N21/75—Systems in which material is subjected to a chemical reaction, the progress or the result of the reaction being investigated
- G01N21/77—Systems in which material is subjected to a chemical reaction, the progress or the result of the reaction being investigated by observing the effect on a chemical indicator
- G01N21/82—Systems in which material is subjected to a chemical reaction, the progress or the result of the reaction being investigated by observing the effect on a chemical indicator producing a precipitate or turbidity
Definitions
- the present invention relates to an analyzing method of a blood coagulation reaction. More particularly the invention relates to an analyzing method of a blood coagulation reaction for measuring a blood coagulation time, the method being capable of detecting abnormality in the blood coagulation reaction.
- Blood coagulation detection methods include the method of detecting the increase in viscosity (viscosity detection method), the method of detecting turbidity (turbidity detection method), and their combined method.
- a bar-shaped or spherical magnetic element is placed in the plasma specimen, and a coagulation reagent is added.
- the motion of the magnetic element becomes slower due to coagulation, and this slowing down is detected.
- the viscosity detection method produces variable results depending on the shape of the fibrin clumps which are the final product of blood coagulation (that is, the quantity or viscosity of the fibrin). Furthermore, it is impossible to detect coagulation unless the viscosity increases to above a specific level. Besides, because the measurement principle is based on observing the motion of the magnetic element, it is dependent on the strength of the magnetic field of the element.
- the turbidity detection method involves mixing the plasma specimen and coagulation reagent, and it does not require a magnetic element or the like.
- the method can be the transmitted light detection method or the scattered light detection method. With these methods of detection, if the fibrinogen quantity is small, the change in the quantity of transmitted or scattered light can be detected, and it is hence free from the shortcoming of the viscosity detection method.
- Methods for analyzing a blood coagulation point include: (1) a percentage detection method; (2) a differential method; (3) a double differential method; (4) an inflection point method; (5) a fluctuation detection method and the like.
- the percentage detection method the blood coagulation point is detected as a point showing a 50% optical change amount relative to the optical change amount when the blood coagulation finishes, at which point an optical change rate per a unit time is the largest and the rate of polymerization reaction of fibrin monomers is high. Thereby more precise coagulation measurement can be performed for samples such as low fibrinogen samples, chyle samples and laked blood samples.
- plasma is mixed with a blood coagulation reagent to start the blood coagulation reaction, and the degree of turbidity during the process of the plasma coagulating, that is, during the process of fibrin formation, is detected as a change of the intensity of a signal by an optical detector.
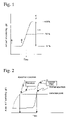
- the optical detector is of a scattered light detection system, such a change is represented with time plotted in abscissa and the scattered light amount (intensity) plotted in ordinate, for example, as shown in FIG. 1 .
- Point A in FIG. 1 indicates a time when plasma is mixed with a coagulation reagent to start the blood coagulation reaction. Then, the blood coagulation reaction advances through a cascade reaction. As stable fobrous fibrin is formed by fibrinogen in the plasma, a change appears in the amount of scattered light (point B). As the formation of the stable fibrin advances, the amount of the scattered light increases. When most of fibrinogen is consumed, the amount of scattered light does not change any more and the blood coagulation reaction terminates (point C).
- a blood coagulation time may be defined as a point where the amount of the scattered light reaches 50% (point T).
- ⁇ H is indicative of a change of the amount of scattered light from the start of the blood coagulation reaction to the termination thereof.
- the blood coagulation progresses by two pathways in general: One pathway is called as an extrinsic pathway, through which, starting with tissue thromboplastine discharged from epidermic cells and the like, the coagulation factor VII is activated, which in turn activates the coagulation factor X, then, the activation of the coagulation factor V and the factor II occurs, and finally, fibrinogen is transformed into fibrin.
- One pathway is called as an extrinsic pathway, through which, starting with tissue thromboplastine discharged from epidermic cells and the like, the coagulation factor VII is activated, which in turn activates the coagulation factor X, then, the activation of the coagulation factor V and the factor II occurs, and finally, fibrinogen is transformed into fibrin.
- PT prothrombin time
- the other pathway is referred to as an intrinsic coagulation, through which the coagulation factor XII is activated by contacting the surface of a solid phase having a negative charge and then activates the factor XI, the activated factor XI in turn activates the factor IX, and further, the activated factor IX activates the factor X with collaborative action of calcium ions and the factor VIII, then, the activation of the factor V and the factor II occurs, and finally, fibrinogen is transformed into fibrin.
- the strength or weakness that is, the normality or abnormality, of the blood coagulation reaction through this pathway is judged by measuring an “activated partial thromboplastine time (APTT),” a “partial thromboplastine time (PTT).”
- fibrinogen is required to be transformed into fibrin, whereby the coagulation completes.
- the blood coagulation is a multiple-stage reaction, and thus, when abnormality occurs with the reaction pathways, unstable behavior may be expressed. For example, the reaction falls in such a state as if the reaction apparently stops temporarily in the middle of the reaction (an optical change is not observed), or alternatively, a gradual optical change is observed immediately after the blood coagulation reagent is introduced into plasma. Thus there are cases in which the reaction curve as shown in FIG. 1 is not always produced.
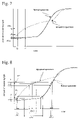
- APTT in the case where the coagulation time is measured based on an optical change amount with respect to high fibrinogen samples collected from heparin-administered patients, APTT sometimes tends to be extremely short. It is considered that such samples exhibit a two-bump reaction (the blood coagulation curve has two increase phases) due to a coagulation reaction caused by an extrinsic sthenia state as shown in FIG. 2 : The optical change amount of the samples gradually increases with an elapse of time from the initial stage of the reaction, and then the optical change amount is larger than that of a normal coagulation reaction (second stage). As a result of such behavior different from usual, an incorrect coagulation time is considered to be computed.
- an analyzing method of a blood coagulation reaction by detecting an optical change of a blood sample with an elapse of time comprising:
- FIG. 1 is a view showing a change of scattered light due to a coagulation reaction.
- FIG. 2 is a view showing a change of scattered light from a sample which indicates abnormality in an initial stage of the blood coagulation reaction.
- FIG. 3 is a view showing the constitution of a blood coagulation measuring apparatus.
- FIG. 4 is a flowchart showing the computation of a coagulation time by the blood coagulation measuring apparatus.
- FIG. 5 is a view showing a change with time in the amount of scattered light in an example.
- FIG. 6 is a view illustrating the detection of a reaction rate abnormality of the fibrin formation stage.
- FIG. 7 is a view illustrating the detection of the presence or absence of an initial stage of the blood coagulation reaction.
- FIG. 8 is a view illustrating the detection of the presence or absence of a drift in a reaction curve.
- FIG. 9 is a view illustrating the detection of an abnormality of a time until a predetermined optical change amount has been reached.
- FIG. 10 is a flowchart illustrating the detection of a reaction rate abnormality of the fibrin formation stage.
- FIG. 11 is a flowchart illustrating the detection of the presence or absence of abnormality in an initial stage of the blood coagulation reaction.
- FIG. 12 is a flowchart illustrating the detection of the presence or absence of a drift in a reaction curve.
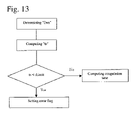
- FIG. 13 is a flowchart illustrating the detection of an abnormality of a time until a predetermined optical change amount has been reached.
- the blood sample in the present invention means plasma or diluted plasma separated from blood of mammals including human beings.
- the blood sample is mixed with a coagulation reagent which can initiate the coagulation reaction by being added to the blood sample and is used for measuring a blood coagulation time.
- a coagulation reagent which can initiate the coagulation reaction by being added to the blood sample and is used for measuring a blood coagulation time.
- Different kinds of reagents may be used depending on what type of a blood coagulation time is to be measured. For example, reagents for PT (prothrombin time) measurement or APTT (activated partial thromboplastine time) measurement, and Fbg (fibrinogen amount) measurement can be employed.
- an optical change of the blood sample is measured with time from the start to the end of a blood coagulation reaction in order to monitor the blood coagulation reaction.
- the optical change means a change in a scattered light amount, a transmitted light amount and the like.
- the blood coagulation reaction can be monitored by use of a blood coagulation analyzer, as described later, which is comprised mainly of a light-transmission container for accommodating the blood sample, a reagent supplier for supplying a blood coagulation reagent to the container, a light source for irradiating the accommodated blood sample with light, a photoreceptor for receiving light, e.g., scattered light, from the blood sample, a measuring section for measuring a change with time of the amount (or intensity) of the light, e.g., the scattered light, after the blood coagulation reagent is supplied to the blood sample and computing a blood coagulation time, and a display for displaying a result of computation by the measuring section.
- a blood coagulation analyzer as described later, which is comprised mainly of a light-transmission container for accommodating the blood sample, a reagent supplier for supplying a blood coagulation reagent to the container, a light source for irradiating the accommodated blood sample
- the blood coagulation reaction can be analyzed from the monitored blood coagulation reaction to detect the presence or absence of abnormality in the blood coagulation reaction, especially in an initial stage of the blood coagulation reaction (first stage).
- the analysis of the reaction can be performed by setting a specific time point or range, or a specific optical change amount point or range as a checkpoint or a check region, for example in a coagulation reaction curve, from the start of the reaction to the end of the reaction, computing a reaction state (reaction rate, change amount, a time required for a specific change, etc.) at the set point or region and comparing the computed reaction state with a predetermined threshold value.
- the threshold value can be experimentally or empirically determined from tendency of normal samples or the like.
- the analysis can be carried out, for example, on one or more of the following items:
- the optical change is very small before fibrin stars to form as a result of advances of the blood coagulation caused by the blood coagulation reagent introduced into the blood sample.
- a rapid optical change occurs within a short time. Therefore, by setting a checkpoint at a position of a specific change amount between the start of the optical change due to the fibrin formation and the end of coagulation, e.g., the fibrin formation, and checking the reaction rate at the checkpoint, abnormality can be detected.
- the reaction rate may be obtained by computing an optical change rate per unit time (inclination) at the checkpoint, or alternatively, by setting a specific range with the checkpoint as the center and counting a time required for producing the optical change of that range.
- a threshold is set for the reaction rate (the threshold can be set experimentally or experientially), and if the obtained reaction rate does not reach the threshold, it is judged that “a reaction rate abnormality” exists.
- an error flag may be set (for example, a sign such as asterisks “*” or a character such as “E”) and displayed on the display section. This operation applies to the following items.
- a threshold is set for the optical change amount from the start to the end of the fibrin formation. If this threshold is not met, it is judged that a measurement error exists, and the result is not to be reported. If the threshold is exceeded, the result may be reported and displayed with an error flag which indicates a measurement error.
- the rate of the optical change is little at the initial stage of the reaction, and the rate of the optical change is large during the fibrin formation. A significant difference is seen between the reaction rates at the initial stage of the reaction and during the fibrin formation. On the other hand, in a sample showing a gradual optical change, the reaction rates do not show so significant a difference as those of normal samples. Therefore, it is possible to check whether or not the optical change amount gradually increases (whether or not a drift exists) by comparing the reaction rates at the initial stage of the reaction and at the fibrin formation stage. Specifically, checkpoints are set at a position of a specific optical change amount at the initial stage of the reaction and at a position of a specific optical change amount at the fibrin formation stage, and the reaction rate at each point is obtained.
- a ratio (the reaction rate at the initial stage of the reaction/the reaction rate during the fibrin formation) is computed. If the computed ratio does not meet a preset threshold, it is judged that a drift exists.
- the reaction rates can be obtained in the same manner as described previously.
- the abnormality of the reaction, especially the initial stage of the reaction can be detected with higher sensitivity by combining two or more of the above items (1) to (4).
- the method of the present invention is effective in APTT measurement.
- the blood coagulation reaction is analyzed by use of a blood coagulation analyzer as shown in FIG. 3 .
- a blood coagulation analyzer plasma to be analyzed is placed in advance in a transparent testing tube 1 .
- a reagent for example, a PT reagent
- a pipette 3 When a reagent (for example, a PT reagent) is supplied from a reagent supply device 2 to the testing tube 1 via a pipette 3 , light is emitted from an LED 4 to the testing tube 1 . Light scattered inside the testing tube 1 is received by a photodiode 5 , and the amount of the scattered light is detected.
- a measuring section 6 is provided with a detection section 6 a for detecting the amount of scattered light (change: increase, decrease or saturation); a judgment section 6 b for judging whether or not the amount of scattered light increases; a control section 6 c for, if saturation of the amount of scattered light is detected, judging whether or not the amount of scattered light further increases within a predetermined subsequent time and for, if the amount increases, controlling the detection section 6 a and the judgment section 6 b so that the detection of a subsequent saturation is repeatedly performed, and a computation section 6 d for, when the saturation of the amount of scattered light is finally detected, computing a coagulation time based on a saturation value.
- the measuring section 6 is adapted to process an output signal of the photodiode 5 and display a processing result on a CRT 7 .
- the transparent testing tube 1 is used as the light transmission container in the above-described example, the light transmission container may be transparent at least at a portion involved in optical detection.
- a glass- or resin-made transparent testing tube or the like of 10 mm to 20 mm in diameter and 50 mm to 100 mm in height or the like, for example, may be used.
- the LED 4 is employed as the light source, for example.
- the photo-diode 5 is employed as the light receiver, but other devices such as a photo-transistor may be used as the light receiver.
- the CRT 7 is used as the display section, but the display section may be formed of a liquid crystal display and a device for printing the analysis results on printing paper as well.
- a microcomputer composed of a CPU, a ROM, and a RAM can be employed as the measuring section 6 .
- the detection section 6 a may sequentially acquire and store values of the amount of scattered light at every predetermined time.
- the judgment section 6 b senses the start of the coagulation reaction, and then, i) may compute a difference between the most updated saturation value and the most updated acquisition value, whereby, when the difference is smaller than a first predetermined value, it may judge that the amount of scattered light does not increase (saturates). Or alternatively, ii) the judgment section 6 b may compute a ratio of the difference between the most updated acquisition value and the minimum acquisition value to that between the most updated saturation value and the minimum acquisition value, whereby, when the ratio is smaller than a second predetermined value, it may judge that the amount of scattered light does not increase (saturates).
- the judgment section 6 b may compute the difference between the most updated saturation value and the most updated acquisition value and compute a ratio of the difference between the most updated acquisition value and the minimum acquisition value to the difference between the most updated saturation value and the minimum acquisition value, whereby, when the difference is smaller than the first predetermined value and when the ratio is smaller than the second predetermined value, it may judge the amount of scattered light does not increase.
- the saturation of the amount of scattered light has been detected, it is monitored whether or not the amount of scattered light does not further increase for a predetermined time. When the amount increases again, the detection of the saturation of the amount of scattered light is repeated to detect the final saturation value.
- the computation section 6 d can determine the coagulation time more precisely.
- the judgment section 6 b may preferably analyze the advance of the coagulation reaction and, if a predetermined condition is met, judge an initial reaction abnormality.
- the saturation means that the change of the amount of scattered light with time disappears temporarily or permanently.
- a general procedure of the blood coagulation analyzing method is further described in detail with reference to a flowchart shown in FIG. 4 .
- step S 1 initial setting is provided.
- the LED 4 is lit at the same time.
- a current amount of scattered light D(i) is acquired from the photodiode 5 , and measurement is started (steps S 2 and S 3 ). Acquisition of the amount of scattered light is performed on every 0.1 second, for example.
- a preset maximum measurement time Tm for example, 600 seconds
- D(i) at this time is regarded as a tentative saturation value “Del” (step S 7 ).
- the saturation value “Del” is determined to be a final saturation value “Den” (step S 10 ).
- FIG. 5 is a graph depicting the above described process. As shown in FIG. 5 , when “Den” is taken as 100% and “Dmin” is taken as 0%, a time “t 1 ” when the amount of scattered light reaches 50% is computed as a coagulation time. Then, the graph of FIG. 5 and the value of “t 1 ” are displayed on the CRT 7 .
- step S 8 when D(i) has changed in the step S 8 , “d” is reset to (d+Del), and the routine reverts to the step S 3 . Then, the steps S 3 to S 8 are repeated.
- the saturation value “Del” is determined to be a final saturation value “Den” (step S 10 ). However, in the step S 4 , if time after the start of measurement exceeds “Tm”, the measurement is terminated, and “immeasurable” is displayed on the CRT 7 .
- an initial reaction abnormality check (step S 11 ) is then performed at the judgment section as follows. If it is judged that no abnormality occurs, the coagulation time is computed. If it is judged that abnormality occurs, an error flag is set and displayed on the CRT 7 .
- the blood coagulation reaction is measured, and a blood coagulation reaction curve is generated. Then, as shown in the flowchart of FIG. 10 , the final saturation value Den of the amount of scattered light at the coagulation endpoint is determined about the abnormal sample.
- a checkpoint H T is first preset.
- H T can be arbitrarily determined
- the checkpoint H T may preferably be set at a point exhibiting around 50% of the total scattered light change amount because the reaction rates of the normal sample and the abnormal sample tend to differ easily from each other.
- a window with a width of “h” is set to have H T at the center (i.e., symmetric window). The value of “h” can be arbitrarily set.
- a time “dta” necessary for the abnormal sample to produce the change of the amount of scattered light of the window is longer than the time “dtn” necessary for the normal sample to produce the change of the amount of scattered light of the window. Therefore, a threshold dTmax (dTmax can be determined experimentally or experientially) is preset, and if dT>dTmax is met, it is judged as abnormality. Once the abnormality is judged, an error flag can be set and displayed.
- the blood coagulation reaction is measured, and a blood coagulation reaction curve is generated. Then, as shown in the flowchart of FIG. 11 , the final saturation value Den of the amount of scattered light at the coagulation endpoint is determined about the abnormal sample, and a change amount ⁇ H in the amount of the scattered light is calculated.
- a first time point t 1 and a second time point t 2 are preset in a time interval of the initial stage of the reaction (about 20 seconds for APTT), and an interval between “t 1 ” and “t 2 ” is defined as a check region.
- a search is made for a point (t max , H max ) of a maximum value (H max ) in change of the amount of scattered light and a point (t min , H min ) of a minimum value (H min ) in the change of the amount of scattered light. If there exist a plurality of points of the maximum value, the one of these points having the maximum time is defined as (t max , H max ).
- the one of these points having the minimum time can be defined as (t min , H min ).
- the change amount of scattered light dHa in the abnormal sample is larger than the change amount dHn of scattered light in the normal sample. Therefore, a threshold dH Limit is set, and if dH ⁇ dH Limit is met, it is judged as abnormality. Then, an error flag is set and displayed on the display section.
- a threshold ⁇ H Limit is set for the change amount of scattered light ⁇ H from the start of the reaction to the endpoint of the coagulation, and, if dH ⁇ dH Limit and t max>t min and ⁇ H ⁇ H Limit hold, it is regarded that the initial reaction is found, and moreover, that a sufficient optical change amount due to the fibrin formation does not occur. Then, an error flag is set to indicate a measurement error and is displayed on the display section. If dH ⁇ dH Limit and t max>t min and ⁇ H> ⁇ H Limit , it is judged that the initial reaction is found but that a sufficient optical change amount exists. Then, an error flag is set to indicate a measurement error. Further, the coagulation time is computed, and the result is displayed. In the case of dH ⁇ dH Limit , it is judged that no initial reaction occurs. Then, the coagulation time is computed, and the result is displayed.
- the blood coagulation reaction is measured, and a blood coagulation reaction curve is generated. Then, as shown in the flowchart of FIG. 12 , the final saturation value Den of the amount of scattered light at the coagulation endpoint is determined about the abnormal sample.
- a first checkpoint H 1 is preset at a position of the amount of scattered light at the initial stage of the reaction
- a second checkpoint H 2 is preset at a position of the amount of scattered light during the fibrin formation.
- H 1 and H 2 can be arbitrarily determined.
- windows with a width of “h” are set to have the respective checkpoints H 1 and H 2 at their centers.
- Ra dTa 1 /dTa 2 of the abnormal sample (where Ra is the ratio of the reaction rates in the abnormal sample, dTa 1 is a time required for a change of the amount of scattered light at the first checkpoint, and dTa 2 is a time required for a change of the amount of scattered light at the second checkpoint) is smaller. Therefore, a threshold R Limit is set, and if R ⁇ R Limit is met, it is judged that a drift exists (i.e., the reaction curve is not flat, and rises gradually). Then, an error flag is set and displayed on the display section.
- the blood coagulation reaction is measured, and a blood coagulation reaction curve is generated. Then, as shown in the flowchart of FIG. 13 , the final saturation value Den of the amount of scattered light at the coagulation endpoint is determined about the abnormal sample.
- a checkpoint Hs of a specific change amount of scattered light is preset. This check item is for monitoring whether or not the time when the amount of scattered light starts to change is too early. It is preferable that “Hs” is set at a position at which the amount of scattered light starts to change. Next, a time “ts” required for the amount of scattered light to change to “Hs” is obtained. As compared with “tns” of the normal sample (where “tns” is a time required for the amount of scattered light to change to Hs in the normal sample), “tas” of the abnormal sample (where “tas” is a time required for the amount of scattered light to change to “Hs” in the normal sample) is small. Therefore, a threshold t Limit is preset, and if ts ⁇ t Limit , it is judged that the time when the amount of scattered light starts to change is too early. Then, an error flag is set and displayed on the display section.
- abnormality can be detected accurately in the blood coagulation reaction, especially, in the initial reaction. Consequently, it is possible to perform accurate measurement of the blood coagulation time by utilizing the blood coagulation reaction.
- abnormality can be closely detected in various reaction systems regarding the blood coagulation reaction. More particularly, it is possible to recognize abnormality in the reaction rate during the fibrin formation, to judge the presence of the initial reaction and the presence of the drift in the coagulation reaction curve and to recognize abnormality in the time from the start of the reaction until the predetermined optical change amount is reached, and the like. The results of the detection of such abnormality can be clinically utilized.
Abstract
Description
- (1) A reaction rate during fibrin formation (SLOW REACTION CHECK);
- (2) The presence or absence of an initial stage of the blood coagulation reaction (START ANGLE CHECK);
- (3) The presence or absence of a drift in a coagulation reaction curve (DRIFT CHECK); and
- (4) A time from the start of the reaction until the optical change amount reached a predetermined value (EARLY % CHECK).
Claims (12)
Applications Claiming Priority (2)
| Application Number | Priority Date | Filing Date | Title |
|---|---|---|---|
| JP2001369206A JP4334171B2 (en) | 2001-12-03 | 2001-12-03 | Blood coagulation reaction analysis method |
| JP2001-369206 | 2001-12-03 |
Publications (2)
| Publication Number | Publication Date |
|---|---|
| US20030138962A1 US20030138962A1 (en) | 2003-07-24 |
| US7276376B2 true US7276376B2 (en) | 2007-10-02 |
Family
ID=19178644
Family Applications (1)
| Application Number | Title | Priority Date | Filing Date |
|---|---|---|---|
| US10/307,922 Active 2024-09-27 US7276376B2 (en) | 2001-12-03 | 2002-12-03 | Analyzing method of a blood coagulation reaction |
Country Status (5)
| Country | Link |
|---|---|
| US (1) | US7276376B2 (en) |
| EP (1) | EP1316802B1 (en) |
| JP (1) | JP4334171B2 (en) |
| AT (1) | ATE354804T1 (en) |
| DE (1) | DE60218268T2 (en) |
Cited By (8)
| Publication number | Priority date | Publication date | Assignee | Title |
|---|---|---|---|---|
| US20080183431A1 (en) * | 2007-01-31 | 2008-07-31 | Sysmex Corporation | Sample analyzer and sample analyzing method |
| US20120252127A1 (en) * | 2011-04-01 | 2012-10-04 | Spectral Sciences, Inc. | Optical Blood Coagulation Monitor and Method |
| US20120301967A1 (en) * | 2011-05-26 | 2012-11-29 | The General Hospital Corporation | Optical thromboelastography system and method for evaluation of blood coagulation metrics |
| US9297816B1 (en) | 2012-12-21 | 2016-03-29 | University Of South Florida | Devices and methods for measuring blood coagulation |
| US20160291046A1 (en) * | 2013-04-02 | 2016-10-06 | Hitachi High-Technologies Corporation | Automatic analyzing apparatus and analyzing method |
| US20160327582A1 (en) * | 2015-05-08 | 2016-11-10 | Sysmex Corporation | Sample analyzer, sample analyzing method, and non-transitory computer readable storage storing a computer program |
| US20200103420A1 (en) * | 2018-09-28 | 2020-04-02 | Sysmex Corporation | Blood coagulation analyzing method, blood coagulation analyzing apparatus, and non-transitory computer-readable storage medium |
| US11172888B2 (en) | 2012-12-19 | 2021-11-16 | The General Hospital Corporation | Optical blood-coagulation sensor |
Families Citing this family (20)
| Publication number | Priority date | Publication date | Assignee | Title |
|---|---|---|---|---|
| JP4964446B2 (en) * | 2005-09-14 | 2012-06-27 | シスメックス株式会社 | Analytical apparatus and sample information processing program |
| JP4799116B2 (en) * | 2005-10-11 | 2011-10-26 | シスメックス株式会社 | Sample analyzer, sample analysis method, and computer program |
| JP4986487B2 (en) * | 2006-03-30 | 2012-07-25 | シスメックス株式会社 | Blood clotting time measurement device |
| DE102007017906A1 (en) * | 2007-04-17 | 2008-10-23 | Dade Behring Marburg Gmbh | Method for determining the reaction lag phase in an analyte-dependent reaction |
| JP4999613B2 (en) | 2007-08-31 | 2012-08-15 | シスメックス株式会社 | Blood coagulation measurement reagent and blood coagulation time measurement method |
| EP3432002B1 (en) * | 2008-03-31 | 2023-11-08 | Sysmex Corporation | Blood coagulation analyzer and blood coagulation analysis method |
| AU2009308841B2 (en) * | 2008-10-29 | 2014-07-17 | T2 Biosystems, Inc. | NMR detection of coagulation time |
| KR20100072612A (en) | 2008-12-22 | 2010-07-01 | 한국전자통신연구원 | Estimating device equipped with device decididing estimation start point |
| DE202009018243U1 (en) * | 2009-02-17 | 2011-05-19 | GEMAC-Gesellschaft für Mikroelektronikanwendung Chemnitz mbH, 09116 | Device for the agglutination-based detection of specific diseases via a blood test |
| JP5029638B2 (en) * | 2009-03-18 | 2012-09-19 | 株式会社島津製作所 | Blood coagulation analyzer |
| CN103063612B (en) * | 2012-12-28 | 2015-03-18 | 深圳市锦瑞电子有限公司 | Measurement and analysis method for coagulation analyzer, and coagulation analyzer |
| JP6268288B2 (en) * | 2014-07-02 | 2018-01-24 | 株式会社日立ハイテクノロジーズ | Blood coagulation test equipment |
| JP5891288B2 (en) * | 2014-12-08 | 2016-03-22 | 株式会社日立ハイテクノロジーズ | Automatic analyzer and automatic analysis program |
| JP2018072156A (en) * | 2016-10-28 | 2018-05-10 | シスメックス株式会社 | Blood coagulation analysis method, blood coagulation analysis device, and computer program |
| EP3432314A1 (en) | 2017-07-17 | 2019-01-23 | F. Hoffmann-La Roche AG | Techniques for determining coagulation results |
| JPWO2021206107A1 (en) * | 2020-04-07 | 2021-10-14 | ||
| US20230393156A1 (en) | 2020-10-29 | 2023-12-07 | Sekisui Medical Co., Ltd. | Method for detecting blood coagulation reaction |
| CN112964673B (en) * | 2021-01-29 | 2024-02-27 | 深圳市科曼医疗设备有限公司 | Method and device for identifying abnormality of specific protein response curve |
| CN113343899B (en) * | 2021-06-19 | 2022-10-14 | 南京岚煜生物科技有限公司 | Method for determining coagulation mutation point based on slope detection |
| CN117881968A (en) | 2021-08-31 | 2024-04-12 | 积水医疗株式会社 | Method for detecting coagulation reaction abnormality |
Citations (7)
| Publication number | Priority date | Publication date | Assignee | Title |
|---|---|---|---|---|
| US3963349A (en) * | 1974-08-27 | 1976-06-15 | American Hospital Supply Corporation | Method and apparatus for determining coagulation times |
| US4217107A (en) * | 1977-09-30 | 1980-08-12 | Sankyo Company Ltd. | Method of measuring blood clotting time |
| DE3127560A1 (en) | 1981-07-11 | 1983-02-17 | Jochimsen, Siegfried, 2300 Kiel | Device for detecting and measuring the blood coagulating time by means of a metal block, which can be temperature-controlled and serves to accommodate the measuring cuvette, a stirring device and a light-optical (photooptical) turbidity measuring device |
| JPS63305255A (en) | 1987-06-05 | 1988-12-13 | Kyoto Daiichi Kagaku:Kk | Method for measuring blood coagulation |
| US4876069A (en) | 1981-07-11 | 1989-10-24 | Siegfried Jochimsen | Blood clotting time measuring apparatus |
| US5284624A (en) | 1988-10-31 | 1994-02-08 | Holger Behnk | Method of, and apparatus for, testing and measuring blood clotting time |
| US5716796A (en) | 1990-01-23 | 1998-02-10 | Medical Devices Corporation | Optical blood hemostatic analysis apparatus and method |
-
2001
- 2001-12-03 JP JP2001369206A patent/JP4334171B2/en not_active Expired - Lifetime
-
2002
- 2002-12-03 US US10/307,922 patent/US7276376B2/en active Active
- 2002-12-03 AT AT02026913T patent/ATE354804T1/en not_active IP Right Cessation
- 2002-12-03 DE DE60218268T patent/DE60218268T2/en not_active Expired - Lifetime
- 2002-12-03 EP EP02026913A patent/EP1316802B1/en not_active Expired - Lifetime
Patent Citations (7)
| Publication number | Priority date | Publication date | Assignee | Title |
|---|---|---|---|---|
| US3963349A (en) * | 1974-08-27 | 1976-06-15 | American Hospital Supply Corporation | Method and apparatus for determining coagulation times |
| US4217107A (en) * | 1977-09-30 | 1980-08-12 | Sankyo Company Ltd. | Method of measuring blood clotting time |
| DE3127560A1 (en) | 1981-07-11 | 1983-02-17 | Jochimsen, Siegfried, 2300 Kiel | Device for detecting and measuring the blood coagulating time by means of a metal block, which can be temperature-controlled and serves to accommodate the measuring cuvette, a stirring device and a light-optical (photooptical) turbidity measuring device |
| US4876069A (en) | 1981-07-11 | 1989-10-24 | Siegfried Jochimsen | Blood clotting time measuring apparatus |
| JPS63305255A (en) | 1987-06-05 | 1988-12-13 | Kyoto Daiichi Kagaku:Kk | Method for measuring blood coagulation |
| US5284624A (en) | 1988-10-31 | 1994-02-08 | Holger Behnk | Method of, and apparatus for, testing and measuring blood clotting time |
| US5716796A (en) | 1990-01-23 | 1998-02-10 | Medical Devices Corporation | Optical blood hemostatic analysis apparatus and method |
Cited By (15)
| Publication number | Priority date | Publication date | Assignee | Title |
|---|---|---|---|---|
| US7962292B2 (en) | 2007-01-31 | 2011-06-14 | Sysmex Corporation | Sample analyzer and sample analyzing method |
| US20080183431A1 (en) * | 2007-01-31 | 2008-07-31 | Sysmex Corporation | Sample analyzer and sample analyzing method |
| US20120252127A1 (en) * | 2011-04-01 | 2012-10-04 | Spectral Sciences, Inc. | Optical Blood Coagulation Monitor and Method |
| US8697449B2 (en) * | 2011-04-01 | 2014-04-15 | Spectral Sciences, Inc. | Optical blood coagulation monitor and method |
| US20120301967A1 (en) * | 2011-05-26 | 2012-11-29 | The General Hospital Corporation | Optical thromboelastography system and method for evaluation of blood coagulation metrics |
| US8772039B2 (en) * | 2011-05-26 | 2014-07-08 | The General Hospital Corporation | Optical thromboelastography system and method for evaluation of blood coagulation metrics |
| US11172888B2 (en) | 2012-12-19 | 2021-11-16 | The General Hospital Corporation | Optical blood-coagulation sensor |
| US9297816B1 (en) | 2012-12-21 | 2016-03-29 | University Of South Florida | Devices and methods for measuring blood coagulation |
| US10481145B1 (en) | 2012-12-21 | 2019-11-19 | University Of South Florida | Devices and methods for measuring blood coagulation |
| US9581609B2 (en) * | 2013-04-02 | 2017-02-28 | Hitachi High-Technologies Corporation | Automatic coagulation analyzing apparatus and analyzing method |
| US20160291046A1 (en) * | 2013-04-02 | 2016-10-06 | Hitachi High-Technologies Corporation | Automatic analyzing apparatus and analyzing method |
| US20160327582A1 (en) * | 2015-05-08 | 2016-11-10 | Sysmex Corporation | Sample analyzer, sample analyzing method, and non-transitory computer readable storage storing a computer program |
| US9863964B2 (en) * | 2015-05-08 | 2018-01-09 | Sysmex Corporation | Sample analyzer, sample analyzing method, and program determining data end points used to calculate target material concentration |
| US20200103420A1 (en) * | 2018-09-28 | 2020-04-02 | Sysmex Corporation | Blood coagulation analyzing method, blood coagulation analyzing apparatus, and non-transitory computer-readable storage medium |
| US11747350B2 (en) * | 2018-09-28 | 2023-09-05 | Sysmex Corporation | Blood coagulation analyzing method, apparatus, and non-transitory computer-readable storage medium for determining occurence of an early reaction error |
Also Published As
| Publication number | Publication date |
|---|---|
| EP1316802B1 (en) | 2007-02-21 |
| EP1316802A3 (en) | 2004-01-28 |
| DE60218268D1 (en) | 2007-04-05 |
| JP2003169700A (en) | 2003-06-17 |
| JP4334171B2 (en) | 2009-09-30 |
| DE60218268T2 (en) | 2007-10-31 |
| EP1316802A2 (en) | 2003-06-04 |
| US20030138962A1 (en) | 2003-07-24 |
| ATE354804T1 (en) | 2007-03-15 |
Similar Documents
| Publication | Publication Date | Title |
|---|---|---|
| US7276376B2 (en) | Analyzing method of a blood coagulation reaction | |
| US4252536A (en) | Method and system for measuring blood coagulation time | |
| EP2982988B1 (en) | Automatic analysis device and analysis method | |
| US5365559A (en) | Particle counting apparatus for a total counting of particles contained in a liquid sample | |
| US20130273641A1 (en) | System and method of verification of a prepared sample for a flow cytometer | |
| US10520522B2 (en) | Automated analyzer | |
| JP5029638B2 (en) | Blood coagulation analyzer | |
| EP3561485B1 (en) | Blood analysis method and blood analyzer | |
| JP4799116B2 (en) | Sample analyzer, sample analysis method, and computer program | |
| JPH0627115A (en) | Method and apparatus for measuring blood coagulation time | |
| WO2022092248A1 (en) | Method for detecting blood coagulation reaction | |
| JP3722570B2 (en) | Blood coagulation measuring device | |
| EP3093651B1 (en) | Sample analyzer, blood coagulation analyzer, sample analyzing method, and computer program | |
| WO1998039643A1 (en) | Method and apparatus for measurement of whole blood coagulation parameters | |
| US20230341423A1 (en) | Blood coagulation time measurement method | |
| US20040219680A1 (en) | Method and apparatus for determining anticoagulant therapy factors | |
| CN116057383A (en) | Method for analyzing coagulation reaction | |
| CN113484244A (en) | Coagulation analyzer reagent calibration method based on immunoturbidimetry | |
| US20240077504A1 (en) | Method for estimating cause of prolonged coagulation time | |
| US20230213497A1 (en) | Method for measuring blood coagulation time | |
| JPH04318463A (en) | Method for measuring blood coagulation time | |
| CN110542661B (en) | High-concentration sample identification method, device and detection system | |
| JPH03180742A (en) | Automatic coagulation image deciding method | |
| CN108956542A (en) | The measuring method and its application apparatus of prothrombin time | |
| JPH10221346A (en) | Measuring method of coagulability of blood |
Legal Events
| Date | Code | Title | Description |
|---|---|---|---|
| AS | Assignment |
Owner name: DADE BEHRING MARBURG GMBH, GERMANY Free format text: ASSIGNMENT OF ASSIGNORS INTEREST;ASSIGNORS:KATAYAMA, MASAYUKI;HOSHIKO, SUSUMU;IZUMI, TAKAYOSHI;AND OTHERS;REEL/FRAME:013898/0986;SIGNING DATES FROM 20021205 TO 20030113 Owner name: SYSMEX CORPORATION, JAPAN Free format text: ASSIGNMENT OF ASSIGNORS INTEREST;ASSIGNORS:KATAYAMA, MASAYUKI;HOSHIKO, SUSUMU;IZUMI, TAKAYOSHI;AND OTHERS;REEL/FRAME:013898/0986;SIGNING DATES FROM 20021205 TO 20030113 |
|
| STCF | Information on status: patent grant |
Free format text: PATENTED CASE |
|
| FEPP | Fee payment procedure |
Free format text: PAYOR NUMBER ASSIGNED (ORIGINAL EVENT CODE: ASPN); ENTITY STATUS OF PATENT OWNER: LARGE ENTITY |
|
| AS | Assignment |
Owner name: SIEMENS HEALTHCARE DIAGNOSTICS PRODUCTS GMBH, GERM Free format text: CHANGE OF NAME;ASSIGNOR:DADE BEHRING MARBURG GMBH;REEL/FRAME:022309/0627 Effective date: 20080829 Owner name: SIEMENS HEALTHCARE DIAGNOSTICS PRODUCTS GMBH,GERMA Free format text: CHANGE OF NAME;ASSIGNOR:DADE BEHRING MARBURG GMBH;REEL/FRAME:022309/0627 Effective date: 20080829 |
|
| FPAY | Fee payment |
Year of fee payment: 4 |
|
| FPAY | Fee payment |
Year of fee payment: 8 |
|
| MAFP | Maintenance fee payment |
Free format text: PAYMENT OF MAINTENANCE FEE, 12TH YEAR, LARGE ENTITY (ORIGINAL EVENT CODE: M1553); ENTITY STATUS OF PATENT OWNER: LARGE ENTITY Year of fee payment: 12 |