US7125660B2 - Nucleic acid sensor molecules and methods of using same - Google Patents
Nucleic acid sensor molecules and methods of using same Download PDFInfo
- Publication number
- US7125660B2 US7125660B2 US10/215,982 US21598202A US7125660B2 US 7125660 B2 US7125660 B2 US 7125660B2 US 21598202 A US21598202 A US 21598202A US 7125660 B2 US7125660 B2 US 7125660B2
- Authority
- US
- United States
- Prior art keywords
- nucleic acid
- acid sensor
- target
- molecules
- molecule
- Prior art date
- Legal status (The legal status is an assumption and is not a legal conclusion. Google has not performed a legal analysis and makes no representation as to the accuracy of the status listed.)
- Expired - Fee Related, expires
Links
Images


Classifications
-
- C—CHEMISTRY; METALLURGY
- C07—ORGANIC CHEMISTRY
- C07H—SUGARS; DERIVATIVES THEREOF; NUCLEOSIDES; NUCLEOTIDES; NUCLEIC ACIDS
- C07H21/00—Compounds containing two or more mononucleotide units having separate phosphate or polyphosphate groups linked by saccharide radicals of nucleoside groups, e.g. nucleic acids
- C07H21/02—Compounds containing two or more mononucleotide units having separate phosphate or polyphosphate groups linked by saccharide radicals of nucleoside groups, e.g. nucleic acids with ribosyl as saccharide radical
-
- B—PERFORMING OPERATIONS; TRANSPORTING
- B82—NANOTECHNOLOGY
- B82Y—SPECIFIC USES OR APPLICATIONS OF NANOSTRUCTURES; MEASUREMENT OR ANALYSIS OF NANOSTRUCTURES; MANUFACTURE OR TREATMENT OF NANOSTRUCTURES
- B82Y30/00—Nanotechnology for materials or surface science, e.g. nanocomposites
-
- C—CHEMISTRY; METALLURGY
- C07—ORGANIC CHEMISTRY
- C07H—SUGARS; DERIVATIVES THEREOF; NUCLEOSIDES; NUCLEOTIDES; NUCLEIC ACIDS
- C07H21/00—Compounds containing two or more mononucleotide units having separate phosphate or polyphosphate groups linked by saccharide radicals of nucleoside groups, e.g. nucleic acids
- C07H21/04—Compounds containing two or more mononucleotide units having separate phosphate or polyphosphate groups linked by saccharide radicals of nucleoside groups, e.g. nucleic acids with deoxyribosyl as saccharide radical
-
- C—CHEMISTRY; METALLURGY
- C12—BIOCHEMISTRY; BEER; SPIRITS; WINE; VINEGAR; MICROBIOLOGY; ENZYMOLOGY; MUTATION OR GENETIC ENGINEERING
- C12Q—MEASURING OR TESTING PROCESSES INVOLVING ENZYMES, NUCLEIC ACIDS OR MICROORGANISMS; COMPOSITIONS OR TEST PAPERS THEREFOR; PROCESSES OF PREPARING SUCH COMPOSITIONS; CONDITION-RESPONSIVE CONTROL IN MICROBIOLOGICAL OR ENZYMOLOGICAL PROCESSES
- C12Q1/00—Measuring or testing processes involving enzymes, nucleic acids or microorganisms; Compositions therefor; Processes of preparing such compositions
- C12Q1/48—Measuring or testing processes involving enzymes, nucleic acids or microorganisms; Compositions therefor; Processes of preparing such compositions involving transferase
- C12Q1/485—Measuring or testing processes involving enzymes, nucleic acids or microorganisms; Compositions therefor; Processes of preparing such compositions involving transferase involving kinase
-
- C—CHEMISTRY; METALLURGY
- C12—BIOCHEMISTRY; BEER; SPIRITS; WINE; VINEGAR; MICROBIOLOGY; ENZYMOLOGY; MUTATION OR GENETIC ENGINEERING
- C12Q—MEASURING OR TESTING PROCESSES INVOLVING ENZYMES, NUCLEIC ACIDS OR MICROORGANISMS; COMPOSITIONS OR TEST PAPERS THEREFOR; PROCESSES OF PREPARING SUCH COMPOSITIONS; CONDITION-RESPONSIVE CONTROL IN MICROBIOLOGICAL OR ENZYMOLOGICAL PROCESSES
- C12Q1/00—Measuring or testing processes involving enzymes, nucleic acids or microorganisms; Compositions therefor; Processes of preparing such compositions
- C12Q1/68—Measuring or testing processes involving enzymes, nucleic acids or microorganisms; Compositions therefor; Processes of preparing such compositions involving nucleic acids
- C12Q1/6813—Hybridisation assays
- C12Q1/6816—Hybridisation assays characterised by the detection means
- C12Q1/6825—Nucleic acid detection involving sensors
-
- B—PERFORMING OPERATIONS; TRANSPORTING
- B01—PHYSICAL OR CHEMICAL PROCESSES OR APPARATUS IN GENERAL
- B01J—CHEMICAL OR PHYSICAL PROCESSES, e.g. CATALYSIS OR COLLOID CHEMISTRY; THEIR RELEVANT APPARATUS
- B01J2219/00—Chemical, physical or physico-chemical processes in general; Their relevant apparatus
- B01J2219/00274—Sequential or parallel reactions; Apparatus and devices for combinatorial chemistry or for making arrays; Chemical library technology
- B01J2219/00277—Apparatus
- B01J2219/00351—Means for dispensing and evacuation of reagents
- B01J2219/00385—Printing
-
- B—PERFORMING OPERATIONS; TRANSPORTING
- B01—PHYSICAL OR CHEMICAL PROCESSES OR APPARATUS IN GENERAL
- B01J—CHEMICAL OR PHYSICAL PROCESSES, e.g. CATALYSIS OR COLLOID CHEMISTRY; THEIR RELEVANT APPARATUS
- B01J2219/00—Chemical, physical or physico-chemical processes in general; Their relevant apparatus
- B01J2219/00274—Sequential or parallel reactions; Apparatus and devices for combinatorial chemistry or for making arrays; Chemical library technology
- B01J2219/00277—Apparatus
- B01J2219/00479—Means for mixing reactants or products in the reaction vessels
-
- B—PERFORMING OPERATIONS; TRANSPORTING
- B01—PHYSICAL OR CHEMICAL PROCESSES OR APPARATUS IN GENERAL
- B01J—CHEMICAL OR PHYSICAL PROCESSES, e.g. CATALYSIS OR COLLOID CHEMISTRY; THEIR RELEVANT APPARATUS
- B01J2219/00—Chemical, physical or physico-chemical processes in general; Their relevant apparatus
- B01J2219/00274—Sequential or parallel reactions; Apparatus and devices for combinatorial chemistry or for making arrays; Chemical library technology
- B01J2219/00583—Features relative to the processes being carried out
- B01J2219/00603—Making arrays on substantially continuous surfaces
- B01J2219/00605—Making arrays on substantially continuous surfaces the compounds being directly bound or immobilised to solid supports
- B01J2219/00608—DNA chips
-
- B—PERFORMING OPERATIONS; TRANSPORTING
- B01—PHYSICAL OR CHEMICAL PROCESSES OR APPARATUS IN GENERAL
- B01J—CHEMICAL OR PHYSICAL PROCESSES, e.g. CATALYSIS OR COLLOID CHEMISTRY; THEIR RELEVANT APPARATUS
- B01J2219/00—Chemical, physical or physico-chemical processes in general; Their relevant apparatus
- B01J2219/00274—Sequential or parallel reactions; Apparatus and devices for combinatorial chemistry or for making arrays; Chemical library technology
- B01J2219/00583—Features relative to the processes being carried out
- B01J2219/00603—Making arrays on substantially continuous surfaces
- B01J2219/00605—Making arrays on substantially continuous surfaces the compounds being directly bound or immobilised to solid supports
- B01J2219/0061—The surface being organic
-
- B—PERFORMING OPERATIONS; TRANSPORTING
- B01—PHYSICAL OR CHEMICAL PROCESSES OR APPARATUS IN GENERAL
- B01J—CHEMICAL OR PHYSICAL PROCESSES, e.g. CATALYSIS OR COLLOID CHEMISTRY; THEIR RELEVANT APPARATUS
- B01J2219/00—Chemical, physical or physico-chemical processes in general; Their relevant apparatus
- B01J2219/00274—Sequential or parallel reactions; Apparatus and devices for combinatorial chemistry or for making arrays; Chemical library technology
- B01J2219/00583—Features relative to the processes being carried out
- B01J2219/00603—Making arrays on substantially continuous surfaces
- B01J2219/00605—Making arrays on substantially continuous surfaces the compounds being directly bound or immobilised to solid supports
- B01J2219/00612—Making arrays on substantially continuous surfaces the compounds being directly bound or immobilised to solid supports the surface being inorganic
-
- B—PERFORMING OPERATIONS; TRANSPORTING
- B01—PHYSICAL OR CHEMICAL PROCESSES OR APPARATUS IN GENERAL
- B01J—CHEMICAL OR PHYSICAL PROCESSES, e.g. CATALYSIS OR COLLOID CHEMISTRY; THEIR RELEVANT APPARATUS
- B01J2219/00—Chemical, physical or physico-chemical processes in general; Their relevant apparatus
- B01J2219/00274—Sequential or parallel reactions; Apparatus and devices for combinatorial chemistry or for making arrays; Chemical library technology
- B01J2219/00583—Features relative to the processes being carried out
- B01J2219/00603—Making arrays on substantially continuous surfaces
- B01J2219/00605—Making arrays on substantially continuous surfaces the compounds being directly bound or immobilised to solid supports
- B01J2219/00623—Immobilisation or binding
- B01J2219/00626—Covalent
-
- B—PERFORMING OPERATIONS; TRANSPORTING
- B01—PHYSICAL OR CHEMICAL PROCESSES OR APPARATUS IN GENERAL
- B01J—CHEMICAL OR PHYSICAL PROCESSES, e.g. CATALYSIS OR COLLOID CHEMISTRY; THEIR RELEVANT APPARATUS
- B01J2219/00—Chemical, physical or physico-chemical processes in general; Their relevant apparatus
- B01J2219/00274—Sequential or parallel reactions; Apparatus and devices for combinatorial chemistry or for making arrays; Chemical library technology
- B01J2219/00583—Features relative to the processes being carried out
- B01J2219/00603—Making arrays on substantially continuous surfaces
- B01J2219/00605—Making arrays on substantially continuous surfaces the compounds being directly bound or immobilised to solid supports
- B01J2219/00623—Immobilisation or binding
- B01J2219/0063—Other, e.g. van der Waals forces, hydrogen bonding
-
- B—PERFORMING OPERATIONS; TRANSPORTING
- B01—PHYSICAL OR CHEMICAL PROCESSES OR APPARATUS IN GENERAL
- B01J—CHEMICAL OR PHYSICAL PROCESSES, e.g. CATALYSIS OR COLLOID CHEMISTRY; THEIR RELEVANT APPARATUS
- B01J2219/00—Chemical, physical or physico-chemical processes in general; Their relevant apparatus
- B01J2219/00274—Sequential or parallel reactions; Apparatus and devices for combinatorial chemistry or for making arrays; Chemical library technology
- B01J2219/00583—Features relative to the processes being carried out
- B01J2219/00603—Making arrays on substantially continuous surfaces
- B01J2219/00605—Making arrays on substantially continuous surfaces the compounds being directly bound or immobilised to solid supports
- B01J2219/00632—Introduction of reactive groups to the surface
- B01J2219/00637—Introduction of reactive groups to the surface by coating it with another layer
-
- B—PERFORMING OPERATIONS; TRANSPORTING
- B01—PHYSICAL OR CHEMICAL PROCESSES OR APPARATUS IN GENERAL
- B01J—CHEMICAL OR PHYSICAL PROCESSES, e.g. CATALYSIS OR COLLOID CHEMISTRY; THEIR RELEVANT APPARATUS
- B01J2219/00—Chemical, physical or physico-chemical processes in general; Their relevant apparatus
- B01J2219/00274—Sequential or parallel reactions; Apparatus and devices for combinatorial chemistry or for making arrays; Chemical library technology
- B01J2219/00583—Features relative to the processes being carried out
- B01J2219/00603—Making arrays on substantially continuous surfaces
- B01J2219/00653—Making arrays on substantially continuous surfaces the compounds being bound to electrodes embedded in or on the solid supports
-
- B—PERFORMING OPERATIONS; TRANSPORTING
- B01—PHYSICAL OR CHEMICAL PROCESSES OR APPARATUS IN GENERAL
- B01J—CHEMICAL OR PHYSICAL PROCESSES, e.g. CATALYSIS OR COLLOID CHEMISTRY; THEIR RELEVANT APPARATUS
- B01J2219/00—Chemical, physical or physico-chemical processes in general; Their relevant apparatus
- B01J2219/00274—Sequential or parallel reactions; Apparatus and devices for combinatorial chemistry or for making arrays; Chemical library technology
- B01J2219/00583—Features relative to the processes being carried out
- B01J2219/00603—Making arrays on substantially continuous surfaces
- B01J2219/00659—Two-dimensional arrays
- B01J2219/00662—Two-dimensional arrays within two-dimensional arrays
-
- B—PERFORMING OPERATIONS; TRANSPORTING
- B01—PHYSICAL OR CHEMICAL PROCESSES OR APPARATUS IN GENERAL
- B01J—CHEMICAL OR PHYSICAL PROCESSES, e.g. CATALYSIS OR COLLOID CHEMISTRY; THEIR RELEVANT APPARATUS
- B01J2219/00—Chemical, physical or physico-chemical processes in general; Their relevant apparatus
- B01J2219/00274—Sequential or parallel reactions; Apparatus and devices for combinatorial chemistry or for making arrays; Chemical library technology
- B01J2219/0068—Means for controlling the apparatus of the process
- B01J2219/00686—Automatic
- B01J2219/00691—Automatic using robots
-
- B—PERFORMING OPERATIONS; TRANSPORTING
- B01—PHYSICAL OR CHEMICAL PROCESSES OR APPARATUS IN GENERAL
- B01J—CHEMICAL OR PHYSICAL PROCESSES, e.g. CATALYSIS OR COLLOID CHEMISTRY; THEIR RELEVANT APPARATUS
- B01J2219/00—Chemical, physical or physico-chemical processes in general; Their relevant apparatus
- B01J2219/00274—Sequential or parallel reactions; Apparatus and devices for combinatorial chemistry or for making arrays; Chemical library technology
- B01J2219/00718—Type of compounds synthesised
- B01J2219/0072—Organic compounds
- B01J2219/00722—Nucleotides
-
- C—CHEMISTRY; METALLURGY
- C40—COMBINATORIAL TECHNOLOGY
- C40B—COMBINATORIAL CHEMISTRY; LIBRARIES, e.g. CHEMICAL LIBRARIES
- C40B40/00—Libraries per se, e.g. arrays, mixtures
- C40B40/04—Libraries containing only organic compounds
- C40B40/06—Libraries containing nucleotides or polynucleotides, or derivatives thereof
-
- C—CHEMISTRY; METALLURGY
- C40—COMBINATORIAL TECHNOLOGY
- C40B—COMBINATORIAL CHEMISTRY; LIBRARIES, e.g. CHEMICAL LIBRARIES
- C40B60/00—Apparatus specially adapted for use in combinatorial chemistry or with libraries
- C40B60/14—Apparatus specially adapted for use in combinatorial chemistry or with libraries for creating libraries
Definitions
- the invention relates generally to nucleic acids and more particularly to nucleic acid sensor molecules containing a catalytically active domain that is modulated upon recognition of a target by a target modulation domain of the nucleic acid sensor molecule.
- nucleic acids can adopt complex three-dimensional structures. These three-dimensional structures are capable of specific recognition of target molecules and, furthermore, of catalyzing chemical reactions. Nucleic acids will thus provide candidate detection molecules for diverse target molecules, including those which that do not naturally recognize or bind to DNA or RNA.
- a nucleic acid which binds to a non-nucleic acid target molecule through non-Watson-Crick base pairing is termed an aptamer.
- aptamer selection combinatorial libraries of oligonucleotides are screened in vitro to identify oligonucleotides, or aptamers, which bind with high affinity to pre-selected targets.
- small biomolecules e.g., amino acids, nucleotides, NAD, S-adenosyl methionine, chloramphenicol
- large biomolecules thrombin, Ku, DNA polymerases
- Aptamer biosensors have been used to detect specific analyte molecules.
- fluorescently labeled anti-thrombin aptamers attached to a glass surface have been used to directly detect the presence of thrombin proteins in a sample by detecting changes in the optical properties of the aptamers (Potyrailo, et al., 1998).
- continuous binding of thrombin to the labeled aptamer is requisite for detection to occur, since the concentration of thrombin in a test sample is monitored by directly detecting fluorescent emission of the aptamer-ligand complex.
- a limitation with this type of aptamer-derived biosensor is that ligand-mediated changes in secondary structure were engineered into the aptamer molecule via a laborious engineering process in which four to six nucleotides were added to the 5′ end of the aptamer that was complementary to the bases at the 3′ end of the thrombin binding region. In the absence of thrombin, this structure forms a stem loop structure, while it forms a G-quartet structure in the presence of thrombin. Fluorescent and quenching groups attached to the 5′ and 3′ end signal this change.
- assay sensitivity and hence the limit of detection is set empirically by the affinity of the aptamer-ligand complex, the KD value.
- aptamer-based sensor molecules one can detect analyte binding in both solution (homogeneous) and on solid supports (heterogeneous).
- ligand detection methods are based upon antibody binding. Similar to the aptamer-based methods, antibody-based detection requires continuous ligand binding and ligand-antibody complex formation for the generation of a detectable signal. In addition, antibody methods such as ELISA or competitive RIA, while robust, are restricted in utility because these methods require that heterogeneous assay conditions be employed: 1] detection is done on a solid surface; 2] in most applications both a capture antibody and detection antibody are required; 3] for ELISA-based protein detection methods, the antibodies must recognize the folded, native structure of the protein that is present in cell or tissue isolates and; 4] antibody and protein based detection methods have not been described for intracellular or in vivo based analyte detection.
- These assays include 1] the initial discovery of a drug target through protein or metabolite profiling, 2] the subsequent use of that same drug target in the discovery of drug leads through high throughput screening and, 3] the optimization of drug leads against that same drug target through an evaluation of lead efficacy in mechanistic cellular and in vivo animal assays.
- nucleic acid molecular sensors that can function in environments and formats that includes but are not limited to solution-based detection (homogeneous in vitro biochemical assays or in vivo cellular and animal assays), chip-based (heterogeneous in vitro assays on solid surfaces), and assays in complex biological isolates from blood plasma, cell lysates or tissue extracts.
- Nucleic acid-based detection schemes have exploited the ligand-sensitive catalytic properties of some nucleic acids, e.g., such as ribozymes.
- Ribozyme-based prototype nucleic acid sensor molecules have been designed both by engineering and by in vitro selection methods. Engineering methods exploit the apparently modular nature of RNA structures; these sensors couple molecular recognition to signaling by simply joining individual target-modulation and catalytic RNA domains through a double-stranded or partially double-stranded RNA linker.
- ATP sensors for example, were created by appending the previously-selected, ATP-binding aptamer-derived sequences (Sassanfar and Szostak, 1993) to either the self-cleaving hammerhead ribozyme (Tang and Breaker, 1997) or the L1 self-ligating ribozyme (Robertson and Ellington 2000). Robertson and Ellington (2000) have demonstrated that the enzymatic activity of a ligase ribozyme (derived from the L1 ligase described in Robertson and Ellington (1999)) can be modulated by a small molecule ligand, or small molecule target recognition.
- the ligase ribozyme can be employed as a nucleic acid sensor molecule and used to detect the presence and level of its cognate ligand by monitoring the ligation of a small, labeled second oligonucleotide substrate on to the ribozyme.
- a distinct feature of this detection method is that the actual detection event, e.g., monitoring oligonucleotide substrate ligation to the ribozyme, occurs after the ligand interacts with the nucleic sensor molecule.
- the ribozyme-based ligand detection method of Robertson and Ellington does not require continuous binding of the ligand to the sensor molecule in order to generate a detectable signal.
- radiolabeled hammerhead ribozymes which undergo cleavage upon binding to a ligand, have been used to detect ligand by monitoring the release of the label from the ribozyme (Soukup, et al., 2000, and Breaker, 1998).
- Limitations of the use of ligand modulated hammerhead ribozymes described by Soukup, et al., 2000, and Breaker, 1998 include: 1] the need for a two-step detection method for determining the enzymatic activity of the surface-immobilized hammerhead-derived sensors; 2] the need for radiometric determination of hammerhead activity in both solution and solid-surface based assay formats; 3] the need for significant chemical and structural modification of the hammerhead-based biosensor to render them suitable for optical based detection methods.
- Ellington and Roberts (1999) describe a region of the L1 ligase that is required for allosteric ribozyme function, termed the effector oligonucleotide binding domain. It was postulated that the effector oligonucleotide binding domain of the ligase formed complementary base pairing interactions with the oligonucleotide substrate binding site, driving the ribozyme into an inactive conformation.
- the effector oligonucleotide when added to the L1 ligase activates (kact) the enzyme by over 10,000 fold over the L1 ligase reaction measure in the absence of effector (kunact).
- the native L1-ligase has a switch factor (kact/k unact ) greater than 10,000, which determines the sensitivity of a ribozyme-based detection method.
- the ligase activity of the deletion mutant is only 3–5 fold lower than the ligase activity of L1 ligase with the effector oligonucleotide bound to the effector oligonucleotide binding domain (Ellington and Robertson (1999). This indicates that L1 ligases deleted of the effector oligonucleotide binding domain may not be not subject to further allosteric regulation.
- L1 ligase-based biosensor technology a hindrance to the development of L1 ligase-based biosensor technology is the lack of a general method for the generation of biosensors that can work in multiple assay and detection formats required of solution-based and chip-based biosensors and, those that can work in multiplexed formats and in complex biological extracts.
- the nucleic acid sensor molecules of the present invention are used to monitor the presence or concentration of various target molecules (proteins, post-translationally modified forms of proteins, peptides, nucleic acids, oligosaccharides, nucleotides, metabolites, drugs, toxins, biohazards, and ions) and function in solution-based homogeneous assays using optical or other detection methods; in solution-based homogeneous assays using PCR-based or other nucleotide amplification-based detection methods; in homogeneous intracellular assays using PCR-based detection or other nucleotide amplification-based detection methods; in heterogeneous assays (surface-immobilized nucleic acid sensor molecules and surface-capture nucleic acid sensor molecules) using optical detection methods; and in heterogeneous assays (surface-immobilized nucleic acid sensor molecules and surface-capture nucleic acid sensor molecules) using PCR-based detection or other nucleotide amplification-based detection methods.
- nucleic acid sensor molecules of the present invention were developed through a combination of engineering and selection methods that are now shown to be useful for identifying nucleic acid sensor molecules against a wide variety of target molecules including proteins (including specific post-translationally modified forms of proteins) peptides, nucleic acids, oligosaccharides, nucleotides, metabolites, drugs, toxins, biohazards, ions, carbohydrates, glycoproteins, hormones, receptors, antibodies, viruses, transition state analogs, cofactors, dyes growth factory nutrients, etc.
- proteins including specific post-translationally modified forms of proteins
- the nucleic acid sensor molecules are based on cis-cleaving hammerhead ribozymes that have been designed to work as optical signaling molecules in a homogeneous assay format, and utilize fluorescence and FRET based methods of signal generation and detection.
- nucleic acid sensor molecules are based on cis-cleaving hammerhead ribozymes that have been designed to work as optical signaling molecules affixed to a solid-support, and utilize fluorescence and FRET based methods of signal generation and detection.
- the nucleic acid sensor molecules are based on cis-cleaving hammerhead ribozymes that have been designed to work as optical signaling molecules affixed to a solid-support and utilize surface plasmon resonance methods of signal generation and detection.
- the nucleic acid sensor molecules are based on a 3-piece L1 ligase ribozyme that retains the effector oligonucleotide binding domain, and has been designed to detect target molecules, as a function of oligonucleotide substrate ligation to the nucleic acid sensor molecule, in solution using quantitative PCR-based methods.
- the nucleic acid sensor molecules are based on a 2-piece L1 ligase ribozyme that couples the effector oligonucleotide substrate to the oligonucleotide substrate forming an oligonucleotide supersubstrate and, has been designed to detect target molecules, as a function of oligonucleotide supersubstrate ligation to the nucleic acid sensor molecule, in solution using quantitative PCR-based methods.
- the nucleic acid sensor molecules are based on a 1 -piece L1 ligase ribozyme that deletes the effector oligonucleotide binding domain.
- the 1-piece ligase is designed to self-ligate or circularize by joining the 3′-OH end and the PPP-5′-end of the ligase and detects target molecules, as a function of circularization of the nucleic acid sensor molecule, in solution using PCR-based methods.
- the nucleic acid sensor molecules are based on a 3-piece L1 ligase ribozyme that retains the effector oligonucleotide binding domain, and has been designed to detect target molecules, as a function of oligonucleotide substrate ligation to the nucleic acid sensor molecule immobilized on a solid support and where the detection uses fluorescence-based methods.
- the 3-piece L1 ligase nucleic acid sensor molecules detect target molecules, as a function of oligonucleotide substrate ligation to the nucleic acid sensor molecule in solution and then are subsequently captured on a solid support and detected using fluorescence-based methods.
- the 3-piece L1 ligase nucleic acid sensor molecules detect target molecules, as a function of oligonucleotide substrate ligation to the nucleic acid sensor molecule in solution and then are subsequently captured on a solid support and detected using radiometric-based methods.
- the nucleic acid sensor molecules are based on a 2-piece L1 ligase ribozyme and has been designed to detect target molecules, as a function of oligonucleotide substrate ligation to the nucleic acid sensor molecule immobilized on a solid support and where the detection uses optical methods such as fluorescence-based methods.
- the 2-piece L1 ligase nucleic acid sensor molecules detect target molecules, as a function of oligonucleotide substrate ligation to the nucleic acid sensor molecule in solution and then are subsequently captured on a solid support and detected directly using fluoresence-based methods.
- the 2-piece L1 ligase nucleic acid sensor molecules detect target molecules, as a function of oligonucleotide substrate ligation to the nucleic acid sensor molecule in solution and then are subsequently captured on a solid support and directly detected using radiometric-based methods.
- the nucleic acid sensor molecules is based on a 1 -piece L1 ligase ribozyme that is transfected into a mammalian cell.
- the 1-piece ligase is designed to self-ligate or circularize by joining the 3′-OH end and the PPP-5′-end of the ligase and detects intracellular target molecules, as a function of circularization of the nucleic acid sensor molecule.
- the circularized ligase molecules are then re-isolated from the cellular lysate and the amount of target present in the cell is quantified using solution based nucleotide amplification methods.
- the invention includes a nucleic acid sensor molecule which includes a target modulation domain which recognizes a target molecule, a linker domain, a catalytic domain, and an optical signal generating unit.
- the nucleic acid sensor molecule of the invention has an optical signal generating unit that includes at least one signaling moiety. In another embodiment, the nucleic acid sensor molecule of the invention has an optical signal generating unit which includes at least a first signaling moiety and a second signaling moiety. In another embodiment, the first and second signaling moieties change proximity to each other upon recognition of a target by the target modulation domain. In another embodiment, the first and second signaling moieties include a fluorescent donor and a fluorescent quencher, and recognition of a target by the target modulation domain results in an increase in detectable fluorescence of said fluorescent donor.
- the first signaling moiety and said second signaling moiety include fluorescent energy transfer (FRET) donor and acceptor groups, and recognition of a target by the target modulation domain results in a change in distance between said donor and acceptor groups, thereby changing optical properties of said molecule.
- FRET fluorescent energy transfer
- the invention includes a nucleic acid sensor molecule where the optical signal generating unit consists essentially of a first signaling moiety which changes conformation upon recognition of a target by the target modulation domain, thereby resulting in a detectable optical signal.
- the nucleic acid sensor molecule includes at least one modified nucleic acid.
- the catalytic domain of the nucleic acid sensor molecule includes an endonucleolytic ribozyme.
- the endonucleolytic ribozyme can be, for example, a cis-endonucleolytic ribozyme or a trans-endonucleolytic ribozyme.
- the endonucleolytic ribozyme is a hammerhead ribozyme.
- the catalytic domain of the nucleic acid sensor includes a self-ligating ribozyme.
- the elf-ligating ribozyme can be, for example, a cis-ligase ribozyme or a trans-ligase ribozyme.
- the self-ligating ribozyme can be, e.g., a 1-piece ligase, 2-piece ligase or 3-piece ligase.
- the target modulation domain recognizes a target that is selected from proteins, post-translationally modified forms of proteins, peptides, nucleic acids, oligosaccharides, nucleotides, metabolites, drugs, toxins, biohazards, ions, carbohydrates, polysaccharides, hormones, receptors, antigens, antibodies, viruses, metabolites, co-factors, drugs, dyes, nutrients, or growth factors.
- the target modulation domain recognizes a protein or a post-translationally modified protein.
- the target modulation domain recognizes a post-translationally modified protein, wherein the post-translational modification can be a phosphorylation, prenylation, glycosylation, methionine removal, N-acetylation, acylation, acylation of cysteines, myristoylation, alkylation, ubiquitinylation, prolyl-4-hydroxylation, carboxylation of glutaminyl residues, advanced glycoslylation, deamination of glutamine and asparagine, addition of glycophosphatidylinositol, disulfide bond formation, hydroxylation, or lipidation.
- the post-translational modification can be a phosphorylation, prenylation, glycosylation, methionine removal, N-acetylation, acylation, acylation of cysteines, myristoylation, alkylation, ubiquitinylation, prolyl-4-hydroxylation, carboxylation of glutaminyl residues, advanced glycoslylation, deamination of glut
- the target is a protein kinase. In other embodiments, the target is a phosphorylated protein kinase.
- the phosphorylated protein kinase can be a monophosphorylated protein kinase or a diphosphorylated protein kinase.
- the target protein is ERK, such as ERK1 or ERK2.
- the post-translationally modified protein is ppERK, such as such as ppERK1 or ppERK2.
- the nucleic acid sensor molecule includes a target modulation domain which recognizes a component of a MAP kinase pathway, a product of a MAP kinase pathway, a MAP kinase pathway associated protein, or an extracellular component of a MAP kinase pathway.
- the target modulation domain recognizes a component of the ERK1/2 MAP kinase pathway, the JNK MAP kinase pathway, or the P38 MAP kinase pathway.
- the target modulation domain recognizes an endogenous form of a MAP Kinase (MEK), an endogenous form of a MAP Kinase Kinase (MEKK), or an endogenous form of MAP Kinase Kinase Kinase, (MEKKK).
- the target modulation domain recognizes an endogenous form of RAF kinase.
- the target modulation domain recognizes a Ras protein, a phosphatase, s a GTP binding protein, a GPCR, a cytokine, a growth factor, a cellular metabolite, or a small molecule.
- the nucleic acid sensor molecule includes RNA, DNA, or both RNA and DNA.
- the invention also relates to compositions containing a nucleic acid sensor molecule of the invention and a buffer.
- the invention includes a composition containing a nucleic acid sensor molecule and a tissue extract, a cell extract or an in vitro cell culture.
- a composition of the invention also includes an RNase inhibitor, such as, for example, Va-riboside, vanadyl, tRNA, polyU, RNaseln or RNaseOut.
- a composition of the invention is substantially RNase-free.
- the invention also relates to a composition which includes at least one nucleic acid sensor molecule affixed to a substrate.
- the substrate is glass, gold or other metal, silicon or other semiconductor material, nitrocellulose, nylon, or plastic.
- the nucleic acid sensor molecule is covalently attached to the substrate.
- the nucleic acid sensor molecule is non-covalently attached to the substrate.
- the nucleic acid sensor molecule is immobilized to the substrate via hybridization of a terminal portion of the nucleic acid sensor molecule to an oligonucleotide that is bound to the surface of the substrate.
- a composition includes a plurality of nucleic acid sensor molecules immobilized to the substrate via hybridization of a terminal portion of the nucleic acid sensor molecule to an array of oligonucleotides bound to the substrate at spatially discrete regions. In some embodiments, at least two members of this plurality each recognize different target molecules.
- the substrate can include, for example, at least 50 nucleic acid sensor molecules. In other embodiments, the substrate includes at least 250 nucleic acid sensor molecules, at least 500 nucleic acid sensor molecules, or at least 5000 nucleic acid sensor molecules.
- the invention includes a system for detecting a target molecule which includes a composition according to the invention and a detector in optical communication with the composition, where the detector detects changes in the optical properties of the composition.
- the system further includes a light source in optical communication with the composition.
- the system also includes a processor for processing optical signals detected by the detector.
- the system for detecting a target molecule includes a plurality of nucleic acid sensor molecules where at least two of the biosensor molecules each recognize different target molecules.
- the invention includes a method of identifying or detecting a target molecule in a sample by contacting a sample suspected of containing a target molecule with a nucleic acid sensor molecule of the invention, wherein a change in the signal generated by the optical signal generating unit indicates the presence of target in the sample.
- the method further includes quantifying the change signal generated by the optical signal generating unit to quantify the amount of target molecule in the sample.
- the sample is an environmental sample, biohazard materials, organic samples, drugs and toxins, flavors and fragrances, and biological samples.
- the sample is a biological sample such as cells, cell extracts or lysates, tissues or tissue extracts, bodily fluids, serum, blood and blood products.
- the method of identifying or detecting a target molecule in a sample detects of identifies proteins, post-translationally modified forms of proteins, peptides, nucleic acids, oligosaccharides, nucleotides, metabolites, drugs, toxins, biohazards, ions, carbohydrates, polysaccharides, hormones, receptors, antigens, antibodies, viruses, metabolites, co-factors, drugs, dyes, nutrients, or growth factors.
- the method of the invention detects of identifies proteins or post-translationally modified forms of proteins.
- the target is a post-translationally modified protein, where the post-translation modifications is phosphorylation, prenylation, glycosylation, methionine removal, N-acetylation, acylation, acylation of cysteines, myristoylation, alkylation, ubiquitinylation, prolyl-4-hydroxylation, carboxylation of glutaminyl residues, advanced glycoslylation, deamination of glutamine and asparagine, addition of glycophosphatidylinositol, disulfide bond formation, hydroxylation, or lipidation.
- the post-translation modifications is phosphorylation, prenylation, glycosylation, methionine removal, N-acetylation, acylation, acylation of cysteines, myristoylation, alkylation, ubiquitinylation, prolyl-4-hydroxylation, carboxylation of glutaminyl residues, advanced glycoslylation, deamination of glutamine and asparagine, addition of glycophosphatid
- the target is a protein kinase.
- the target is a phosphorylated protein kinase.
- the invention includes a diagnostic system for identifying or detecting a target molecule, where the diagnostic system includes a nucleic acid sensor molecule of the invention and a detector in communication with the nucleic acid sensor molecule, wherein the detector detects changes in the signal generated by the optical signal generating unit of the nucleic acid sensor.
- the diagnostic system further includes a processor for processing signals detected by the detector.
- the invention includes a method of identifying or detecting a protein kinase in a sample by contacting a sample suspected of containing a protein kinase with a nucleic acid sensor molecule, wherein said nucleic acid sensor molecule has a target recognition domain that recognizes a protein kinase, and wherein a change in the signal generated by the optical signal generating unit indicates the presence of protein kinase in the sample.
- the method further includes quantifying the amount of signal generated by the optical signal generating unit to quantify the amount of protein kinase in the sample.
- the invention provides a method of identifying a modulator of protein kinase activity by contacting a test agent with a protein kinase and nucleic acid sensor molecule, wherein the nucleic acid sensor molecule has a target recognition domain that recognizes a protein kinase, recognition of the protein kinase by the target recognition domain of the nucleic acid sensor molecule results in a change in the signal generated by the optical signal generating unit and wherein changes in the signal generated by the optical signal generating unit in the presence and absence of the test agent indicates the test agent is a modulator, of the protein kinase activity.
- the catalytic domain of the nucleic acid sensor molecule includes a cis-ligase ribozyme or a trans-ligase ribozyme.
- the invention provides a nucleic acid sensor molecule which includes a target modulation domain that recognizes ERK, a catalytic domain that includes a ligase or cis-hammerhead, and a linker domain that links the target modulation domain and the catalytic domain.
- the invention includes a nucleic acid sensor molecule which includes a target modulation domain that recognizes phosphoERK, a catalytic domain that includes a ligase or a cis-hammerhead, and a linker domain that links the target modulation domain and the catalytic domain.
- the invention provides a nucleic acid sensor molecule which includes a target modulation domain that recognizes lysozyme, a catalytic domain that includes a 1-piece cis-ligase and a linker domain that links the target modulation domain and the catalytic domain.
- the invention provides a nucleic acid sensor molecule which includes a target modulation domain that recognizes any one of cCMP, cAMP, or cGMP, a catalytic domain, and a linker domain that links the target modulation domain and the catalytic domain, wherein the nucleic acid sensor molecule includes an optical signal generating unit or a non-radioactive detectable label.
- the nucleic acid sensor molecule includes an optical signal generating unit.
- the nucleic acid sensor molecule includes a detectable label.
- the label is a radioactive label, such as, for example, 32 P, 33 P, 14 C, 35 S, 3 H, or 125 I.
- the nucleic acid sensor molecule comprises a fluorescent label, such as, for example, fluorescein, DABCYL, or a green fluorescent protein (GFP) moiety.
- the optical signal generating unit includes a fluorescent moiety and a quenching moiety, wherein recognition by the target modulation domain causes causes a change in detectable fluorescence by the optical signal generating unit.
- the nucleic acid sensor molecule includes an enzymatic label, or an affinity capture tag label.
- the nucleic acid sensor molecule includes a target modulation domain recognizes ERK1, ERK2 or both.
- the nucleic acid sensor molecule includes a target modulation domain and catalytic domain are as shown by SEQ ID NO. 80, and the linker is randomized.
- the nucleic acid sensor molecule includes a target modulation domain and a catalytic domain as shown in any one of SEQ ID NOS. 47, 118 and 119, and the linker is randomized.
- the invention provides a nucleic acid sensor molecule that recognizes ERK having the SEQ ID NO. 90–95, 108–116, 131–133, 140–295, 349, 351, or 356.
- the invention provides a nucleic acid sensor molecule that recognizes phospoERK having the SEQ ID NO. 5–8, 37–39, 44–45, 81–89, 96–100, 121–130, 352, or 353.
- the invention provides a nucleic acid sensor molecule that recognizes any one of cCMP, cAMP or cGMP, having the SEQ ID NO. 40–43, 103, or 135–139.
- the invention provides a nucleic acid sensor molecule that recognizes lysozyme, having the SEQ ID NO. 46, 47, 76, or 105–107.
- the invention provides a 1-piece ligase ribozyme including a target modulation domain that recognizes a target, a linker domain, and a catalytic domain wherein the 5′ and 3′ ends of the ligase ligate to each other upon recognition of the target by the modulation domain.
- the invention provides a 2-piece ligase ribozyme including a target modulation domain that recognizes a target, a linker domain, and a catalytic domain including an oligonucleotide substrate ligation site and and oligonucleotide supersubstrate binding domain, wherein upon recognition of the target by the modulation domain, the 3′ end of the an oligonucleotide supersubstrate is ligated to the 5′ end of the oligonucleotide substrate ligation site.
- the invention provides a 3-piece ligase ribozyme including a target modulation domain that recognizes a target, a linker domain, and a catalytic domain comprising comprising an oligonucleotide substrate binding domain capable of binding an oligonucleotide substrate and an effector-oligonucleotide binding site capable of binding an effector oligonucleotide, wherein upon recognition of the target by the modulation domain, and in the presence of binding of the effector oligonucleotide to the effector-oligonucleotide binding site, then the 3′ end of the oligonucleotide substrate is ligated to the 5′ end of the ligase.
- the invention also provides a 1-piece ligase ribozyme comprising the nucleic acid sensor molecule shown in any one of SEQ ID NOS. 47, 105–107, 119.
- the invention also provides a 2-piece ligase ribozyme comprising the nucleic acid sensor molecule shown in any one of SEQ ID NOS. 347, 349, and 351.
- the invention further provides a 3-piece ligase ribozyme comprising the nucleic acid sensor molecule shown in any one of SEQ ID NOS. 46, 75, 76, 108–116, 118, 121–130, and 352.
- FIG. 1 depicts methodology for selecting nucleic acid sensor molecules of the invention.
- FIG. 1A is a flow diagram showing a method for selecting nucleic acid sensor precursor molecules having a target molecule activatable ligase activity according to one embodiment.
- FIG. 1B is a flow diagram showing a gel-based method for selecting nucleic acid sensor precursor molecules having a target molecule activatable endonuclease activity according to one embodiment.
- FIGS. 2A and B show a nucleic acid sensor molecule (SEQ ID NO:46) according to one embodiment, in which the catalytic site includes a ligase site.
- FIG. 2A shows the conformation of the target molecule (SEQ ID NO:46) bound form of the nucleic acid sensor molecule with an effector oligo hybridized to its 3′ end (SEQ ID NO:51).
- FIG. 2B shows the conformation of the non-target bound form of the nucleic acid (SEQ ID NO:46) sensor molecule.
- FIGS. 3A and B show a nucleic acid sensor molecule (SEQ ID NO:47) derived from the nucleic acid sensor precursor molecule shown in FIGS. 2A and B in which first and second nucleotides are labeled with first and second signaling moieties (F and D, respectively).
- FIG. 4 is a flow diagram showing a method for selecting nucleic acid sensor molecules having a target molecule activatable self-cleavage activity according to one embodiment.
- FIGS. 5A and B show a nucleic acid sensor molecule according to one embodiment, in which the catalytic site includes a self-cleavage site which is the catalytic core of a hammerhead ribozyme.
- FIG. 5A shows the conformation of the target molecule bound form of the nucleic acid sensor molecule (SEQ ID NO:48).
- FIG. 5B shows the conformation of the non-target bound form of the nucleic acid sensor molecule (SEQ ID NO:48).
- FIGS. 6A and B show a nucleic acid sensor molecule derived from the nucleic acid sensor molecule shown in FIGS. 3A and B in which first and second nucleotides are labeled with first and second signaling moieties (F and D, respectively) (SEQ ID NO:49).
- FIG. 7 is a schematic diagram illustrating pathway target molecules according to one embodiment.
- FIG. 8 is a flow chart showing steps in a drug optimization method according to one embodiment, in which nucleic acid sensor molecules are used at each step in the method.
- FIG. 9A shows an example of a self-cleaving nucleic acid sensor bound to a solid support when used in an epi-illuminated FRET detection scheme.
- FIG. 9B shows the same sensor in an epi-illuminated beacon configuration, with the acceptor fluorophore replaced by a quencher group.
- FIG. 9C shows the same sensor in an TIR-illuminated beacon configuration.
- FIG. 10A shows an example of a self-ligating nucleic acid sensor bound to a solid support when used in a TIR-illuminated detection scheme where there is a signal increase upon target binding.
- FIG. 10B shows the same sensor in an epi-illuminated configuration, where target binding is detected by monitoring changes of the fluorophore bound to the substrate at the surface of the array.
- FIG. 10C shows the same epi-illuminated configuration, where target binding is detected by monitoring changes in the fluorescence polarization.
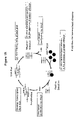
- FIG. 11 illustrates the use of beads in a homogeneous assay format utilizing a self-ligating nucleic acid sensor.
- FIG. 11A shows the beads prior to target binding and ligation (no emission from acceptor).
- FIG. 11B shows the beads after target binding and ligation (emission from acceptor detected).
- FIG. 12 shows a schematic of a previously constructed scanning detection system utilizing TIR laser evanescent wave excitation in either large area illumination/CCD imaging mode, or scanned spot/PMT imaging mode.
- the schematic shows how an array can be scanned and FP or fluorescence intensity data extracted.
- FIG. 13 shows a schematic of fluorescence data generated by a biosensor array using the indicated nucleic acid sensors and target molecules.
- FIG. 14 shows a schematic showing different catalytic platforms for detection methods for nucleic acid sensor molecules.
- FIG. 15 is a schematic showing a ligase nucleic acid sensor molecule sensor system. It shows SEQ ID NO:76 across the top, and SEQ ID NO:77 hybridized to a portion of SEQ ID NO:76 and bound to an insulating moiety.
- FIG. 16 is a schematic showing a hammerhead (endonuclease) Nucleic acid sensor molecule sensor system. It has a nucleic acid sensor molecule sensor (SEQ ID NO:78), and SEQ ID NO:79 hybridizing to a portion of the sensor and bound to an insulating moiety.
- SEQ ID NO:78 nucleic acid sensor molecule sensor
- SEQ ID NO:79 hybridizing to a portion of the sensor and bound to an insulating moiety.
- FIG. 17 is a schematic of the net electron transfer to or from the electrode.
- FIG. 18 is a schematic of a peak in the faradaic current, centered at the redox potential of the electron donor species (specified for a given reference electrode) and superposed on top of the capacitive current baseline which is observed in the absence of surface-immobilized signaling probes.
- FIG. 19 is the sequence of the entire ERK2 activated allosteric ribozyme (SEQ ID NO:80). Also shown are the sequences of the Stem II connector domain for selective clones.
- FIG. 20A is a chart showing measurement of cis-hammerhead cleavage.
- FIG. 20B shows a chart showing measurement of cis-hammerhead cleavage.
- FIG. 20C is a chart showing measurement of cis-hammerhead cleavage.
- FIG. 21 is a chart showing ERK2-dependence of cis-hammerhead cleavage.
- FIG. 22A is a chart showing the measurement of ERK2-inhibitor IC50 values by nucleic acid sensor molecule.
- FIG. 22B is a chart showing the fraction of construct I-14 cleaved in the presence of 100 nM ERK2, ricin, or MEK, or with no protein.
- FIG. 23A shows a ppERK cis-hammerhead nucleic acid sensor molecule construct (SEQ ID NO:353).
- FIG. 23B shows construct 6 (SEQ ID NO:81) 7 (SEQ ID NO:82), 8 (SEQ ID NO:83), 9 (SEQ ID NO:84), 10 (SEQ ID NO:85), 11 (SEQ ID NO:86) 12 (SEQ ID NO:87), 13 (SEQ ID NO:88), and 14 (SEQ ID NO:89).
- FIG. 24 shows the linker region, activity, and stability of constructs 6 through 14.
- FIGS. 25A and B show a bar graph and corresponding radiograph demonstrating the relative pp ERK dependence of constructs 6, 10, and 12.
- FIG. 26 shows the sequences for lysozyme modulated ligase nucleic acid sensor molecules C.lys.L1.A (SEQ ID NO:105), C.lys.L1.B (SEQ ID NO:106), and C.lys.L1.C (SEQ ID NO:107).
- FIG. 27 is a schematic of how an L1 ligase is configured for self-circularization, and how its self-circularization can be detected using RT-PCR.
- FIG. 28 shows increases in amplification of circularized C.lys.L1.B (SEQ ID NO:106) in response to the addition of lysozyme.
- the signal is strengthened as additional cycles of PCR are performed.
- FIG. 29 shows that the ligase nucleic acid sensor molecule C.lys.L1.B (SEQ ID NO:106) still self ligates in response to the presence of lysozyme, even in the presence of HeLa cell extract, demonstrating the stability of this nucleic acid sensor molecule.
- FIG. 30 shows modulation of a 1-piece ligase nucleic acid sensor molecule in vivo.
- FIG. 31 is a schematic showing the construct design for an ERK dependent 3-piece ligase nucleic acid sensor molecule (SEQ ID NO:118).
- FIG. 32 shows the sequences for constructs 17 (SEQ ID NO:109), 18 (SEQ ID NO:110), 19 (SEQ ID NO:111), 20 (SEQ ID NO:112), and 21 (SEQ ID NO:113), 22 (SEQ ID NO:114), 23 (SEQ ID NO:115), 24 (SEQ ID NO:116), 25 (SEQ ID NO:117), and 26 (SEQ ID NO:118).
- FIG. 33 shows the ERK dependent activity of constructs 17 (A), 18 (B), 20 (C), 21 (D), 19 (E), 22 (F), 23 (G), 25 (H), and 26 (I).
- FIG. 34 is a graph that shows ligase time-dependent activity assays for construct 17 (clone A) (SEQ ID NO:109) and construct 19 (clone E) (SEQ ID NO:111).
- FIG. 35 shows a graph showing the time-dependent activity of construct 19 (clone E) (SEQ ID NO:111) with varying concentrations of ERK2.
- FIG. 36 shows secondary structure representations of 3-piece construct 27 (SEQ ID NO:118) and 1-piece construct 28 (SEQ ID NO:119) ERK dependent ligases.
- 1-piece ERK dependent ligase is a slightly modified version of 3-piece system where the effector and substrate regions are replaced by a stable GNRA tetraloop.
- FIG. 37 shows a graph demonstrating continued ERK2 dependence of a nucleic acid sensor molecule in the 3-piece and 1 -piece formats (constructs 19 and 28, respectively).
- FIG. 38 shows a secondary structure representation of the 2-piece ERK dependent ligase platform (SEQ ID NO:347), and its oligonucleotide substrate (SEQ ID NO:350).
- FIG. 39A shows a secondary structure representation of two 2-piece ERK-modulated nucleic acid sensor molecules: construct 29 (SEQ ID NO:349), and construct 30 (SEQ ID NO:351), with their oligonucleotide substrate (SEQ ID NO:348).
- FIG. 39B shows ligation assays run on constructs 29 (SEQ ID NO:349) and 30 (SEQ ID NO:351), in the absence or in the presence of 1 uM ERK.
- FIG. 40 shows the ligation efficiency of ERK nucleic acid sensor molecule construct 19 (SEQ ID NO:111) detected with quantitiative-PCR (Taqman®). All incubation with various concentration of ERK were performed in the presence of 10% 293 extracts with exogenously added 10 mM MgCl 2 .
- FIG. 41 shows a schematic of the template for ppERK dependent ligase nucleic acid sensor molecules (SEQ ID NO:352) and its oligonucleotide substrate (SEQ ID NO:350).
- FIG. 42 shows the nucleotide sequences for construct 31 (TK.16.118.K) (SEQ ID NO:121), construct 32 (TK.16.118.L) (SEQ ID NO:122), construct 33 (TK.16.118.M) (SEQ ID NO:123), construct 34 (TK.16.118.N) (SEQ ID NO:124), construct 35 (TK.16.118.O) (SEQ ID NO:125), construct 36 (TK.16.118.P) (SEQ ID NO:126), construct 37 (TK.16.118.Q) (SEQ ID NO:127), construct 38 (TK.16.118.R) (SEQ ID NO:128), construct 39 (TK.16.118.S) (SEQ ID NO:129), and construct 40 (TK.16.118.T) (SEQ ID NO:130).
- FIG. 43 shows template sequences for the creation of a ppERK (SEQ ID NO:354) or ERK (SEQ ID NO:355) library of nucleic acid sensor molecules.
- FIG. 44A shows the stem sequences of ERK dependent nucleic acid clones CW45-33-A08 (SEQ ID NO:356), CW45-33-C08 (SEQ ID NO:131), CW45-33-C09 (SEQ ID NO:132), CW45-33-D09 (SEQ ID NO:133), CW45-33-F08 (SEQ ID NO:90), CW45-33-H08 (SEQ ID NO:91), CW45-33-H09 (SEQ ID NO:92), CW45-33-A10 (SEQ ID NO:93), CW45-33-F09 (SEQ ID NO:94), and CW45-33-G08 (SEQ ID NO:95).
- FIG. 44B shows the stem sequences of pp ERK dependent nucleic acid clones CW45-33-A02 (SEQ ID NO:44), CW45-33-B04 (SEQ ID NO:45), CW45-33-C04 (SEQ ID NO:5), CW45-33-D04 (SEQ ID NO:6), CW45-33-F03 (SEQ ID NO:7), CW45-33-D01 (SEQ ID NO: 8), CW45-33-D02 (SEQ ID NO:37), CW45-33-D05 (SEQ ID NO:38), CW45-33-E01 (SEQ ID NO:39), CW45-33-G02 (SEQ ID NO:96), CW45-33-G03 (SEQ ID NO:97), CW45-33-H03 (SEQ ID NO:98), CW45-33-H1 (SEQ ID NO:99), and CW45-33-B05 (SEQ ID NO:100).
- FIG. 45 nucleotide sequences of CW45-33-A02 (SEQ ID NO:44), and CW45-33-D04 (SEQ ID NO:6).
- FIG. 46 shows a schematic demonstrating amplicon-dependent nucleic acid amplification (ADNA).
- FIG. 47 shows a schematic describing a mechanism used by nucleic acid sensor molecules to transduce signal and the kinetic constants used to characterize NASMs.
- FIG. 48 shows a graph demonstrating the determination of threshold cycle versus log of target molecule concentration using amplicon-dependent nucleic acid amplification via quantitative PCR analysis.
- FIG. 49 shows a graph demonstrating the determination of threshold cycle versus log of target molecule concentration using amplicon-dependent nucleic acid amplification via SYBR-green analysis.
- FIG. 50 shows a radiograph demonstrating lysozyme sensitive ligase nucleic acid sensor molecule activity in reticulocyte and HeLa cell extract.
- FIG. 51 shows a radiograph showing that ligase activity is relatively unchanged in the presence of cell lysate and various RNase inhibitors.
- FIG. 52 shows a radiograph of a lysozyme modulated nucleic acid sensor molecule in the presence of human serum.
- FIG. 53 shows a schematic describing rolling circle amplification of an amplicon derived from immobilized trans-acting ligase nucleic acid sensor molecules.
- FIG. 54 shows a schematic describing exponential amplification of an amplicon.
- FIG. 55 shows a schematic describing FRET-based signal generation coupled to nucleic acid synthesis of nucleic acid sensor molecules.
- FIG. 56 shows a schematic describing cellular assays using 1-piece ligase nucleic acid sensor molecules.
- FIG. 57 shows bar graphs plotting the rate of activity of nucleic acid sensors when in the presence of different target molecules in vitro.
- Panel A shows the rate of activity in the presence of ERK and phosphorylated ERK for construct 19 (ligase E) on the left bar and construct 33 (ligase M) on the right bar.
- Panel B shows construct 19 and 33 rates of activity in the presence of Ras, MEK, ERK, p38, and ricin.
- FIG. 58 shows a graph describing the activity of an ERK modulated nucleic acid sensor molecule in the presence of 10% 293 cell extract in the left panel.
- the right panel shows the activity of an ERK modulated nucleic acid sensor molecule in the presence of increasing concentrations of staurosporine. Both panels show data determined using quantitive PCR methods (ADNA).
- FIG. 59 lists the switch factor, dissociation constants, catalytic constant and detection limit for an ERK aptamer in comparison to four ERK dependent ligase nucleic acid sensor molecules.
- FIG. 60A and B show RT-PCR gels, and C and D corresponding bar graphs showing ERK modulation of a nucleic acid sensor molecule in vitro (panels A and C) and in biological extracts (panels B and D).
- FIG. 61 shows a schematic describing optical detection based on the modulation of an intron-derived nucleic acid sensor molecule.
- FIG. 62 shows the original solution-phase cGMP-dependent hammerhead nucleic acid sensor molecule FRET construct (SEQ ID NO:101) and its effector/capture oligo (SEQ ID NO:102) from which the solid-phase FRET sensor was derived.
- the fluorophore (F) and quencher (Q) are FAM and DABCYL, respectively.
- the donor fluorophore (D) and acceptor fluorophore (A) are FAM and AlexaFluor 568, respectively.
- FIG. 63A shows the surface-immobilized FRET sensor before, and FIG. 63B shows after, exposure to the activating target molecule (cGMP), followed by subsequent cleavage and dissociation of the sequence fragment containing the acceptor fluorophore (A).
- FIG. 63C shows the expected kinetic time course signals and FIG. 63D shows the actual kinetic time course signals observed from these sensors in the presence of various concentrations of target.
- FIG. 64 shows fitted kinetic time course signals observed from the solid-phase FRET sensor constructs in a solution-phase assay.
- FIG. 64A shows a graph that plots the signal observed from the donor fluorophore only in the presence of 200 uM cGMP.
- FIG. 64B shows a graph of the parametric fit to the experimental data shown in FIG. 64A , verifying that the rate constant for the solid-phase construct is in fact similar to that for the solution-phase construct under similar conditions.
- FIGS. 65A and 65B compare the observed pseudo-first order rate constants from solution- and solid-phase FRET sensor constructs.
- FIG. 65C , D, and E shows experimental data and constructs for multiplexed detection using solution-phase cGMP and cAMP FRET.
- FIG. 66A shows an endonuclease (hammerhead ribozyme)-based nucleic acid sensor immobilized linked to a gold surface via a thiol linker.
- FIG. 66B shows the fraction of this type of sensor cleaved and dissociated as a function of time in the presence of a fixed concentration of target.
- FIG. 66C shows the signal (image density) from a panel of immobilized sensors prior to their exposure to a target-mixture.
- FIG. 66D shows the signal from the uncleaved sensors after exposure to the mixture of all listed targets, while FIG. 66E represents the target-dependent cleavage signal. Specific target-dependent activity of each sensor is seen in each case for this multiplexed assay.
- FIG. 67 shows a schematic diagram of the integrated SPReeta SPR sensor module ( FIG. 67A ), as well as the nucleic acid (hammerhead ribozyme) sensor molecule that is immobilized on the gold SPR layer ( FIG. 67B ).
- FIGS. 67C and 67D show typical real-time data generated by the SPR sensor system during sensor loading and target analyte-induced cleavage, respectively.
- FIG. 68 gives the sequences for three cyclic nucleotide-dependent nucleic acid (hammerhead ribozyme) sensors dependent upon cGMP (SEQ ID NO:135), cCMP (SEQ ID NO:136), and cAMP (SEQ ID NO:137) in a conformation suitable for direct 5′ surface attachment.
- the schematic shows the SPR sensor construct intended for direct 5′ attachment to a native gold surface via a terminal thiol linker.
- FIG. 69 gives the sequences for three cyclic nucleotide-dependent nucleic acid (hammerhead ribozyme) sensors dependent upon cCMP (SEQ ID NO:138), cAMP (SEQ ID NO:103), and cGMP (SEQ ID NO:139) in a conformation suitable for direct 3′ surface attachment.
- the figure schematic shows the SPR sensor construct intended for direct 3′ attachment to a neutravidin surface which has been passively adsorbed onto the gold SPR surface via cysteine residues.
- FIG. 70 gives the sequences for three cyclic nucleotide-dependent nucleic acid (hammerhead ribozyme) sensors dependent upon cCMP (SEQ ID NO:40), cAMP (SEQ ID NO:41), and cGMP (SEQ ID NO:42)in a conformation suitable for indirect surface attachment via a capture oligo.
- the schematic shows the SPR sensor construct intended for indirect surface attachment via a capture oligo to a neutravidin surface which has been passively adsorbed onto the gold SPR surface via cysteine residues.
- FIG. 71 shows the surface loading ( FIG. 71A ) and target-dependent cleavage ( FIG. 71B ) of cGMP-dependent nucleic acid (hammerhead ribozyme) sensor molecules, as well as the physical configurations of the various nucleic acid sensor molecules ( FIG. 71C ) that give rise to the indicated portions of the kinetic data shown.
- the high signal to noise ratio (SNR) and dynamic range (DNR) of this SPR sensor array are clearly evident from the plots.
- FIG. 72 shows a plot of SPR signal (in refractive index units, RIU) vs. time for a typical SPR sensor array assay: surface cleaning (dH 2 0, NaOH, PBS), surface loading of the gold SPR layer with neutravidin (NA), requilibration with PBS (PBS), loading of the surface with biotinylated sensor molecules in PBS(HH+B/PBS), requilibration of sensor surface in assay buffer (HH buff), and addition of target in assay buffer (target/HH buff).
- FIG. 73 shows a schematic representation of the secondary structure and components of a ligase-based nucleic acid array sensor.
- the sensor (SEQ ID NO:75) is shown attached to the chip surface via hybridization to a capture oligo (SEQ ID NO:104), and with an external substrate oligo bearing a fluorescent label already ligated into place.
- the substrate oligo can be either directly labeled (as shown), or labeled with an affinity tag (e.g., biotin) for subsequent indirect labeling or signal amplification (e.g., via tyramide signal amplification).
- an affinity tag e.g., biotin
- FIG. 74 contrasts the two principal solid-phase array (chip) formats used for ligase-based nucleic acid sensors.
- FIG. 75 shows a multiplex in situ ligase sensor chip, with pre-immobilized radiolabeled sensors activatable by lysozyme (LYS) and FMN.
- FIG. 76 shows dose-response data for ERK-dependent ligase-based nucleic acid sensors using a gel-assay (panel A) and a capture chip (pane lB).
- FIG. 77 shows dose-response data for an in situ ligase-based nucleic acid sensor array populated with ERK-dependent unlabeled ligase sensors in FIG. 77A and in FIG. 77B the retained ligation signal from each spot in the concentration profile was plotted vs. its corresponding target concentration.
- FIG. 78 shows dose-response data for a ERK-dependent ligase-based nucleic acid sensor capture array in FIG. 78A and captured and amplified fluorescent ligation signal for each spot is plotted in FIG. 78B vs. its corresponding target concentration.
- FIG. 79 shows the components of a generalized construct for an amplifiable ligase-based nucleic acid sensor molecule.
- FIG. 80 shows a generalized strategy for performing a multiplexed capture chip formatted assay with ligase-based nucleic acid sensors.
- FIG. 81 shows a generalized strategy for performing a highly sensitive capture chip formatted assay with ligase-based nucleic acid sensors.
- FIG. 82 shows a schematic describing multiplexed chip assays.
- the invention is generally drawn to catalytic NASMs (also know as allosteric ribozymes, aptazymes and the like) and optical nucleic acid sensor molecules that may be used to monitor the presence or concentration of various target molecules.
- Target molecules include a variety of biologically relevant molecules, such as, for example, proteins (including specific post-translationally modified forms of proteins), peptides, nucleic acids, nucleotides, natural products, metabolites, drugs, toxins, biohazards, and ions.
- the invention also includes methods by which a change in the activity or conformation of a nucleic acid sensor molecule upon recognition of a specific target molecule can be coupled to a quantifiable, measurable signal.
- the invention also includes methods which allow one to test the inhibitory activity of one or more compounds simultaneously against one or more enzymes or biochemical targets.
- Assays can be carried out in a variety of formats, including in vitro biochemical assays, in vitro cellular assays, in vivo cellular assays, in solution, on chips or other substrates, or in vivo animal models. These assays have applications in all phases of drug discovery, including target validation and discovery and development, high throughput screening, biochemical assays, in vitro cellular models and in vivo animal models.
- Nucleic acid sensor molecules are RNAs, DNAs, RNA/DNA hybrids, or derivatives or analogs of nucleic acids that catalyze a chemical reaction and/or undergo a conformational change upon the recognition of a specific target molecule.
- Nucleic acid sensor molecule - based assays can be carried out using all catalytic platforms, which include endonucleases, such as the hammerhead ribozyme, the hairpin ribozyme, the HDV ribozyme, and the VS ribozyme; ligases, such as the L1 ligase, and the class I–III ligases and; group I and group II self-splicing introns.
- Catalytic NASMs can be generated or selected by a variety of methods both disclosed herein and known in the art. For examples, see WO98/27104, WO01/96559, and WO 00/26226 Also disclosed herein are optical nucleic acid sensor molecules and methods making them. In general, optical catalytic NASMs generate a detectable optical signal upon recognition of a target molecule. Optical NASMs are generated from catalytic NASMs by addition of an optical signal generating unit.
- catalytic NASMs can be used, e.g., to detect target molecules either by generation of an optical signal or an amplicon detectable, e.g., by RT-PCR, size gel purification procedures and any other means of seperating variously sized or conformed nucleic acid molecules.
- Optical NASMs can be used, e.g., to detect target molecules by generation of an optical signal.
- Optical signals can be generated by optical NASMs in a number of ways.
- the signal is an optical signal generated, e.g., by the fluorescence of a fluorescent dye.
- the signal is an optical signal generated by molecules in close proximity to the nucleic acid sensor molecule whose optical or electrochemical properties are affected by the presence of the target molecule bound nucleic acid sensor molecule.
- the nucleic acid sensor molecules comprise at least one signaling moiety.
- the nucleic acid sensor molecules comprise first and second signaling moieties whose optical properties change in response to the binding of a target molecule through changes in the proximity of the first and second signaling moieties.
- detection can be direct or indirect.
- a plurality of nucleic acid sensor molecules are provided, either in solution, or immobilized on a substrate, generating a biosensor.
- a diagnostic system is provided which comprises at least one biosensor in optical communication with a optical signal detector. Methods of using the diagnostic system are also provided, as well as kits for performing the method.
- the NASMs are used to detect the presence of target molecules in vivo.
- oligonucleotide is used interchangeably with the term “nucleic acid” and includes RNA or DNA (or RNA/DNA) sequences of more than one nucleotide in either single strand or double-stranded form.
- a “modified oligonucleotide” includes at least one residue with any of: an altered intemucleotide linkage(s), altered sugar(s), altered base(s), or combinations thereof.
- target molecule is any molecule to be detected.
- target molecule refers to, any molecule for which nucleic acid sensor molecule exists or can be generated and can be naturally occurring or artificially created.
- a “signature target molecule” is a target molecule whose expression is correlatable with a trait.
- a “diagnostic signature target molecule” is a signature target molecule whose expression is, by itself or in combination with other signature target molecules, diagnostic of a trait.
- a “pathway target molecule” is a target molecule involved in a biological or metabolic pathway and whose accumulation and/or activity is dependent on other target molecules in the same biological or metabolic pathway, or whose accumulation and/or activity affects the accumulation and/or activity of other target molecules in the same biological or metabolic pathway.
- a “diagnostic pathway target molecule” is a pathway target molecule whose expression/activity and/or structural properties, by itself or in combination with other pathway target molecules, is diagnostic of a particular trait.
- a “profiling nucleic acid sensor molecule” is a nucleic acid sensor molecule that recognizes a signature target molecule, a diagnostic signature target molecule, a pathway target molecule, and/or a diagnostic pathway target molecule.
- a “biosensor” comprises a plurality of nucleic acid sensor molecules.
- a “profiling biosensor” comprises a plurality of profiling nucleic acid sensor molecules.
- a molecule which “naturally binds to DNA or RNA” is one which is found within a cell in an organism found in nature.
- catalytic domain is the portion of a nucleic acid sensor molecule possessing catalytic activity which is modulated in response to binding of a target molecule to the target modulation domain.
- linker region is a portion of a nucleic acid sensor molecule by or at which the “target modulation domain” and “catalytic domain” are joined.
- Linker regions include, but are not limited to oligonucleotides of varying length, baseparring phosphodiester, phosphothiolate, and other covalent bonds, chemical moieties (e.g., PEG), PNA, formacetal, bismaleimide, disulfide, and other bifunctional linker reagents.
- the linker domain is also sometimes referred to herein as a “connector” or “stem”.
- a “random sequence” or a “randomized sequence” is a segment of a nucleic acid having one or more regions of fully or partially random sequences.
- a fully random sequence is a sequence in which there is an approximately equal probability of each base (A, T, C, and G) being present at each position in the sequence.
- a partially random sequence instead of a 25% chance that an A, T, C, or G base is present at each position, there are unequal probabilities.
- a fixed region is a nucleic acid sequence which is known.
- amplifying means any step or process or any combination of steps or processes that increases the amount or number of copies of a molecule or class of molecules.
- a “catalytic nucleic acid sensor molecule” is a nucleic acid molecule 20 comprising a target modulation domain, a linker region, and a catalytic domain.
- an “optical nucleic acid sensor molecule” is a catalytic nucleic acid sensor molecule wherein the catalytic domain has been modified to emit an optical signal as a result of and/or in lieu of catalysis by the inclusion of an optical signal generating unit.
- nucleic acid sensor molecule refers to either or both of a catalytic nucleic acid sensor molecule and an optical nucleic acid sensor molecule.
- a “signal” is a detectable physical quantity, impulse or object.
- an “optical signal” is a signal the optical properties of which can be detected.
- an “optical signal generating unit” is a portion of a nucleic acid sensor molecule comprising one or more nucleic acic sequences and/or non-nucleic acid molecular entities, which change optical or electrochemical properties or which change the optical or electrochemical properties of molecules in close proximity to them in response to a change in the conformation or the activity of the nucleic acid sensor molecule following recognition of a target molecule by the target modulation domain.
- a nucleic acid sensor molecule which “recognizes a target molecule” is a nucleic acid molecule whose activity is modulated upon binding of a target molecule to the TMD a greater extent than it is by the binding of any non-target molecule or in the absence of the target molecule.
- the recognition event between the nucleic acid sensor molecule and the target molecule need not be permanent during the time in which the resulting allosteric modulation occurs. Thus, the recognition event can be transient with respect to the ensuing allosteric modulation (e.g., conformational change) of the nucleic acid precursor molecule or nucleic acid sensor molecule.
- an “array” or “microarray” refers to a biosensor comprising a plurality of nucleic acid sensor molecules immobilized on a substrate.
- a “substrate” refers to any physical supporting surface, whether rigid, flexible, solid, porous, gel-based, or of any other material or composition.
- an “amplicon” is the sequence of a nucleic acid sensor molecule with ligase activity covalently ligated to an oligonucleotide substrate.
- cleavage substrate is an oligonucleotide or portion of an oligonucleotide cleaved upon target molecule recognized by a target modulation domain of an endonucleolytic nucleic acid sensor molecule.
- an “oligonucleotide substrate” is an oligonucleotide that is acted upon by the catalytic domain of a nucleic acid sensor molecule.
- an “effector oligonucleotide” is an oligonucleotide that base pairs with the effector oligonucleotide binding domain of a nucleic acid sensor molecule with ligase activity.
- an “effector oligonucleotide binding domain” is the portion of the nucleic acid sensor molecule with ligase activity which is complementary to the effector oligonucleotide.
- a “capture oligonucleotide” is an oligonucleotide that is used to attach a nucleic acid sensor molecule to a substrate by complementarity and/or hybridization.
- an “oligonucleotide substrate binding domain” is the portion on the nucleic acid sensor molecule with ligase activity that is complementary to and can base pair with an oligonucleotide substrate.
- a “oligonucleotide supersubstrate” is an oligonucleotide substrate that is complementary to and can base pair with the oligonucleotide substrate binding domain and to the effector oligonucleotide binding domain of a nucleic acid sensor molecule with ligase activity.
- the oligonucleotide supersubstrate may or may not carry an affinity tag.
- oligonucleotide supersubstrate binding domain is the region of a nucleic acid sensor molecule with ligase activity that is complementary to and can base pair with the oligonucleotide supersubstrate.
- stem selection refers to a process performed on a pool of nucleic molecules comprising a target modulation domain, a catalytic domain and an oligonucleotide linker region wherein the linker region is fully or partially randomized.
- rational design/engineering refers to a technique used to construct nucleic acid sensor molecules in which a non-conserved region of a ribozyme is replaced with a target modulation domain and joined to the catalytic domain of the ribozyme by an oligonucleotide linker region.
- amplicon dependent nucleic acid amplification refers to a technique by which one can amplify the signal of a nucleic acid sensor molecule by use of standard RT/PCR or Real-Time RT-PCR methods.”
- switch factor is the enhancement observed in the catalytic activity and/or catalytic initial rate of a nucleic acid sensor molecule upon recognition of a target molecule by the target modulation domain.
- a “cis-ligase ribozyme” is a ligase ribozyme that ligates its 3′ end to its 5′ end.
- the cis-ligase ribozyme is also referred herein as “1-piece ligase” and is a 1-component system where oligonucleotide substrate, oligonucleotide substrate binding domain, catalytic domain, effector oligonucleotide and effector oligonucleotide binding domains are fused in the format shown in FIG. 39 .
- a “trans-ligase ribozyme” is a ligase ribozyme that ligates its 5′ end to the 3′ end of an oligonucleotide substrate.
- a “2-piece ligase” is a 2-component trans-ligase ribozyme.
- the first component consists of the catalytic domain, the linker region, the target modulation domain, the substrate binding domain and the effector oligonucleotide binding domain.
- the second component is the oligonucleotide substrate that is complementary to the substrate binding domain and the effector oligonucleotide binding domain. This system follows the format shown in FIG. 41 .
- a “3-piece ligase” is a 3-component trans-ligase ribozyme.
- the first component consists of the catalytic domain, the linker, the target modulation domain, the substrate binding domain and the effector oligonucleotide binding domain.
- the second component is the effector oligonucleotide that is complementary to the effector oligonucleotide binding domain.
- the third component is the oligonucleotide substrate that is complementary to the substrate binding domain. This system follows the format of the 3-piece ligase platform shown in FIG. 39 .
- Catalytic nucleic acid sensor molecules are selected which have a target molecule-sensitive catalytic activity (e.g., ligation or self-cleavage) from a pool of randomized oligonucleotides.
- the catalytic NASMs have a target modilation domain to which the target molecule specifically binds and a catalytic domain for mediating a catalytic reaction. Binding of a target molecule to the target modulation domain triggers a conformation change and/or change in catalytic activity in the nucleic acid sensor molecule.
- an optical nucleic acid sensor molecule is generated whose optical properties change upon binding of a target molecule to the target modulation domain.
- the pool of randomized oligonucleotides comprises the catalytic site of a ribozyme.
- a heterogeneous population of oligonucleotide molecules comprising randomized sequences is screened to identify a nucleic acid sensor molecule having a catalytic activity which is modified (e.g., activated) upon interaction with a target molecule.
- Each oligonucleotide in the population comprises a random sequence and at least one fixed sequence at its 5′ and/or 3′ end.
- the fixed sequence comprises at least a portion of a catalytic site.
- the random sequence is flanked at both ends with fixed sequences.
- the random sequence portion of the oligonucleotide is about 15–70 (e.g., 30–40) nucleotides in length and can comprise ribonucleotides and/or deoxyribonucleotides.
- Random oligonucleotides can be synthesized from phosphodiester-linked nucleotides using solid phase oligonucleotide synthesis techniques well known in the art (see, e.g., Froehler, et al., 1986a; 1986b.
- Oligonucleotides can also be synthesized using solution phase methods such as triester synthesis methods (see, e.g., Sood, et al., 1977, and Hirose, et al., 1978). Typical syntheses carried out on automated DNA synthesis equipment yield 10 15 –10 17 molecules. Sufficiently large regions of random sequence in the sequence design increases the likelihood that each synthesized molecule is likely to represent a unique sequence.
- random oligonucleotides comprise entirely random sequences; however, in other embodiments, random oligonucleotide can comprise stretches of nonrandom or partially random sequences. Partially random sequences can be created by adding the four nucleotides in different molar ratios at each addition step.
- modified oligonucleotides can be used and can include one or more substitute intemucleotide linkages, altered sugars, altered bases, or combinations thereof.
- oligonucleotides are provided in which the P(O)O group is replaced by P(O)S (“thioate”), P(S)S (“dithioate”), P(O)NR 2 (“amidate”), P(O)R, P(O)OR′, CO or CH 2 (“formacetal”) or 3′-amine (—NH—CH 2 —CH 2 —), wherein each R or R′ is independently H or substituted or unsubstituted alkyl.
- Linkage groups can be attached to adjacent nucleotide through an —O—N—, or —S— linkage. Not all linkages in the oligonucleotide are required to be identical.
- the oligonucleotides comprise modified sugar groups, for example, one or more of the hydroxyl groups is replaced with halogen, aliphatic groups, or functionalized as ethers or amines.
- the 2′-position of the furanose residue is substituted by any of an O-methyl, O-alkyl, O-allyl, S-alkyl, S-allyl, or halo group.
- 2-fluoro-ribonucleotide oligomer molecules can increase the sensitivity of a nucleic acid sensor molecule for a target molecule by ten-to one hundred-fold over those generated using unsubstituted ribo- or deoxyribooligonucleotides (Pagratis, et al., 1997), providing additional binding interactions with a target molecule and increasing the stability of the nucleic acid sensor molecule's secondary structure(s) (Kraus, et al., 1998; Pieken, et al., 1991; Lin, et al., 1994; Jellinek, et al. 1995; Pagratis, et al., 1997).
- the random sequence portion of the oligonucleotide is flanked by at least one fixed sequence which comprises a sequence shared by all the molecules of the oligonucleotide population.
- Fixed sequences include sequences such as hybridization sites for PCR primers, promoter sequences for RNA polymerases (e.g., T3, T4, T7, SP6, and the like), restriction sites, or homopolymeric sequences, such as poly A or poly T tracts, catalytic cores (described further below), sites for selective binding to affinity columns, and other sequences to facilitate cloning and/or sequencing of an oligonucleotide of interest.
- the fixed sequence is approximately 50 nucleotides in length.
- the fixed sequence comprises at least a portion of a catalytic site of an oligonucleotide molecule (e.g., a ribozyme) capable of catalyzing a chemical reaction.
- Catalytic sites are well known in the art and include, e.g. a ligase site (see FIG. 2 ), the catalytic sites of Group I or Group II introns (see, e.g., U.S. Pat. No. 5,780,272), the catalytic core of a hammerhead ribozyme (see, e.g., U.S. Pat. No. 5,767,263 and U.S. Pat. No. 5,700,923, and FIG.
- Nucleic acid sensor molecules are generally selected in a 5 to 20 cycle procedure. In one embodiment, heterogeneity is introduced only in the initial selection stages and does not occur throughout the replicating process.
- FIG. 1A shows a schematic diagram in which the oligonucleotide population is screened for a nucleic acid sensor molecule which comprises a target molecule activatable ligase activity.
- FIG. 1B shows the hammerhead nucleic acid sensor molecule selection methodology. Each of these methods are readily modified for the selection of NASMs with other catalytic activities.
- the ligation reaction involves covalent attachment of an oligonucleotide substrate to the 5′-end of the NASM through formation of a phosphodiester linkage.
- Other ligation chemistries can form the basis for selection of NASMs (e.g., oligonucleotide ligation to the 3′-end, alkylation's (Wilson & Szostak), peptide bond formation (Zhang & Czech), Diels-Alder reactions to couple alkenes and dienes (Seelig & Jaschke), etc.).
- the chemical functional groups that constitute the reactants in the ligation reaction may not naturally appear within nucleic acids.
- RNA pool in which one of the ligation reactants is covalently attached to each member of the pool (e.g., attaching a primary amine to the 5′-end of an RNA to enable selection for peptide bond formation).
- Ligation buffer e.g., 30 mM Tris HCI, pH 7.4, 600 mM NaCl, 1 mM EDTA, 1% NP-40, 60 mM MgCl 2
- tag-substrate e.g., Tag-UGCCACU
- Tags encompassed within the scope include, e.g., radioactive labels, fluorescent labels, a chemically reactive species such as thiophosphate, the first member of a binding pair comprising a first and second binding member, each member bindable to the other (e.g., biotin, an antigen recognized by an antibody, or a tag nucleic acid sequence).
- the reaction is stopped by the addition of EDTA.
- the reaction can be terminated by removal of the substrate or addition of denaturants (e.g. urea, formamide).
- Ligated molecules are removed from pool of selectable molecules (STEP 2), generating a population of oligonucleotides substantially free of ligated molecules (as measured by absence of the tag sequence in the solution).
- the tag is the first member of a binding pair (e.g., biotin) and the ligated molecules (“biotin-oligonucleotide substrate:5′-fixed:random:3′-fixed”) are physically removed from the solution by contacting the sample to a solid support to which the second member of the binding pair is bound (“S”) (e.g., streptavidin).
- S solid support to which the second member of the binding pair is bound
- the eluant collected comprises a population of oligonucleotides enriched for non-ligated molecules (5′-fixed:random:3′-fixed). This step can be repeated multiple times until the oligonucleotide population is substantially free of molecules having target-insensitive ligase activity.
- the oligonucleotide substrate provided during the negative selection step has a different sequence from that provided during the positive selection step.
- PCR is carried out using a primer complementary to the positive selection oligonucleotide substrate, only target-activated ligases will be capable of amplification.
- a positive selection phase follows.
- more 3′ primer and tagged oligonucleotide substrate are added to the pool resulting from the negative selection step.
- Target molecules are then added to form a reacted solution and the reacted solution is incubated at 25 ° C. for about 2 hours (STEP 3).
- Target molecules encompassed within the scope include, e.g., proteins or portions thereof (e.g., receptors, antigen, antibodies, enzymes, growth factors), peptides, enzyme inhibitors, hormones, carbohydrates, polysaccharides, glycoproteins, lipids, phospholipids, metabolites, metal ions, cofactors, inhibitors, drugs, dyes, vitamins, nucleic acids, membrane structures, receptors, organelles, and viruses.
- Target molecules can be free in solution or can be part of a larger cellular structure (e.g., such as a receptor embedded in a cell membrane).
- a target molecule is one which does not naturally bind to nucleic acids.
- nucleic acid sensor molecules are selected which are activated by target molecules comprising molecules having an identified biological activity (e.g., a known enzymatic activity, receptor activity, or a known structural role); however, in another embodiment, the biological activity of at least one of the target molecules is unknown (e.g., the target molecule is a polypeptide expressed from the open reading frame of an EST sequence, or is an uncharacterized polypeptide synthesized based on a predicted open reading frame, or is a purified or semi-purified protein whose function is unknown).
- target molecules comprising molecules having an identified biological activity (e.g., a known enzymatic activity, receptor activity, or a known structural role); however, in another embodiment, the biological activity of at least one of the target molecules is unknown (e.g., the target molecule is a polypeptide expressed from the open reading frame of an EST sequence, or is an uncharacterized polypeptide synthesized based on a predicted open reading frame, or is a purified or semi-purified protein whose function
- the target molecule does not naturally bind to nucleic acids
- the target molecule does bind in a sequence specific or non-specific manner to a nucleic acid sensor molecule.
- a plurality of target molecules binds to the nucleic acid sensor molecule. Selection for NASMs specifically responsive to a plurality of target molecules (i.e. not activated by single targets within the plurality) may be achieved by including at least two negative selection steps in which subsets of the target molecules are provided.
- nucleic acid sensor molecules are selected which bind specifically to a modified target molecule but which do not bind to non-modified target molecules.
- Targeted modifications include, e.g., post-translational modifications of a protein, such as phosphorylation, ribosylation , methylation (Arg, Asp, N, S, or 0-directed), prenylation (e.g., famesyl, geranylgeranyl, and the like), acetylation, acylation, allelic variations within a protein (e.g., single amino acid changes in a protein) and cleavage sites in a protein.
- intermediates in a chemical synthesis pathway can be targeted, as well as starting and final products.
- stereochemically distinct species of a molecules can be targeted.
- the reacted solution is enriched for ligated molecules (biotin-oligonucleotide substrate: 5′- fixed :random:3′-fixed) by removing non-tagged molecules (5′-fixed:random:3′-fixed) from the solution.
- the tagged oligonucleotide substrate comprises a biotin tag and ligated molecules are isolated by passing the reacted solution over a solid support to which streptavidin (S) is bound (STEP 4).
- ligated molecules are identified as nucleic acid sensor molecules and released from the support by disrupting the binding pair interaction which enabled capture of the catalytically active molecules. For example, heating to 95° C. in the presence of 10 mM biotin allows release of biotin-tagged catalysts from an immobilized streptavidin support.
- the captured catalysts remain attached to a solid support and are directly amplified (described below) while immobilized.
- Multiple positive selection phases can be performed (STEPS 3 and 4). In one embodiment, the stringency of each positive selection phase is increased by decreasing the incubation time by one half.
- ligation of an oligonucleotide to the active species provides a primer binding site that enables subsequent PCR amplification using an oligonucleotide substrate complementary to the original oligonucleotide substrate.
- Unligated species do not necessarily need to be physically separated from other species because they are less likely to amplify in the absence of a covalently tethered primer binding site.
- Selected nucleic acid sensor molecules are amplified (or in the case of RNA molecules, first reverse transcribed, then amplified) using an oligonucleotide substrate primer (“S primer”) (e.g., 5 ′-AAAAAATGCACTGGACT-3′ (SEQ ID NO:3)) which specifically binds to the litgated oligonucleotide substrate sequence (STEP 5).
- S primer oligonucleotide substrate primer
- amplified molecules are further amplified with a nested PCR primer that regenerates a T7 promoter (“T7 Primer”) from the 5′ fixed and the litigated oligonucleotide substrate sequence (STEP 6).
- the oligonucleotide pool may be further selected and amplified to eliminate any remaining unligated sequences (5′-fixed:random:3′-fixed) by repeating STEPS 3–7.
- any number of amplification methods can be used (either enzymatic, chemical, or replication-based, e.g., such as by cloning), either singly, or in combination. Exemplary amplification methods are disclosed in Saiki, et al., 1985; Saiki, et al., 1988, Kwoh, et al., 1989; Joyce, 1989; and Guatelli, et al., 1990.
- the 3′ primer (3′ prime) (see STEP 3 in FIG. 1A ) is included in the ligation mixture, selected nucleic acid sensor molecules may require this sequence for activation. In cases where this is undesirable, the 3′ primer may be omitted from the mix.
- the final nucleic acid sensor molecule can be modified by attaching the 3′ primer via a short sequence loop or a chemical linker to the 3′ end of the nucleic acid sensor molecule, thereby eliminating the requirement for added primer, allowing 3′ primer sequence to self-prime the molecule.
- nucleic acid sensor molecule begins with the synthesis of a ribozyme sequence on a DNA synthesizer. Random nucleotides are incorporated generating pools of roughly 10 16 molecules. Most molecules in this pool are non-functional, but a handful will respond to a given target and be useful as nucleic acid sensor molecules. Sorting among the billions of species to find the desired molecules starts from the complex sequence pool. Nucleic acid sensor molecule are isolated by an iterative process: in addition to the target-activated ribozymes that one desires, the starting pool is usually dominated by either constitutively active or completely inactive ribozymes. The selection process removes both types of contaminants.
- the starting library of DNA sequences is generated by automated chemical synthesis on a DNA synthesizer. This library of sequences is transcribed in vitro into RNA using T7 RNA polymerase and subsequently purified.
- Negative selection incubation In the absence of the desired target molecule of interest, the RNA library is incubated together with the binding buffer alone. During this incubation, non-allosteric (or non-target activated) ribozymes are expected to undergo cleavage.
- RNA pool is then incubated under identical conditions but now in the presence of the target molecule of interest in binding buffer.
- RT-PCR amplified DNA is purified and transcribed to yield an enriched pool for a subsequent round of reselection.
- an oligonucleotide population is screened for a nucleic acid sensor molecule which comprises a target molecule having activatable self-cleaving activity.
- the starting population of oligonucleotide molecules comprises 5′ and 3′ fixed regions (“5′-fixed and 3′ fixed A-3′fixed B”) and at least fixed regions, in this example, the 3′ fixed region, comprises a ribozyme catalytic core including a self cleavage site (the junction between 3′ fixed A-3 ′ fixed B).
- the 5′-fixed: random:3′ fixed A-3′-fixed B molecule is GGGCGACCCUGAUGAGCCUGG-N 20-50 -UUAGACGAAACGGUGAAAGCCGUAGGUUGCCC (SEQ ID NO:4), where N 20-50 is a random sequence of 20–50 nucleotides.
- the population of oligonucleotide molecules comprising random oligonucleotides flanked by fixed 5′ and 3′ sequences are negative selected to remove oligonucleotides which self-cleave (i. e., 5′-fixed:random:3′-fixed-A molecules) even in the absence of target molecules.
- the oligonucleotide pool is incubated in reaction buffer (e.g., 50 mM Tris HCl, pH 7.5, 20 mM MgCl 2 ) for 5 hours at 25° C., punctuated at one hour intervals by incubation at 60° C. for one minutes (STEP 1).
- the uncleaved fraction of the oligonucleotide population (containing 5′-fixed and 3′ fixed A-3′-flxed B molecules) is purified by denaturing 10% polyacrylamide gel electrophoresis (PAGE) (STEP 2).
- PAGE polyacrylamide gel electrophoresis
- Target molecule dependent cleavage activity is then selected in the presence of target molecules in the presence of reaction buffer by incubation at 23° C. for about 30 seconds to about five minutes (STEP 3).
- Cleaved molecules (5′-fixed:random:3′fixed-A molecules) are identified as nucleic acid sensor molecules and are purified by PAGE (STEP 4).
- Amplification of the cleaved molecule is performed using primers which specifically bind the 5′-fixed and the 3′-fixed A sequences, regenerating the T7 promoter and the 3′-fixed B site (STEP 5), and the molecule is further amplified further by RNA transcription using T7 polymerase (STEP 6).
- the process (STEPS 1–6) is repeated until the nucleic acid sensor precursor population is reduced to about one to five unique sequences.
- Tags can be attached to the 3′-fixed B sequence and separation can be based upon separating tagged sequences from non-tagged sequences at STEP 4. Chromatographic procedures that separate molecules on the basis of size (e.g., gel filtration) can be used in place of electrophoresis.
- One end of each molecule in the RNA pool can be attached to a solid support and catalytically active molecules isolated upon release from the support as a result of cleavage.
- Alternate catalytic cores may be used. These alternate catalytic cores and methods using these cores are also are encompassed within the scope of the invention.
- Nucleic acid sensor molecules which combine both cleavage and ligase activities in a single molecule can be isolated by using one or a combination of both of the selection strategies outlined independently above for ligases and endonucleases.
- the hairpin ribozyme is known to catalyze cleavage followed by ligation of a second oligonucleotide substrate (Berzal-Herranz et al.).
- Target activated sensor precursors based on the hairpin activity can be isolated from a pool of randomized sequence RNAs prepared as described previously with a sequence of the form 5′-GGAGTTACCTAACAAGAAACAGNgaagtcaaccagNgaaacNCACGGAGACGTGNNaNattaNct ggt(N 20 -N 50 )GGACCTACTGAGCTGACAGTCCTGTTTGATGCATACCGAGTAAGTG-3′ (SEQ ID NO:36) where N indicates any nucleotide, lower case letters represent doped nucleotides, and uppercase letters represent fixed nucleotides.
- Hairpin-based NASMs can be isolated on the basis of target molecule dependent release of the fragment 5′-GUCCUGUUUGAUGCAUACCGAGUAAGUG-3′ (SEQ ID NO:74) in the same way that hammerhead-based NASMs are isolated (e.g.,. target molecule dependent increase in electrophoretic mobility or target molecule dependent release from a solid support).
- nucleic acid sensor molecules can be selected on the basis of their ability to substitute the 3′-sequence released upon cleavage for another sequence as described in an target molecule independent manner by Berzal-Heranz et al.
- the original 3′-end of the NASM is released in an initial cleavage event-and an exogenously provided oligonucleotide substrate with a free 5′-hydroxyl is ligated back on.
- the newly attached 3′-end provides a primer binding site that can form the basis for preferential amplification of catalytically active molecules.
- Constitutively active molecules that are not activated by a provided target molecule can be removed from the pool by (1) separating away molecules that exhibit increased electrophoretic mobility in the absence of an exogenous oligonucleotide substrate or in the absence of target molecule, or (2) capturing molecules that acquire an exogenous oligonucleotide substrate (e.g., using a 3′-biotinylated substrate and captured re-ligated species on an avidin column.
- the group I intron self-splicing ribozymes combine cleavage and ligation activities to promote ligation of the exons that flank it.
- an exogenous guanosine cofactor attacks the 5′-splice site.
- the 5′-exon is released coincident with attachment of the guanosine cofactor to the ribozyme.
- Group I intron-derived NASMs can be isolated from degenerate sequence pools by selecting molecules on the basis of either one or both chemical steps, operating in either a forward or reverse direction. NASMs can be isolated by specifically enriching those molecules that fail to promote catalysis in the absence of target molecule but which are catalytically active in its presence. Specific examples of selection schemes follow.
- RNAs related in sequence to a representative group I intron e.g., the Tetrahymena thermophila pre-rRNA intron or the phage T4 td intron
- a representative group I intron e.g., the Tetrahymena thermophila pre-rRNA intron or the phage T4 td intron
- Random sequence regions can be embedded within the intron at sites known to be important for proper folding and activity (eg., substituting the P5abc domain of the Tetrahymena intron, Williams et al.).
- Intron nucleic acid sensor molecules, in this case, sensitive to thio-GMP can be generated as follows.
- the intron is synthesized with a short 5′-exon.
- a guanosine cofactor is provided and constitutively active molecules undergo splicing.
- the target molecule is provided together with thio-GMP. Molecules responsive to the target undergo activated splicing and as a result acquire a unique thiophosphate at their 5′-termini.
- Thio-tagged NASMs can be separated from untagged ribozymes by their specific retention on mercury gels or activated thiol agarose columns.
- the method is performed as described in Green & Szostak.
- An intron is synthesized with a 5′-guanosine and no 5′-exon.
- An oligonucleotide substrate complementary to the 5′-intemal guide sequence is provided during the negative selection step and constitutively active molecules ligate the substrate to their 5′-ends, releasing the original terminal guanosine.
- a second oligonucleotide substrate with a different 5′-sequence is provided together with target in the positive selection step.
- NASMs specifically activated by the target molecule ligate the second oligonucleotide substrate to their 5′-ends.
- PCR amplification using a primer corresponding to the second substrate can be carried out to preferentially amplify target molecule sensitive nucleic acid sensor molecules.
- the method is performed as described in Robertson & Joyce.
- the intron is synthesized with no flanking exons.
- pool RNAs are incubated together with a short oligonucleotide substrate under conditions which allow catalysis to proceed.
- a second oligonucleotide substrate with a different 3′-sequence is provided together with the sensor target.
- NASMs are activated and catalyze ligation-of the 3′-end of the second substrate.
- Reverse transcription carried out using a primer complementary to the 3′-end of the second substrate specifically selects NASMs for subsequent amplification.
- nucleic acid sensor molecules Once nucleic acid sensor molecules are identified, they can be isolated, cloned, sequenced, and/or resynthesized using natural or modified nucleotides. Accordingly, synthesis intermediates of nucleic acid sensor molecules are also encompassed within the scope, as are replicatable sequences (e.g., plasmids) comprising nucleic acid sensor precursor molecules and nucleic acid sensor molecules.
- replicatable sequences e.g., plasmids
- the nucleic acid sensor molecules identified above through in vitro selection comprise a catalytic domain (i.e., a signal generating moiety), coupled to a target modulation domain, (i.e., a domain which recognizes a target molecule and which transduces that molecular recognition event into the generation of a detectable signal).
- a target modulation domain i.e., a domain which recognizes a target molecule and which transduces that molecular recognition event into the generation of a detectable signal.
- the target modulation domain is defined by the minimum number of nucleotides sufficient to create a three-dimensional structure which recognizes a target molecule.
- the nucleic acid sensor molecules of the present invention use the energy of molecular recognition to modulate the catalytic or conformational properties of the nucleic acid sensor molecule.
- the selection process as described in detail in the present invention identifies novel nucleic acid sensor molecules through target modulation of the catalytic core of a ribozyme.
- the in vitro selection procedures described herein are distinct from those previously described for affinity-based aptamer selections (e.g., SELEX) in that we show that selective pressure on the starting population of NASMs (starting pool size is as high as 10 14 to 10 17 molecules) results in nucleic acid sensor molecules with enhanced catalytic properties, but not in enhanced binding properties, FIG. 59 .
- the NASM selection procedures place selective pressure on catalytic effectiveness of potential NASMS by modulating both target concentration and reaction time-dependence.
- NASMs that have high switch factors
- FIG. 57 NASMs that have high specificity
- the kinetic properties of the NASMs of the present invention are consistent with that obtained from a nucleoprotein-selection reported previously by Robertson and Ellington (2001) in which the resulting ribozyme (switch factor equal to 1,700 fold) has the same affinity for RNA (1 ⁇ M) as did the starting pool.
- the catalytic site is a known sequence (a ligase site or a hammerhead catalytic core) and is at least a portion of either the 5′ and/or 3′ fixed region (the other portion being supplied by the random sequence), or is a complete catalytic site.
- the catalytic site may be selected along with the target molecule binding activity of oligonucleotides within the oligonucleotide pool.
- the deletion enhances the conformational stability of the optical nucleic acid sensor molecule in either the bound or unbound forms.
- FIGS. 6A and B deletion of the entire catalytic domain of the catalytic NASM shown in FIG. 5 is shown to stabilize the unbound form of the nucleic acid sensor molecule.
- the deletion may be chosen so as to take advantage of the inherent fluorescence-quenching properties of unpaired guanosine (G) residues (Walter, N. G. and Burke, J. M., “Real-time monitoring of hairpin ribozyme kinetics through base-specific quenching of fluorescein-labeled substrates”, RNA 3:392 (1997).)
- the target modulation domain from a previously identified nucleic acid sensor molecule is incorporated into an oligonucleotide sequence that changes conformation (e.g., from a duplexed hairpin to a G-quadruplex) upon target binding.
- Optical Nucleic acid sensor molecules of this type can be derived from allosteric ribozymes, such as those derived from the hammerhead, hairpin, L1 ligase, or group 1 intron ribozymes and the like, all of which transduce molecular recognition into a detectable signal.
- RNA optical nucleic acid sensor molecules which specifically bound to cNMP (Garretta et al., 2001).
- the catalytic cores for hammerhead ribozymes were removed and replaced with 5-base duplex forming sequences.
- the binding of these reengineered RNA optical NASMs to c-NMP was then confirmed experimentally.
- By adjusting the duplex length they can be redesigned to undergo significant conformational changes.
- the conformational changes can be coupled to detection via FRET or simply changes in fluorescence intensity (as in the case of a molecular beacon). For example, by adding an appropriate probe on the each end of the duplex, the stabilization of duplex by target binding can be monitored with the change in fluorescence.
- the above experimental example is performed in solution and utilizes a cuvette-based fluorescence spectrometer
- the methods are performed in microwell multiplate readers (e.g., the Packard Fusion, or the Tecan Ultra) for high-throughput solution phase measurements.
- a nucleic acid sensor molecule is bound to a surface by a linker attached to one end of the molecule.
- a nucleic acid sensor molecule is modified to include a 12 carbon linker terminated with an amine group. This free amine group allows the NASM to be attached to an aldehyde-derivatized glass surface via standard protocols for Schiff base formation and reduction.
- the nucleic acid sensor molecules can be bound in discrete regions or spots to form an array or uniformly distributed to cover an extended area. In the absence of target molecule, the optical nucleic acid sensor molecule forms a stem-loop conformation with duplex formation along the stem due to the complementarity of the nucleotides at the 3′ and 5′ ends of the molecule.
- the optical nucleic acid sensor molecule undergoes a conformational rearrangement.
- this conformational rearrangement results in a change in the distance between the fluorophore attached to the 5′ end and the quencher attached to the 3′ end.
- the quencher separated from the fluorophore, the detected fluorescence emission intensity from the fluorophore increases sharply.
- the detected increase in fluorescence intensity with target molecule concentration can be used to detect and quantify the amount of target present in a sample solution introduced onto the surface.
- a sample solution can be laterally confined about the sensor surface by a coverslip, microwell, incubation chamber seal, or flowcell.
- an optical signaling unit is either added to, or inserted within, the nucleic sensor molecule, generating a sensor molecule whose optical properties change in response to binding of the target molecule to the target modulation domain.
- the optical signaling unit is added by exposing at least a 5′ or 3′ nucleotide that was not previously exposed.
- the 5′ nucleotide or a 5′ subterminal nucleotide (e.g., an internal nucleotide) of the molecule is couplable to a first signaling moiety while the 3′ nucleotide or 3′ subterminal nucleotide is couplable to a second signaling moiety.
- Target molecule binding to the optical nucleic acid sensor molecule alters the proximity of the 5′ and 3′ nucleotide (or subterminal nucleotides) with respect to each other, and when the first and second signaling moieties are coupled to their respective nucleotides, this change in proximity results in a target sensitive change in the optical properties of the nucleic acid sensor molecule. Detection of changes in the optical properties of the nucleic acid sensor molecule can therefore be correlated with the presence and/or quantity of a target molecule in a sample.
- optical NASMs are generated by adding first and second signaling moieties, that are coupled to the 5′ terminal or subterminal sequences, and 3 ′-terminal and subterminal sequences respectively, of the catalytic NASM.
- Signaling molecules can be coupled to nucleotides which are already part of the nucleic acid sensor molecule or may be coupled to nucleotides which are inserted into the nucleic acid sensor molecule, or can be added to a nucleic acid sensor molecule as it is synthesized. Coupling chemistries to attach signaling molecules are well known in the art (see, for example, The Molecular Probes Handbook, R. Haughland).
- Suitable chemistries include, e.g., derivatization of the 5-position of pyrimidine bases (e.g., using 5′-amino allyl precursors), derivatization of the 5′-end (e.g., phosphoroamidites that add a primary amine to the 5′-end of chemically-synthesized oligonucleotide) or the 3′-end (e.g., periodate treatment of RNA to convert the 3′-ribose into a dialdehyde which can subsequently react with hydrazide-bearing signaling molecules).
- derivatization of the 5-position of pyrimidine bases e.g., using 5′-amino allyl precursors
- derivatization of the 5′-end e.g., phosphoroamidites that add a primary amine to the 5′-end of chemically-synthesized oligonucleotide
- the 3′-end e
- a single signaling moiety is either added to, or inserted within, the catalytic nucleic sensor molecule.
- binding of the target molecule results in changes in both the conformation and physical aspect (e.g., molecular volume, and thus rotational diffusion rate, etc.) of the optical nucleic acid sensor molecule.
- Conformational changes in the optical nucleic acid sensor molecule upon target binding will modify the chemical environment of the signaling moiety, while changes in the physical aspect of the nucleic acid, sensor molecule will alter the kinetic properties of the signaling moiety. In both cases, the result will be a detectable change in the optical properties of the nucleic acid sensor molecule.
- the optical nucleic acid sensor molecule is prepared without a quencher group. Instead of a quencher group a moiety with a free amine group can be added. This free amine group allows the sensor molecule to be attached to an aldehyde-derivatized glass surface via standard protocols for Schiff base formation and reduction.
- the nucleic acid sensor molecules can be bound in discrete regions or spots to form an array, or uniformly distributed to cover an extended area.
- the optical nucleic acid sensor molecule will diffusionally rotate about its point of attachment to the surface at a rate characteristic of its molecular volume and mass. After target binding, the optical NASM-target complex will have a correspondingly larger volume and mass. This change in molecular volume (mass) will slow the rate of rotational diffusion, and result in a measurable change in the polarization state of the fluorescence emission from the fluorophore.
- a single signaling moiety is attached to a portion of a catalytic NASM that is released as a result of catalysis (e.g., either end of a self-cleaving ribozyme or the pyrophosphate at the 5′-end of a ligase).
- a catalytic NASM that is released as a result of catalysis (e.g., either end of a self-cleaving ribozyme or the pyrophosphate at the 5′-end of a ligase).
- Target molecule-activated catalysis leads to release of the signaling moiety from the optical NASM to generate a signal correlated with the presence of the target.
- Release can be detected by either (1) changes in the intrinsic optical properties of the signaling moiety (e.g., decreased fluorescence polarization as the released moiety is able to tumble more freely in solution), or (2) changes in the partitioning of the signaling moiety (e.g., release of a fluorophore from a chip containing immobilized ribozymes such that the total fluorescence of the chip is reduced following washing).
- changes in the intrinsic optical properties of the signaling moiety e.g., decreased fluorescence polarization as the released moiety is able to tumble more freely in solution
- changes in the partitioning of the signaling moiety e.g., release of a fluorophore from a chip containing immobilized ribozymes such that the total fluorescence of the chip is reduced following washing.
- the catalytic nucleic acid sensor molecule is unmodified and the optical signaling unit is provided as a substrate for the NASM.
- the optical signaling unit is provided as a substrate for the NASM.
- One example of this embodiment includes a fluorescently tagged oligonucleotide substrate which can be joined to a NASM with ligase activity.
- analyte-containing samples are incubated with the fluorescent oligonucleotide substrate and the ligase under conditions that allow the ligase to function.
- the ligase is separated from free oligonucleotide substrate (e.g., by capturing ligases onto a solid support on the basis of hybridization to ligase-specific sequences or by pre-immobilizing the ligases on a solid support and washing extensively).
- Quantitation of the captured fluorescence signal provides a means for inferring the concentration of analyte in the sample.
- catalytic activity alters the fluorescence properties of a oligonucleotide substrate without leading to its own modification.
- Fluorophore pairs or fluorophore/quencher pairs can be attached to nucleotides flanking either side of the cleavage site of an oligonucleotide substrate for a trans-acting endonuclease ribozyme (Jenne et al.). Target activated cleavage of the substrate leads to separation of the pair and a change in its optical properties.
- the ligase catalytic NASM and its oligonucleotide substrates are unmodified and detection relies on catalytically-coupled changes in the ability of the NASM to be enzymatically amplified.
- a target-activated ligase is incubated together with oligonucleotide substrate and an analyte-containing sample under conditions which allow the ligase to function. Following an incubation period, the reaction is quenched and the mixture subjected to RT/PCR amplification using a primer pair that includes the oligo sequence corresponding to the ligation substrate.
- Amplification products can be detected by a variety of generally practiced methods (e.g. Taqman®). Only those ribozymes that have self-ligated an oligonucleotide substrate are capable of amplification under these conditions and will generate a signal that can be coupled to the concentration of the sensor target.
- proximity dependent signaling moieties are known in the art and are encompassed within the scope of the present invention (see, e.g., Morrison, 1992, in Nonisotopic DNA Probe Techniques, Kricka, ed., Academic Press, Inc., San Diego, Calif., chapter 13; and Heller and Morrison, 1985, in Rapid Detection and Identification of Infectious Agents, Academic Press, Inc., San Diego, Calif., pages 245–256). Systems using these signaling moieties rely on the change in fluorescence that occurs when the moieties are brought into close proximity.
- FET fluorescence energy transfer
- FRET fluorescence resonance energy transfer
- nonradiative energy transfer long-range energy transfer
- dipole-coupled energy transfer dipole-coupled energy transfer
- Forster energy transfer see, e.g., U.S. Pat. No. 5,491,063, Wu, and Brand, 1994.
- proximity-dependent signaling systems that do not rely on direct energy transfer between signaling moieties are also known in the art and can be used in the methods described herein. These include, e.g., systems in which a signaling moiety is stimulated to fluoresce or luminesce upon activation by the target molecule. This activation may be direct (e.g., as in the case of scintillation proximity assays (SPA), via a photon or radionuclide decay product emitted by the bound target), or indirect (e.g., as in the case of AlphaScreenTM assays, via reaction with singlet oxygen released from a photosensitized donor bead upon illumination).
- SPA scintillation proximity assays
- AlphaScreenTM assays via reaction with singlet oxygen released from a photosensitized donor bead upon illumination
- the activation of detected signaling moiety is dependent on close proximity of the signaling moiety and the activating species.
- the nucleic acid sensor molecule may be utilized in either solution-phase or solid-phase formats. That is, in functional form, the nucleic acid sensor molecule may be tethered (directly, or via a linker) to a solid support or free in solution.
- a scintillation proximity assay is used.
- the nucleic acid sensor molecules, ligate on oligonucleotide substrate in the presence of a target molecule are bound to a scintillant-impregnated microwell plate (e.g., FlashPlates, NEN Life Sciences Products, Boston, Mass.) coated with, for example, streptavidin via a (biotin) linker attached to the 5′ end of the effector oligonucleotide sequence (for example, GCGACTGGACATCACGAG (SEQ ID NO:51) in FIG. 2A ).
- a scintillant-impregnated microwell plate e.g., FlashPlates, NEN Life Sciences Products, Boston, Mass.
- streptavidin e.g., streptavidin
- the various plate-sensor coupling chemistries are determined by the type and manufacturer of the plates, and are well-known in the art.
- a solution containing target molecule and excess radiolabeled (e.g., with 32 P or 35 S) oligonucleotide substrate in ligation buffer the NASMs hybridize and ligate the substrate oligonucleotide.
- Some fraction of the radiolabeled oligonucleotide substrate will be ligated to surface-immobilized NASMs on the plate, while unligated oligonucleotide substrate will be free in solution.
- oligonucleotide substrates ligated to surface-immobilized NASMs on the plate will be in close enough proximity to the scintillant molecules embedded in the plate to excite them, thereby stimulating luminescence which can be easily detected using a luminometer (e.g., the TopCount luminescence plate reader, Packard Biosciences, Meriden, Conn.).
- a luminometer e.g., the TopCount luminescence plate reader, Packard Biosciences, Meriden, Conn.
- a similar SPA assay format is performed using scintillant-impregnated beads (e.g., Amersham Pharmacia Biotech, Inc., Piscataway, N.J.).
- the NASMs which ligate on oligonucleotide substrate in the presence of a target molecule are coupled to scintillant-impregnated beads which are suspended in solution in, for example, a microwell plate.
- the various bead-sensor coupling chemistries are determined by the type and manufacturer of the beads, and are well-known in the art.
- the NASMs hybridize and ligate the oligonucleotide substrate. Some fraction of the radiolabeled substrate will be ligated to surface-immobilized NASMs on the beads, while unligated substrate will be free in solution.
- radiolabeled e.g., with 32 P or 35 S
- this type of homogeneous assay format can be used to investigate cellular processes in situ in real time. This could be done by culturing cells directly onto a microwell plate and allowing uptake of scintillant beads and radioisotope by cells. Biosynthesis, proliferation, drug uptake, cell motility, etc. can then be monitored via the luminescence signal generated by beads in presence of selected target molecules (see Cook et al.,1992, or Heath et al., 1992).
- FIGS. 11A and B show an exemplary embodiment of a non-isotopic proximity assay based on nucleic acid sensor molecules used in conjunction with AlphaScreenTm beads (Packard Biosciences, Meriden, Conn.).
- the nucleic acid sensor molecules which ligate on oligonucleotide substrate in the presence of a target molecule (see FIGS. 2A and B), are 5 bound to a chemiluminescent compound-impregnated acceptor bead coated with, for example, streptavidin, via a (biotin) linker attached to the 5′ end of the effector oligonucleotide sequence (GCGACTGGACATCACGAG (SEQ ID NO:5 1) in FIG. 2A ).
- a chemiluminescent compound-impregnated acceptor bead coated with, for example, streptavidin via a (biotin) linker attached to the 5′ end of the effector oligonucleotide sequence (GCGACTGGA
- the various bead-sensor coupling chemistries are determined by the type and manufacturer of the beads, and are well-known in the art.
- the oligonucleotide substrate is coupled to a photosensitizer-impregnated donor bead coated with, for example, streptavidin, via a (biotin) linker attached to the 3′ end of the substrate.
- the donor (substrate) and acceptor (ribozyme) beads and target molecules are then combined in solution in a microwell plate, some of the NASMs hybridize and ligate the oligonucleotide substrate, bringing the donor and acceptor beads into close proximity ( ⁇ 200 nm).
- the photosensitizer in the donor bead Upon illumination at 680 nm, the photosensitizer in the donor bead converts ambient oxygen into the singlet state at a rate of approximately 60,000/second per bead.
- the singlet oxygen will diffuse a maximum distance of approximately 200 nm in solution; if an acceptor bead containing a chemiluminescent compound is within this range, i.e., if ligation has occurred in the presence of the target molecule, chemiluminescence at 370 nm is generated.
- This radiation is immediately converted within the acceptor bead to visible luminescence at 520–620 nm with a decay half-life of 0.3 sec.
- the visible luminescence at 520–620 nm is detected using a time-resolved fluorescence/luminescence plate reader (e.g., the Fusion multifuinction plate reader, Packard Biosciences, Meriden, Conn.).
- a time-resolved fluorescence/luminescence plate reader e.g., the Fusion multifuinction plate reader, Packard Biosciences, Meriden, Conn.
- This type of nonisotopic homogeneous proximity assay format provides highly sensitive detection and quantification of target molecule concentrations in volumes ⁇ 25 microliters for high throughput screening (see Beaudet et al. 2001).
- Suitable fluorescent labels are known in the art and commercially available from, for example, Molecular Probes (Eugene, Oreg.). These include, e.g., donor/acceptor (i.e., first and second signaling moieties) molecules such as: fluorescein isothiocyanate (FITC) /tetramethylrhodamine isothiocyanate (TRITC), FITC/Texas Red TM Molecular Probes), FITC/N-hydroxysuccinimidyl 1 -pyrenebutyrate (PYB), FITC/eosin isothiocyanate (EITC), N-hydroxysuccinimidyl 1 -pyrenesulfonate (PYS)/FITC, FITC/Rhodamine X (ROX), FITC/tetramethylrhodamine (TAMRA), and others.
- donor/acceptor i.e., first and second signaling moieties
- FITC flu
- nonorganic fluorescent labels are known in the art and are commercially available from, for example, Quantum Dot Corporation, Inc. Hayward Calif.). These include, e.g., donor/acceptor (i.e., first and second signaling moieties) semiconductor nanocrystals (i.e., ‘quantum dots’) whose absorption and emission spectra can be precisely controlled through the selection of nanoparticle material, size, and composition (see, for example, Bruchez et al., 1998, Chan and Nie, 1998, Han et al., 2001).
- DABYL P-(dimethyl aminophenylazo) benzoic acid
- EDANS 5-(2′-aminoethyl) aminonaphthalene
- FIGS. 3A and B and 6 A and B show exemplary optical nucleic acid sensor molecules derived from catalytic nucleic acid molecules ( FIGS. 2A and B and 5 , respectively), according to two embodiments.
- FIG. 3 shows a catalytic nucleic acid sensor molecule obtained from an oligonucleotide pool in which the catalytic site was a ligase site.
- FIG. 6 shows a catalytic nucleic acid sensor molecule obtained from an oligonucleotide pool in which the catalytic site was a site mediating self-cleavage.
- a catalytic nucleic acid sensor molecule from which a portion of a ligase site (e.g., the AGUCG sequence at the 3′ end of the nucleic acid sensor precursor molecule, as shown in FIG. 2 ) has been removed is coupled to a first signaling moiety (F) at a first nucleotide (1) and to a second signaling moiety (D) at a second nucleotide (2).
- the first and second signaling moieties molecules are attached to non-terminal sequences.
- the position of the non-terminal sequences coupled to signaling moieties is limited to a maximal distance from the 5′ or 3′ nucleotide which still permits proximity dependent changes in the optical properties of the molecule.
- Coupling chemistries are routinely practiced in the art, and oligonucleotide synthesis services provided commercially (e.g., Integrated DNA Technologies, Coralville, Iowa) can also be used to generate labeled molecules.
- the nucleic acid sensor molecule is used, either tethered to a solid support or free in solution, to detect the presence and concentration of target molecules in a complex biological fluid.
- the first signaling moiety (F) is a fluorescein molecule coupled to the 5′ end and the second signaling molecule (D) is a DABCYL molecule (a quenching group) coupled to the 3′ end. Because of the nearly complete base pairing of the non-target molecule activated form (see FIG. 3B ), this is the favored form of the nucleic acid sensor molecule in the absence of the target molecule. When the nucleic acid sensor molecule is not activated by target molecule, the fluorescent group and the quenching group are in close proximity and little fluorescence is detectable from the fluorescent group. Addition of target molecule causes a change in the conformation of the optical nucleic acid sensor molecule shown in FIG.
- the first and second signaling moieties (F and D, respectively) are no longer in sufficient proximity for the quenching group to quench the fluorescence of the fluorescent group, resulting in a detectable fluorescent signal being produced upon recognition of the target molecule.
- the target modulation domain sequence from a previously identified nucleic acid sensor molecule is incorporated into a separate oligonucleotide sequence which changes conformation upon target recognition as shown in FIGS. 6A and B.
- an optical signal generating unit is either added or inserted into the oligonucleotide sequence comprising. the derived nucleic acid sensor molecule.
- nucleic acid sensor molecules of this type can be derived from allosteric ribozymes, such as those derived from the hammerhead, hairpin, L1 ligase, or group 1 intron ribozymes and the like (see Soukup et al., 2001, or Hamaguchi et al., 2001), all of which transduce molecular recognition into a detectable optical signal.
- allosteric ribozymes such as those derived from the hammerhead, hairpin, L1 ligase, or group 1 intron ribozymes and the like (see Soukup et al., 2001, or Hamaguchi et al., 2001), all of which transduce molecular recognition into a detectable optical signal.
- a self-cleaving ribozyme such as the hammerhead (in this case attached to a solid support via a linker molecule is shown) is labeled with a fluorphore.
- the labeled NASM in the unactivated state comprises two oligonucleotide including a transacting cleavage substrate which bears a second fluorescent label.
- the donor fluorophore on one oligonucleotide NASM
- the acceptor fluorophore on the cleavage substrate
- the donor fluorophore on one oligonucleotide NASM
- the acceptor fluorophore on the cleavage substrate
- minimal fluorescent emission is detected from the donor fluorophore at wavelength 3, ⁇ 3, upon epi-illumination excitation at wavelength 1, ⁇ 1.
- the cleavage fragment of the cleavage substrate bearing the acceptor fluorophore dissociates from the ribozyme-target complex.
- the donor fluorophore can no longer undergo de-excitation via FRET, resulting in a detectable increase in its fluorescent emission at wavelength 2, ⁇ 2 (see, for example, Singh. et al., 1999; Wu, and Brand, 1994; Walter and Burke, 1997; Walter et al., 1998).
- the change in the polarization state of the fluorescent emission from the donor fluorophore can be detected/monitored in addition to changes in fluorescent emission intensity (see, for Singh, 2000).
- the NASMs are free in solution.
- the acceptor fluorophore attached to the cleavage substrate is replaced by a quencher group.
- This replacement will also result in minimal fluorescent donor emission at wavelength 2, ⁇ 2, when the NASM is in the unbound state under epi-illumination excitation at wavelength 1, ⁇ 1.
- the cleavage fragments of the cleavage substrate bearing the donor and quencher groups dissociate from the NASM-target molecule complex.
- the donor fluorophore Once separated from the quencher, the donor fluorophore will exhibit a detectable increase in its fluorescent emission at wavelength 2, ⁇ 2.
- the change in the polarization state of the fluorescent emission from the donor fluorophore (due to the increased diffusional rotation rate of the smaller cleavage fragment) can be detected/monitored in addition to changes in fluorescent emission intensity.
- NASMs are free in solution.
- the optical configuration is designed to provide excitation via total internal reflection (TIR)-illumination, as shown in FIG. 9C .
- the donor fluorophore is attached to the NASM body while the quencher is attached to the cleavage substrate.
- the fluorescent donor emission at wavelength 2, ⁇ 2 will be minimal.
- the cleavage fragment of the cleavage substrate bearing the quencher group dissociates from the NASM-target module complex.
- the donor fluorophore Once separated from the quencher, the donor fluorophore will exhibit a detectable increase in its fluorescent emission at wavelength 2, ⁇ 2.
- TIR total internal reflection
- the quencher group can be replaced with an acceptor fluorophore.
- the donor fluorophore is coupled to the cleavage fragment of the cleavage substrate and the acceptor fluorophore or quencher group is deleted.
- the polarization state of the fluorescent emission from the donor fluorophore will undergo a detectable change due to the difference in the diffusional rotation rates of the surface-bound ribozyme-target complex and the free cleavage fragment.
- a universal FRET trans-substrate is synthesized for all NASMs derived from self-cleaving allosteric ribozymes.
- This substrate would have complementary optical signaling units (i.e., donor and acceptor groups) coupled to opposite ends of the synthetic oligonucleotide sequence.
- complementary optical signaling units i.e., donor and acceptor groups
- Such a universal substrate would obviate the need for coupling optical signaling units to the sensor (i.e., ribozyme) molecule itself.
- the relative stabilities of the activated and unactivated forms of the nucleic acid sensor molecules is optimized to achieve the highest sensitivity of detection of target molecule.
- the nucleic acid sensor molecule is further engineered to enhance the stability of one form over another.
- the boxed UA in FIGS. 3A and B is changed to a CC, favoring the formation of the target molecule activated form. Because these bases do not form base pairs when the nucleic acid sensor molecule is unactiaved, the unactivated form is not stabilized.
- any additional proximity dependent signaling system known in the art can be used to practice the method according to the invention, and are encompassed within the scope.
- the free energy of the structures formed by the nucleic acid sensor molecule is determined using software programs such as mfold®, which can be found on, the Rensselaer Polytechnic Institute (RPI) web site (www.rpi.edu/dept.).
- RPI Rensselaer Polytechnic Institute
- a gel assay is performed which permits detection of different conformations of the nucleic acid sensor molecule.
- the nucleic acid sensor molecule is allowed to come to equilibrium at room temperature or the temperature at which the nucleic acid sensor molecule will be used. The molecule is then cooled to 4° C. and electrophoresed on a native (non-denaturing) gel at 4° C. Each of the conformations formed by the nucleic acid sensor molecule will run at a different position on the gel, allowing visualization of the relative concentration of each conformation.
- the conformation of nucleic acid sensor molecules which form in the presence of target molecule is then determined by a method such as circular dichroism (CD).
- CD circular dichroism
- the conformation which corresponds to the activated conformation can be identified in a sample in which there is no target molecule.
- the nucleic acid sensor molecule can then be engineered to minimize the formation of the activated conformation in the absence of target molecule.
- the sensitivity and specificity of nucleic acid sensor molecule can be further tested using target molecule modulation assays with known amounts of target molecules.
- a catalytical nucleic acid sensor molecule from which a portion of a self-cleaving site has been removed is coupled to a first signaling moiety (F) at a first nucleotide and to a second signaling moiety,(D) at a second nucleotide.
- F first signaling moiety
- D second signaling moiety
- the entire catalytic site of the catalytic nucleic acid molecule has been removed.
- additional bases e.g., UGGUAU
- These bases are selected to be complementary to bases at the opposite end of the nucleic acid sensor molecule (ACCAUA). Additional bases may be added to either the 5′ or the 3′ end of the nucleic acid sensor molecule.
- Modifications to stabilize one conformation of the nucleic sensor molecule over another may be identified using the mfold program or native gel assays discussed above.
- a labeled nucleic acid sensor molecule is generated by coupling a first signaling moiety (F) to a first nucleotide and a second signaling moiety (D) to a second nucleotide as discussed above.
- F first signaling moiety
- D second signaling moiety
- the sensitivity and specificity of the nucleic acid sensor molecule can be further assayed by using target molecule modulation assays with known amounts of target molecules.
- the optical nucleic acid sensor molecule comprises an optical signaling unit with a single signaling moiety introduced at either an internal or terminal position within the nucleic acid sensor molecule.
- binding of the target molecule results in changes in both the conformation and physical aspect (e.g., molecular volume or mass, rotational diffuision rate, etc.) of the nucleic acid sensor molecule.
- Conformational changes in the nucleic acid sensor molecule upon target recognition will modify the chemical environment of the signaling moiety. Such a change in chemical environment will in general change the optical properties of the signaling moiety.
- Suitable signaling moieties are described in Jhaveri, et al, 2000, and include, e.g., fluorescein, acridine, and other organic and nonorganic fluorophores.
- a signaling moiety is introduced at a position in the catalytic nucleic acid molecule near the target activation site (identifiable by footprinting studies, for example). Binding of the target molecule will (via a change in conformation of the nucleic acid molecule) alter the chemical environment and thus affect the optical properties of the signaling moiety in a detectable manner.
- Recognition of the target molecule by the NASM will result in changes in the conformation and physical aspect of the nucleic acid sensor molecule, and will thus alter the kinetic properties of the signaling moiety.
- the changes in conformation and mass of the sensor-target complex will reduce the rotational diffusion rate for the sensor-target complex, resulting in a detectable change in the observed steady state fluorescence polarization (FP) from the signaling moiety.
- FP steady state fluorescence polarization
- the expected change in FP signal with target concentration can be derived using a modified form of the well-known Michaelis-Menten model for ligand binding kinetics (Lakowicz, 1999).
- FP is therefore a highly sensitive means of detecting and quantitatively determining the concentration of target molecules in a sample solution (Jameson and Sawyer, 1995; Jameson and Seifried, 1999; Jolley, 1999; Singh, 2000; Owicki et al., 1997). FP methods are capable of functioning in both solution- and solid-phase implementations.
- an unlabeled ligating ribozyme such as the lysozyme-dependent L1 ligase is shown (see, for example, Robertson, M. P. and Ellington, A. D, 2000).
- TIR total internal reflection
- oligonucleotide substrates hybridized to NASMs Upon recognition of target molecules in the presence of an oligonucleotide substrate with a tag (where the tag is capable of binding to a subsequently added fluorescent label via interactions including, but not limited to, biotin/streptavidin, amine/aldehyde, hydrazide, thiol, or other reactive groups) those oligonucleotide substrates hybridized to NASMs will undergo ligation and become covalently bonded to the thereto.
- tag where the tag is capable of binding to a subsequently added fluorescent label via interactions including, but not limited to, biotin/streptavidin, amine/aldehyde, hydrazide, thiol, or other reactive groups
- oligonucleotide substrate can be added in excess relative to NASM, the temperature of the ambient solution in which the reaction takes place can be kept below room temperature (e.g., 4° C.), and agitation of the reaction vessel can be employed to overcome the kinetic limitation of diffusion-limited transport of species in solution.
- room temperature e.g. 4° C.
- agitation of the reaction vessel can be employed to overcome the kinetic limitation of diffusion-limited transport of species in solution.
- fluorescent label with the appropriate reactive group to bind the substrate tag is added to the reaction mixture. Again, the degree of substrate-label binding can be maximized through control of label concentration, solution temperature, and agitation.
- the solution temperature can be raised to drive off all of the hybridized but unligated substrate.
- the spatial extent of the excitation region above the solid substrate surface to which the ribozymes are bound is only on the order of 100 nm. Therefore, the bulk solution above the substrate surface is not illuminated and the detected fluorescent emission will be primarily due to fluorophores which are bound to ligated oligonucleotide substrate-NASM- target molecule complexes tethered to the substrate surface.
- the fluorescence emission from surface-bound NASM-target molecule complexes in this homogeneous solid phase assay format represents an easily detectable optical signal.
- the fluorescence polarization (FP) of the labeled substrate can be monitored, as shown in FIG. 10C .
- the steady state fluorescence polarization signal from the substrate-NASM complex will increase detectably relative to the FP signal from the free labeled oligonucleotide substrate in solution, due to the difference in the diffusional rotation rates between the free and ligated forms.
- an unlabeled ligating ribozyme such as the lysozyme-dependent Li ligase (see, for example, Robertson, M. P. and Ellington, A. D, 2000) is bound to a solid surface.
- the oligonucleotide substrate is coupled to an enzyme-linked luminescent moiety, such as horse radish peroxidase (HRP) by a tag (where the tag is capable of binding to a subsequently added label via interactions including, but not limited to, biotin/streptavidin, amine/aldehyde, hydrazide, thiol, or other reactive groups).
- HRP horse radish peroxidase
- the activated solution can be precipitated, followed by calorimetric detection.
- the enzyme linked signal amplification, TSA (sometimes referred to as CARD-catalyzed reporter deposition) is an ultrasensitive detection method.
- the technology uses turnover of multiple tyramide substrates per horseradish peroxidase (HRP) enzyme to generate high-density labeling of a target protein or nucleic acid probe in situ.
- Tyramide signal amplification is a combination of three elementary processes: (1) Ligation (or not) of a biotinylated ligase oligonucleotide substrate oligo, followed by binding (or not) of a streptavidin-HRP to the probe; (2) HRP-mediated conversion of multiple copies of a fluorescent tyramide derivative to a highly reactive radical; (3) Covalent binding of the reactive, short lived tyramide radicals to nearby nucleophilic residues, greatly reducing diffusion-related signal loss.
- Optical nucleic acid sensor molecules for the detection of a target molecule of interest are generated by first selecting catalytic nucleic acid molecules with catalytic activity modifiable (e.g., activatable) by a selected target molecule. In one embodiment, at least a portion of the catalytic site of the catalytic NASM is then removed and an optical signal generating unit is either added or inserted. Recognition of the target molecule by the nucleic acid sensor molecule activates a change in the properties of the optical signaling unit.
- catalytic activity modifiable e.g., activatable
- a biosensor which comprises a plurality of optical nucleic acid sensor molecules labeled with first and second signaling moieties specific for a target molecule.
- the optical NASMs are labeled with a single signaling moiety.
- the labeled nucleic acid sensor molecules are provided in a solution (e.g., a buffer).
- the labeled nucleic acid sensor molecules are attached directly or indirectly (e.g., through a linker molecule) to a substrate.
- nucleic acid sensor molecules can be synthesized directly onto the substrate.
- Suitable substrates which are encompassed within the scope include, e.g., glass or quartz, silicon, encapsulated or unencapsulated semiconductor nanocrystal materials (e.g., CdSe), nitrocellulose, nylon, plastic, and other polymers.
- Substrates may assume a variety of configurations (e.g., planar, slide shaped, wafers, chips, tubular, disc-like, beads, containers, or plates, such as microtiter plates, and other shapes).
- RNA attachment chemistries can be used to: immobilize the sensor molecules on a solid support. These include, e.g., amine/aldehyde, biotin/streptavidin (avidin, neutravidin), ADH/oxidized 3′ RNA.
- the nucleic acid sensor molecules ligate a substrate in the presence of a target molecule (see FIGS. 2A and B).
- the ribozymes are bound to a solid substrate via the effector oligonucleotide sequence (for example, GCGACTGGACATCACGAG (SEQ ID NO:51) in FIG. 2A ).
- a manual or computer-controlled robotic microarrayer is used to generate arrays of nucleic acid sensor molecules immobilized on a solid substrate.
- the arrayer utilizes contact-printing technology (i.e., it utilizes printing pins of metal, glass, etc., with or without quill-slots or other modifications).
- the arrayer utilizes non-contact printing technology (i.e., it utilizes ink jet or capillary-based technologies, or other means of dispensing a solution containing the material to be arrayed).
- Robotic and manual arrayers are commercially available for example, the SpotArray from Packard Biosciences, Meriden, Conn., and the RA-1 from GenomicSolutions, Ann Arbor, Mich.).
- larger substrates can be generated by combining a plurality of smaller biosensors forming an array of biosensors.
- nucleic acid sensor molecules placed on the substrate are addressed (e.g., by specific linker or effector oligonucleotide sequences on the nucleic acid sensor molecule) and information relating to the location of each nucleic acid sensor molecule and its target molecule specificity is stored within a processor.
- This technique is known as spatial addressing or spatial multiplexing. Techniques for addressing nucleic acids on substrates are known in the art and are described in, for example, U.S. Pat. No. 6,060,252, U.S. Pat. No. 6,051,380, U.S. Pat. No. 5,763,263, U.S. Pat. No. 5,763,175, and U.S. Pat. No. 5,741,462.
- nucleic acid sensor molecules are immobilized on a streptavidin-derivatized glass substrate via biotin linkers.
- the individual sensor spots can be manually arrayed.
- Solution measurements of target molecule concentration can be made by bathing the surface of the biosensor array in a solution containing the targets (analytes) of interest. In practice this is accomplished either by incorporating the array within a microflowcell (with a flow rate of ⁇ 25 microliters/min), or by placing a small volume ( ⁇ 6–10 microliters) of the target solution on the array surface and covering it with a cover slip.
- Detection and quantification of target concentration is accomplished by monitoring changes in the fluorescence polarization (FP) signal emitted from the fluorescein label under illumination by 488 nm laser radiation.
- the rotational diffusion rate is inversely proportional to the molecular volume; thus the rotational correlation time for the roughly 20-nucleotide unbound sensor (i.e., in the absence of target molecule) will be significantly less than that for the target-NASM complex.
- the fluorescence emission from the target-NASM complex will therefore experience greater residual polarization due to the smaller angle through which the emission dipole axis of the sensor fluorophore can rotate within its radiative lifetime.
- different surface attachment chemistries are used to immobilize the NASMs on a solid substrate. As previously noted, these include, e.g., interactions involving biotin/streptavidin, amine/aldehyde, hydrazide, thiol, or other reactive groups.
- the specificity of the biosensors and NASMs according to the invention is determined by the specificity of the target modulation domain of the nucleic acid sensor molecule.
- a biosensor is provided in which all of the nucleic acid sensor molecules recognize the same molecule.
- a biosensor is provided which can recognize at least two different target molecules allowing for multi-analyte detection. Multiple analytes can be distinguished by using different combinations of first and second signaling molecules.
- biosensors may be used to detect multiple analytes using intensity multiplexing. This is accomplished by varying the number of fluorescent label molecules on each biosensor in a controlled fashion.
- multiple single target biosensors can be combined to form a multianalyte detection system which is either solution-based or substrate-based according to the needs of the user.
- individual biosensors can be later removed from the system, if the user desires to return to a single analyte detection system (e.g., using target molecules bound to supports, or, for example, manually removing a selected biosensor(s) in the case of substrate-based biosensors).
- nucleic acid sensor molecules binding to multiple analytes are distinguished from each other by referring to the address of the nucleic acid sensor molecule on a substrate and correlating its location with the appropriate target molecule to which it binds (previously described as spatial addressing or multiplexing).
- subsections of a biosensor array can be individually subjected to separate analyte solutions by use of substrate partitions or enclosures that prevent fluid flow between subarrays, and microfluidic pathways and injectors to introduce the different analyte solutions to the appropriate sensor subarray.
- a nucleic acid sensor molecule or biosensor system comprising a nucleic acid sensor molecule in communication with a detector system.
- a processor is provided to process optical signals detected by the detector system.
- the processor is connectable to a server which is also connectable to other processors.
- optical data obtained at a site where the NASM or biosensor system resides can be transmitted through the server and data is obtained, and a report displayed on the display of the off-site processor within seconds of the transmission of the optical data.
- data from patients is stored in a database which can be accessed by a user of the system.
- Data obtainable from the biosensors according to the invention include diagnostic data, data relating to lead compound development, and nucleic acid sensor molecule modeling data (e.g., information correlating the sequence of individual sensor molecules with specificity for a particular target molecule).
- these data are stored in a computer database.
- the database includes, along with diagnostic data obtained from a sample by the biosensor, information relating to a particular patient, such as medical history and billing information.
- the database is part of the nucleic acid sensor molecule system, the database can be used separately with other detection assay methods and drug development methods.
- Detectors used with the nucleic acid sensor molecule systems according to the invention can vary, and include any suitable detectors for detecting optical changes in nucleic acid molecules. These include, e.g., photomultiplier tubes (PMTs), charge coupled devices (CCDs), intensified CCDs, and avalanche photodiodes (APDs).
- PMTs photomultiplier tubes
- CCDs charge coupled devices
- APDs avalanche photodiodes
- a nucleic acid sensor molecule comprising labeled nucleic acid sensor molecules is excited by a light source in communication with the biosensor.
- the optical signaling unit comprises first and second signal moieties that are donor/acceptor pairs (i.e., signal generation relies on the fluorescence of a donor molecule when it is removed from the proximity of a quencher acceptor molecule), recognition of a target molecule will cause a large increase in fluorescence emission intensity over a low background signal level.
- the high signal-to-noise ratio permits small signals to be measured using high-gain detectors, such as PMTs or APDs.
- Light sources include, e.g., filtered, wide-spectrum light sources, (e.g., tungsten, or xenon arc), laser light sources, such as gas lasers, solid state crystal lasers, semiconductor diode lasers (including multiple quantum well, distributed feedback, and vertical cavity surface emitting lasers (VCSELs)), dye lasers, metallic vapor lasers, free electron lasers, and lasers using any other substance as a gain medium.
- laser light sources such as gas lasers, solid state crystal lasers, semiconductor diode lasers (including multiple quantum well, distributed feedback, and vertical cavity surface emitting lasers (VCSELs)), dye lasers, metallic vapor lasers, free electron lasers, and lasers using any other substance as a gain medium.
- VCSELs vertical cavity surface emitting lasers
- Common gas lasers include Argon-ion, Krypton-ion, and mixed gas (e.g., Ar–Kr) ion lasers, emitting at 455, 458, 466, 476, 488, 496, 502, 514, and 528 nm (Ar ion); and 406, 413, 415, 468, 476, 482, 520, 531, 568, 647, and 676 nm (Kr ion). Also included in gas lasers are Helium Neon lasers emitting at 543, 594, 612, and 633 mn.
- Ar–Kr mixed gas
- Typical output lines from solid state crystal lasers include 532 nm (doubled Nd:YAG) and 408/816 nm (doubled/primary from Ti:Sapphire).
- Typical output lines from semiconductor diode lasers are 635, 650, 670, and 780 rnm.
- Excitation wavelengths and emission detection wavelengths will vary depending on the signaling moieties used.
- the excitation wavelength is 488 nm and the emission wavelength is 514 mn.
- a single excitation wavelength or broadband UV source may be used to excite several probes with widely spectrally separated emission wavelengths (see Bruchez et al., 1998; Chan et al., 1998).
- detection of changes in the optical properties of the nucleic acid sensor molecules is performed using any of a cooled CCD camera, a cooled intensified CCD camera, a single-photon-counting detector (e.g., PMT or APD), or other light sensitive sensor.
- the detector is optically coupled to the nucleic acid sensor molecule through a lens system, such as in an optical microscope (e.g., a confocal microscope).
- a fiber optic coupler is used, where the input to the optical fiber is placed in close proximity to the substrate surface of a biosensor, either above or below the substrate.
- the optical fiber provides the substrate for the attachment of nucleic acid sensor molecules and the biosensor is an integral part of the optical fiber.
- the interior surface of a glass or plastic capillary tube provides the substrate for the attachment of nucleic acid sensor molecules.
- the capillary can be either circular or rectangular in cross-section, and of any dimension.
- the capillary section containing the biosensors can be integrated into a microfluidic liquid-handling system which can inject different wash, buffer, and analyte-containing solutions through the sensor tube. Spatial encoding of the sensors can be accomplished by patterning them longitudinally along the axis of the tube, as well as radially, around the circumference of the tube interior. Excitation can be accomplished by coupling a laser source (e.g., using a shaped output beam, such as from a VCSEL) into the glass or plastic layer forming the capillary tube.
- a laser source e.g., using a shaped output beam, such as from a VCSEL
- the coupled excitation light will undergo TIR at the interior surface/solution interface of the tube, thus selectively exciting fluorescently labeled biosensors attached to the tube walls, but not the bulk solution.
- detection can be accomplished using a lens-coupled,or proximity-coupled large area segmented (pixelated) detector, such as a CCD.
- a scanning (i.e., longitudinal/axial and azimuthal) microscope objective lens/emission filter combination is used to image the biosensor substrate onto a CCD detector.
- a high resolution CCD detector with an emission filter in front of it is placed in extremely close proximity to the capillary to allow direct imaging of the biosensors.
- highly efficient detection is accomplished using a mirrored tubular cavity that is elliptical in cross-section.
- the sensor tube is placed along one focal axis of the cavity, while a side-window PMT is placed along the other focal axis with an emission filter in front of it. Any light emitted from the biosensor tube in any direction will be collected by the cavity and focused onto the window of the PMT.
- the optical properties of a nucleic acid sensor molecule are analyzed using a spectrometer (e.g., such as a luminescence spectrometer) which is in communication with the biosensor.
- a spectrometer e.g., such as a luminescence spectrometer
- the spectrometer can perform wavelength discrimination for excitation and detection using either monochromators (i.e., diffraction gratings), or wavelength bandpass filters.
- biosensor molecules are excited at absorption maxima appropriate to the signal labeling moieties being used (e.g., acridine at 450 nm, fluorescein at 495 nm) and fluorescence intensity is measured at emission wavelengths appropriate for the labeling moiety used (e.g., acridine at 495 nm; fluorescein at 515 nm).
- absorption maxima appropriate to the signal labeling moieties being used
- fluorescein at 495 nm fluorescein at 495 nm
- fluorescence intensity is measured at emission wavelengths appropriate for the labeling moiety used (e.g., acridine at 495 nm; fluorescein at 515 nm).
- the biosensor molecules are in solution and are pipetted (either manually or robotically) into a cuvette or a well in a microtiter plate within the spectrometer.
- the spectrometer is a multifinction plate reader capable of detecting optical changes in fluorescence or luminescence intensity (at one or more wavelengths), time-resolved fluorescence, fluorescence polarization (FP), absorbance (epi and transmitted), etc., such as the Fusion multifunction plate reader system (Packard Biosciences, Meriden, Conn.).
- Fusion multifunction plate reader system Packard Biosciences, Meriden, Conn.
- Such a system can be used to detect optical changes in biosensors either in solution, bound to the surface of microwells in plates, or immobilized on the surface of solid substrate (e.g., a biosensor microarray on a glass substrate).
- This type of multiplate/multisubstrate detection system coupled with robotic liquid handling and sample manipulation, is particularly amenable to high-throughput, low-volume assay formats.
- nucleic acid sensor molecules are attached to substrates, such as a glass slide or in microarray format
- substrates such as a glass slide or in microarray format
- a small sample volume ⁇ 10 nL
- background light can be minimized by the use of narrow-bandpass wavelength filters between the sample and the detector and by using opaque shielding to remove any ambient light from the measurement system.
- evanescent wave excitation utilizes electromagnetic energy that propagates into the lower-index of refraction medium when an electromagnetic wave is totally internally reflected at the interface between higher and lower-refractive index materials.
- a collimated laser beam is incident on the substrate/solution interface (at which the biosensors are immobilized) at an angle greater than the critical angle for total internal reflection (TIR).
- the substrate is optically coupled (via index-matching fluid) to the upper surface of the prism, such that TIR occurs at the substrate/solution interface on which the biosensors are immobilized.
- excitation can be localized to within a few hundred nanometers of the substrate/solution interface, thus eliminating autofluorescence background from the bulk analyte solution, optics, or substrate.
- Target recognition is detected by a change in the fluorescent emission of the nucleic acid sensor, whether a change in intensity or polarization. Spatial discrimination in the plane of the interface (i.e., laterally) is achieved by the optical system.
- a large area of the biosensor substrate is uniformly illuminated, either via evanescent wave excitation or epi-illumination from above, and the detected signal is spatially encoded through the use of a pixelated detector, such as CCD camera.
- a pixelated detector such as CCD camera.
- An example of this type of uniform illumination/CCD detection system (using epi-illumination)) for the case of microarrayed biosensors on solid substrates is the GeneTAC 2000 scanner (GenomicSolutions, Ann Arbor, Mich.).
- a small area e.g., 10 ⁇ 10 microns to 100 ⁇ 100 microns
- a micro-collimated beam or focused spot is illuminated by a micro-collimated beam or focused spot.
- the excitation spot is rastered in a 2-dimensional scan across the static biosensor substrate surface and the signal detected (with an integrating detector, such as a PMT) at each point correlated with the spatial location of that point on the biosensor substrate (e.g., by the mechanical positioning system responsible for scanning the excitation spot).
- an integrating detector such as a PMT
- Two examples of this type of moving spot detection system for the case of microarrayed biosensors on solid substrates are: the DNAScope scanner (confocal, epi-illumination, GeneFocus, Waterloo, ON, Canada), and the LS IV scanner (non-confocal, epi-illumination, GenomicSolutions, Ann Arbor, Mich.).
- a small area (e.g., 10 ⁇ 10 microns to 100 ⁇ 100 microns) of the biosensor substrate is illuminated by a stationary micro-collimated beam or focused spot, and the biosensor substrate is rastered in a 2-dimensional scan beneath the static excitation spot, with the signal detected (with an integrating detector, such as a PMT) at each point correlated with the spatial location of that point on the biosensor substrate (e.g., by the mechanical positioning system responsible for scanning the substrate).
- an integrating detector such as a PMT
- An example of this type of moving substrate detection (using confocal epi-illumination) system for the case of microarrayed biosensors on solid substrates is the ScanArray 5000 scanner (Packard Biochip, Billerica, Mass.).
- a TIR evanescent wave excitation optical configuration is implemented, with a static substrate and dual-capability detection system.
- the detection system is built on the frame of a Zeiss universal fluorescence microscope.
- the system is equipped with 2 PMTs on one optical port, and an intensified CCD camera (Cooke, St. Louis, Mo.) mounted on the other optical port.
- the optical path utilizes a moveable mirror which can direct the collimated, polarized laser beam through focusing optics to form a spot, or a beam expander to form a large (>1 cm) beam whose central portion is roughly uniform over the field of view of the objective lens.
- Another movable mirror can direct the light either to the intensified CCD camera when using large area uniform illumination, or to the PMTs in the scanned spot mode.
- spot scanning mode a polarizing beamsplitter separates the parallel and perpendicular components of the emitted fluorescence and directs each to its designated PMT.
- An emission filter in the optical column rejects scattered excitation light from either type of detector.
- CCD imaging mode manually adjusted polarizers in the optical column of the microscope must be adjusted to obtain parallel and perpendicular images from which the fluorescence polarization or anisotropy can be calculated.
- a software program interfaces with data acquisition boards in a computer which acquires the digital output data from both PMTs and CCD. This program also controls the PMT power, electromechanical shutters, and galvanometer mirror scanner, calculates and plots fluorescence polarization in real time, and displays FP and intensity images.
- the detection system is a single photon counter system (see, e.g., U.S. Pat. No. 6,016,195 and U.S. Pat. No. 5,866,348) requiring rastering of the sensor substrate to image larger areas and survey the different binding regions on the biosensor.
- the biosensor is used to detect a target molecule through changes in the electrochemical properties of the nucleic acid sensor moleculeor molecules in close proximity to it which occur upon recognition of the NASM to the target molecule.
- the biosensor system would consist of three major components: One, optical nucleic acid sensor molecules immobilized on an array of independently addressable gold electrodes.
- the nucleic acid sensor molecules immobilized on each electrode may be modulated by the same or different target molecules, including proteins, metabolites and other small molecules, etc.; two, an oligonucleotide substrate which acts as a signaling probe, hybridizing to the oligonucleotide substrate binding domain of the ligase sensor and forming a covalent phosphodiester bond with the nucleic acid sensor molecule nucleotide adjacent to its 3′ terminus in the presence of the appropriate target.
- This oligonucleotide substrate is typically a nucleic acid sequence containing one or more modified nucleotides conjugated to redox active metallic complexes, e.g., ferrocene moieties, which can act as electron donors; and three, an immobilized mixed self-assembled surface monolayer (SAM), comprised of conductive species separated by insulating species, covering the surface of the electrodes.
- SAM mixed self-assembled surface monolayer
- conductive species include thiol-terminated linear molecules, such as oligophenylethyl molecules, while examples of nonconductive thiol-terminated linear molecules, include alkane-thiol molecules terminated with polyethylene glycol (PEG). All immobilized species can be covalently attached to the electrode surface by terminal thiol groups.
- FIG. 15 schematically shows the structure of the mixed self-assembled surface monolayer (SAM) coating the gold electrode, as well as the immobilized nucleic acid sensor molecule (NASM) with a ligated oligonucleotide substrate conjugated to several redox active moieties.
- SAM mixed self-assembled surface monolayer
- NAM immobilized nucleic acid sensor molecule
- the biosensor system would consist of two major components: (1) Optical nucleic acid sensor molecules immobilized on an array of independent addressable gold electrodes.
- the nucleic acid sensor molecules immobilized on each electrode may be modulated by the same or different target molecules, including proteins, metabolites and other small molecules, etc.
- the NASM will contain one or more nucleotides conjugated to redox active metallic complexes, e.g., ferrocene moieties, which can act as electron donors; and (2) an immobilized mixed self-assembled surface monolayer (SAM), comprised of conductive species separated by insulating species, covering the surface of the electrodes.
- SAM mixed self-assembled surface monolayer
- Examples of conductive species include thiol-terminated linear molecules, such as oligophenylehtynyl molecules, while examples of nonconductive thiol-terminated linear molecules include alkane-thiol molecules terminated with polyethylene glycol (PEG).
- FIG. 16 shows the SAM-coated molecule immobilized via a capture oligonucleotide. In this case, the redox active signaling moieties are coupled to the body of the NASM, as shown in the figure.
- the bulk of the NASM including the nucleotides coupled to the redox active signaling moieties will dissociate from the surface, resulting in a detectable loss of electronic current signal.
- the array would be subjected, e.g., by an integrated microfluidic flowcell, to an analyte solution containing the target(s) of interest at some unknown concentration.
- the range of possible sample analyte solutions may include standard buffers, biological fluids, and cell or tissue extracts.
- the sample solution will also contain the signaling probe at a saturating concentration relative to the immobilized nucleic acid sensor molecule. This ensures that at any given time during analysis, there is a high probability that each nucleic acid sensor molecule will have a signaling probe hybridized to it.
- the nucleic acid sensor molecule In the presence of the target molecules in the sample solution, the nucleic acid sensor molecule will form a covalent phosphodiester bond, i.e., ligate, with the signaling probe, thus immobilizing it with its redox active electron donor species in electrical contact with the conductive molecules within the mixed self-assembled surface monolayer.
- ligate covalent phosphodiester bond
- This denaturation step which effectively removes ‘background’ signaling probes and their associated redox moieties from the vicinity of the electrode, can be accomplished by a small temperature increase (e.g., from 21° C.
- the net electron transfer to or from the electrode will be measured as a peak in the faradaic current, centered at the redox potential of the electron donor species (specified for a given reference electrode) and superposed on top of the capacitive current baseline which is observed in the absence of surface-immobilized signaling probes. This is shown schematically in FIG. 18 .
- Quantitative analysis of the sensor signal is based on the fact that the measured faradaic peak height is directly proportional to number of redox moieties immobilized at the electrode, that is, the number of nucleic acid sensor molecules ligated to signaling probes times the multiplicity of redox moieties per signaling probe molecule. Signal generation by the nucleic acid sensor molecules is thus amplified by virtue of multiple redox species per signaling probe.
- nucleic acid sensor molecules which ligates a signaling probe containing one or more modified nucleotides conjugated to redox active species suggests a general method and instrumentation for the detection and quantitation of an arbitrary target molecule in solution in real time. Detection of a particular target would require development of a nucleic acid sensor molecule against that recognizes the target molecule. Additionally, nucleic acid sensor molecules have been developed which are activated only in the presence of two different target molecules. Such dual-effector sensors could be used to detect the simultaneous presence of two or more targets, or could be used in conjunction with single-target molecule sensors to form biological logic (i.e., AND, OR, etc.) circuits.
- biological logic i.e., AND, OR, etc.
- nucleic acid sensor molecule array Multiplexed detection of multiple target molecules simultaneously in a complex sample solution could be accomplished by immobilizing nucleic acid sensor molecules against the target molecules of interest on separate electrodes within a two-dimensional array of electrodes. A complex sample solution containing multiple target molecules and a common signaling probe could then be introduced to the array. All nucleic acid sensor molecules would be exposed simultaneously to all targets, with the target-activated nucleic acid sensor molecule response(s) being observed and recorded only at the spatial location(s) known to contain a nucleic acid sensor molecule specific for the target molecules present in the (unknown) sample. The utility of such a nucleic acid sensor molecule array would be greatly enhanced by the integration of a microfluidic sample and reagent delivery system. Such an integrated microfluidic system would allow the application of reagents and samples to the sensor array to be automated, and would allow the reduction of sample volume required for analysis to ⁇ 1 uL.
- the sensor array electrodes may be of any configuration, number, and size.
- the sensor and reference electrodes would be circular gold pads on the order of 100–500 uM in diameter, separated by a center-to center distance equal to twice their diameter. Each electrode would be addressed by separate electrical interconnects.
- the application of electrical signals to the sensor electrodes can be accomplished using standard commercially available AC and DC voltage sources. Detection of faradaic electrical signals from the sensor electrodes can be accomplished easily using standard commercially available data acquisition boards mounted within and controlled by a microcomputer. Specifically, the raw sensor current signals would need to be amplified, and then converted to a voltage and analyzed via a high resolution (i.e., 16 bit) analog to digital converter (ADC).
- ADC analog to digital converter
- an alternating current (AC) bias voltage (at a frequency between, for example, 100 to 1000 Hz) is superposed on top of the DC linear voltage ramp applied to the sensor electrodes.
- the frequency of the applied bias voltage is called the fundamental frequency.
- the sensor response signal contains multiple frequency components, including the fundamental frequency and its harmonics (integral multiples of the fundamental frequency).
- the nth harmonic signal is proportional to the nth derivative of the signal.
- Detecting these derivative signals minimizes the effects of constant or sloping backgrounds, and can enhance sensitivity by increasing the signal to noise ratio and allowing the separation of closely spaced signal peaks.
- digital, computer-controlled AC and DC voltage sources i.e., digital to analog converters, DACs
- current preamplifiers i.e., analog to digital converters (ADCs)
- ADCs analog to digital converters
- lock-in amplifiers are all available as integrated signal generation/acquisition boards that can be mounted within and controlled by a single microcomputer.
- an integrated nucleic acid sensor molecule system with electrochemical detection would include the following elements one, a independently addressable multielement electrode array with immobilized surface layer composed of conductive species separated by insulating species and sensors; two, optical nucleic acid sensor molecules immobilized on the electrode array; three, an oligonucleotide substrate/signaling probe which ligates with the nucleic acid sensor molecule in the presence of the appropriate target; four, an automated or semi-automated microfluidic reagent and sample delivery system; and five, a reader instrument/data acquisition system consisting of a microcomputer controlling the appropriate voltage sources, current and lock-in amplifiers, data acquisition boards, and software interface for instrument control and data collection.
- the change in activity of the nucleic acid sensor molecule can be detected by watching the change in fluorescence of a nucleic acid sensor molecule when it is immobilized on a chip.
- a ligase can be attached to a chip and its ligase activity monitored.
- Ligase ERK nucleic acid sensor molecules, labeled with one fluorophore, e.g., Cy3 is attached via an amino modification to an aldehyde chip.
- the initial Cy3 fluorescence indicates the efficiency of immobilization of the nucleic acid sensor molecules.
- the chip is exposed to a substrate labeled with a second fluorophore, e.g., Cy5, with or without the ERK protein target.
- a second fluorophore e.g., Cy5
- the nucleic acid sensor molecule ligates the substrate to itself, and becomes Cy5-labeled. Without ERK, the ligation does not occur.
- an effector oligonucleotide is used to attach the nucleic acid sensor molecule to the chip. Whether one uses effector oligonucleotide or not, the TaqMan (real-time PCR)traces obtained in the presence or absence of target (ERK) for ERK dependent ligases are identical. The presence or absence of this effector oligonucleotide does not affect the activity of the nucleic acid sensor molecule.
- a hammerhead nucleic acid sensor molecule could be used to measure the concentration of an analyte through the use of fluorescence.
- FIG. 82 shows how many nucleic acid sensor molecules with different effector molecules and/or analytes could be integrated onto one chip to study the concentration of many molecules at once.
- any optical method known in the art in addition to those described above can be used in the detection and/or quantification of all targets of interest in all sensor formats, in both biological and nonbiological media.
- targets include, e.g., those listed in Table 1, below.
- any other detection method can also be used in the detection and/or quantification of targets.
- radioactive labels could be used, including 32 P, 33 P, 14 C, 3 H, or 125 I.
- enzymatic labels can be used including horse radish peroxidase or alkaline phosphatase.
- the detection method could also involve the use of a capture tag for the bound nucleic acid sensor molecule.
- the nucleic acid sensor molecules according to the invention can be used to detect virtually any target molecule.
- the target molecule is a target molecule associated with a pathological condition and detection of changes in the optical properties of the nucleic acid sensor molecules of the biosensor provides a means of diagnosing the condition.
- Target molecules which are contemplated within the scope include, e.g. proteins, modified forms of proteins, metabolites, organic molecules, and metal ions, as discussed above. Because signal generation in this system is reversible, washing of the biosensor(s) in a suitable buffer will allow the biosensor(s) to be used multiple times, enhancing the reproducibility of the any diagnostic assay since the same reagents can be used over and over.
- Suitable wash buffers include, e.g., binding buffer without target or, for faster washing, a high salt buffer or other denaturing conditions, followed by re-equilibration with binding buffer.
- Re-use of the biosensor is enhanced by selecting optimal fluorophores.
- Alexa Fluor 488 produced by Molecular Probes, has similar optical characteristics compared to fluorescein, but has a much longer lifetime.
- a site recognized by a nuclease is engineered proximal to the signal generating site, and sequences comprising signaling moieties are removed from the biosensor and replaced by new sequences, as needed.
- the expression pattern of a plurality of target molecules is determined to obtain a profile of target molecules associated with a trait in an individual to determine an expression pattern which is diagnostic of that trait.
- combinations of biosensors targeted to individual target molecules are selected until a signature optical profile is determined which is characteristic of a trait.
- Traits include, e.g., a disease, a genetic alteration, a combination of genetic alterations (e.g., a polygenic disorder), a physiological reaction to an environmental condition, or a wild type state (e.g., of an organism or of an organ system).
- the target molecules which generate the signature optical profile are identified (based on the type of biosensors used) as signature target molecules.
- the expression of the signature target molecules can thereafter be determined to identify the presence of the trait in a patient.
- the expression of the target molecules can be identified using any molecular detection system known in the art; however, in a preferred embodiment, the detection system comprises optical nucleic acid sensor molecules and the trait is identified by detecting the signature optical profile.
- data relating to the signature optical profile is stored in the memory of a computer.
- Signature optical profiles can be generated for individual patients or can be generated for populations of individuals.
- data relating to a composite signature profile (e.g., comprising normalized data) is stored in the memory of a computer or in a computer program product.
- biosensors according to the invention can be generated which are diagnostic of diseases/traits whose biological basis is not yet known or are the result of complex polygenic interactions and/or of environmental influences.
- nucleic acid sensor molecules are identified which are activatable by synthetic polypeptides obtained from putative open reading frames identified in the human genome project and/or in other sequencing efforts. Combinations of these activatable nucleic acid sensor molecules (along with activatable nucleic acid sensor molecules specific for target molecules with known functions) are identified which generate a diagnostic optical signal, and signature target molecules are in turn identified which are linked to a particular trait, allowing a biological-activity to be associated with a previously uncharacterized molecule.
- Data relating to signature target molecules or to the optical signals generated upon activation of nucleic acid sensor molecules upon binding to signature target molecules is stored in a database, which can include further information such as sequence information or chemical structure information relating to the signature target molecule.
- a signature profile relating to a particular trait is generated based on normalized data from a plurality of tests.
- a signature profile is obtained by determining any or all of the level, chemical structure, or activity, of signature target molecules associated with a disease in samples from a population of healthy individuals to determine a signature profile corresponding to a healthy state.
- signature profiles are obtained using data from subsets of populations which are divided into groups based on sex, age, exposure to environmental factors, ethnic background, and family history of a disease.
- methods of drug discovery comprise steps of 1) identifying target(s) molecules associated with a disease; 2) validating target molecules (e.g., mimicking the disease in an animal or cellular model); 3) developing assays to identify lead compounds which affect that target (e.g., such as using libraries to assay the ability of a compound to bind to the target); 4) prioritizing and modifying lead compounds identified through biochemical and cellular testing; 5) testing in animal models; and 6) testing in humans (clinical trials).
- step 3 Through the power of genomics and combinatorial chemistry, large numbers of lead compounds can be identified in high throughput assays (step 3); however, a bottleneck occurs at step 4 because of the lack of efficient ways to prioritize and optimize lead compounds and to identify those which actually offer potential for clinical trials.
- the target activatable nucleic acid sensor molecules according to the present invention offer a way to solve this problem by providing reagents which can be used at each step of the drug development process. Most importantly, the target activatable nucleic acid sensor molecules according to the present invention offer a way to correlate biochemical data, from in vitro biochemistry and cellular assays, with the effect of a drug on physiological response from a biological assay.
- a method for identifying a drug compound comprising identifying a profile of target molecules associated with a disease trait in a patient, administering a candidate compound to the patient, and monitoring changes in the profile.
- the monitored profile is compared with a profile of a healthy patient or population of healthy patients, and a compound which generates a profile which is substantially similar to the profile of target molecules in the healthy patient(s) (based on routine statistical testing) is identified as a drug.
- both the profiling and the drug identification step is performed using at least one nucleic acid sensor molecule whose properties change upon binding to a target molecule.
- a method for identifying a drug compound comprises identifying a plurality of pathway target molecules, each belonging to a pathway, monitoring the level, chemical structure, and/or activity of pathway target molecules in a patient having a disease trait, administering a candidate compound to the patient, and monitoring changes in the level, chemical structure, and/or activity of the pathway target molecules.
- the monitored level, chemical structure, and/or activity of the pathway target molecules is compared to the level, chemical structure, and/or activity of pathway target molecules in a wild type patient or patients.
- both profiling and the identification of drug compounds is performed using at least one nucleic acid sensor molecule whose properties change upon binding to a pathway target molecule.
- Sensor molecules are target activated optical nucleic acid sensor molecules.
- biosensors activatable by signature target molecules are provided and are validated by testing against multiple patient samples in vitro to verify that the optical signal generated by these molecules is diagnostic of a particular disease.
- Validation can also be performed ex vivo, e.g., in cell culture, (using microscope-based detection systems and other optical systems as described in U.S. Pat. No. 5,843,658, U.S. Pat. No. 5,776,782, U.S. Pat. No. 5,648,269, and U.S. Pat. No. 5,585,245) and/or in vivo, for example, by providing a profile biosensor in communication with an optical fiber.
- nucleic-acid based biosensors are introduced into the body by any suitable medical access device, such as an endoscope or a catheter.
- the optical fiber is provided within a working lumen of the access device and is in communication with an optical imaging system.
- the same methods which are used to validate the diagnostic value of particular sets of target molecule/nucleic acid sensor molecule combinations are used to identify lead compounds which can function as drugs.
- the effects of a compound on target dependent optical signaling is monitored to identify changes in a signature profile arising as a result of treatment with a candidate compound.
- samples from a treated patient are tested in vitro; however, samples can also be tested ex vivo or in vivo.
- the diagnostic profile identified by the biosensor changes from a profile which is a signature of a disease to one which is substantially similar to the signature of a wild type state (e.g., as determined using routine statistical tests)
- the lead compound is identified as a drug.
- Target molecules which activate the biosensor can comprise molecules with characterized activity and/or molecules with uncharacterized activity. Because large number of target molecules can be monitored simultaneously, the method provides a way to assess the affects of compounds on multiple drug targets simultaneously, allowing identification of the most sensitive drug targets associated with a particular trait (e.g., a disease or a genetic alteration).
- suitable target molecules include, e.g., nuclear hormone receptor (NHR) polypeptides; G-coupled protein receptor (GPCR) polypeptides, phosphodiesterase (PDE), and protein kinases.
- NHR nuclear hormone receptor
- GPCR G-coupled protein receptor
- PDE phosphodiesterase
- nucleic acid sensor molecules for detection of conformational isoforms of nuclear hormone receptors, as well as the nucleic acid sensor molecules identified by the methods described herein.
- Nuclear hormone receptors act as ligand-inducible transcription factors by directly interacting as monomers, homodimers, or heterodimers in complex with DNA response elements of target genes. The activation of these transcription regulators is induced by the change in conformation of the NHR upon complex formation with ligand.
- NASMs described herein can include, e.g., those derived from the hammerhead, hairpin, L1 ligase or group 1 intron ribozymes and the like, any of which transduce molecular recognition into a detectable signal.
- a direct mechanistic assay for the action of small molecule ligand-agonism, -antagonism and partial antagonism of members of the NHR family function in both in vitro biochemical as well as with in vitro cell-based settings.
- the nucleic acid sensor molecules are designed to recognize one conformational isomer of the NHR.
- the nucleic acid sensor molecule recognizes the unique conformation that exists for the agonist bound form of a hormone receptor; such as that observed for the estrogen receptor ligand binding domain ER-LBD when bound to estrogen (Shiau A K, Barstad D, Loria P M, Cheng L, Kushner P J, Agard D A, Greene G L. Cell. 1998;95(7):927–37) and then produces a detectable signal, such as release of fluorescently labeled oligonucleotide, radiolabeled oligonucleotide, or reveals a change in nucleic acid sensor molecule conformation driven by ligand binding through a change in fluorescence or the like.
- a detectable signal such as release of fluorescently labeled oligonucleotide, radiolabeled oligonucleotide, or reveals a change in nucleic acid sensor molecule conformation driven by ligand binding through a change in fluorescence or the like.
- the nucleic acid sensor molecule transduces molecular recognition of the ER-LBD-estrogen agonist complex into a detectable signal. The level of the signal is then used to quantify the amount of ER-LBD-estrogen agonist complex present in solution.
- the ER-LBD-estrogen specific nucleic acid sensor molecule is used as a screening tool in assays designed to detect inhibitors of ER-LBD-estrogen complex formation. These screening tools can be used to determine the inhibition potency of compounds in in vitro biochemical assays or in in vitro cell-based assays.
- Inhibitors of estrogen binding to ER-LBD are useful as anti-proliferative agents for treatment of breast cancers (e.g., tamoxifen) and other estrogen dependent diseases.
- nucleic acid sensor molecules are introduced into cell lines by known methods of electroporation, transfection or coupling to peptide translocating agents such as tat or antennapedia peptides.
- the ER-LBD-estrogen complex specific nucleic acid sensor molecule is an allosteric intron imbedded in a reporter gene such as GFP or luciferase or the like. When the intron derived nucleic acid sensor molecule is inserted into the reporter gene it renders reporter gene expression effector dependent.
- functional GFP protein is expressed only when the ER-LBD-estrogen complex is present in the cell, and inhibitors of ER-LBD-estrogen complex formation thus block functional GFP protein expression in appropriate mammalian, such as MCF7 or T47D, yeast or bacterial cell lines.
- MCF7 or T47D tumor cell lines transfected with GFP-ER-LBD-estrogen nucleic acid sensor molecule sensitive construct are used to form tumor xenografts in nude mice.
- the transfected tumor xenograft cell lines can be used to form tumors in mice which are not only estrogen dependent but also regulate reporter gene expression in ER-LBD-estrogen dependent manner.
- NHR ligand binding domains bind antagonists, forming additional conformational isomers.
- antagonists When antagonists are bound to the receptor a new conformer results such as that observed upon tamoxifen binding to the estrogen receptor to form a stable ER-LBD-tamoxifen complex (Shiau A K, Barstad D, Loria P M, Cheng L, Kushner P J, Agard D A, Greene G L. Cell. 1998 Dec 23;95(7):927–37).
- the invention includes use of an ER-LBD-tamoxifen specific nucleic acid sensor molecule that is used to detect the levels of antagonist specific complex in both in vitro biochemical, cell-based and, in in vivo assays as described above.
- Nucleic acid sensor molecules can be developed that are specific for the ligand binding domains of all NHRs.
- nucleic acid sensor molecules for agonist, antagonist, dimeric or multimeric forms of NHR LBDs can be used to screen for inhibitors of LBD function and therefore for inhibitors of NHR dependent transcriptional activation or repression.
- nucleic acid sensor molecules specific for individual LBD complexes can be used to screen for agents that modify NHR function in in vitro and in in vivo assays.
- NHRs are multidomain proteins containing a variable NH 2 -terminal region (A/B), a conserved DNA binding domain (DBD) or region (C), a linker region (D), and a conserved region (E) that contains the ligand binding domain (LBD).
- A/B variable NH 2 -terminal region
- DBD conserved DNA binding domain
- C linker region
- E conserved region
- NHRs also contain regions required for transcriptional activation, of particular interest is the region AF-2 which is located in the COOH-terminus and whose function is strictly ligand dependent.
- Provided herein is a method for generating unique nucleic acid sensor molecules to each of the 63 known human NHR LBDs.
- nucleic acid sensor molecules capable of recognizing the activated state of the NHR by selection for nucleic acid sensor molecules geometries which signal the presence of either the activated or inactivated conformation (NHR with bound ligand), but whose signaling action is quiescent in the presence of other forms of the NHR.
- the nucleic acid sensor molecules allow the direct, simultaneous, and rapid detection of the activation states of all NHRs.
- This tool can be used in in vitro assays for receptor activation with agonists and antagonists, and can be used to generate cell lines and animal models that report on the activation state of such receptors in a biological setting and as a function of drug or drug lead.
- nucleic acid sensor molecules for detection of conformational isoforms of G-protein coupled receptors.
- GPCRs G-protein coupled receptors
- GPCRs include three domains: an extracellular N-terminus, a central domain of seven trans-membrane helices connected by unstructured loops, and a cytoplasmic C-terminus. Activation of GPCRs is induced by ligand binding, which causes a conformational change in the receptor transmitting a signal across the plasma membrane to intracellular members of a signaling pathway. The methods described herein allow for generating unique nucleic acid sensor molecules to any GPCR.
- nucleic acid sensor molecules capable of recognizing the activated state of the GPCR by selecting for nucleic acid sensor molecule geometries which signal the presence or absense of the activated conformation of the receptor through recognition of one or all of the mobile domains, but whose signaling action is quiescent in the presence of other forms of the GPCR.
- the biosensors described herein include nucleic acid sensor molecules such as allosetric ribozymes (AR), including those derived from the hammerhead, hairpin, LI ligase, or group 1 intron ribozymes and the like. Nucleic acid sensor molecules may also be derived from aptamer beacons or signaling aptamers which transduce molecular recognition into a detectible signal.
- AR allosetric ribozymes
- G-protein coupled receptor(GPCR) polypeptides activate intracellular Gec-protein.
- GPCR G-protein coupled receptor
- a single GPCR can activate a number of G ⁇ -proteins.
- adrenergic receptors activate Gi, which inhibit adenylyl cyclases, Gs, which stimulate adenylyl cyclases, and Gq, which regulate cellular Calcium-ion level (Wenzel-Seifert and Seifert 2000).
- Gi adrenergic receptors
- Gs which stimulate adenylyl cyclases
- Gq which regulate cellular Calcium-ion level
- the initial drug screening of the GPCRs is normally performed by competition assay with radiolabeled ligands.
- incorporation of radiolabeled GTP can be measured to detect the coupling of G ⁇ -protein and GPCR, however this assay does not distinguish the type of G ⁇ -proteins involved.
- the assays for the effect on individual effectors, such as the Ca ++ flow or cellular cAMP level, are also commonly used, but only one downstream signal can be measured at a time using these assays.
- G ⁇ -protein Upon activation, a G ⁇ -protein undergoes significant conformational change which results in release of GDP and association with GTP (Coleman and Sprang 1998). The G ⁇ -protein also dissociates from its ⁇ -subunits. This activated form of G ⁇ -protein then becomes capable of interacting with its effector (Li, Stem Stamm et al. 1998). The well-characterized conformation change takes place in three switches; switch I (residues 177–187 in Gi ⁇ 1), switch II (residues 199–219 in Gi ⁇ 1), and switch III (residues 231–242 in Gi ⁇ 1). The sequences and the conformational changes in these switches are well conserved among G ⁇ -proteins.
- Ras is a member of the small GTPase protein family, which shares significant similarity with other family members.
- GTP-bound ras and GDP-bound ras can be distinguished by the RBD (ras binding domain) of Raf-1 (Taylor, Resnick et al. 2001).
- the activated state of Raf-1 can be identified by RaIRDS (Franke, Akkerman et al. 1997). This indicates significant change in the surface of the protein, and the effector binding surface are only available for interaction in GTP complex form.
- the invention provides methods for selecting nucleic acid sensor molecules which recognize the conformational change upon GTP binding and/or specifically interact with newly exposed G-protein effector binding sites upon the activation.
- Class-specific activated G ⁇ -protein nucleic acid sensor molecules recognize the activated G ⁇ -proteins or its effector binding site, which allow us to interpret the multiple type of downstream signal affect by the GPCR. It can used in both in vitro HTS (high throughput screening) and cell-based HTS.
- the mechanistic assays function in both in vitro biochemical and in vitro cell-based settings.
- the nucleic acid sensor molecules are designed to recognize one conformational isomer of the GPCR.
- the nucleic acid sensor molecule recognizes the unique conformation that exists for the activated state when in complex with ligand, e.g., such as that observed for the beta-2 adrenergic receptor when in complex with the artificial ligand isoproterenol (Ghanouni et al., PNAS USA, 98:5997–6002(2001)) and then produces a detectable signal, e.g., by release of a fluorescently labeled oligonucleotide, release of a radiolabeled oligonucleotide, or a change in conformation of the NASM driven by ligand binding through a change in fluorescence or the like.
- ligand e.g., such as that observed for the beta-2 adrenergic receptor when in complex with the artificial ligand isoproterenol (Ghanouni et al., PNAS USA, 98:5997–6002(2001)
- a detectable signal e.g
- the nucleic acid sensor molecule transduces molecular recognition of the beta-2 adrenergic receptor—in complex with epinephrine, norepinephrine or an artificial ligand such as isoproterenol into a detectible signal. The level of the signal is then used to quantify the amount of beta-2 adrenergic receptor-agonist complex present in solution.
- the beta-2 adrenergic-agonist nucleic acid sensor molecule is used as a screening tool in assays designed to detect agonists of the beta-2 adrenergic receptor. These screening tools can be used to determine the activation potency of compounds in in vitro biochemical assays or in in vitro cell-based assays. Agonists of the beta-2 receptor are useful in the treatment of asthma (Robinson, et al. Lancet 357:2007–2011(2001)).
- nucleic acid sensor molecules are introduced into cell lines by known methods of electroporation, transfection, or coupling to peptide translocating agents such as tat or antennapedia peptides.
- the beta-2 adrenergic receptor-agonist complex specific nucleic acid sensor molecule is an allosteric intron imbedded in a reporter gene such as GFP or luciferase or the like.
- a reporter gene such as GFP or luciferase or the like.
- the intron-derived reporter When the intron-derived reporter is inserted into the reporter gene it renders reporter gene expression effector dependent.
- functional GFP protein is expressed only when the beta-2 adrenergic receptor-agonist complex is present in the cell, and inhibitors of beta-2 adrenergic receptor-agonist complex formation block functional GFP protein expression in appropriate cells such as mammalian human peripheral blood leukocytes, yeast, insect, or bacterial cell lines.
- Chinese hamster fibroblasts which do not express beta-adrenergic receptors (Sheppard, et al., PNAS USA 80:233–236(1983)), are transfected with both the nucleic acid sensor molecule and the gene coding for the beta-adrenergic receptor under a constitutive promoter, and are used to create a model cell line suitable for HTS screening of candidate beta-2 agonists.
- cells can be caused to express known allelic variants, such as gln27-to-glu associated with obesity (Large, et al., J Clin. Invest 100:3005–3013), to create cells lines which model specific disease states.
- chimeric mice can be created by “knock-in” (Monroe et al., Immunity 11:201–212(1999)) which will express the nucleic acid sensor molecule in every cell as the result of blastocyst fusion (Chen et al., PNAS USA 90:4528–4532(1993)), and used for pharmokinetic or bioavailability studies in which the GPCR activation states of various tissues in the organism are of concern.
- GPCRs bind antagonists, which cause the GPCRs to become resistant to conformational changes, or result in conformations not susceptible to activation, or blockade the ligand binding domain from interaction with the appropriate ligand and thus prevent activation of the GPCR, such as the beta-2 adrenergic receptor antagonist butoxamine (Horinouchi et al., Pharmacology 62:98–102(2001)).
- the invention also provides a method for using a nucleic acid sensor molecule to detect conformers which result from binding of GPCRs to antagonists.
- the nucleic acid sensor molecule can be employed in a screen for compounds which are beta-2 antagonists (Ramsay et al, Br J Pharmacol 133:315–323(2001)). Antagonists of the beta-2 receptor are useful in the treatment of cardiovascular diseases (Nagatomo, et al., Cardiovasc Drug Rev 19:9–24(2001)).
- the invention accordingly provides a method for using a Beta-2 adrenergic receptor—butoxamine complex-specific nucleic acid sensor molecule that is used to detect the levels of an antagonist specific complex in both in vitro biochemical, cell-based, and in vivo assays as described above.
- Nucleic acid sensor molecules can also be developed that are specific for the occupancy state of the ligand-binding domains of all GPCRs.
- nucleic acid sensor molecules for the agonist, antagonist, dimeric, or multimeric forms of all GPCRs can be used to screen for inhibitors or activators of GPCR function and therefore for inhibitors or activators of GPCR-dependent cell signaling pathways.
- Nucleic acid sensor molecules specific for individual GPCR complexes can be additionally used to screen for agents that modify GPCRs in in vitro and in vivo assays.
- PDEs phosphodiesterases
- the invention provides multiple classes of PDE nucleic acid sensor molecules.
- the first class of nucleic acid sensor molecules can distinguish cAMP vs. 5′ AMP (cGMP vs 5′GMP) (Koizumi, Kerr et al. 1999) (Koizumi, Soukup et al. 1999).
- the second class of nucleic acid sensor molecule binds to the active site of PDE in a class specific manner and inhibits PDE catalytic activity. This class of nucleic acid sensor molecule can be raised using PDEs in the presence and absence of high affinity known inhibitors (e.g., Ropalim for PDE4).
- the third class of nucleic acid sensor molecule recognizes PDE in a class-specific (e.g., PDE1–11) or subclass-specific (PDE4A–D) manner.
- the invention also provides nucleic acid sensor molecules raised against protein kinases.
- the invention provides nucleic acid sensor molecules that are modulated by the phosphorylation state in a given peptide sequence.
- native proteins can be used with different phosphorylation states in order to raise nucleic acid sensor molecules that can distinguish the different phosphorylation states.
- ERK1/2 and phosphorylated ERK1/2 can be distinguished by specific nucleic acid sensor molecules (Seiwert, Stines Nahreini et al. 2000).
- the nucleic acid sensor molecule also can be a competitive inhibitor for a kinase by binding at ATP or substrate binding sites.
- an ADP-dependent nucleic acid sensor molecule can be obtained at lower pH. These nucleic acid sensor molecules can be used to detect the production of ADP.
- physiological function is modulated by complex pathways, each of which may have multiple overlapping and intersecting steps.
- the proteins involved in these pathways are highly homologous and can have overlapping substrates and drug specificities.
- Using current techniques it is possible only to monitor the response of single elements of a pathway. These techniques are inadequate to understand the mechanism of drug interactions. For example, a particular drug found to have a particular in vitro activity against a single target in biochemical assays might interact with other proteins in the same pathway, or in other unrelated pathways. Consequently, physiological function is often uncorrelated with the results of biochemical assays of a single target.
- the nucleic acid sensor molecules according to the invention provide reagents to simultaneously quantify the level and chemical state of all components in a molecular pathway
- path target molecules are target molecules involved in the same pathway and whose accumulation and/or activity is dependent on other pathway target molecules, or whose accumulation and/or activity affects the accumulation and/or activity of other pathway target molecules.
- Pathway target molecules include, e.g., proteins, such as enzymes, modified forms of proteins, such as phosphorylated, sulfated, ribosylated proteins, methylated proteins (Arg, Asp; N, S or O directed), prenylated proteins (such as by farnesyl, geranylgeranyl, and other types of prenylation) acetylated or acylated proteins, cleaved or clipped proteins, bound or unbound forms of proteins, allelic variants of a protein (e.g., proteins differing from each other by single amino acid changes in a protein), as well as substrates, intermediates, and products of enzymes (including both protein and non-protein molecules).
- proteins such as enzymes, modified forms of proteins, such as phosphorylated, sulfated, ribosylated proteins, methylated proteins (Arg, Asp; N, S or O directed), prenylated proteins (such as by farnesyl, geranylgeranyl
- diagnostic pathway target molecules are identified by pre-selecting a plurality of nucleic acid sensor molecules activatable by pathway-specific target molecules.
- a profiling biosensor is provided comprising at least one nucleic acid sensor molecule specific for every molecular species within a pathway (e.g., a signaling pathway), to generate a biosensor which can monitor the levels, chemical structure, and/or activity of every molecular species in the pathway.
- the profiling biosensors of the instant invention make it feasible to evaluate the response of all the components of a pathway to a drug compound simultaneously.
- a profiling biosensor reactive to the components of an entire pathway is contacted with a sample from a patient having a disease, and ani optical signal corresponding to a disease state is determined to identify diagnostic pathway target molecules which are diagnostic of that disease.
- Samples from a plurality of patients are obtained and tested using the profiling biosensor to identify a pathway profile that is diagnostic of the disease, the pathway profile comprising normalized data relating to any or all of the level, structure, and activity, of the signature pathway molecules.
- a pathway profile corresponding to a wild type state is determined by testing the profiling biosensor molecules against samples from a population of healthy patients, or subsets of populations of healthy patients.
- data relating to the optical signals generated by nucleic acid sensor molecules activated by the diagnostic pathway target molecules is stored within the memory of a computer or within a computer program product.
- the pathway profiles can be used in diagnostic testing as discussed above.
- a profiling biosensor is used in which the pathway is one which is known or suspected of being disrupted in patients having a particular trait (e.g., having a particular disease or genetic alteration(s)).
- one profiling biosensor used to evaluate samples from a patient with cardiovascular disease is a cholesterol metabolism pathway profiling biosensor.
- random combinations of profiling biosensors can be used to assess the physiological state of a patient, to identify diagnostic pathway profiles which are diagnostic of diseases whose molecular basis has not yet been identified or characterized.
- profiling biosensors are used to assess the affect of a candidate drug on any or all of the level, chemical structure, or activity of diagnostic pathway target molecules to generate a drug treatment pathway profile.
- a profiling biosensor is contacted with a sample from a cell or physiological system (e.g., a group of cells, a tissue system, an organ system, or a patient), and changes in optical signals are obtained which are correlated to any, or all of, the level, chemical structure, or activity of a particular pathway target molecule by relating the optical signal obtained to the address of the nucleic acid sensor molecule, as described above.
- a cell or physiological system e.g., a group of cells, a tissue system, an organ system, or a patient
- a drug treatment profile which is substantially similar to a diagnostic pathway profile obtained from a healthy population of patients (as determined by observing no significant differences in the profile by routine statistical testing, to within 95% confidence levels) is used to identify a candidate drug as one which is suitable for further testing.
- the profile produced by such a drug is used to produce an effective drug treatment profile, against which other candidate drugs can be compared.
- a candidate drug is tested against a plurality of profiling biosensors including the one which will generate a diagnostic signature profile, to identify drugs which produce an effective drug treatment profile without effecting significant changes in other pathway profiles.
- the systemic effects of a candidate drug can be predicted.
- a biosensor representing less than an entire pathway.
- a biosensor comprising nucleic acid sensor molecules diagnostic pathway target molecules.
- a biosensor which comprises nucleic acid sensor molecules necessary to evaluate particular components of a pathway suspected of being involved in a disease. For example, compounds being screened to identify candidate drugs that affect diseases relating to defective DNA repair can be tested against a pathway biosensor comprising only S phase cell cycle target molecule reactive nucleic acid sensor molecule.
- Exemplary pathway target molecules include various proteins and modified form thereof. Modifications include post-translational modifications such as phosphorylation, prenylation, glycosylation, methionine removal, N-acetylation, acylation, acylation of cysteines, myristoylation, alkylation, ubiquitinylation, prolyl-4-hydroxylation, carboxylation of glutaminyl residues, advanced glycoslylation (e.g., of hemoglobin), deamination of glutamine and asparagine, addition of glycophosphatidylinositol, disulfide bond formation, hydroxylation, and lipidation.
- post-translational modifications such as phosphorylation, prenylation, glycosylation, methionine removal, N-acetylation, acylation, acylation of cysteines, myristoylation, alkylation, ubiquitinylation, prolyl-4-hydroxylation, carboxylation of glutaminyl residues, advanced glycoslylation (e.g
- proteins include ERK and phosphorylated ERK, CDK and phosphorylated CDK, modified cyclin A, cyclin D, cyclin E, k-Ras, h-Ras, Rho A, MEK-1, MEKK-1, Raf-1, Raf-A, JNK, PKA, ATK, PTEN, p53, P16, and INK4.
- Other proteins include those listed in Table 1 as well as post-translationally modified forms thereof.
- TAP TAP, TRADD- TRAF2 and TRADD-FADD, TNF, D4-GDI, NF-kB, CPP32/apopain, CD4O, IRF-i, p53, apoptin blood clotting pathways thrombin, fibrinogen, factor V, Factor VIII-FVa, FVIIIa, Factor XI, Factor Xia, Factors IX and X, thrombin receptor, thrombomodulin (TM), protein C (PC) to activated protein C (aPC).
- thrombomodulin TM
- PC protein C
- aPC activated protein C
- aPC plasminogen activator inhibitor-i
- tPA tissue plasminogen activator calcium signaling pathways calmodulin, calcineurin, Cell cycle G0 MPS, CYTOSTATIC FACTOR (CSF) (INCLUDING MOS) Pathway G1 mid GI phase: cdk4/cycin D1–3 and cdk6/cyclin D1–3 late G 1 phase: cdk2/cycin E others: p53, p21, p16, Rb, p2′1, E2F, Cdc25A, Cdc25B S cyclin A/CDK2, cyclin B/Cdc2, SPA-i, Cdc25A, Cdc25B G2 G2/M transition phase: cdk1/cyclin B 1–3, cdk1/cyclin A, Cdc25A, Cdc25B, Cdc25C.
- nucleic acid sensor molecules can be raised against particular amino acid sequences in the polypeptides.
- Some representative peptide regions are presented in Table 2.
- a profiling biosensor array is generated comprising target activatable nucleic acid sensor molecules which are activatable by components of a cell cycle pathway.
- a cell cycle biosensor is generated comprising nucleic acid nucleic acid sensor 10 molecules activatable by at least two members selected from the group consisting of: MPS, Cytostatic factor (CSF) (including Mos), cdk4, cyclins D1–3, cdk6, cdk2, cyclin E, p53, p21, p16, Rb, p27, E2F, cyclin A, cyclin B, cdkl, cyclin B1–3, Cdc2, SPA-1, and other biomolecules involved in cell cycle regulation.
- CSF Cytostatic factor
- the cell cycle biosensor array generated is used to evaluate samples from patients suspected of having a disorder affecting cell proliferation (e.g., cancer) and a signature target molecule profile is determined which is diagnostic of this disorder. Changes in the signature target molecule profile upon treatment with a candidate compound are subsequently monitored by any or all of in vitro, ex vivo, and in vivo methods, as described above, to identify and/or validate lead compounds for use in cancer therapies.
- a disorder affecting cell proliferation e.g., cancer
- a cell cycle biosensor comprising a plurality of locations, each location comprising a set of nucleic acid sensor molecules activatable by target molecules which identify a different portion of the cell cycle.
- a cell cycle biosensor comprises at a first location, nucleic acid sensor molecules activatable by G0 specific target molecules (e.g., MPS, Cytostatic factor (CSF) (including Mos)), at a second location, nucleic acid sensor molecules activatable by G1 specific target molecules (cdk4, cyclin D1–3, cdk6, cdk2, cyclin E, p53, p21, p16, Rb, p27, E2F), at a third location, nucleic ac molecules which are activatable by S specific target molecules (e.g., cyclin A/CDK2, cyclin B/Cdc2, SPA-), at a fourth location, nucleic acid sensor molecules activatable by G2 specific target molecules-(e.
- G0 specific target molecules e.
- pathway specific biosensors can be generated for any of apoptotic pathways, blood clotting pathways, calcium regulation pathways, cholesterol metabolism pathways, the JAK/STATS signaling pathway, MAP kinase signaling pathways, p53 pathway, PI 3 kinase pathway, ras activation pathways, SIP signaling pathways, SHC signaling pathways, TGF-13 signaling pathways, T-cell receptor complex, and MHC-I pathways, using exemplary target molecules listed above, or other target molecule components of the respective pathways.
- pathways whose components have been characterized and that target molecules within these pathways are also encompassed within the scope of the present invention (e.g., including, but not limited to, phosphatase pathways, transcription factor pathways, hormone dependent pathways, as well as intermediary metabolism pathways, and developmental pathways).
- additional pathways can be identified using the nucleic acid based biosensor profiling techniques discussed above (e.g., identifying pathway molecules involved in the functioning of a wild type or diseased organ system, such as the cardiovascular system, central nervous system, digestive system, reproductive system, pulmonary system, skin system, and the like), and these also are encompassed within the scope of the invention.
- pathway specific molecules can be identified by other techniques known in the art (see, e.g., U.S. Pat. No. 6,087,4717, U.S. Pat. No. 6,054,558, U.S. Pat. No. 6,048,709, and U.S. Pat. No. 6,046, 165) and used to engineer additional pathway target activatable nucleic acid sensor molecules. Because there is a finite number of pathway target molecules in each pathway (constrained by the absolute number of gene products which have been identified) (see, e.g., Drews, Science 287: 1960–1964), it is feasible using the target activatable nucleic acid sensor molecules to generate biosensors representative of an entire pathway.
- sets of profiling biosensors are used to monitor the expression/activity of target molecules representing complex systems.
- target molecules representing complex systems For example, the effect of target molecules on the cardiovascular system and pulmonary system can be monitored simultaneously.
- an array representative of a plurality of systems in the human body is used in methods to assess the effects of drug compounds on multiple systems in the body.
- the profiling nucleic acid sensor molecules according to the invention can be used in every step of a drug optimization process, as shown in FIG. 8 , and are suitable reagents for use in conventional high throughput screening systems making them extremely adaptable for use alone, or in conjunction with, other drug development assays.
- profiling nucleic acid sensor molecules can be used to identify signature target molecules which are correlatable to particular traits, such as disease.
- Signature target molecules are drug targets whose levels, structure, and/or activity can be used to evaluate the efficacy of compounds.
- a large number of signature drug targets, both characterized and uncharacterized, can be identified simultaneously using a single profiling biosensor according to one embodiment.
- a profiling biosensor recognizes and is independently activated by about 1–5,000 molecules.
- a profiling biosensor recognizes and is independently activated by about 500–10,000 molecules, and in another embodiment, by greater than 10,000 molecules.
- the drug targets identified in step 1 are evaluated in high throughput screening assays, using either solution-based biosensors or substrate-based biosensors, to characterize the biological activity of a drug target.
- nucleic acid sensor molecules are used to assess levels of substrate, product and intermediates produced by an enzyme in a wild type vs. a disease state, to identify other components of a pathway that would be affected by a drug acting on that target (i.e., secondary drug targets).
- the levels, structure, and/or activity of all of the modified forms of a drug target, or the active and inactive forms of a drug target is determined in a wild type vs. a disease state, to further develop a diagnostic profile of a diagnostic pathway target molecule and to evaluate changes of that profile in the presence of a drug.
- the same type of profiling biosensor used to identify a diagnostic profile is contacted with samples from patients exposed to a compound.
- a compound-treated sample which produces substantially similar levels, structure, and/or activity of target and secondary drug targets in a sample from a healthy patient is used to identify a compound as a candidate drug. Because this testing is done in a high throughput format, a single dose of a candidate drug is evaluated in any given test.
- the nucleic acid sensor molecules used in step 2 are tested in an in vitro biochemical assay to determine compound potency.
- a preliminary dosing effect is determined to identify the IC50 of candidate drug.
- multiple biosensors of the type used in step 2 are contacted with samples from patients exposed to different doses of the candidate drugs identified in step 2, to identify candidate drugs with the highest potency (e.g., requiring the least amount of drug to generate a wild type profile or an effective drug profile.
- nucleic acid sensor molecules are used in cellular assays where the effect of adding a compound on cell physiology is known and the researcher wants to determine that the drug is in fact acting through the drug target selected in steps 1–3.
- a candidate drug is added to a physiological system (e.g., cell(s), tissue(s), organ(s), or a patient).
- Cells from the physiological system are lysed and the substrate or product of an enzyme reaction is monitored using the nucleic acid sensor molecule either in an ELISA format or other solid support-based format (e.g., a profiling array) or a solution phase format.
- cell lysates are contacted with a profiling biosensor specific for a target or pathway of interest to determine the profile of target molecules in the lysed sample.
- the profile is then compared to the wild type profile and the disease profile to determine if the drug is operating in vivo to restore a cell to its wild type state.
- the physiological effect of a candidate drug on a physiological system is correlated with the in vivo mechanism of action of the candidate drug.
- pathway profiling arrays comprised of nucleic acid sensor molecules affixed to a solid support are used in cellular assays to determine the selectivity of a compound for one target in a pathway relative to other candidate targets in a signal transduction pathway(s) or in another biochemical pathway(s). This data can be used to validate a drug lead or drug target.
- nucleic acid sensor molecules are expressed in vivo or intracellularly using plasmids, viruses or other extra-chromosomal DNA vectors and the cellular nucleic acid sensor molecules are extracted and used to determine the activity of a drug or drug target.
- These cellular assays can also determine the selectivity of a compound for one target in a pathway relative to other candidate targets in a signal transduction pathway(s) or in another biochemical pathway(s). This data can be used to validate a drug lead or drug target.
- drug-lead potency, specificity, and/or in vivo activity is optimized by an iterative repetition of any or all of steps 1–4.
- steps 1–4 are repeated until the desired potency, selectivity and in vivo mechanism of action of a candidate drug is obtained.
- Potency can range from picomolar affinity to nanomolar affinity as measured by in vitro IC50 values.
- the desired selectivity of a drug candidate for its target can vary from 2 to a million-fold, and can be obtained by measuring the potency (IC50) of a drug lead toward the drug target, versus the drug's potency (IC50) values against other pertinent targets (target pertinence is determined by the requirements of the biological system under investigation).
- a drug lead is deemed optimal when the parameters of potency, selectivity and cellular action are optimized with respect to each other.
- known drug leads from Steps 1–4 are found to be specific for targets that were not known to the researcher in step 2. This is also termed target discovery and validation, and occurs when steps 1–4 are repeated in an iterative fashion of any or all steps and the drug target is identified by the profiling array to, in fact, exist in an alternative signal transduction pathway, or to be a novel protein or enzyme in the pathway originally under investigation.
- MPP arrays can identify the site of action of a drug lead, and can determine the relative selectivity of a drug for one drug target of a drug target pathway.
- target cells e.g., tissue(s)
- tissue(s) are removed from an animal model of the disease being targeted for treatment and lysed for testing.
- the lysate is contacted with nucleic acid sensor molecules either in a solid phase assay, a solution phase assay, or in a pathway profiling biosensor array format to assess the in vivo biological activity of a candidate drug identified by any of the previous steps or by some other method, on a target or pathway.
- the physiological effect of a drug on a diseased or normal tissue is correlated with the in vivo mechanism of action of the drug.
- drug-lead potency, specificity, and/or in vivo activity are optimized by an iterative repetition of any or all of steps 1–6. In one embodiment, steps 1–5 are repeated until the desired potency, selectivity and in vivo mechanism of action of a candidate drug are obtained.
- the nucleic acid sensor molecules are used in pharmaco-kinetic studies, where the effect of a drug on the physiology of a cell, group of cells, tissue(s), organ(s), or animal model is assessed by obtaining blood, plasma, tissue, or a cell, and contacting this material with nucleic acid sensor molecules either in a solid phase (e.g., ELISA), solution or array format to assess the in vivo pharmacological or toxicological activity of a compound.
- the nucleic acid sensor molecules used are developed against the candidate drug itself, its metabolic products, and/or the metabolic products of proteins and small ligands involved in a xenobiotic or toxicological response to drug treatment.
- nucleic acid sensor molecules are employed to follow the fate of a drug or its metabolic by-products.
- nucleic acid sensor molecules are generated to the drug and its metabolites.
- the drug is administered to the test animal either subcutaneously, intraperitoneally or by gavage.
- the blood plasma or disease tissue is removed and its contents are screened for the remaining drug by Liquid chromatography (LC) or LC-mass spectrometry.
- Drug exposure is then determined as a function of time, dose and method of administration and is reported in values of half-life, bioavailability, AUC and Cmax. Metabolic products of a drug lead can be similarly followed.
- Nucleic acid sensor molecules generated against enzymes or proteins known to those skilled in the art to be involved in drug metabolism can be used to follow the effect of a drug on xenobiotic or toxicological response to drug treatment.
- drug-lead potency, specificity, and/or in vivo activity, and pharmacokinetic, or toxological properties are optimized by an iterative repetition repetition of any or all of steps 1–7. In one embodiment, steps 1–7 are repeated until the desired potency, selectivity and in vivo activity and pharmaco-kinetic, or toxicological properties of a candidate drug are obtained.
- nucleic acid sensor molecules are used in clinical trials to determine the fate of a drug in human or animal models, or used to follow the effect of drug treatment on a target or molecular pathway of choice, as described above.
- the nucleic acid sensor molecules in a solid phase assay (e.g., ELISA format), a solution phase assay, or in a pathway profiling biosensor array format, are used to assess the in vivo biological activity of a drug being tested using lysed cell samples as described above.
- the appropriate profiling biosensor is used in vivo, to monitor the effects of the compound on the patient, for example, by providing the biosensor in communication with a fiber optic probe inserted into the patient, or ex vivo, monitoring optical signals in a cell using a microscope based detection system.
- an in vivo assay is done by introducing a nucleic acid sensor molecule which retains its catalytic activity into a physiological system (e.g., by injection at a target site in the body, through liposome carriers, and other means of administration routinely used in the art), obtaining cells from the physiological system and detecting the effect of the compound on the catalytic activity of the nucleic acid sensor molecule (e.g., by evaluating the sequence of the nucleic acid sensor molecule) as a means of determining the level, structure, or activity of a drug target, and relating the level, structure, or activity or the target molecules to the efficacy of the drug.
- any or all of steps 1–10 are repeated to further optimize the properties of the candidate drug.
- individuals who would be suitable for treatment with the candidate drugs identified steps 1–11 are identified using nucleic acid sensor molecules in the diagnostic assays discussed previously.
- nucleic acid sensor molecules are used in chemical genomic assays in which a drug or plurality of drug leads, with known or unknown physiological effects, and with unknown targets, are contacted with a physiological system and the site of action of the drug or plurality of drugs is determined using a plurality of the profiling biosensors described previously. Drug optimization then occurs as in steps 1–11.
- nucleic acid sensor molecules according to the invention can also be used to retrieve the target molecules which they specifically recognize. Additional embodiments exploiting the recognition capacity of the biosensors disclosed are contemplated and encompassed within the scope.
- reagents are provided for generating and using nucleic acid sensor molecules.
- a kit comprising standardized reagents for making and/or using the nucleic acid sensor molecules according to the invention.
- the kit comprises at least a first optical nucleic acid sensor molecule whose optical properties change upon recognition of a target molecule.
- the kit additionally comprises any of: a control target molecule, a second nucleic acid sensor molecule which recognizess a different target molecule, suitable buffers, printed instructions, and combinations thereof.
- a nucleic acid sensor molecule is provided with reagents for attaching a label and/or quencher or with reagents for attaching charge transfer molecules to the nucleic acid sensor molecule, which can sensitize the optical properties of the nucleic acid molecule to the presence of a target molecule.
- a composition comprising a target molecule and a nucleic acid sensor molecule.
- the composition provides a reference against which to compare modified nucleic acid sensor molecules which recognizes to the same target, in order to select those with preferred cataytic activity or conformational change in the presence of the target.
- sets of complexes are provided.
- a set of pathway target molecules and nucleic acid sensor molecules are provided.
- a set of profiling target molecules and nucleic acid sensor molecules are provided.
- solid supports are provided for isolation of target molecules from nucleic acid sensor molecules.
- a computer program product comprising stored data relating to optical signals generated by profiling and or pathway target molecules.
- a means to compare this data to other optical signals is provided.
- the memory comprises data relating to patient information or chemical structure information relating to either target molecules or nucleic acid sensor molecules.
- the system is a robotic workstation, comprising, at least one of an: arrayer, microplate or microarray feeders, stackers, washers, and dispensers, an optical system, a carousel, a conveyer for conveying microplates or microarrays from one part of the system to another (in a vertical or horizontal direction), a shaker system or other mixing system, a temperature control system, a synthesizer, a solid phase extraction system, and sample concentrators.
- the system comprises a processor connectable to the network which comprises or can access applications comprising stored data relating to profiling information obtained using nucleic acid sensor molecules according to the invention, and/or statistical applications, applications for performing structure/activity analysis of target molecules and nucleic acid sensor molecules, applications for performing nucleic acid sequence alignment and simultaneous structure superposition of proteins (e.g., MOE-Align'TM), applications for predicting binding conformations of molecules to receptor structures, and applications for controlling the processing functions of the robotic workstations.
- applications comprising stored data relating to profiling information obtained using nucleic acid sensor molecules according to the invention, and/or statistical applications, applications for performing structure/activity analysis of target molecules and nucleic acid sensor molecules, applications for performing nucleic acid sequence alignment and simultaneous structure superposition of proteins (e.g., MOE-Align'TM), applications for predicting binding conformations of molecules to receptor structures, and applications for controlling the processing functions of the robotic workstations.
- applications comprising stored data relating to profiling information obtained using nucleic acid sensor molecules according to the
- Target modulated nucleic acid sensor molecules are isolated by in vitro selection. Pool of partially randomized ribozymes with 10 15 –10 17 unique sequences serve as the starting point for in vitro selection. As with the engineering approach, both the L1 ligase and hammerhead ribozyme are used as platforms for the selection of allosterically-controlled molecules. Selections are designed to yield ribozymes that specifically respond to any target. Nucleic acid sensor molecules with cross-specificity (i.e. modulated by alternate target molecules, or by alternate ligand-bound states, or by alternate post-translationally modified forms of protein or peptides) are selected against by including the undesired form of the target in an initial negative selection step. The specific sequence of operations comprising the selection experiment is outlined in FIG. 1A and 1B for ligase and hammerhead-based selections, respectively
- Nucleic acid sensor molecules which are derived from in vitro selection are tested as target modulated biosensors.
- the pool of NASMs is cloned into various plasmids that contain a T7 promoter transformed into E. coli .
- Individual NASM encoded DNA clones are isolated, linearized and the NASM is transcribed in vitro to generate NASM RNA.
- the NASM RNAs are then tested in target modulation assays which determine the rate or extent of ribozyme modulation.
- target modulation assays which determine the rate or extent of ribozyme modulation.
- the extent of target dependent and independent reaction is determined by quantifying the extent of endonucleolytic cleavage of an oligonucleotide substrate.
- the extent of reaction can be followed by electrophoresing the reaction products on a denaturing PAGE gel, and subsequently analyzed by standard radiometric methods.
- the extent of target dependent and independent reaction is determined by quantifying the extent of ligation of an oligonucleotide substrate, resulting in an increase in NASM molecular weight, as determined in denaturing PAGE gel electrophoresis.
- NASM sequences are then further modified to render (the NASM sequences) them suitable for the optical detection applications that are described in detail below.
- these NASMs are used as fluorescent biosensors affixed to solid supports, as fluorescent biosensors in homogeneous FRET-based assays, and as biosensors in SPR applications.
- Ligase derived NASM clones are further modified to render them suitable for a number of detection platforms and applications; including, but not limited to, the PCR and nucleotide amplification detection methods; fluorescent-based biosensors detectable in solution and chip formats; and as in vivo, intracellular detection biosensors.
- the following protocol describes a method for preparing an array of immobilized effector oligonucleotides with terminal amine groups attached to a solid substrate derivatized with aldehyde groups.
- the resulting array can then be used to spatially address (i.e., the sequence of nucleotides for each effector oligonucleotide can be synthesized as a cognate to the effector oligonucleotide binding domain of a nucleic acid sensor molecule specific for a particular target molecule) and immobilize the nucleic acid sensor molecules prior to their use in a solid-phase assay (see, e.g., Zammatteo et al., 2000):
- the nucleic acid sensor molecules can be, e.g., those which possess either ligating or cleaving activity in the presence of a target molecule. (See, e.g., FIGS. 2A and B for the ligater, FIG. 5 for the cleaver).
- the nucleic acid sensor molecules are bound to a solid substrate directly via their 3′ termini.
- the attachment is accomplished by oxidation (using, e.g., Na periodate) of the 3′ vicinal diol of the nucleic acid sensor molecule to an aldehyde group.
- This aldehyde group will react with a hydrazide group to form a hydrazone bond.
- the hydrazone bond is quite stable to hydrolysis, etc., but can be further reduced (for example, by treatment with NaBH 4 or NaCNBH 3 ).
- adipic acid dihydrazide (ADH, a bifunctional linker) to derivatize an aldehyde surface results in a hydrazide-derivatized surface which provides a linker of approximately 10 atoms between the substrate surface and point of biomolecular attachment (see Ruhn et al., 1994; O'Shaughnessy, 1990; Roberston et al., 1972, Schluep et al., 1999; Chan et al., 1998).
- Preparation of a hydrazide-terminated surface via ADH treatment can be accomplished by treating an aldehyde-derivatized substrate according to the following protocol:
- a nucleic acid sensor molecule which is modulated by the estrogen receptor (ER) ligand binding domain (LBD) is obtained by in vitro selection methods to identify candidate nucleic acid sensor molecules that are modulated by an estrogen receptor LBD.
- the full length gene for the estrogen receptor is known.
- One source of the full-length estrogen receptor clone is Acc. No. M12674 (see also Greene et al., Science 231:1150–54, 1986).
- the clone includes a 2092 nucleotide mRNA with the sequence presented in Table 3 below:
- polypeptide encodes a polypeptide with the amino acid sequence presented in Table 4 below:
- nucleic acid sensor molecules which are activated by ER-LBD not bound to ligand A library of up to 10 17 variants of in vitro synthesized (1 , ⁇ M) nucleic acid sensor molecules is allowed to react with purified apo-ER-LBD at a final concentration of 1 uM. Selection of catalytic nucleic acid sensor molecules and optionally, generation of an optical NASM, is carried out by procedures outlined in prior examples and elsewhere herein.
- Stable complexes of ER-LBD and estradiol ligand are formed with from 1–10 equivalents of ligand.
- a library of up to 10 17 variants of in vitro synthesized ribozymes is then allowed to react with purified ER-LBD-Estradiol at a final complex concentration of luM.
- Selection of allosterically activated ribozymes is carried out by procedures outlined the detailed description. Selection of nucleic acid sensor molecules which are modulated by the ER-LBD-Tamoxifen complex stable complexes of ER-LBD and tamoxifen ligand are formed with from 1–10 equivalents of ligand.
- Selection of catalytic nucleic acid sensor molecules target modulated ribozymes (nucleic acid sensor molecules) is carried out by procedures outlined in prior examples.
- NHR nuclear hormone receptor
- NCOA1 nuclear receptor coactivator 1 Binds to steroid hormone receptors NCOR1 nuclear receptor co-repressor 1 Thyroid hormone receptor without TH NCOR2 nuclear receptor co-repressor 2 RXR without retinoic acid and THR without TH NR0B1 nuclear receptor subfamily 0, group B, member 1 NR0B2 nuclear receptor subfamily 0, group B, member 2 NR1D1 nuclear receptor subfamily 1, group D, member 1 NR1H2 nuclear receptor subfamily 1, group H, member 2 NR1H3 nuclear receptor subfamily 1, group H, member 3 Intertacts with RXR NR1H4 nuclear receptor subfamily 1, group H, member 4 Bile acid, farnesol, or chenodoxycholic acid NR1I2 nuclear receptor subfamily 1, group I, member 2 pregnane NR1I3 nuclear receptor subfamily 1, group I, member 3 androstane S NR2C1 nuclear receptor subfamily 2, group C,
- N-terminally GST-tagged or N-/C-terminally His-tagged nuclear hormone receptor ligand binding domains defined on the basis of structural homology are cloned and expressed in BL21 (DE3)-pLysS E. coli cells, or are cloned and expressed in standard baculovirus expression systems.
- Human NHR LBDs (homologous to ER-alpha residues including the region aa 297–554) are purified from GSH-sepharose or nickel affinity columns by published procedures available from the manufacturers. LBDs are produced in a either a parallel or serial fashion and the purified proteins are stored in buffer containing 50 mM TrisHCl, 1 mM EDTA, 1 mM DTT and 50–250 NaCl/SCN salt, pH 7 to pH 8.5, 10% glycerol or other stabilizing agent. Protein sequence and MW is verified by electrospray LC-MS mass spectrometry.
- nucleic acid sensor molecules which are modulated by NHR-LBD not bound to ligand A library of up to 10 17 variants of in vitro synthesized ribozymes (1 ⁇ M) containing a plurality of potential target modulation domains and linker domains coupled to the catalytic domain of the ribozyme, is allowed to react with purified apo-NHR-LBDs at a final concentration of 1 uM LBD. Selection of catalytic nucleic acid sensor molecules is carried out by procedures outlined in the Detailed Description. Selections are carried out in parallel fashion. Selections can also be carried out in mixed pools of anywhere from 5–10 NHR-LBDs.
- RNA pools may separated into aliquots which may then be used to carry out in vitro selection against single NHR-LBD proteins to yield unique nucleic acid sensor molecules selective for multiple NHR-LBDs.
- Stable complexes of each NHR-LBD are formed with from 1 –10 equivalents of ligand.
- a library of up to 10 17 variants of in vitro synthesized ribozymes (1 ⁇ M) containing a plurality of potential target modulation domainsland linker domains coupled to the catalytic domain of the ribozyme is then allowed to react with purified NHR-LBD-Ligand complexes at a final complex concentration of 1uM.
- Selection of catalytic nucleic acid sensor molecules is carried out by procedures outlined in the Detailed Description and Example 1 below. Selections are carried out in parallel fashion. Selections can also be carried out in mixed pools of anywhere from 5–10 NHR-LBD-Ligand complexes.
- RNA pools may separated into aliquots which may then be used to carry out in vitro selection against single NHR-LBD-Ligand complexes to yield unique nucleic acid sensor molecules selective for all NHR-LBDs, bound to their ligands.
- the invention provides an in vitro selection protocol against purified LBDs, bound to their ligands or not, for each known NHR.
- In vitro selections can be carried out with less than 1 mg of the purified forms of the LBDs.
- the selection of nucleic acid sensor molecules can be done in vitro with mixed pools of LBD and subsequently deconvoluted after selection is complete.
- the final selection can be carried out with fractionally purified extracts containing a slight excess of recombinant LBD.
- the LBD is expressed in E. coli , or insect cell lines or mammalian cell lines.
- the selection is carried out in cell free lysates in which the LBD is expressed in an in vitro transcription-translation procedure such as is described in the literature or can be purchased using common reagents from Roche or Promega.
- the fractionated or purified LBDs are combined with known ligands, (as described above) agonist, antagonists or partial agonist/antagonists to form stable complexes, and these complexes are then used for in vitro selection of nucleic acid sensor molecules.
- known ligands, (as described above) agonist, antagonists or partial agonist/antagonists to form stable complexes, and these complexes are then used for in vitro selection of nucleic acid sensor molecules.
- a signal Upon interaction of the nucleic acid sensor molecule with the NHR-LBD, a signal will be generated detectable to an external monitoring device. In this manner, the activation state of any or all NHRs can be monitored in vivo or in vitro as will be described in detail in subsequent examples.
- Beta-2 adrenergic receptor The full-length gene for the Beta-2 adrenergic receptor is described (Emorine et al., Proc.
- amino acid sequence of the polypeptide encoded by the nucleic acid sequence is set forth in Table 7 below:
- Beta-2 adrenergic receptor or cytoplasmic loop II or III or helix VII is cloned, expressed and purified from E. coli or baculovirus infected cells (Hampe, et al., J Biotechnol 77:219–234 (2000)) according to published procedures, and incorporated into detergent micelles to simulate the cellular milieu (Min, et al., J Biol Chem 268:9400–9404 (1993)).
- a library of up to 10 17 variants of in vitro synthesized ribozymes (1 ⁇ M) containing a plurality of potential target modulation domains and linker domains coupled to the catalytic domain of the ribozyme is allowed to react with purified Beta-2 adrenergic receptor at a final concentration of 1 uM.
- Selection of catalytic nucleic acid sensor molecules is carried out by procedures outlined in Example 1.
- nucleic acid sensor molecules which are activated by the butoxamine- Beta-2 adrenergic complex. 1:1 complexes of butoxamine and purified Beta-2 adrenergic receptor are formed and selection of catalytic nucleic acid sensor molecules is carried out by procedures outlined in Example 1.
- nucleic acid sensor molecules which are activated by the isoproterenol- Beta-2 adrenergic complex is accomplished as follows. 1:1 complexes of isoproterenol and purified Beta-2 adrenergic receptor are formed and selection of catalytic nucleic acid sensor molecules is carried out by procedures outlined in Example 1 and the Detailed Description.
- GPCR G-protein coupled receptors
- All 400 plus GPCRs are produced in either a serial or parallel fashion and the purified proteins or peptides stored in buffer containing 50 mM Tris-HCl, 1 mM EDTA, 1 mM DTT, and 50–250 mM NaCl/SCN salt, pH 7 to pH 8.5, 10% glycerol or other stabilizing agent.
- orexin receptor 2 [ Homo sapiens ] ref
- galanin receptor 2 [ Homo sapiens ] >gi
- orexin receptor 1 [ Homo sapiens ] ref
- G protein-coupled receptor 58 [ Homo sapiens ] ref
- opioid receptor mu 1 [ Homo sapiens ] ref
- rhodopsin; rhodopsin (retinitis pigmentosa . . . ref
- interleukin 8 receptor beta [ Homo sapiens ] ref
- neuropeptide Y receptor Y5 [ Homo sapiens ] ref
- G protein-coupled receptor 52 [ Homo sapiens ] ref
- formyl peptide receptor-like 2 [ Homo sapie . . . ref
- adrenergic, alpha-2A-, receptor [ Homo sapi . . . ref
- 34426 [ Homo sapiens ] ref
- similar to PROBABLE G PROTEIN-COUPLED RECE . . . ref
- endothelin receptor type B isoform 1 [Hom . . . ref
- neuromedin U receptor 2 [ Homo sapiens ] ref
- endothelin receptor type A [ Homo sapiens ] ref
- melanocortin 3 receptor [ Homo sapiens ] ref
- G protein-coupled receptor 42 [ Homo sapiens ] ref
- a library of up to 10 17 variants of in vitro synthesized ribozymes is allowed to react with purified GPCRs at a final concentration of luM GPCR.
- Selection of catalytic nucleic acid sensor molecules is carried out by procedures outlined in prior examples. Selections are carried out in parallel fashion. Selections can also be carried out in mixed pools of anywhere from 5–10 GPCRs. In the final rounds of nucleic acid sensor molecule selection, the RNA pools may separated into aliquots which may then be used to carry out in vitro selection against single GPCR proteins to yield unique nucleic acid sensor molecules selective for all 400 plus GPCRs.
- Stable complexes of each GPCR and corresponding -ligand are formed with from 1–10 equivalents of ligand.
- Selection of catalytic nucleic acid sensor molecules is carried out by procedures outlined in the Detailed Description. Selections are carried out in parallel fashion. Selections can also be carried out in mixed pools of anywhere from 5–10 GPCR-ligand complexes. In the final rounds of nucleic acid sensor molecule selection, the RNA pools may separated into aliquots which may then be used to carry out in vitro selection against single GPCR-ligand complexes to yield unique nucleic acid sensor molecules selective for all GPCR-ligand complexes.
- nucleic acid sensor molecules that specifically recognize conformational isoforms of GPCRs that are revealed upon ligand binding can also be selected for using the methods described herein.
- GPCRs consist of three domains: an extracellular N-terminus, a central domain of seven trans-membrane helices, and a cytoplasmic C-terminus.
- Activation of GPCRs is induced by ligand binding, which causes a conformational change in the receptor transmitting a signal across the plasma membrane to intracellular members of a signaling pathway. This method provides for generation of unique biosensors for each GPCR.
- a library of up to 10 17 variants of in vitro synthesized ribozymes is allows to react with peptide fragments of the GPCRs comprising regions of the GPCR that are exposed upon activation. Nucleic acid sensor molecules which recognize these domains are then capable of recognizing them within the context of the full length protein and hence recognize the activated state of the GPCR. Examples of the use of peptide fragments to generate nucleic acid sensor molecules which recognize the full length protein are known in the art and are incorporated herein. See, for example, data on nucleic acid sensor molecule selection and recognition of HIV rev peptide and full length protein [Michael Robertson, 2001, University of Texas, Austin, Ph.D. Dissertation]. In the case of HIV rev, unique peptide sequences are recognized both as free peptides and in the context of the full protein.
- Nucleic acid sensor molecules specific for GPCRs are generated by in vitro selection for recognition of peptide fragments of the GPCRs comprising regions of the GPCR that are exposed to the inside face of the plasma membrane when ligand binds to the GPCR.
- Exemplary suitable GPCR peptide fragments are presented in Table 9. Nucleic acid sensor molecules which recognize these peptides are then capable of recognizing them within the context of the full length protein and hence recognize the activated state of the GPCR.
- Nucleic acid sensor molecules are generated to be specific to various subclasses of PDEs are used for understanding the role of PDE subclasses in the molecular pathology of disease, and as PDE target validation.
- nucleic acid sensor molecules which are modulated by each of four PDE4 subtypes have specific utility in understanding the role of PDE4 in human disease.
- the four subclasses of PDE4 are differentially localized between cell type and also the PDE4 isozymes differ with respect to their intracellular localization. This differential localization, together with the transcriptional regulation and post-translational modification, controls the cAMP level in cells in response to the cells' environment (Muller, Engels et al. 1996).
- the cDNAs for four PDE4 subtypes are cloned from human blood leukocyte cDNA library as described (Wang, Myers et al. 1997). Each subclass of PDE4 is expressed as recombinant protein fused with a His-tag in E. coli or SF9 insect cells (Richter, Hermsdorf et al. 2000) (Wang, Myers et al. 1997). The expressed proteins are purified through Ni ++ columns according to established procedures. Catalytic nucleic acid sensor molecules modulated by the four subclasses of PDE4 are then selected as described above. The nucleic acid sensor molecules are tested for their subclass specificity, by determining the switch factor.
- Tissue samples from different organs can be prepared, and the cell extract can be tested against a panel of PDE4 subclass-specific nucleic acid sensor molecules to determine the protein level of each PDE in the organ.
- PDE4 subclass-specific nucleic acid sensor molecules to determine the protein level of each PDE in the organ.
- PDE1–11 different classes of PDE (PDE1–11) are expressed in a tissue-specific manner and play different physiological roles (Conti 2000), and the subcellular localization of PDE regulates their activity. Accordingly, the nucleic acid sensor molecule can be used to determine the subcellular localization of each PDE from fractionated cell extracts (Bolger, Amsterdam et al. 1997), or in situ hybridization technique (Sirinarumitr, Paul et al. 1997).
- the nucleotide sequences of a cAMP-dependent PDE nucleic acid sensor molecule and cGMP-dependent nucleic acid sensor molecule are presented in Table 10. Allosteric domains are 15 shown in bold font and the cleavage site nucleotide is underlined.
- CGMP modulated NASMs that are configured for homogeneous, solution based fluorescence assays (FRET) are shown the FIG. 62 .
- Multiplexed camp and cGMP-modulated FRET-sensor NASM-based assays are shown in FIG. 65B .
- the optical NASMs modulated by cAMP and cGMP are used in PDE assays as described in detail below.
- cAMP and cGMP-dependent nucleic acid sensor molecules were added to a solution containing various amounts of PDE and the corresponding cyclic nucleotide (cAMP or cGMP). A decreasing amount of the cyclic nucleotide was found to correspond to the increasing amount of PDE. These results demonstrate that the cyclic nucleotide-dependent nucleic acid sensor molecules can be used to measure PDE activity.
- the calmodulin activated PDE specific for cGMP was used under the following enzyme assay conditions: Assay conditions (10 mM Tris, 20 mM MgCl 2 , 100 FM CaCl 2 ) 200 nM cGMP-NASM; the assay is quenched with 0.1% SDS and then 200 nM cGMP-NASM is added to the mixture. Remaining cGMP was determined by the amount of conversion of nucleic acid sensor molecule to product using a gel based radioactive product-release (gel-shift) assay format. The nucleic acid sensor molecule is active in a variety of formats and is not inhibited by GMP produced by the components of the PDE assay.
- the cAMP nucleic acid sensor molecule is active in a variety of assay formats and is not inhibited by GMP produced by the components of the PDE assay.
- the conversion of cGMP to GMP is followed by the optical NASM formats described in FIGS. 62–72 .
- HTS High Throughput Screening
- a cAMP-dependent nucleic acid sensor molecule is used in HTS assays for PDEs (PDE1, PDE2, PDE3, PDE4, PDE7, PDE8, PDE10, and PDE11).
- cGMP-dependent-nucleic acid sensor molecules can be used in HTS assays for PDEs (PDE5, PDE9, PDE10, and PDE I1). Representative cAMP-dependent and cGMP-dependent PDE nucleic acid sensor molecules are shown above, and in FIGS. 62–72 for all solution and chip-based NASM assay configurations.
- Each class of PDE can be isolated from human tissue (Ballard, Gingell et al. 1998), or expressed as recombinant proteins in various system (e.g. E coli , SF9 cells).
- the nucleic acid sensor molecule monitors the PDE activity in the presence and the absence of candidate drugs.
- PDE and its substrate i.e., cAMP and/or cGMP
- a multiwell chamber e.g., 96, 384 well
- concentration of compounds for screening e.g., 96, 384 well
- the reaction is terminated by changing the buffer conditions (e.g., addition of sufficient amount of EGTA, shifting buffer pH), or by separating enzyme and substrate (e.g., filtration).
- nucleic acid sensor molecules are added to measure the altered concentration of the substrate, cAMP and cGMP.
- optical nucleic acid sensor molecules can be added without terminating the PDE activity. CAMP and cGMP modulated these HTS assays, as described in FIG. 62 and FIG. 63 .
- cAMP- or cGMP-dependent nucleic acid sensor molecules can also be used to characterize the IC50 of the drug in vitro.
- a PDE assay is performed with serial dilutions of a compound of interest. Purified PDE or, alternatively, soluble extract from cells (Moreland, Goldstein et al. 1998) can be used for the assay. The assay can be performed as described herein.
- cAMP- or cGMP-dependent nucleic acid sensor molecules are used to characterize the IC50 values of drug candidate in vitro by analyzing cAMP-or cGMP synthesized by adenyl and guanyl cyclases.
- Adenylate and guanylate cyclase assays are set up with serial dilution of a compound of interest.
- Membrane fractions containing adenylate and guanylate cyclases are used for the assay.
- the assay can be setup as described in the literature using ATP or GTP as the substrate.
- Nucleic acid sensor molecules are generated that interact with the active sites of PDEs.
- PDE4 proteins are obtained as described above.
- the nucleic acid sensor molecules are selected against PDE4 with negative selection in the presence of PDE4 complexed with subnanomolar inhibitor (e.g., Rolipram).
- subnanomolar inhibitor e.g., Rolipram
- the nucleic acid sensor molecule is modulated by free, uncomplexed PDE4, the PDE nucleic acid sensor molecules compete for PDE binding with inhibitors.
- the direct inhibition by the nucleic acid sensor molecules can be tested using commercially available PDE assay kits (Amersham SPA assay kit for cAMP, Molecular Devices HEEP cAMP assay kit).
- PDE assay kits Amersham SPA assay kit for cAMP, Molecular Devices HEEP cAMP assay kit.
- the competition is performed by monitoring the signal from the nucleic acid sensor molecules in the presence of various inhibitors.
- Purified PDE or soluble cell extract from appropriate source e.g., Wistar rat brain (Andersson, Gemalmaz et al. 1999)
- nucleic acid sensor molecules 100 rtM
- nucleic acid sensor molecules 100 rtM
- the changes in the initial rate of each nucleic acid sensor molecule response in the presence and the absence of the drug can be monitored in homologous system. Multiple PDEs can be tested against a same compound in the same well. This assay is expanded if desired to determine the tissue specific interaction of each class of PDE and any compounds.
- Nucleic acid sensor molecules are used to monitor the cellular cAMP and cGMP level in response to the injection of drugs in tissue or rat cell lines. For example, strips of human corpus collasum (HCC) tissue or rat HCC cell lines (N1S1 and McA-RH7777 cells) can be incubated in the presence and absence of a drug against PDE5 (Min, Kim et al. 2000) (Arora, de Groen et al. 1996), and the cGMP specific nucleic acid sensor molecule can be used to measure the amount of cGMP in soluble extract from the tissue or cell sample as described above.
- HCC human corpus collasum
- N1S1 and McA-RH7777 cells strips of human corpus collasum (HCC) tissue or rat HCC cell lines (N1S1 and McA-RH7777 cells) can be incubated in the presence and absence of a drug against PDE5 (Min, Kim et al. 2000) (Arora, de Gro
- the cAMP, and cGMP-dependent nucleic acid sensor molecules are incorporated into a reporter-gene plasmid as described above.
- This construct is introduced in cell lines by standard transfection (e.g. lipid-mediated transfection, calcium-phosphate co-precipitation, microinjection, electroporation, retroviral infection). The level of cGMP or camp in the cell is measured by the expression of the reporter gene.
- Nucleic acid sensor molecules are selected for the catalytic domains of each class of PDE1–11 are prepared. These nucleic acid sensor molecules are then used for target validation as described above.
- nucleic acid sensor molecules are used in competitive inhibition assays.
- Competitive nucleic acid sensor molecules are used in in vitro assays to screen compounds against multiple PDEs in multiplex assays, as described above.
- Nucleic acid sensor molecules modulated by drug leads or drug compounds used in preclinical testing and clinical trial for pharmacokinetics studies are selected and identified as described in the Detailed Description.
- a human serum sample with or without the administration of a drug or other therapeutic agent is prepared (Berzas Nevado, Rodriguez Flores et al. 2001).
- the nucleic acid sensor molecule is added to the sample.
- the nucleic acid sensor molecule is then used in optical or PCR based detection methods as described in later examples, thereby quantifying the drug concentration in the whole serum or extract from the serum.
- the nucleic acid sensor molecule modulated by various drugs or leads can also be used to determine the drug distribution in an animal model system.
- a drug can be administrated in animals (e.g., Sprague Dawley rats, New Zealand white rabbit) by IV or orally (Andersson, Gemalmaz et al. 1999) (Jeremy, Ballard et al. 1997).
- animals e.g., Sprague Dawley rats, New Zealand white rabbit
- Oralsson Gemalmaz et al. 1999
- Jeremy, Ballard et al. 1997 At various time intervals after drug administration, the animal is sacrificed.
- Various organs are tested for the drug distribution by in situ hybridization using the drug-dependent nucleic acid sensor molecule.
- each organs/serum is prepared for pharmacokinetic studies.
- Nucleic acid sensor molecules against a test compound are used to test cell permeability of the compound. These nucleic acid sensor molecules can be incorporated into a reporter gene construct, if desired, to make a drug-sensitive reporter gene system as described above. This construct is introduced in established cell lines (e.g. HELA cells, 293 cell, CHO cell). The cells are cultured in various concentrations of drug in media, and the expression of the reporter gene is monitored.
- established cell lines e.g. HELA cells, 293 cell, CHO cell.
- Lysis Buffer 500 mM KCl, 20 mM Tris-Cl, pH 8.0, 10% glycerol, 0.5% NP-40, supplemented with 1 Complete EDTA-Free Protease Inhibitor tablet (Roche) per 50 ml) per liter of culture.
- Cells were frozen in liquid nitrogen and stored at ⁇ 80 ° C. Lysis and clarification was accomplished by rapid thawing in a 40° C. bath for 10 minutes, incubation at 4° C. for thirty minutes, and centrifugation for 60 minutes at 100,000 ⁇ g.
- MCAC metal chelate affinity chromatography
- ERK For purification of ERK, cells were grown to an OD600 of 0.7 at 37° C. and induced with 1 mM IPTG for 2 hours at 37° C.
- the MCAC fraction was diluted tenfold with Buffer B (20 mM HEPES 8.0, 1 mM DTT, 1 mM EDTA, 10% glycerol) and loaded onto a 5 ml HiTrap Q column (Amersham Biosciences) previously equilibrated with Buffer B plus 50 mM KCl.
- Buffer B (20 mM HEPES 8.0, 1 mM DTT, 1 mM EDTA, 10% glycerol)
- Buffer B 5 ml HiTrap Q column
- ERK was eluted in a 10 column gradient to Buffer B plus 500 mM KCI, at a flow rate of 1.5 ml/min, taking 2.5 ml fractions.
- the column was washed with 5 column volumes Buffer C, 5 column volumes Buffer C plus 50 mM NaCl, eluted with a 7 column volume gradient to Buffer C plus 300 mM NaCl, and finished with 5 column volumes of Buffer C plus 300 mM NaCl.
- the SP column was run at 0.5 ml/min collecting 0.5 ml fractions.
- Ion-exchange chromatograpy conditions for p38gamma, h-Ras, and RhoA were identical to ERK, except KCl was substituted for NaCl in Buffer D additions.
- KCl was substituted for NaCl in Buffer D additions.
- For purification of p38gamma cultures were grown to an OD600 of 0.8 and induced with 0.5 mM IPTG for 3 hours at 30° C.
- RhoA and h-Ras cells were grown at 37° C. to an OD600 of 0.8 at 37 ° C., and induced with 0.5 mM IPTG for 3 hours.
- MCAC fractions were diluted two fold with ddH 2 O, and dialyzed into Buffer D (20 mM HEPES 7.4, 1 mM DTT, 1 mM EDTA, 10% glycerol) plus 50 mM NaCl. Dialysate was applied to a 1 ml HiTrap Q column (Amersham Biosciences), washed with 5 column volumes Buffer D plus 50 mM NaCl, eluted with 8 column volumes to Buffer D plus 500 mM NaCl, and flushed with 3 column volumes Buffer D plus 500 mM NaCl. Column flow rate and fractionation parameters were identical to Jnk1 purification.
- p38delta For purification of p38delta, cells were grown at 37° C. to OD600 1.0 and induced with 0.5 mM IPTG for 2 hours. MCAC fractions were dialysed against Buffer B plus 100 mM KCI, then diluted threefold with Buffer B immediately before loading on a 1 ml HiTrap SP column. The column was washed with 5 column volumes of Buffer B plus 50 mM KCl, and eluted with 10 column volumes to Buffer B plus 500 mM KCl, at a flow rate of 0.5 ml/min taking 0.5 ml fractions.
- Mek1 For purification of Mek1, a fresh transformation was grown for 12 hours at 30° C., split 1:100 into fresh media, and grown to OD600 0.7 at 37° C., then induced with 1 mM IPTG for 3 hours.
- MCAC fractions were desalted on a PD-10 column into Buffer E (40 mM HEPES, pH 7.4, 1 mM EDTA, 1 mM DTT, 10% glycerol) and applied to a 1 ml HiTrap Q column. The column was washed with 10 CV Buffer E and MekI was eluted in a single step of Buffer E plus 85 mM NaCl.
- Buffer E 40 mM HEPES, pH 7.4, 1 mM EDTA, 1 mM DTT, 10% glycerol
- Mek1-DD Human and Erikson, 1994
- cells were grown to OD600 of 0.7 at 37C and induced with 0.5 mM IPTG for 3 hours. Purification conditions were identical to RhoA and H-ras.
- Recombinant ERK and Mek1-DD were mixed in a 20:1 molar ratio in 1 ⁇ Kinase Activation Buffer (100 mM NaCl, 10 mM MgCl 2 , 10 mM HEPES, pH 8.0, 10% glycerol).
- ATP was added to 1 mM and the mixture incubated for 30 minutes at 23° C. Excess ATP was removed from the reaction by desalting on a PD-10 column into Buffer G (20 mM HEPES, pH 8.0, 2 mM DTT, 10% glycerol) plus 25 mM NaCl.
- the eluate was loaded on a 1 ml HiTrap Q column and washed with 20 column volumes of Buffer G plus 100 mM NaCl.
- ppERK was eluted with a 60 column volume gradient to Buffer G plus 300 mM NaCl at 0.5 ml/min, collecting 0.5 ml fractions.
- Fractions containing ppERK were diluted six fold with buffer G and reapplied to a 1 ml HiTrapQ column.
- the column was washed with 50 mM NaCl, and the ppERK was eluted with a single step of Buffer G plus 500 mM NaCl.
- FIG. 1B illustrates an RNA ribozyme library derived from a hammerhead sequence pool consisting of up to 10 17 variants of randomized sequences appended to the hammerhead ribozyme motif ( FIG. 19 ).
- the ribozyme library is prepared on DNA synthesizer. Random nucleotides are incorporated during the synthesis to generate pools of roughly 10 17 molecules.
- FIG. 19 illustrates linker scanning library designed to identify cis-hammerhead NASMs that are modulated by the protein kinase ERK.
- the linker library was generated by appending an ERK target modulation domain to the randomized linker domain to create a library of potential ERK-modulated cis-hammerhead NASMs.
- the linker library of ERK-modulated cis-hammerhead NASMs consists of up to 65,000 variants. Most molecules in the randomized NASM pools are non-functional NASMs.
- NASMs Sorting among the billions of NASMs to find the desired molecules starts from the complex sequence pool, whereby desired target-modulated NASMS are isolated through an iterative in vitro selection process: in addition to the target-activated ribozymes that one desires, the starting pool is usually dominated by either constitutively active or completely inactive ribozymes. The selection process removes both types of contaminants. In a following amplification stage, thousands of copies of the surviving sequences are generated to enable the next round of selection. During amplification, random mutations can be introduced into the copied molecules—this ‘genetic noise’ allows functional nucleic acid sensor molecules to continuously evolve and become even better adapted as target-activated enzymes. The entire experiment reduces the pool complexity from 1017 molecules down to around 100 NASMs that require detailed characterization.
- Negative selections were set up in which 100 gl reactions containing the library (c.f. FIG. 19 , where the linker library of ERK NASMs consists of up to 65,000 variants, alternatively the library consists of up to 10 17 variants of randomized sequences appended to the hammerhead ribozyme motif) of target modulated ribozymes containing randomized target modulation domains and randomized linker regions (1 ⁇ M), were incubated at 72° C., 5 seconds, followed by 25° C. for lhr in a reaction buffer containing KCl (0–150 mM), HEPES pH 7.5 (20 mM), MgCl 2 (20 mM), EDTA (0.5 mM).
- RNA molecules (radiolabeled internally) were then removed from the mixture by electrophoresis through a 7M urea, 8% PAGE gel, followed by cutting the uncleaved band from the gel. Detection of cleaved and uncleaved RNAs were carried out using a phosphor-imager system. The uncleaved hammerhead-derived RNAs were then subjected to a round of positive selection for ERK, or ppERK, target modulation, by incubating the pool of RNA in selection to which the protein target (50 nM to 1 ⁇ M ERK, or 50 nM to 1 ⁇ M ppERK) were added, and the mixture was further incubated at 37° C.
- the protein target 50 nM to 1 ⁇ M ERK, or 50 nM to 1 ⁇ M ppERK
- RNA molecules (radiolabeled internally) were then isolated and removed from the mixture by electrophoresis through a 7M urea, 8% PAGE gel, followed by cutting the cleaved band from the gel. incubated with reverse transcription mix at 65° C. for 1 hour using a thermostable reverse transcriptase. The pool was subsequently separated from the reverse transcription mixture by filtration and was then amplified using PCR first with the substrate 3-specific 5′-PCR primer and the library-specific 3′-PCR primer, and secondly with the regeneration 5′-PCR primer and the library-specific 3 ′-PCR primer in order to add the T7 promoter. Transcriptions were performed with these PCR products directly and after denaturing PAGE purification the entire process was repeated for several rounds with assays run after every round.
- Cleavage assays were performed using radiolabeled RNA and analytical denaturing polyacrylamide gel elecrophoresis (PAGE) (gel-based assays). Assays were performed upon both the library and clonal sequences. In a representative gel-based assay transcription was performed in the presence of alpha- 32 P-labelled UTP, and the resultant transcripts were gel-purified using denaturing PAGE. Assay mixtures were then made in which 10 ⁇ l reactions containing RNA (1u ⁇ M), and protein target (1 ⁇ M) were incubated at 37° C.
- PAGE polyacrylamide gel elecrophoresis
- ERK and ppERK modulated nucleic acid sensor molecules were generated by a strategy combining both engineering and in vitro selection, FIG. 19 .
- Target modulation domains selected for binding to ERK and to the phosphorylated form of ERK (ppERK) are the starting point of the engineering efforts (Seiwert et al. 2000). These target modulation domains when isolated as discrete aptamers specifically recognize ERK but do not detectably interact with other mitogen-activated protein kinases such as Jun N-terminal kinase or p38 (as monitored by the ability to inhibit kinase activity).
- An aptamer (target modulation domain) selected for ppERK binding efficiently discriminates between phosphorylated and non-phosphorylated forms of the protein, binding ppERK with a K D of 4.7 nM and ERK with a K D of 50 nM (Seiwert et al. 2000).
- non-functional NASMs e.g., certain ribozyme NASMs, derived through direct engineering, when assayed as described above, exhibit little or no cleavage activity in the absence of ERK and no detectable ERK-modulation of cleavage activity in the presence of ERK.
- Inactive NASMs remained unresponsive to added ERK protein in concentrations ranges tested from 50 nM to 5 uM. Hence, ERK concentrations greater than 1000 fold over the aptamer K D values does not result in target modulation of the NASM, suggesting that functional NASM activity will require more than a finctional target modulation domain appended to a ribozyme motif.
- Example 1 In vitro selection of cis-hammerhead NASMs based on the 65,000 member ERK target modulated ribozyme library shown in FIG. 19 , were performed as described in Example lA. In vitro selection of hammerhead derived ERK and ppERK NASMs, and the subsequently identified and characterized a series of ERK-modulated NASMs are shown in FIG. 19 , and in Table 11. The detailed methods for the analysis ERK-modulated NASM clones is given in Example 1 A Cloning, sequencing and characterization of individual NASMs.
- RNA molecules were then removed from the mixture by incubation with immobilized neutravidin. The flow through was collected by filtration and to this was added more substrate 3 (2 ⁇ M), protein target (1 ⁇ M ERK or ppERK) and RNase inhibitor were added and the mixture was further incubated at 25 ° C for between 15 minutes and 1 hour.
- RNA molecules were then captured by incubation with immobilized neutravidin and, after washing, the matrix was incubated with reverse transcription mix at 65° C. for 1 hour using a thermostable reverse transcriptase.
- the matrix was subsequently separated from the reverse transcription mixture by filtration and was then amplified using PCR first with the substrate 3-specific 5′-PCR primer and the library-specific 3′-PCR primer, and secondly with the regeneration 5′-PCR primer and the library-specific 3′-PCR primer in order to add the T7 promoter. Transcriptions were performed with these PCR products directly and after denaturing PAGE purification the entire process was repeated for several rounds with assays run after every round.
- Ligation assays were performed using radiolabeled RNA and analytical denaturing polyacrylamide gel elecrophoresis (PAGE) (gel-based assays), or by PCR utilizing the substrate 3-specific 5′-PCR primer (PCR-based assay). Assays were performed upon both the library and clonal sequences. In a representative gel-based assay transcription was performed in the presence of alpha- 32 P-labelled UTP, and the resultant transcripts were gel-purified using denaturing PAGE.
- PAGE polyacrylamide gel elecrophoresis
- Assay mixtures were then made in which 10 ⁇ l reactions containing RNA (1u ⁇ M), effector oligonucleotide (1.5 ⁇ M), substrate 3 (5 ⁇ M) and optionally RNase-inhibitor and protein target (1 ⁇ M) were incubated at 25° C. for between 15 min and 16 h in a reaction buffer containing protein target (1 ⁇ M ERK or ppERK), KCl (150 mM), HEPES (20 mM), MgCl2 (10 mM), EDTA (1 mM), DTT (1 mM), tRNA (0.1 mg/ml) and glycerol (10% w/v) .
- the resultant samples were quenched by the addition of EDTA and the relative extents of ligation were measured by comparison of the intensity of the corresponding bands on a denaturing PAGE observed by reading a phosphorimager plate that had been exposed to the gel.
- PCR assays were performed using the same reaction mixture except that the relative extents of ligation in different samples were compared by observing the relative rates of appearance of PCR products using the substrate 3-specific 5′-PCR primer and the library-specific 3′-PCR primers.
- the detailed methods for the analysis ERK-modulated NASM clones is given in Example 1A, Cloning, sequencing and characterization of individual NASMs.
- ERK-dependent ligase ribozymes were built on the catalytic core of the L1 ligase ribozyme of Robertson and Ellington (2000; NAR 28, 1751–1759) in which the non-conserved, stem C element was replaced with the ERK-interacting domain and joined to the catalytic core by a 2–4 base pair helical element, or “communication module”.
- Ten different ribozymes were designed, identical in sequence except for the bases in the linker domain ( FIG. 32 ). (SEQ ID NOs:109–1 16)
- Templates for transcription by T7 RNA polymerase were prepared for each ribozyme by PCR amplification using a set of three overlapping primer oligonucleotides.
- the forward, or 5′ primer TAATACGACTCACTATAGGACTTCGGCGAAAGCCGTTCGACC included the T7 RNA polymerase promoter and sequence corresponding to the 5′-proximal region of the L1 ligase catalytic core.
- RNAs were then quantified by their absorbance at 260 nm, and stored in TE buffer (10 mM Tris-HCI, 1 mM EDTA, pH 8.0) at ⁇ 20 ° C.
- Radiolabeled RNAs were prepared exactly as described above, except that a- 32 P-UTP was included in the in vitro transcription reaction.
- ppERK-dependent ligase ribozymes were built on the catalytic core of the L1 ligase ribozyme of Robertson and Ellington (2000; NAR 28, 1751–1759) in which the non-conserved, stem C element was replaced with the ERK-interacting domain and joined to the catalytic core by a 2–4 base pair helical element, or “communication module”.
- Fourteen different ribozymes were designed, identical in sequence except for the bases in the linker domain ( FIG. 41 ) (SEQ ID NO:352).
- Templates for transcription by T7 RNA polymerase were prepared for each ribozyme by PCR amplification using a set of three overlapping primer oligonucleotides.
- the forward, or 5′ primer TAATACGACTCACTATAGGACTTCGGCGAAAGCCGTTCGACC included the T7 RNA polymerase promoter and sequence corresponding to the 5′-proximal region of the L1 ligase catalytic core.
- RNAs were then quantified by their absorbance at 260 nm, and stored in TE buffer (10 mM Tris-HCl, 1 mM EDTA, pH 8.0) at ⁇ 20° C. Radiolabeled RNAs were prepared exactly as described above, except that ⁇ - 32 P-UTP was included in the in vitro transcription reaction.
- Synthetic DNA and the DNA-RNA chimeric substrates were synthesized using standard solid-phase methodology and purified by denaturing (8M urea) polyacrylamide gel electrophoresis (PAGE). Random-sequence regions of synthetic DNA were generated using a single mixed “N” bottle on the DNA synthesizer that contains all four nucleotide phosphoramidites mixed in proportions. Variable-length regions of synthetic DNA were generated by interrupting the synthesis and removing part of the reaction mixture, re-starting the synthesis and then replacing the removed material after a subsequent interruption. Templates for transcription were generated by PCR, and the transcripts thus generated were also purified by denaturing (8M urea) polyacrylamide gel electrophoresis (PAGE).
- Oligonucleotides common to all selections Substrate 3 (DNA, RNA underlined) (SEQ ID NO:321) Biotin-TEG-CATGCGACCTTACGATCAGATGACCTUGCACU Substrate 3-specific 5′-PCR primer (SEQ ID NO:322) CATGCGACCTTACGATCAGAT Regeneration 5′-PCR primer (SEQ ID NO:323) TCTAATACGACTCACTATAGGACTTCGGCGAAAGC ERK selection-specific oligonucleotides: Library (DNA) (random regions 3–5 nucleotides in length) (SEQ ID NO:324) GGACTTCGGCGAAAGCCGTTCGACCNNN(N)(N)AAGGAGGATTTCCGAAAGCGGCTA CGGTCCGCCNNN(N)(N)CTTAGACAGGAGGTTAGGTGCGTAGGTAACCGATAGTTCC G Effector (2′-O-methyl DNA), 3′-PCR primer (DNA) and RT primer (DNA) (S
- Hammerhead-derived nucleic acid sensor molecules (88 nucleotides in length) were selected from populations of nucleic acid molecules with randomized linker domain in stem II, as shown in FIG. 19 .
- the Table in FIG. 19 depicts illustrative linker-domain sequences of several of the ERK-modulated nucleic acid sensor molecules isolated from in vitro selection linker randomized clones (described in detail in Example 11). Each NASM displays a varying degree of modulation driven by addition of equal amounts (1 uM) native ERK. Individual ERK-modulated cis-hammerhead nucleic acid sensor molecules are shown in FIG. 19 .
- Clones 1-14, 1-13, 1-2, 1-6, 2-7, 2-2, 2-3, 2-13, 2-14, and 2-20 were tested in target modulation assays as described previously.
- the NASM's relative dependence on ERK is denoted in the Table in FIG. 19 by the extent of activity of the ribozyme in the presence of ERK protein.
- the time course of signal generation in the presence of nonphosphorylated ERK, phosphorylated ERK, and in the absence of protein is determined by measuring signal released over time by a radiolabeled nucleic acid sensor molecule. Significant amounts signal, corresponding to cleavage of the nucleic acid sensor molecule is observed over time only with the nonphosphorylated ERK.
- Clones1-2, 1-13 and 1-14 all display sensitivity to ERK concentration, as shown in FIGS. 20A , B and C. However, of these three clones, clone 1-14 displays the greatest enhancement in activity upon addition of ERK. Clone 1-14 is able to differentiate between varying concentrations of ERK, as indicated by the dose-dependent change in the activity of clone-14 upon the addition of 5, 10, 20, 50 and 100 nM ERK ( FIG. 21 ).
- the specificity of the interaction between clone 1-14 and ERK was assessed by measuring the activity of clone 1-14 in the presence of 50 nM ERK and increasing concentrations of known protein kinase inhibitors.
- the kinase inhibitors staurosporine and 5-iodo-tubercidin are compounds that are known bind to in an ATP-substrate competitive manner to ERK and to modulate ERK kinase catalytic activity, decreasing its ability to phosphorylate other proteins.
- kinase inhibitors would compete directly for the ATP-binding site in ERK, and thereby block NASM activation by ERK. As shown in FIG.
- FIG. 58 shows additional staurosporine competitive NASM assay results using an L1-ligase-derived NASM which is also modulated by ERK protein. Additional modifications of the 3-piece L1-ligase NASM (c.f., FIG. 36 , constructs 27 and constructs 28) render these biosensors suitable for cellular assays as intracellular biosensors (c.f., FIG. 37 and the detailed description of the 3-piece, and 1-piece ligases described in detail in Example 22). Thus, ERK-modulated nucleic acid sensor molecules are used for cell-based drug discovery and drug candidate screening.
- FIG. 22B and FIGS. 57A and 57B indicates that ERK NASMs (clone 1-14 and constructs 27 and 28) are modulated specifically by ERK only in its fully active, and not by ppERK, or by related homologues and MAP Kinase pathway molecules, For example clone 1-14 recognizes only ERK, and not related kinase MEK.
- NASMs and more specifically, the ERK and ppERK NASMs are shown here to be useful specific protein profiling biosensors.
- Cis-hammerhead nucleic acid sensor molecules Sequences of 157 ERK activated cis-hammerhead clones.
- FIG. 23A A stem-selection library of hammerhead-derived nucleic acid sensor molecules modulated by ppERK is shown in FIG. 23A .
- ppERK-modulated nucleic acid sensor molecules were designed to by joining ppERK a target modulation domain (TMD) to a hammerhead core sequence via a linker region.
- FIG. 23A shows the general structure of ppERK-modulated hammerhead ribozyme with the linker region depicted as a randomized sequence (N6).
- Individual ppERK dependent cis hammerhead RNA sequences are shown in FIG. 23B .
- FIG. 24 is a table displaying different properties of the cis hammerhead ERK sensors shown in FIG. 23B . Each construct displays variability in its sequence, its activity and its stability.
- FIG. 25 shows data for the ppERK-NASMs that have been tested in target modulation assays using in situ generated ppERK (using constitutively activated MEK activate to generate ppERK from native ERK). ppERK has been generated in situ by direct phosphorylation of ERK with constitutively active MEK mutant, MEK-EE in the presence of MgCI 2 and ATP.
- FIG. 25 also shows data for radiolabeled nucleic acid sensor molecules for ppERK-hammerhead NASM constructs 6, 10, and that were incubated at 37° C.
- nucleic acid sensor molecule reaction mixtures were subjected to 5% acrylamide gel containing 8 M Urea as shown in panel B of FIG. 25 , in order to examine the NASM endonuclease activity.
- Three constructs displayed an increase in endonuclease activity in the presence of ERK+MEK+EE with ATP as shown in FIG. 25 .
- These data indicate general methods for a NASM-based ERK activation assay: as shown in FIG. 25 , NASMs are used to directly detect MEK conversion of ERK to ppERK as detected by ppERK-modulation of nucleic acid sensor molecules.
- FIG. 31 A template for an ERK dependent ligase is shown in FIG. 31 .
- FIG. 32 discloses the different clones of ERK dependent ligases based on this template. The ERK dependence of these clones is shown in FIG. 33 .
- Constructs 17 and 19 are particularly sensitive to 2 ⁇ M ERK.
- Construct 19, also known as Clone E, was tested to see if it could be used to detect increasing concentrations of ERK.
- Construct 19 was found to have a distinct signal at 1 ⁇ M, 100 nM, and 10 nM ERK. Time dependency was also tested for Construct 19 as shown in FIG. 34 . Increasing signal from Construct 19 could be seen at 1, 2, 3, and 4 hours.
- Construct 19 can differentiate between different concentrations of ERK.
- Two formats that can be used with nucleic acid sensor molecule ligases are the 3-piece ligase platform, and the 1-piece ligase platform, both shown in FIG. 36 .
- the different platforms allow the nucleic acid sensor molecules to be used in different applications. For example, the 3-piece could be used in vitro, while the 1 -piece could be used in vivo, even intracellularly.
- the performance of these two formats is shown in FIG. 37 .
- the 2-piece platform of Construct 19 is also ERK dependent as shown in FIG. 39B .
- Ligase nucleic acid sensor molecules can be used in the presence of cell extracts.
- Construct 19 shows ERK activation dependence in the presence of 50% HeLa cell extract as shown in FIG. 40 .
- FIG. 41 shows a template for the ppERK sensitive ligase.
- FIG. 42 show the specific sequences left generalized in FIG. 41 .
- ppERK sensitivity was shown in the clones described
- FIG. 57 shows activation of 3-piece Construct 19 (DG.20.58E) (ERK2-dependent) (SEQ ID NO:111) and TK.16.118.M (ppERK2-dependent) (SEQ ID NO:123) ligases in the presence of purified proteins.
- DG.20.58E ERK2-dependent
- TK.16.118.M ppERK2-dependent
- Ligation assays (10 mM MgCl 2 , 100 mM NaCl, 30 mM Tris, pH 7.5) were performed at room temperature for 1 hour, using 1 ⁇ M ligase RNA, 1 ⁇ M effector oligonucleotide, 2 ⁇ M substrate oligonucleotide and 1 ⁇ M protein. RNAs were incubated in the presence of: (A) purified ERK, in either its non-phosphorylated or diphosphorylated form; or (B) other members of the MAP kinase pathway (Ras, MEKI and p38), and ricin. Ligase activity was measured in solution, using real-time RT-PCR detection.
- Construct 19 still has activity in low magnesium ion.
- these nucleic acid sensor molecules can be used in cell extracts and intracellularly, to detect ppERK. There is very low magnesium ion concentrations in these environments, so it is important that these nucleic acid sensor molecules maintain function even in low concentrations of magnesium ion.
- FIG. 42 shows the full sequences of the different clones of ppERK sensitive nucleic acid sensor molecules in the 3 -piece format.
- Amplicon dependent nucleic amplification is a high-throughput method for cell or tissue profiling of proteins and metabolites.
- the method can include using real-time PCR to follow the activity of nucleic acid sensor molecules over time to follow the changing concentrations of a protein or metabolite.
- the method can also comprise the use of multiplexed chips.
- a chip can be exposed to a sample solution containing proteins or metabolites to be analyzed.
- concentrations of many analytes can be shown simultaneously. This can also be extended to cellular assays as shown in FIG. 72 .
- FIG. 58 shows solution-based detection of ligase activity using real-time RT-PCR.
- Ligation reactions (10 mM MgCl 2 , 100 mM NaCI, 30 mM Tris, pH 7.5) were performed for 0.5–2 hours at room temperature using 1 ⁇ M 3-piece construct 19 (DG.20.58E), (SEQ ID NO:111) ligase, 2 ⁇ M effector oligonucleotide, 2 ⁇ M substrate oligonucleotide and purified ERK protein.
- Part A shows the effect of 293 cell extracts on the ERK concentration dependence of ligase activity.
- ERK nucleic acid sensor molecules can be used to detect ERK in a concentration dependent manner even in the presence of 293 cell extract. This detection is sensitive to the presence of staurosporine, a kinase inhibitor, which indicates that the activity of ERK is important to the detection of ERK by the nucleic acid sensor molecule.
- Amplicon dependent nucleic acid amplification technique can be used to show the downstream effects of EGF and MEK inhibitor administration in a cell.
- the diphosphorylated ERK is detected in the presence of EGF and not in the presence of the MEK inhibitor as would be expected.
- This technique can be used to screen other substances for their ability to have ERK phosphorylated. In one embodiment, this technique could be used to screen for carcinogens in certain cell types.
- the ERK-modulated 3-piece ligase is converted to the 1-piece ligase NASM by displacement of the effector oligonucleotide binding domain by a stable tetraloop , as depicted in FIG. 36 .
- the deletion of the effector oligonucleotide binding domain of construct 27 (in general), and construct 27, specifically, to generate construct 28 has no effect on the switch factor of the 1-piece ligase NASM (in comparison to the 3-piece ligase NASM), nor does it have an effect on the ERK-modulation KD value for the 1-piece ligase NASM (in comparison to the 3-piece ligase NASM), FIG. 37 .
- the ERK-modulated 3-piece ligase is converted to the 2-piece ligase NASM by linking the effector oligonucleotide substrate to the oligonucleotide substrate ( FIG. 38 ), effectively creating the oligonucleotide supersubstrate, which base pairs with both the effector oligonucleotide binding domain and the oligonucleotide substrate binding domain.
- the 2-piece ligase NASM configuration has particular utility in chip applications, described in detail in subsequent Examples (cf., FIGS. 75 and 79 ).
- Ligation reactions containing 32 P-labeled ligase RNA were analyzed by 8–12% PAGE to separate unligated and ligated products, and quantified using a PhosphorImager (Molecular Dynamics). Initial rates of ligation were calculated by linear regression from plots of the increase in ligation product over time.
- ADNA amplicon dependent nucleic acid amplification
- ligase RNA (diluted from the EDTA-quenched ligation reaction) was mixed in 25 ⁇ L of TaqMan® One-Step master mix with 300 nM each of both the forward (5′-GCGACCTTACGATCAGATGAC (SEQ ID NO:317)) and reverse (5′-CCGCACCTAACCTCCTGTCTAA (SEQ ID NO:318)) PCR primers (Integrated DNA Technologies), and 350 nM TaqMan® fluorescent probe oligonucleotide (ERK-ligase: 5′-6FAM-AAGGAGGATTTCCGAAAGCGGCTACG-TAMRA (SEQ ID NO:319); ppERK-ligase: 5′-6FAM-CGCTAGCGAATTGGTTCCTCGAAAGG-TAMRA (SEQ IDNO:320)).
- RT-PCR amplification was performed in the ABI PrismTM 7000 Sequence Detection System by incubating the reaction mixes at 48° C. for 30 min to generate the cDNA complement of the ligated RNA product, followed by 40 cycles of PCR amplification.
- the increase in fluorescence upon amplification is quantified in units of C T (threshold cycles), equal to the number of cycles of amplification required for sample fluorescence to exceed background levels.
- the molar quantity of ligation product can be calculated from these data by comparison with a standard curve generated using a series of known product (ligated biosensor) concentrations.
- the affinity of the ERK protein target for the ERK-dependent nucleic acid sensor molecule can be measured directly, by a filter-binding assay, or indirectly, by an activity-based assay.
- increasing concentrations of ERK protein target (0–10 ⁇ M) are equilibrated with trace ( ⁇ 1 nM) concentrations of 32 P-labeled, ERK-dependent nucleic acid sensor.
- the samples are drawn through a sandwich of Protran BA85 nitrocellulose (Schleicher and Schuell) and Hybond P nylon (Amersham-Pharmacia) filter papers, using a 96-well vacuum manifold. Protein and protein-bound RNA species adhere to the nitrocellulose, and free RNA to the nylon.
- the concentration of ERK protein/sensor complex is plotted as the fraction of the total radioactivity per sample bound to the nitrocellulose versus total ERK protein concentration.
- the dissociation constant (K D ; FIG. 59 ) is determined as the ERK protein concentration at which 50% of the nucleic acid sensor RNA is bound to protein.
- the activity of the ERK-dependent nucleic acid sensor molecule is measured as a function of increasing ERK protein concentration.
- 50 nM nucleic acid biosensor is incubated with ERK protein (0–10 ⁇ M) for one hour at room temperature.
- the extent of ligation at each concentration of ERK protein is determined by real-time RT-PCR ( FIG. 60 , Panels C and D).
- the ligation product (nM) is plotted against ERK protein concentration, and the apparent dissociation constant (K act ) is determined as the protein concentration at which the extent of ligation is half-maximal.
- Panels A and B show ERK-dependent ligation is determined by RT-PCR on an agarose gel containing ethidium bromide.
- the competitive inhibitor nucleic acid sensor molecule can be used in a HTS assay.
- a nucleic acid sensor molecule specific for phosphorylated ERK is used as a competitive inhibitor for ATP binding (Seiwert, Stines Nahreini et al. 2000).
- a competitive assay for compounds is established by incubating ERK with 10 nM nucleic acid sensor molecule in the presence of various concentrations of the inhibitors in 10 mM Tris buffer pH 7.5 containing 0.5 ⁇ g/ ⁇ l tRNA and 10 mM MgCl 2 . The reactions are terminated by addition of EDTA and the amount of reacted nucleic acid sensor molecule has been determined.
- the nucleic acid sensor molecules that are sensitive for the phosphorylation state of peptides can be used in HTS assays for kinase activity.
- the nucleic acid sensor molecules can be generated to be specific for the phosphorylation state of substrates or its peptides.
- HTS assay can be performed using these substrate (Mansour, Candia et al. 1996).
- MEK can be expressed as GST-tagged protein and purified by a standard method. The activity are measured at 30° C.
- nucleic acid sensor molecule can be used in western-blotting format (Bianchini, Radrizzani et al. 2001).
- nucleic acid sensor molecule specific for phosphoERK binds to ppERK, presumably in a competitive manner at the active site of the kinase enzyme, and inhibits the phosphorylation of the ppERK substrate by ppERK enzyme.
- ppERK phosphoERK
- the phosphorylation state sensitive ppERK nucleic acid sensor molecule is used to determine drug efficacy in vivo (e.g., tissue and cell culture). For example, T84 cells on glass coverslips are incubated in the presence and the absence of the MEK kinase inhibitor, and cells are fixed by 4% paraformaldehyde and permeabilized using 0.3% Triton X-100. The slides are incubated with FRET nucleic acid sensor molecule (Bianchini, Radrizzani et al. 2001). The localization of phosphorylated substrate can be observed using a confocal microscope.
- phosphorylation-state-sensitive nucleic acid sensor molecule are incorporated into reporter-gene constructs. These constructs are introduced into cells, and phosphorylation of the substrates is monitored.
- Nucleic acid sensor molecules made of nuclease resistant forms of hammerhead, -ligase or -hairpin ribozymes are transfected into mammalian cells using standard lipofectamine reagents or liposomal solutions known to effect internalization an cellular uptake of polynucleotides. If desired, the nucleic acid sensor molecules are attached to polypeptides such as tat or antennapoedia or the like and are transported into mammalian cells by methods known in the art.
- nucleic acid sensor molecule systems The activity of nucleic acid sensor molecule systems is followed by changes in fluorescence if the nucleic acid sensor molecule is fluorescently tagged, i.e., is an optical nucleic acid sensor molecule or by changes in size as determined by RT-PCR.
- Nucleic acid sensor molecules can also be used to detect the presence of and measure the concentration of non-nucleic acid analytes in crude biological samples as shown in FIG. 56 .
- nucleic acid sensor molecules can be created whose activity is activated in the presence of a specific target molecule. These nucleic acid sensor molecules together with any required substrates, can be combined with a complex mixture of biological origin and allowed to undergo reaction. Subsequent quantification of the product of the reaction can be used to infer the concentration of the analyte in the sample.
- the crude biological sample is human serum or mammalian cell extract.
- the nucleic acid sensor molecule catalyzes self-ligation with an oligonucleotide substrate.
- RNAse-inhibitors such as ribonucleoside vanadyl complex can be used to prevent degradation of the product.
- the product of catalysis can be measured by a variety of means (e.g., a gel mobility shift assay as shown in FIG. 50 ).
- Ribonucleoside vanadyl complex can be used as a general purpose inhibitor of endogenous RNAses to enable the use of allosteric ribozymes in assays of samples containing RNAse activity (e.g. human serum, mammalian cell extracts, bacterial extracts).
- RNAse activity e.g. human serum, mammalian cell extracts, bacterial extracts.
- RVC inhibits RNA degradation mediated by generic RNAses as well as RNAse H-like activities that specifically target RNA-DNA hybrids. Inhibition of RNAse activity prevents degradation of the reaction product generated by ribozyme action that ultimately forms the basis for readout in a ribozyme-based assay.
- a lysozyme-dependent nucleic acid sensor molecule RNA with the sequence 5′ GGACCUCGGCGAAAGCUAACGUCUCAUGGCUAAAUUGCCAUGUUGCUACAAAU GAUAUGACUAGAGAGGUUAGGUGCCUCGUGAUGUCCAGUCGC (SEQ ID NO:312) is prepared through transcription off a double-stranded DNA template using T7 polymerase (Ambion MegaShortscript kit, Ambion, Austin, Tex.), including trace amounts of [alpha- 32 P]UTP.
- RNA nucleic acid sensor molecule
- DNA DNA: upper case; RNA: lower case
- reaction buffer 50 mM Tris pH 7.4, 100 mM KCI, 10 mM MgCl 2
- Robottson M P & Ellington A D Nature Biotechnol. 2001, 19, 650–655
- HeLa extract is added to some of the samples (10% v/v), plus one of various RNase inhibitors (human placenta RNase inhibitor (Sigma, St. Louis, Mo.), RNasin (Ambion, Austin, Tex.) and vanadyl ribonucleoside complex, RVC, (Sigma, St. Louis, Mo.)).
- RNase inhibitors human placenta RNase inhibitor (Sigma, St. Louis, Mo.)
- RNasin Ambion, Austin, Tex.
- RVC vanadyl ribonucleoside complex
- the HeLa extract samples that contain protein-based RNase inhibitors show significant broadening of the precursor RNA band compared to a buffer-only control, suggesting RNase H degradation where the RNA is bound to the DNA effector oligonucleotide.
- the sample containing the VRC RNase inhibitor does not show any significant degradation. All of the samples show lysozyme-dependent product formation.
- additional test are done with an analog of the nucleic acid sensor molecules where the oligonucleotide effector domain is deleted (5′ GGACCUCGGCGAAAGCUAACGUCUCAUGGCUAAAUUGCCAUGUUGCUACAAAU GAUAUGACUAGAGAGGUUAGGUGC) (SEQ ID NO:332) under otherwise identical conditions ( FIG. 51 , right).
- RNAse H-like activity By inactivating endogenous RNAse H-like activity, it is possible to carry out allosteric ribozyme assays in which the ribozymes have been immobilized on a chip surface through hybridization with a tethered DNA probe.
- Immobilization of nucleic acid sensor molecules on a substrate provides a straightforward mechanism for carrying out multiple arrays in parallel.
- the optimal attachment chemistries were determined to be used to immobilize these molecules on a solid substrate.
- These molecules are were further configured such that their activity and allosteric behavior is maintained following immobilization.
- the chip is configured such that it may be placed at the bottom of a sample holder and overlaid with sample solution, target (ERK and ppERK) (and substrate oligonucleotide). Following an incubation to allow ERK and pERK present within the sample to activate catalysis, the sample is washed away and the extent of ribozyme catalysis quantified.
- Immobilized nucleic acid sensor molecules for ERK and pERK are prepared as described in the following section and are assayed for activity by monitoring either retention of end-labeled oligonucleotide substrate (for L1 ligase-based ribozymes) or release of end-labeled ribozyme (for endonucleases as originally described by (Seetharaman et al. 2001).
- Radioactive tracers are used for labeling RNAs and substrates. To the extent that different attachment chemistries do not interfere, both fluorescent and biotin labels are used in end-labeling the oligo substrate.
- nucleic acid sensor molecule arrays as opposed to protein arrays is the relative ease with which nucleic acid sensor molecules can be attached to chip surfaces.
- chemistries for attaching nucleic acid sensor molecules to solid supports were tested and optimized, such as:
- Nucleic acid sensor molecule pre-screening As noted above, individual clones isolated from the selection experiment are tested early for allosteric activation in the presence of ERK-depleted extracts. Molecules that respond to endogenous non-specific activators are eliminated from further consideration.
- Negative selection with depleted extracts To the extent that all isolated nucleic acid sensor molecules are activated by ERK-depleted extracts, depleted extracts are included in the negative selection step of the selection process.
- Nuclease inhibition Commercially available RNase inhibitors and competing RNAse substrates (e.g. tRNA) are added to test samples.
- RNase inhibitors and competing RNAse substrates e.g. tRNA
- RNAse-mediated degradation of the nucleic acid sensor molecule proceeds at a rate in competition with the rate of nucleic acid sensor molecule catalysis.
- nucleic acid sensor molecules with fast turnover rates can be assayed for shorter times and are thus less susceptible to RNAse problems.
- Nucleic acid sensor molecules with fast turnover can be obtained by (1) reducing the length of the incubation during the positive selection step, and/or (2) choosing fast nucleic acid sensor molecules (potentially with less favorable allosteric activation ratios) when screening individual clones emerging from the selection experiment.
- Nuclease-Resistant Nucleic acid sensor molecules By carrying out selection in the presence of nucleases (e.g. by including depleted extracts during the negative selection step), the experiment intrinsically favors those molecules that are resistant to degradation.
- RNA Covalent modifications to RNA that can render it highly nuclease-resistant are performed. Several of these modifications, including for example 2′-O-methylation, are compatible with hammerhead cleavage activity and are used to minimize non-specific cleavage in the presence of biological samples (Usman and Blatt 2000).
- a circularized nucleic acid product generated by the target-activated ligase nucleic acid sensor molecule serves as a template to promote rolling circle replication.
- rolling circle replication initially requires that an oligonucleotide primer be annealed to the circular nucleic acid template.
- This oligonucleotide primer may be provided subsequent to the nucleic acid sensor molecule reaction that generates the circular template.
- the primer may be present during the nucleic acid sensor molecule reaction as either a separate oligonucleotide or as part of the nucleic acid sensor molecule itself ( FIG. 53 ).
- the primer may exist free in solution or be tethered either covalently (e.g., via 5′-end modification) or non-covalently (e.g., association of biotinylated primer with immobilized streptavidin or through base-pairing with complementary immobilized oligonucleotide) to a solid support.
- an immobilized nucleic acid sensor molecule serves directly as the primer for rolling circle amplification as illustrated in FIG. 53 . Immobilization makes it possible to confine the signal generated through the rolling circle reaction to a specific spatial location, enabling the development of arrays in which each element in the array is composed of a different target-activated nucleic acid sensor molecules.
- an immobilized primer is used for rolling circle extension, also leading to a spatially localized signal.
- the primer is at least 10 nucleotides long and it hybridizes to a unique site on the circular template.
- Rolling circle amplification may proceed using either a DNA-directed or RNA-directed polymerase, depending upon the nature of the circular template generated by the target-activated nucleic acid sensor molecules.
- Concatamers generated from primarily DNA templates can be generated by an enzyme preferably from the following group: Taq DNA polymerase, Tth DNA polymerase, Klenow fragment of E. coli DNA polymerase, bacteriophage O29 DNA Polymerase, or Bst DNA polymerase. More preferably, the polymerase enzyme is Bst DNA Polymerase.
- Concatamers generated from primarily RNA templates can be generated by an enzyme preferably from the following group: AMV reverse transcriptase, MMLV reverse transcriptase, or Q-beta replicase. More preferably, the polymerase enzyme is MMLV reverse transcriptase.
- the rolling circle amplification reaction requires a supply of nucleotide triphosphates for incorporation to generate the nucleic acid product. Quantification of the rolling circle amplification reaction may be facilitated by using nucleotides containing fluorescent or radioactive labels or affinity tags as described below.
- the rolling circle amplification reaction may be made to proceed exponentially by the addition of a linear oligonucleotide primer containing all or part of the circular template sequence ( FIG. 54 ).
- the uncircularized form of the ligase substrate can perform this function.
- the detection reaction is carried out with excess oligonucleotide substrate.
- the rolling circle amplification reaction generates single- and double-stranded DNA.
- the amount of the rolling circle amplification product generated can be determined by the variety of methods outlined below.
- the signal measured by each method can be directly related to a corresponding analyte concentration by constructing a standard curve in which a range of known concentrations of the analyte are analyzed in parallel. Fluorescent detection. Products of the rolling circle amplification reaction may be detected fluorescently by the following methods:
- Gia-protein dependent nucleic acid sensor molecules are used in vitro to test the efficacy of the agonists and inverse agonists for any GPCR.
- Gia-protein cDNA can be obtained (Guthrie cDNA resource Center) and expressed in E. coli as His-tagged protein (Lee, Linder et al. 1994). GDP or GTP- ⁇ S are added during the purification to avoid degradation. GDP-complex Gi ⁇ -protein and GTP-complex Gi ⁇ -protein are used to generate nucleic acid sensor molecules.
- GTP-complex Gi ⁇ -protein (activated-Gi ⁇ -protein)-dependent nucleic acid sensor molecules are tested in a target modulation assay to screen the selected nucleic acid sensor molecules with desirable properties. For example, membrane fraction of C6 glioma cells in 12-well plates are loaded for 16 h in the presence and the absence of adrenaline. Cell lysate can be tested for activated Gi ⁇ -protein-dependent nucleic acid sensor molecule response.
- the competitive modulation by for adenylyl cyclase is tested following the inhibition of adenylyl cyclase activity by activated Gi ⁇ -protein in the presence of nucleic acid sensor molecules by a modified assay based on a previously described assay (Burt, Sauté et al. 1998).
- Adenylyl cyclase activity is measured as described in the presence and the absence of nucleic acid sensor molecules (Kozasa and Gilman 1995).
- Cell membranes from HeLa cells transfected with human cloned 5-HT 1A receptors resuspended in buffer are used to screen compounds.
- the membranes are incubated with 30 M GDP and decreasing concentrations of test drugs (from 100 pM to 0.1 nM) or decreasing concentrations of 5-HT, from 100 M to 0.1 nM (reference curve) for 20 min at 30° C. in a final volume of about 0.5 mL (Stanton and Beer 1997).
- samples are added with GTPS and the nucleic acid sensor molecules and then incubated for a further 30 min at 30° C.
- nucleic acid sensor molecules are generated that depend on the presence of G ⁇ -protein uncomplexed with G ⁇ -protein.
- G ⁇ -protein complex with G ⁇ -protein can also play important roles in the signal transduction. After dissociation from alpha subunit, this complex is known to regulate various target protein, such as GRKs, Raf kinase, adenylyl cyclase, PLCs and ion channels.
- GRKs Raf kinase
- adenylyl cyclase adenylyl cyclase
- PLCs ion channels
- GPCR nucleic acid sensor molecules are used in cell-based assay using modifications of previously described GPCR assays (Hun, Ellington et al. 2001).
- ⁇ -adrenergic receptor can be expressed in CHO cells.
- CHO cells are grown in multiwell tissue culture plates in Dulbecco's modified Eagle media (DMEM) with 10% fetal bovine serum.
- DMEM Dulbecco's modified Eagle media
- IBMX isobutyl-1-methylxantine
- test compounds are added at a desired concentration range (e.g. 10 ⁇ 9 to 10 ⁇ 4 M).
- Isoproterenol (10 ⁇ 5 M) is used as an internal standard for comparison of activity. Cells were incubated at 37° C. on a rocker for 15–30 min. Then cells are lysed and the level of the activated G ⁇ -protein is measured by the nucleic acid sensor molecule. The antagonist is screened in the same format in the presence of the known agonist by detecting the decreasing amount of the activated G ⁇ -protein.
- the agonism and the antagonism of compounds for specific or general GPCR is measured using the nucleic acid sensor molecule.
- evaluation of compounds for antagonism can be performed using Sprague Dawley rats.
- the aorta from animal is isolated and freed of adhering connective tissue.
- Desmethylimipramine (0.1 M) and corticosterone (1 M) to block neuronal and extraneuronal uptake of noradrenaline, ( ⁇ )-propranolol (1M) to block ⁇ -receptors, and yohimbine (0.1 M) to block ⁇ -receptors are added.
- Aortic strips are incubated with various concentration of compounds in the presence and the absence of 10 M noradrenaline.
- the cell extract is prepared and the activated Gi ⁇ -protein level in the cell is measured with the nucleic acid sensor molecules (Barlocco, Cignarella et al. 2001).
- Nucleic acid sensor molecules generated against G ⁇ -protein subunits are used to test the efficacy of agonists and inverse agonists for any GPCR in vitro using activated G-protein.
- Gi ⁇ -protien cDNA can be obtained (Guthrie cDNA resource Center) and expressed in E coli as His-tagged protein (Lee, Linder et al. 1994). GDP or GTP- ⁇ S are added during the purification to avoid degradation. GDP-complex Gi ⁇ -protein and GTP-complex Gi ⁇ -protein are used to generate nucleic acid sensor molecules.
- GTP-complex Gi ⁇ -protein (activated-Gi ⁇ -protein)-dependent nucleic acid sensor molecule can be tested for the binding assay to screen the selected nucleic acid sensor molecules with desirable properties.
- membrane fraction of C6 glioma cells in 12-well plates were loaded for 16 h in the presence and the absence of adrenaline.
- Cell lysate can be tested for activated Gi ⁇ -protein-dependent nucleic acid sensor molecule response.
- the competitive binding for adenylyl cyclase can be tested following the inhibition of adenylyl cyclase activity by activated Gi ⁇ -protein in the presence of nucleic acid sensor molecules by a modified assay based on a previously described assay (Burt, Sautel et al. 1998).
- Adenylyl cyclase activity can be measured as described in the presence and the absence of nucleic acid sensor molecules (Kozasa and Gilman 1995).
- Cell membranes from HeLa cells transfected with human cloned 5-hydroxytryptamine 1A (5-HT 1A ) receptors resuspended in buffer can be used to screen compounds.
- the membranes are incubated with 30 mM GDP and decreasing concentrations of test drugs or decreasing concentrations of 5-HT, from 100 M to 0.1 nM (reference curve) for 20 min at 30° C. in a final volume of about 0.5 mL (Stanton and Beer 1997).
- samples are added with GTPS and the nucleic acid sensor molecules and then incubated for a further 30 min at 30° C.
- Nucleic acid sensor molecules can also be generated that depend on the presence of G ⁇ -protein uncomplexed with G60-protein.
- G ⁇ -protein complex with G ⁇ -protein can also play important roles in the signal transduction. After dissociation from alpha subunit, this complex is known to regulate various target protein, such as GRKs, Raf kinase, adenylyl cyclase, PLCs and ion channels.
- GRKs Raf kinase
- adenylyl cyclase adenylyl cyclase
- PLCs ion channels
- Nucleic acid sensor molecules are also generated whose activity is dependent on multiple activated G-proteins.
- Human G-protein cDNAs are obtained from publicly available databases or are cloned by RT-PCR from polka-RNA pool of appropriate source. They can be expressed as described above and use to select nucleic acid sensor molecules. The readouts for multiplex assay system are discussed above.
- Lysozyme activated nucleic acid sensor molecules lys.L1.A, B, and C are disclosed in FIG. 26 . Stems above the ligation junction varied in length from 2, 5 and 10 base pairs.
- the unimolecular NASMs were generated by PCR of the original lysozyme NASM with 5′ primer (TCTAATACGACTCACTATAGGACCTCGGCGAAAGC) (SEQ ID NO:296) and the following 3′ primers: A ACTCTCGCTAACCTCTCTAGTCATA (SEQ ID NO:297), (B) AGTGCTCTCGCACCTAACCTCTCTAGT (SEQ ID NO:298) or (C) AGTGCGAGCCTCTCGGCTCGCACCTAACCTCTCTAGT (SEQ ID NO:299) using Taq polymerase (Invitrogen) following the manufacturer's protocol.
- RNAs were generated with Ampliscribe T7 transcription kits following the manufacturer's protocol. RNA was heated in water for 3 min at 70° C. and then brought to room temperature before adding 5 ⁇ buffer (5 ⁇ buffer: 150 mM Tris, 50 mM MgCl2, pH 7.5) and lysozyme (1 uM or absent). Ligations were performed at room temperature for one hour then quenched with stop dye [formamide, 0.1% bromophenol blue, xylene cyanol] and anaylzed on a 6% acrylamide gel. Self-ligation was increased in the presence of lysozyme for constructs B and C. No ligation was observed for construct A, suggesting that the stem length above the ligation junction is critical.
- This circularization can be detected using PCR across the ligation site as shown in FIG. 27 .
- Activation of (clone B is shown in FIG. 28 .
- Protocols from the supplier were followed for Superscript RT and recombinant Taq Polymerase (Invitrogen). All RNA samples were reverse transcribed and PCR amplified separately with two different sets of primers. The first set was designed to amplify the total NASM RNA that was used as input into in vitro (TCTAATACGACTCACTATAGGACCTCGGCGAAAGC (SEQ ID NO:300) and AGTGCTCTCGCACCTAACCTCTCTAGT (SEQ ID NO:301)).
- the second set of primers was designed to selectively amplify the RNAs that circularized (GTTGCTACAAATGATATGAC (SEQ ID NO:302)and ATGGCAATTTAGCCATGAGA (SEQ ID NO:303)).
- the circularized species display a ladder like pattern as a result of strand displacement.
- the ladder can be avoided by the use of a reverse transcriptase with RNase H activity.
- the gel shows in FIG. 28 that after 25 cycles of PCR, a circularization signal appears. This signal allows for quantitation of the degree of activation of ligase in response to their target molecules.
- Ligase nucleic acid sensor molecules are also able to detect their targets in cell extracts.
- FIG. 29 (clone B is combined with lysozyme, and increasing amounts of HeLa cell extracts. Experiments were carried at as described for FIG. 28 with HeLa cell extract added in place of water. Even at the highest HeLa cell extract concentration, activation of clone B by lysozyme is still detectable.
- Lysosyme-dependent ligase (lys11–2 from Nature Biotechnology 19, 650–655 (2001)) incubated in the presence of effector oligonucleotide 18.90a (ibid.), substrate S28A (ibid.), optionally 10% cellular lysate (HeLa cells or reticulocyte lysate) and various concentrations of lysozyme at 25° C. for 1 hour, as shown in FIG. 50 .
- Ligation is observable at 100 nM and is ⁇ 30% at 1 ⁇ M. Ligation yield is unaffected by the presence of 10% reticulocyte lysate or 10% HeLa lysate.
- Ligase nucleic acid sensor molecules are also able to detect their targets in vivo.
- Mammalian cells were electroporated with 1, 5, 10 and 25 ⁇ g RNA. The RNA was brought to a total volume of 30 ul in the presence of 20 ug salmon sperm DNA. Cells were trypsinized, counted, pelleted and resuspended in 250 ul of media. The ligase biosensor/Salmon sperm DNA mixture was added to the cells, mixed gently and incubated at room temperature for 5 minutes. The cells were electroporated and diluted in pre-warmed media and incubated at ambient temperature for 5 minutes. Subsequently, the cells were plated and transferred to a 37° C.
- RT-PCR is a quantitative method that can be used to measure the activity of a ligase nucleic acid sensor molecule.
- PCR primers are used that hybridize to sequences of the ligase nucleic acid sensor molecule that are only joined after self-ligation. After ligation occurs the nucleic acid sensor molecule can be amplified, and the PCR product can be detected on an agarose gel, using ethidium bromide or other nucleic acid staining techniques.
- the progress of the PCR reaction can be monitored using real-time detection techniques including, but not limited to, Taqman (Applied Biosystems, Foster City, Calif.), SYBR Green (Molecular Probes, Eugene, Ore. and Applied Biosystems, Foster City, Calif.), Scorpion (Eurogentec, vide, Belgium), Amplifluor (Serologicals, Norcross, Ga.) or related systems.
- a specific example of a lysozyme-dependent ligase nucleic acid sensor molecule is as follows:
- the ligase RNA has the sequence 5′GGACCUCGGCGAAAGCUAACGUCUCAUGGCUAAAUUGCCAUGUUGCUACAAAU GAUAUGACUAGAGAGGUUAGGUGCAUCUUCAUGUCCAGUCGCUUGCAAUGCCC (SEQ ID NO:304) and is prepared through transcription off a double-stranded DNA template using T7 polymerase (Ambion MegaShortscript kit, Ambion, Austin, Tex.).
- RNA,1 For the ligation reaction, 200 nM nucleic acid sensor molecule RNA,1 , ⁇ M DNA RT primer 5′GGGCATTGCAAGCGACTGGACAT (SEQ ID NO:305) and 1 ⁇ M substrate oligo 5′ACTGAACCTGACCGTACAAAGATgcacu (SEQ ID NO:306) (DNA: upper case; RNA: lower case) are incubated with 1 nM-10 ⁇ M hen egg white lysozyme in reaction buffer (50 mM Tris pH 7.4, 100 mM KCl, 10 mM MgCl 2 ) as previously described (Robertson M P & Ellington A D, Nature Biotechnol. 2001, 19, 650–655).
- reaction buffer 50 mM Tris pH 7.4, 100 mM KCl, 10 mM MgCl 2
- the sample is then denatured for 10 min at 95° C. followed by 40 PCR cycles (15 sec at 95° C., 1 min at 60° C.).
- the amplification process is monitored using a ABI 7000 instrument (Applied Biosystems, Foster City, Calif.), and threshold cycle values are calculated using the instrument software. Plotting the Ct against the logarithm of the lysozyme concentration reveals a largely linear relationship ( FIG. 48 ).
- the linear dynamic range spans about three orders of magnitude from ⁇ 1 nM to ⁇ 1 ⁇ M.
- a control reaction without the addition of lysozyme gives a threshold cycle values of ⁇ 24.5.
- This value defines the upper limit for threshold cycle values, and is due to the small amount of product that is inevitably generated through the background ligation.
- the lower plateau of threshold cycle values is reached with lysozyme >-1 PM.
- This concentration is close to the apparent Kd (1.5 ⁇ M), and the nucleic acid sensor molecule target modulation domain is beginning to be saturated by lysozyme, triggering a reaction at maximum catalytic rate.
- Another specific example describes the use of the SYBR Green RT-PCR amplification detection system (Applied Biosystems, Foster City, Calif.).
- Ligation reactions are run as described above, and analysis is done through transferring 5 ⁇ L of the reaction into 25 ⁇ L of a SYBR-Green RT-PCR reaction mix (Applied Biosystems, Foster City, Calif.) that contains 100 nM DNA forward primer 5′ACTGAACCTGACCGTACAAAGA (SEQ ID NO:310) and DNA reverse primer 5′TTTGTAGCAACATGGCAATTTA (SEQ ID NO:311). Reverse transcription is performed through incubation for 30 min at 48° C. The sample is then denatured for 10 min at 95° C. followed by 40 PCR cycles (15 sec at 95° C., 1 min at 60° C.).
- the amplification process is monitored using a ABI 7000 instrument(Applied Biosystems, Foster City, Calif.), and threshold cycle values are calculated using the instrument software as above ( FIG. 49 ).
- the threshold cycle values are directly proportional to the logarithm of the lysozyme concentration between ⁇ 1 nM to ⁇ 1 ⁇ M.
- a melting profile confirms that a uniform amplification product was obtained, without the appearance of artifacts such as primer-dimers.
- Ligation reactions with varying volumes depending on the application type were performed in buffer 1, [30 mM Tris-HCl, pH 7.5, 10 mM MgCl 2 , 50 ⁇ g/mL tRNA type X (Sigma)], or buffer 2 [20 mM HEPES, pH 7.4, 10% glycerol, 150 mM KCl, 10 mM MgCl 2 , 1 mM EDTA, 1 mM DTT, 0.5 mg/ml tRNA, 2 U/ ⁇ L RNaseOUTTM (Invitrogen)].
- Ligation reactions performed in the presence or absence of crude cell lysates contained 200 nM or 50 nM ligase RNA, respectively.
- HEK 293, 3T3 or HeLa cells were grown in DMEM medium containing 10% fetal bovine serum to 85–90% confluency, and harvested by trypsinization. Aliquots of approximately 250,000 cells were pelleted by centrifugation (3 min at 2000 rpm), resuspended in 250 ⁇ L of growth medium, and gently mixed with 30 ⁇ L of nucleic acid mix containing 20 , ⁇ g of salmon sperm DNA (carrier) and 1, 5, 10 or 25 ⁇ g nucleic acid sensor molecule ligase RNA. This mixture was incubated at room temperature for exactly 5 minutes without agitation, and transferred to electroporator cuvettes.
- An electric field pulse was applied to the cells at ambient temperature using a Gene Pulser II power supply (BioRad; settings: 250V, 0.975 ⁇ F high capacitance).
- the cells were plated in pre-warmed growth medium, incubated at 37° C. for varying periods, and harvested. Cells were washed with PBS, pelleted, and immediately subjected to total, cytoplasmic, or nuclear RNA isolation procedures or flash-frozen in liquid nitrogen and stored at ⁇ 80° C. for further analysis.
- RNA from mammalian cells Pelleted cells were resuspended in ice old buffer (150 mM NaCl, 10 mM Tris HCl, pH 8.0) and added to 40 ⁇ l of 10% SDS, 28 ⁇ l of 10% NP40 and 6 ⁇ l of Proteinase K (20 ⁇ g/ ml). The mixture was drawn into a 1 ml syringe and passed through a 26 gauge needle at least 20 times, and then incubated at 37° C. for 2 hours. Following incubation, the slurry phenol/chloroform/isoamyl alcohol extracted two-times, the aqueous phase was removed and ethanol precipitated. The sample was 70% ethanol washed, and dried. The RNA pellets were resuspended and the yield was quantified based on OD 260. The cleanliness of the prep was assessed based on 260/280 ratio. All RNA samples were stored at ⁇ 80° C.
- Protocols from the supplier were followed for reverse transcription and PCR. Either Superscript RT or AMV RT, and recombinant Taq Polymerase (Invitrogen) were used.
- RNA samples were reverse transcribed and PCR amplified separately with two different sets of primers.
- First set was designed to amplify the total RNA that was used as input into in vitro or ex vivo assays.
- the second set of primers were designed to selectively amplify the RNAs that were ligated to the substrate oligo (resulting in a higher molecular weight) or were ligated to their 5′ end and became circularized without molecular weight change.
- two and three-piece ligase platforms give rise to higher molecular weight products as a result of target dependent ligation.
- One piece ligase platform circularize as a result of target dependent ligation. When observed directly with gel based assays the circularized form has a different mobility than the linear RNA. Following amplification with RT/PCR the circularized species display a ladder like pattern as a result of strand displacement that happens in the reverse transcription phase. The ladder like pattern can be avoided by the use of a reverse transcriptase with RNase H+ activity.
- TBS lysis buffer 137 mM NaCl, 20 mM Tris, pH 8.0, 1% vol/vol NP-40, and 10% vol/vol glycerol; Knusel et al. 1994
- Brij Lysis buffer 150 mM NaCl, 10 mM Tris, pH 7.5, 2 mM EDTA, 0.125% vol/vol NP-40, 0.875% vol/vol Brij and 10% vol/vol glycerol. Lysis buffers were supplemented with Mini Complete protease inhibitor cocktail (Boehringer Mannheim Corp.) and 1.5 mM sodium vanadate.
- Lysates were scraped into Eppendorf tubes and rocked for 30 min at 4° C. Samples were then cleared by centrifugation at 10,000 ⁇ g fro 10 min at 4° C. Protein concentration was determined by the BCA assay (Pierce Chemical Co.) using BSA as a standard.
- FIG. 61 illustrates an optical NASM derived from an intron-based catalytic NASM.
- the distal termini of the 5′ and 3′ exons are modified to incorporate the donor and acceptor components of a FRET signaling pair. In the absence of target modulation, fluorescence emission will be observed only from the donor fluorophore which is being directly excited optically.
- the acceptor molecule may be replaced with a quencher molecule (i.e., an acceptor species which absorbs but does not re-radiate fluorescent energy). In this case, the splicing and ligation event will only result in a measurable decrease in the fluorescence emission signal from the donor fluorophore.
- td The thymidylate synthase (“td”) intron (Construct 41)(SEQ ID NO:358) -TAATTGAGGCCTGAGTATAAGGTGACTTATACTTGTAATCTATCTAAACGGG GAACCTCTCTAGTAGACAATCCCGTGCTAAATTGTAGGACTGCCCGGGTTCTACATAAATGC CTAACGACTATCCCTTTGGGGAGTAGGGTCAAGTGACTCGAAACGATAGACAACTT GCTTTAACAAGTTGGAGATATAGTCTGCTCTGCATGGTGACATGCAGCTGGATATAA TTCCGGGGTAAGATTAACGACCTTATCTGAACATAATG—is a group I intron sequence of 265 nucleotides in length. Other lengths and their sequences are known in the art and can used as described herein in lieu of SEQ ID NO:358 above.
- an intron-derived optical NASM that is modulated by target recognition is the theophylline dependent td group I intron which splices itself out of a thymidylate synthase gene.
- the intron sequence of this optical NASM is as follows:
- the complete optical NASM comprises the intron sequence described above and the 5′ and 3′ exons attached thereto.
- Exon 1 the 5′-exon - TTTCTTGGGT (construct 43)(SEQ ID NO:360)—is designed to contain a first fluorescent donor molecule, such as Cy3 (Amersham Biosciences) coupled to a nucleotide in the vicinity (i.e., within no more than about 15 nucleotides) of the 3′ terminus of the 5′ exon.
- the 5′-exon length can vary with a minimum of 6 nucleotides of complementarity to P10.
- the 3′-exon—CTACCGTTTA construct 43 (SEQ ID NO:361)—is designed to contain a second fluorescent molecule, such as Cy5 (Amersham Biosciences) coupled to a nucleotide in the vicinity (i.e., no more than about 15 nucleotides) of the 5′ terminus of the 3′ exon.
- the 3′-exon length can vary with a minimum of 2 nucleotides of complementarity to P10.
- Intron Splicing conditions are as follows: the intron (500 nM) is heated in H 2 0 to 70° C. for 3 minutes then put on ice for 1 minute. Splicing buffer (20 mM Tris-HCl, pH 7.5, 100 mM KCl, 3 mM MgCl 2 ), is added and the reaction is incubated on ice for an additional 15 minutes. At this time a 4.5 ⁇ l aliquot is removed for a time zero point and quenched with 5 ⁇ l stop dye (95% formamide, 20 mM EDTA, 0.5% xylene cyanol, and 0.5% bromophenol blue). GTP (50 ⁇ M) is added to the remaining reaction (4.5 ⁇ l) to start the splicing reaction. The reaction is incubated at 37° C. for 1 hour and then terminated with stop dye (5 ⁇ l). The reactions are heated to 70° C. for 3 minutes. Splicing of full length RNA transcripts is detected by gel analysis of labeled RNA.
- the theophylline-dependent optical NASM splices in vitro under the same conditions as described for the intron splicing reaction, but with theophylline added to a final concentration 1.5 mM in the splicing buffer.
- the theophylline-dependent optical NASM 500 nM is heated in H 2 0 to 70° C. for 3 minutes then put on ice for 1 minute.
- Splicing buffer (20 mM Tris-HCl, pH 7.5, 100 mM KCl, 3 mM MgCl 2 ) and theophylline (1.5 mM) are added and the reaction is incubated on ice for an additional 15 minutes.
- a 4.5 ⁇ l aliquot is removed for a time zero point and quenched with 5 ⁇ l stop dye (95% formamide, 20 mM EDTA, 0.5% xylene cyanol, and 0.5% bromophenol blue) (95% formamide, 20 mM EDTA, 0.5% xylene cyanol, and 0.5% bromophenol blue).
- GTP 50 ⁇ M is added to the remaining reaction (4.5 ⁇ l) to start the splicing reaction. The reaction is incubated at 37° C. for 1 hour.
- Target dependent modulation of the intron-derived optical NASM is followed by fluorescence measurement as described herein.
- This example describes a general method for implementing a FRET-based (fluorescence resonance energy transfer) assay utilizing nucleic acid sensor molecules.
- nucleic acid sensor molecules in this case, cGMP-dependent hammerhead nucleic acid sensor molecule
- the nucleic acid sensor molecule is immobilized on a solid substrate, e.g., within a microtiter plate well, on a membrane, on a glass or plastic microscope slide, etc.
- a first oligonucleotide of the nucleotide sensor molecule is 3′-labeled with an acceptor or quencher fluorophore, such as TAMRA, AlexaFluor 568, or DABCYL, via specific periodate oxidation (see Example 34. for specific protocol).
- a second oligonucleotide of the nucleic acid sensor molecule complementary to at least part of the first oligo portion of the NASM, is labeled with a 3′ biotin and a 5′ donor fluorophore, such as fluorescein (FAM, FITC, etc.).
- nucleic oligonucleotides are heat-denatured in solution and allowed to anneal/hybridize during cooling to room temperature.
- the NASM solution is applied to a surface which has been coated with some type of avidin (streptavidin, neutravidin, avidin, etc.).
- avidin streptavidin, neutravidin, avidin, etc.
- This surface could include a microtiter plate well, a streptavidin-impregnated membrane, a glass or plastic microscope slide, etc.
- the ribozyme-oligo complex is specifically immobilized via the 3′ biotin on the donor oligo, leaving the binding domain free to interact with the target effector molecule.
- FIG. 62 shows the solution-phase FRET construct (upper panel) from which the solid-phase nucleic acid sensor molecule construct (lower panel) was derived.
- the species labeled ‘A’ and ‘D’ represent the acceptor and donor fluorophores, respectively; similarly, the species labeled ‘F’ and ‘Q’ represent the donor and quencher fluorophores, respectively.
- the donor and acceptor fluorophores form an efficient FRET-pair; that is, upon excitation of the donor fluorophore near its spectral absorption maxima, the incident electromagnetic energy is efficiently transferred (nonradiatively) via resonant electric dipole coupling from the donor fluorophore to the acceptor fluorophore.
- the efficiency of this resonant energy transfer is strongly dependent on the separation between the donor and acceptor fluorophores, the transfer rate being proportional to 1/R 6 , where R is the intermolecular separation.
- the fluorescent emission from donor species will be reduced relative to its output in an isolated configuration, while the emission from the acceptor species, through indirect excitation by the donor, will be detectable.
- the donor fluorescence emission signal will increase strongly, while the acceptor emission signal will show a commensurate decrease in intensity.
- the black arrow shown in the uppermost panel of FIG. 63 indicates the site of phosphodiester bond cleavage, which occurs upon modulation fo the target modulation domain (TMD) by a cGMP, to the TMD.
- TMD target modulation domain
- the melting temperature, T m of the remaining 5-base pair sequence (GGUCU in the figure) is ⁇ 25° C.
- This target-activated nucleic acid sensor molecule system constitutes a highly sensitive real-time sensor for detecting and quantitating the concentration of the target molecule present in an unknown sample solution.
- the ultimate limit of detection (LOD) for this system is determined by the switch factor, defined as the ratio of the catalytic rate (in this example, the rate of cleavage) of the ribozyme sensor in the presence of its target to that of the ribozyme in the absence of its target.
- the dynamic range of the ribozyme sensor will be determined by the dissociation constant, K d , for the interaction of the ribozyme binding domain with the target molecule.
- the effective dynamic range over which the rate-response of the NASM is linear in the target concentration has K d as an upper bound.
- the lower panel of FIG. 63 shows experimental data from the surface-immobilized cGMP-activated NASM.
- the data shown in the figure represents the FRET signal from the donor fluorophore with the sensor exposed to concentrations of 0, 100 uM, and 600 uM cGMP.
- the upper panel of FIG. 64 shows both donor and acceptor fluorescence signals for the FRET system in the presence of 200 uM cGMP. Note that the experimental data exhibits the behavior expected, as shown in the lower panel of FIG. 63 .
- the lower panel of FIG. 64 shows the donor signal form the plot in the upper panel fitted to a pseudo-first order rate equation. As shown by the closeness of the data fit, the kinetic response of this sensor system closely approximates a pseudo-first order reaction.
- the measured dissociation constant for this cGMP-activated NASM with cGMP is approximately 200–500 uM. In practice, concentration measurements up to 1 mM are possible with this sensor in solution-phase measurements. The absolute precision of measurements made with this NASM will depend on the amount of background catalytic activity (i.e., in the absence of target) and baseline drift of the fluorescence signals from both sample and controls due to physical factors, such as liquid handling errors, reagent adhesion, evaporation, or mixing. After some optimization, run-to-run CVs of a few percent are possible with similar FRET-based NASMs measured in solution.
- Immobilization of the NASM does not degrade its catalytic activity, although it may limit the effective availability of the target-binding domain for interaction with target molecules.
- the locally high concentration of surface-immobilized NASM will tend to offset this effect by driving the equilibrium for the association (and subsequent catalytic) reactions toward formation of ribozyme-target complex.
- the net result is a reduction in the observed catalytic rate of approximately 4-fold at K d (200–500 uM) for the surface-immobilized cGMP-dependent hammerhead NASM, relative to the observed rate for the same sensor system in solution. This effect is shown in the experimental data presented in FIG.
- FIGS. 65C , 65 D, and 65 E shows how this general NASM strategy could be extended to accomplish multiplexed detection of multiple analytes in a sample simultaneously, by using NASMs labeled with fluorophores having different emission wavelengths.
- Squares are NASMs immobilized on a solid. Circles are NASMs in solution.
- the sensors were immobilized in neutravidin-coated microtiter plate wells (96 well plate, volume of 50 uL). Detection of the fluorescent signals was accomplished in this case by a microplate fluorescence reader equipped with the appropriate lamps, optics, filters, and optical detectors (PMT) manufactured by Packard Instrument Co.
- PMT optical detectors
- This cGMP-dependent hammerhead NASM system was immobilized on streptavidin-impregnated membranes, and target-activated FRET activity observed.
- the generalization of this application of surface-immobilized NASM with FRET detection to a micro- or macro-arrayed format on an extended substrate such as glass or plastic is easily envisioned.
- Such a sensor array could be used to detect and quantify the presence of an arbitrary target molecule in a complex solution, e.g., crude cell extract or biological fluid, in real time.
- this general NASM strategy could be extended to accomplish multiplexed detection of multiple analytes in a sample simultaneously, by using NASMs labeled with fluorophores having different emission wavelengths.
- the following example contains a sample protocol for the complete process of performing the solid-phase FRET assay described above, including reagent preparation, DNA amplification, RNA transcription, RNA labeling, substrate and instrument set-up, and, finally, assay data acquisition.
- nucleic acid sensor molecules used in the assays described in Example 33. for the case of the cGMP NASM system were prepared as follows:
- the appropriate sequence construct was synthesized and amplified via PCR. This was accomplished using the appropriate DNA template molecule(s) and the corresponding primers:
- cGMP PCR template MK.08.92.A (SEQ ID NO:333) 5′GCTTGCAAGCCCTTAGACCCTGATGAGCCTTGCGATGCAAAAAGGTGC TGACGACACAT CGAAACGGTGAAAGCCGTAGGTCT Primer 1: MK.08.66.B (SEQ ID:334) 5′AGACCTACGGCTTTCACCGTTTCG Primer 2: MK.08.130.B (SEQ ID:335) 5′ATACGACTCACTATAGGATGTCCAGTCGCTTGCAATGCCCTTTTAGAC CCTGATGAG
- a trace amount ( ⁇ 100 ng) of template dsDNA was combined with 10–100 picomoles of each primer, e.g., 1 uL each of 100 uM stocks.
- each primer e.g. 1 uL each of 100 uM stocks.
- run 15 cycles of PCR using a typical (95–55–75° C.) temperature-step profile was run.
- the PCR products were cleaned up using a desalting/size separation column, such as a Qiagen Qiaquick PCR cleanup kit.
- the resuspended volume of cleaned up PCR products was ⁇ 35 uL. The products can be further concentrated, or added directly to a transcription reaction.
- the dsDNA was converted to RNA via in vitro transcription. This was typically accomplished using T7 RNA polymerase and pre-mixed NTPs and buffer, such as are provided in the Epicentre High Yield Transcription Kit.
- the transcription reaction consisting of ⁇ 16–20 uL of cleaned up PCR products in a 40–50 uL total reaction volume, was typically run at 37° C. for ⁇ 8–12 hrs. Following the transcription reaction, the products were usually purified via PAGE or using a desalting/size separation column, such as a Centrisep column (Princeton Separations).
- the fluorescent acceptor labels were attached to the sensor molecules.
- the fluorescent donor label (in this case a FAM label) was attached to the 5′-biotinylated capture oligo during solid-phase synthesis on a commercial DNA synthesizer, via standard phosphoramidite chemistry.
- the labeling procedure was accomplished by a specific oxidation of the 3′ terminus of the RNA using 20 mM NaIO 4 , followed by reaction with a hydrazide-conjugated fluorescent label. The resulting covalent bond is extremely stable under the assay conditions.
- RNA ⁇ 200–400 pmoles in reaction
- 15 ⁇ L 0.3 M NaOAc pH 5.4 15 ⁇ L 0.3 M NaOAc pH 5.4
- 30 ⁇ L 20 mM stock NaIO 4 in a were combined 1.5 mL reaction tube, which was then placed on ice in the dark for ⁇ 1 hr.
- the reaction products were run through a Centrisep desalting column.
- the sample can be ethanol precipitated and resuspended in the original volume.
- the oxidized RNA uses then reacted with the dye-(in this example, AlexaFluor 568)-hydrazide conjugate.
- a typical reaction includes 60 ⁇ L oxidized RNA (resuspended in H 2 O), 60 ⁇ L 0.3 M NaOAc pH 5.4, and 10 ⁇ L 20 mM stock AlexaFluor 568 hydrazide (made fresh in DMSO). This 130 uL reaction was incubated at room temperature for 2 hrs. After the labeling reaction, the sample was ethanol precipitated, resuspended, gel purified (8% PAGE), and quantitated to determine concentration (using the absorbance at 260 nm). Finally, a 1 uM stock solution of the labeled NASM is prepared in water or buffer.
- a typical substrate was a 96 well Pierce Black Neutravidin Plate and a typical plate reader was the Packard Fusion microplate reader (Packard/Perkin-Elmer).
- Packard Fusion microplate reader Packard/Perkin-Elmer
- reaction mixture of NASM+ biotinylated capture oligo was prepared in a 1.5 mL tube:
- the mixture was heat annealed to ⁇ 85° C. in 1 ⁇ annealing buffer (30 mM Tris, 50 mM NaCl), and then cooled to room temperature.
- the assay reactions were run in the presence/absence of target.
- neutravidin plate surfaces were pre-blocked to prevent nonspecific adsorption of sensor molecules:
- Kinetic assay data is assigned as (target-dependent) cleavage reaction proceeds.
- data points were plotted on-screen as they were acquired, giving a real-time readout as the assay proceeds.
Abstract
Methods for engineering a nucleic acid sensor molecule are provided. Biosensors comprise a plurality of nucleic acid sensor molecules labeled with a first signaling moiety and a second signaling moiety. The nucleic acid sensor molecules recognizes target molecules which do not naturally bind to DNA. Binding of a target molecule to the sensor molecules triggers a change in the proximity of the signaling moieties which leads to a change in the optical properties of the nucleic acid sensor molecules on the biosensor. Reagents and systems for performing the method are also provided. The method is useful in diagnostic applications and drug optimization.
Description
This application claims priority to U.S. Ser. No. 60/311,378, filed Aug. 9, 2001; U.S. Ser. No. 60/313,932, filed Aug. 21, 2001; U.S. Ser. No. 60/338,186, filed Nov. 13, 2001; U.S. Ser. No. 60/349,959, filed Jan. 18, 2002; U.S. Ser. No. 60/364,486, filed Mar. 13, 2002; U.S. Ser. No. 60/367,991, filed Mar. 25, 2002; U.S. Ser. No. 60/369,887, filed Apr. 4, 2002; U.S. Ser. No. 60/376,744, filed May 1, 2002; U.S. Ser. No. 60/385,097, filed May 31, 2002; U.S. Ser. No. 60/391,719, filed Jun. 26, 2002; and continuation-in-part U.S. Ser. No. 09/952,680, filed Sep. 13, 2001 now abandoned, which claims priority to U.S. Ser. No. 60/232,454, filed Sep. 13, 2000. The contents of these applications are incorporated herein by reference in their entirety.
The invention relates generally to nucleic acids and more particularly to nucleic acid sensor molecules containing a catalytically active domain that is modulated upon recognition of a target by a target modulation domain of the nucleic acid sensor molecule.
In addition to carrying genetic information, nucleic acids can adopt complex three-dimensional structures. These three-dimensional structures are capable of specific recognition of target molecules and, furthermore, of catalyzing chemical reactions. Nucleic acids will thus provide candidate detection molecules for diverse target molecules, including those which that do not naturally recognize or bind to DNA or RNA.
A nucleic acid which binds to a non-nucleic acid target molecule through non-Watson-Crick base pairing is termed an aptamer. In aptamer selection, combinatorial libraries of oligonucleotides are screened in vitro to identify oligonucleotides, or aptamers, which bind with high affinity to pre-selected targets. Both small biomolecules (e.g., amino acids, nucleotides, NAD, S-adenosyl methionine, chloramphenicol), and large biomolecules (thrombin, Ku, DNA polymerases) are effective targets for aptamers. Aptamer biosensors have been used to detect specific analyte molecules. For example, fluorescently labeled anti-thrombin aptamers attached to a glass surface have been used to directly detect the presence of thrombin proteins in a sample by detecting changes in the optical properties of the aptamers (Potyrailo, et al., 1998). In this method continuous binding of thrombin to the labeled aptamer is requisite for detection to occur, since the concentration of thrombin in a test sample is monitored by directly detecting fluorescent emission of the aptamer-ligand complex. Another method of detecting binding of a ligand to an aptamer has also been described which relies on the use of fluorescence-quenching pairs whose fluorescence is sensitive to changes in secondary structure of the aptamer upon ligand binding (Stanton, et al. 2000) to form a fluorescent aptamer-ligand complex, and again, continuous binding of the ligand to the aptamer is required for signal generation and, hence, for detection to occur. A limitation with this type of aptamer-derived biosensor is that ligand-mediated changes in secondary structure were engineered into the aptamer molecule via a laborious engineering process in which four to six nucleotides were added to the 5′ end of the aptamer that was complementary to the bases at the 3′ end of the thrombin binding region. In the absence of thrombin, this structure forms a stem loop structure, while it forms a G-quartet structure in the presence of thrombin. Fluorescent and quenching groups attached to the 5′ and 3′ end signal this change. In aptamer-based detection without the use of amplification steps, assay sensitivity and hence the limit of detection is set empirically by the affinity of the aptamer-ligand complex, the KD value. Using aptamer-based sensor molecules one can detect analyte binding in both solution (homogeneous) and on solid supports (heterogeneous).
Other ligand detection methods known in the art are based upon antibody binding. Similar to the aptamer-based methods, antibody-based detection requires continuous ligand binding and ligand-antibody complex formation for the generation of a detectable signal. In addition, antibody methods such as ELISA or competitive RIA, while robust, are restricted in utility because these methods require that heterogeneous assay conditions be employed: 1] detection is done on a solid surface; 2] in most applications both a capture antibody and detection antibody are required; 3] for ELISA-based protein detection methods, the antibodies must recognize the folded, native structure of the protein that is present in cell or tissue isolates and; 4] antibody and protein based detection methods have not been described for intracellular or in vivo based analyte detection. That antibodies have not been employed for intracellular and in vivo based detection of proteins, drugs or metabolites is due to several technological factors. First monoclonal antibody fragments are unstable and do not fold properly when expressed as intracellular protein molecules. Second, intracellular detection requires homogeneous assay formats and these solution-based detection methods require the sensor to have a ligand sensing or modulation domain coupled directly to a catalytic or signal generating region of an enzyme or catalytic biomolecule. A fundamental and important consequence of the limitations of antibody-based detection methods is that they can not function as a universal reagent for all assays and tests that can be employed in drug discovery and development. These assays include 1] the initial discovery of a drug target through protein or metabolite profiling, 2] the subsequent use of that same drug target in the discovery of drug leads through high throughput screening and, 3] the optimization of drug leads against that same drug target through an evaluation of lead efficacy in mechanistic cellular and in vivo animal assays.
To streamline the drug discovery and development process and improve the efficiency of evaluating drug targets and drug leads, detection reagents are needed that can function in a context-independent manner. Needed then is a molecular sensor that can function in multiple assay environments and in multiple assay formats. The present invention is generally drawn to nucleic acid molecular sensors that can function in environments and formats that includes but are not limited to solution-based detection (homogeneous in vitro biochemical assays or in vivo cellular and animal assays), chip-based (heterogeneous in vitro assays on solid surfaces), and assays in complex biological isolates from blood plasma, cell lysates or tissue extracts.
Nucleic acid-based detection schemes have exploited the ligand-sensitive catalytic properties of some nucleic acids, e.g., such as ribozymes. Ribozyme-based prototype nucleic acid sensor molecules have been designed both by engineering and by in vitro selection methods. Engineering methods exploit the apparently modular nature of RNA structures; these sensors couple molecular recognition to signaling by simply joining individual target-modulation and catalytic RNA domains through a double-stranded or partially double-stranded RNA linker. ATP sensors, for example, were created by appending the previously-selected, ATP-binding aptamer-derived sequences (Sassanfar and Szostak, 1993) to either the self-cleaving hammerhead ribozyme (Tang and Breaker, 1997) or the L1 self-ligating ribozyme (Robertson and Ellington 2000). Robertson and Ellington (2000) have demonstrated that the enzymatic activity of a ligase ribozyme (derived from the L1 ligase described in Robertson and Ellington (1999)) can be modulated by a small molecule ligand, or small molecule target recognition. In this case, the ligase ribozyme can be employed as a nucleic acid sensor molecule and used to detect the presence and level of its cognate ligand by monitoring the ligation of a small, labeled second oligonucleotide substrate on to the ribozyme. A distinct feature of this detection method is that the actual detection event, e.g., monitoring oligonucleotide substrate ligation to the ribozyme, occurs after the ligand interacts with the nucleic sensor molecule. Hence, unlike antibody, or aptamer based detection methods, the ribozyme-based ligand detection method of Robertson and Ellington does not require continuous binding of the ligand to the sensor molecule in order to generate a detectable signal. In a complementary approach, radiolabeled hammerhead ribozymes which undergo cleavage upon binding to a ligand, have been used to detect ligand by monitoring the release of the label from the ribozyme (Soukup, et al., 2000, and Breaker, 1998). Limitations of the use of ligand modulated hammerhead ribozymes described by Soukup, et al., 2000, and Breaker, 1998 include: 1] the need for a two-step detection method for determining the enzymatic activity of the surface-immobilized hammerhead-derived sensors; 2] the need for radiometric determination of hammerhead activity in both solution and solid-surface based assay formats; 3] the need for significant chemical and structural modification of the hammerhead-based biosensor to render them suitable for optical based detection methods.
Another limitation of the engineering method to sensor generation is that it has been generally thought not to be applicable to the development of protein-dependent ribozymes. Robertson and Ellington (2001) describe their own efforts to extend this methodology to the identification of protein and peptide-dependent ribozymes, but state that simply appending aptamer-derived sequences to the catalytic domain of the L1 ligase at stem C, yields little or no target dependent modulation. Furthermore, the authors state that the “principles required for engineering protein-dependent ribozymes must be fundamentally different from those for identifying ribozymes dependent on small-molecules.” Hence, in order to identify protein and peptide dependent ribozymes, Ellington and Robertson undertook a laborious in vitro selection process which involved randomization of the catalytic core of the L1 ligase coupled with multiple rounds of positive and negative selection. Ellington and Roberts (2000) describe several limitations of the ligase-derived sensors that they developed. First, the nucleoprotein enzymes developed by Ellington and Robertson (2000) required a laborious in vitro selection process to identify peptide and protein dependent ligases. Secondly, Ellington and Roberts (1999) describe a region of the L1 ligase that is required for allosteric ribozyme function, termed the effector oligonucleotide binding domain. It was postulated that the effector oligonucleotide binding domain of the ligase formed complementary base pairing interactions with the oligonucleotide substrate binding site, driving the ribozyme into an inactive conformation. The effector oligonucleotide, when added to the L1 ligase activates (kact) the enzyme by over 10,000 fold over the L1 ligase reaction measure in the absence of effector (kunact). Hence, the native L1-ligase has a switch factor (kact/kunact) greater than 10,000, which determines the sensitivity of a ribozyme-based detection method. When the effector oligonucleotide binding domain of the L1 ligase is deleted, the ligase activity of the deletion mutant is only 3–5 fold lower than the ligase activity of L1 ligase with the effector oligonucleotide bound to the effector oligonucleotide binding domain (Ellington and Robertson (1999). This indicates that L1 ligases deleted of the effector oligonucleotide binding domain may not be not subject to further allosteric regulation. Hence, a hindrance to the development of L1 ligase-based biosensor technology is the lack of a general method for the generation of biosensors that can work in multiple assay and detection formats required of solution-based and chip-based biosensors and, those that can work in multiplexed formats and in complex biological extracts.
The nucleic acid sensor molecules of the present invention are used to monitor the presence or concentration of various target molecules (proteins, post-translationally modified forms of proteins, peptides, nucleic acids, oligosaccharides, nucleotides, metabolites, drugs, toxins, biohazards, and ions) and function in solution-based homogeneous assays using optical or other detection methods; in solution-based homogeneous assays using PCR-based or other nucleotide amplification-based detection methods; in homogeneous intracellular assays using PCR-based detection or other nucleotide amplification-based detection methods; in heterogeneous assays (surface-immobilized nucleic acid sensor molecules and surface-capture nucleic acid sensor molecules) using optical detection methods; and in heterogeneous assays (surface-immobilized nucleic acid sensor molecules and surface-capture nucleic acid sensor molecules) using PCR-based detection or other nucleotide amplification-based detection methods. And finally the nucleic acid sensor molecules of the present invention function in formats where the target analytes are present in complex biological mixtures, or the assays are themselves performed in multiplexed formats.
The nucleic acid sensor molecules of the present invention were developed through a combination of engineering and selection methods that are now shown to be useful for identifying nucleic acid sensor molecules against a wide variety of target molecules including proteins (including specific post-translationally modified forms of proteins) peptides, nucleic acids, oligosaccharides, nucleotides, metabolites, drugs, toxins, biohazards, ions, carbohydrates, glycoproteins, hormones, receptors, antibodies, viruses, transition state analogs, cofactors, dyes growth factory nutrients, etc.
In one embodiment of the invention the nucleic acid sensor molecules are based on cis-cleaving hammerhead ribozymes that have been designed to work as optical signaling molecules in a homogeneous assay format, and utilize fluorescence and FRET based methods of signal generation and detection.
In one embodiment of the invention nucleic acid sensor molecules are based on cis-cleaving hammerhead ribozymes that have been designed to work as optical signaling molecules affixed to a solid-support, and utilize fluorescence and FRET based methods of signal generation and detection.
In one embodiment of the invention the nucleic acid sensor molecules are based on cis-cleaving hammerhead ribozymes that have been designed to work as optical signaling molecules affixed to a solid-support and utilize surface plasmon resonance methods of signal generation and detection.
In one embodiment of the invention the nucleic acid sensor molecules are based on a 3-piece L1 ligase ribozyme that retains the effector oligonucleotide binding domain, and has been designed to detect target molecules, as a function of oligonucleotide substrate ligation to the nucleic acid sensor molecule, in solution using quantitative PCR-based methods.
In one embodiment of the invention the nucleic acid sensor molecules are based on a 2-piece L1 ligase ribozyme that couples the effector oligonucleotide substrate to the oligonucleotide substrate forming an oligonucleotide supersubstrate and, has been designed to detect target molecules, as a function of oligonucleotide supersubstrate ligation to the nucleic acid sensor molecule, in solution using quantitative PCR-based methods.
In one embodiment of the invention the nucleic acid sensor molecules are based on a 1 -piece L1 ligase ribozyme that deletes the effector oligonucleotide binding domain. The 1-piece ligase is designed to self-ligate or circularize by joining the 3′-OH end and the PPP-5′-end of the ligase and detects target molecules, as a function of circularization of the nucleic acid sensor molecule, in solution using PCR-based methods.
In one embodiment of the invention the nucleic acid sensor molecules are based on a 3-piece L1 ligase ribozyme that retains the effector oligonucleotide binding domain, and has been designed to detect target molecules, as a function of oligonucleotide substrate ligation to the nucleic acid sensor molecule immobilized on a solid support and where the detection uses fluorescence-based methods.
In one embodiment of the invention the 3-piece L1 ligase nucleic acid sensor molecules detect target molecules, as a function of oligonucleotide substrate ligation to the nucleic acid sensor molecule in solution and then are subsequently captured on a solid support and detected using fluorescence-based methods.
In one embodiment of the invention the 3-piece L1 ligase nucleic acid sensor molecules detect target molecules, as a function of oligonucleotide substrate ligation to the nucleic acid sensor molecule in solution and then are subsequently captured on a solid support and detected using radiometric-based methods.
In one embodiment of the invention the nucleic acid sensor molecules are based on a 2-piece L1 ligase ribozyme and has been designed to detect target molecules, as a function of oligonucleotide substrate ligation to the nucleic acid sensor molecule immobilized on a solid support and where the detection uses optical methods such as fluorescence-based methods.
In one embodiment of the invention the 2-piece L1 ligase nucleic acid sensor molecules detect target molecules, as a function of oligonucleotide substrate ligation to the nucleic acid sensor molecule in solution and then are subsequently captured on a solid support and detected directly using fluoresence-based methods.
In one embodiment of the invention the 2-piece L1 ligase nucleic acid sensor molecules detect target molecules, as a function of oligonucleotide substrate ligation to the nucleic acid sensor molecule in solution and then are subsequently captured on a solid support and directly detected using radiometric-based methods.
In one embodiment of the invention the nucleic acid sensor molecules is based on a 1 -piece L1 ligase ribozyme that is transfected into a mammalian cell. The 1-piece ligase is designed to self-ligate or circularize by joining the 3′-OH end and the PPP-5′-end of the ligase and detects intracellular target molecules, as a function of circularization of the nucleic acid sensor molecule. The circularized ligase molecules are then re-isolated from the cellular lysate and the amount of target present in the cell is quantified using solution based nucleotide amplification methods.
In one aspect, the invention includes a nucleic acid sensor molecule which includes a target modulation domain which recognizes a target molecule, a linker domain, a catalytic domain, and an optical signal generating unit.
In one embodiment, the nucleic acid sensor molecule of the invention has an optical signal generating unit that includes at least one signaling moiety. In another embodiment, the nucleic acid sensor molecule of the invention has an optical signal generating unit which includes at least a first signaling moiety and a second signaling moiety. In another embodiment, the first and second signaling moieties change proximity to each other upon recognition of a target by the target modulation domain. In another embodiment, the first and second signaling moieties include a fluorescent donor and a fluorescent quencher, and recognition of a target by the target modulation domain results in an increase in detectable fluorescence of said fluorescent donor. In another embodiment, the first signaling moiety and said second signaling moiety include fluorescent energy transfer (FRET) donor and acceptor groups, and recognition of a target by the target modulation domain results in a change in distance between said donor and acceptor groups, thereby changing optical properties of said molecule.
In another embodiment, the invention includes a nucleic acid sensor molecule where the optical signal generating unit consists essentially of a first signaling moiety which changes conformation upon recognition of a target by the target modulation domain, thereby resulting in a detectable optical signal.
In yet another embodiment, the nucleic acid sensor molecule includes at least one modified nucleic acid.
In still another embodiment, the catalytic domain of the nucleic acid sensor molecule includes an endonucleolytic ribozyme. The endonucleolytic ribozyme can be, for example, a cis-endonucleolytic ribozyme or a trans-endonucleolytic ribozyme. In one embodiment, the endonucleolytic ribozyme is a hammerhead ribozyme.
In another embodiment, the catalytic domain of the nucleic acid sensor includes a self-ligating ribozyme. The elf-ligating ribozyme can be, for example, a cis-ligase ribozyme or a trans-ligase ribozyme. The self-ligating ribozyme can be, e.g., a 1-piece ligase, 2-piece ligase or 3-piece ligase.
In another embodiment, the target modulation domain recognizes a target that is selected from proteins, post-translationally modified forms of proteins, peptides, nucleic acids, oligosaccharides, nucleotides, metabolites, drugs, toxins, biohazards, ions, carbohydrates, polysaccharides, hormones, receptors, antigens, antibodies, viruses, metabolites, co-factors, drugs, dyes, nutrients, or growth factors.
In one embodiment, the target modulation domain recognizes a protein or a post-translationally modified protein.
In another embodiment, the target modulation domain recognizes a post-translationally modified protein, wherein the post-translational modification can be a phosphorylation, prenylation, glycosylation, methionine removal, N-acetylation, acylation, acylation of cysteines, myristoylation, alkylation, ubiquitinylation, prolyl-4-hydroxylation, carboxylation of glutaminyl residues, advanced glycoslylation, deamination of glutamine and asparagine, addition of glycophosphatidylinositol, disulfide bond formation, hydroxylation, or lipidation.
In some embodiments, the target is a protein kinase. In other embodiments, the target is a phosphorylated protein kinase. The phosphorylated protein kinase can be a monophosphorylated protein kinase or a diphosphorylated protein kinase. In one embodiment, the target protein is ERK, such as ERK1 or ERK2. In other embodiments, the post-translationally modified protein is ppERK, such as such as ppERK1 or ppERK2.
In other embodiments, the nucleic acid sensor molecule includes a target modulation domain which recognizes a component of a MAP kinase pathway, a product of a MAP kinase pathway, a MAP kinase pathway associated protein, or an extracellular component of a MAP kinase pathway. In one embodiment, the target modulation domain recognizes a component of the ERK1/2 MAP kinase pathway, the JNK MAP kinase pathway, or the P38 MAP kinase pathway.
In some embodiments, the target modulation domain recognizes an endogenous form of a MAP Kinase (MEK), an endogenous form of a MAP Kinase Kinase (MEKK), or an endogenous form of MAP Kinase Kinase Kinase, (MEKKK). In other embodiments, the target modulation domain recognizes an endogenous form of RAF kinase. In still other embodiments, the target modulation domain recognizes a Ras protein, a phosphatase, s a GTP binding protein, a GPCR, a cytokine, a growth factor, a cellular metabolite, or a small molecule.
In some embodiments, the nucleic acid sensor molecule includes RNA, DNA, or both RNA and DNA.
The invention also relates to compositions containing a nucleic acid sensor molecule of the invention and a buffer. In some embodiments, the invention includes a composition containing a nucleic acid sensor molecule and a tissue extract, a cell extract or an in vitro cell culture. In other embodiments, a composition of the invention also includes an RNase inhibitor, such as, for example, Va-riboside, vanadyl, tRNA, polyU, RNaseln or RNaseOut. In some embodiments, a composition of the invention is substantially RNase-free.
The invention also relates to a composition which includes at least one nucleic acid sensor molecule affixed to a substrate. In some embodiments, the substrate is glass, gold or other metal, silicon or other semiconductor material, nitrocellulose, nylon, or plastic. In particular embodiments, the nucleic acid sensor molecule is covalently attached to the substrate. In other embodiments, the nucleic acid sensor molecule is non-covalently attached to the substrate. In some embodiments, the nucleic acid sensor molecule is immobilized to the substrate via hybridization of a terminal portion of the nucleic acid sensor molecule to an oligonucleotide that is bound to the surface of the substrate.
In some embodiments, a composition includes a plurality of nucleic acid sensor molecules immobilized to the substrate via hybridization of a terminal portion of the nucleic acid sensor molecule to an array of oligonucleotides bound to the substrate at spatially discrete regions. In some embodiments, at least two members of this plurality each recognize different target molecules. The substrate can include, for example, at least 50 nucleic acid sensor molecules. In other embodiments, the substrate includes at least 250 nucleic acid sensor molecules, at least 500 nucleic acid sensor molecules, or at least 5000 nucleic acid sensor molecules.
In some aspects, the invention includes a system for detecting a target molecule which includes a composition according to the invention and a detector in optical communication with the composition, where the detector detects changes in the optical properties of the composition. In some embodiments, the system further includes a light source in optical communication with the composition. In some embodiments, the system also includes a processor for processing optical signals detected by the detector.
In one embodiment, the system for detecting a target molecule includes a plurality of nucleic acid sensor molecules where at least two of the biosensor molecules each recognize different target molecules.
In another aspect, the invention includes a method of identifying or detecting a target molecule in a sample by contacting a sample suspected of containing a target molecule with a nucleic acid sensor molecule of the invention, wherein a change in the signal generated by the optical signal generating unit indicates the presence of target in the sample. In some embodiments, the method further includes quantifying the change signal generated by the optical signal generating unit to quantify the amount of target molecule in the sample. In some embodiments, the sample is an environmental sample, biohazard materials, organic samples, drugs and toxins, flavors and fragrances, and biological samples. In particular embodiments, the sample is a biological sample such as cells, cell extracts or lysates, tissues or tissue extracts, bodily fluids, serum, blood and blood products.
In some embodiments, the method of identifying or detecting a target molecule in a sample detects of identifies proteins, post-translationally modified forms of proteins, peptides, nucleic acids, oligosaccharides, nucleotides, metabolites, drugs, toxins, biohazards, ions, carbohydrates, polysaccharides, hormones, receptors, antigens, antibodies, viruses, metabolites, co-factors, drugs, dyes, nutrients, or growth factors. In other embodiments, the method of the invention detects of identifies proteins or post-translationally modified forms of proteins. In some embodiments, the target is a post-translationally modified protein, where the post-translation modifications is phosphorylation, prenylation, glycosylation, methionine removal, N-acetylation, acylation, acylation of cysteines, myristoylation, alkylation, ubiquitinylation, prolyl-4-hydroxylation, carboxylation of glutaminyl residues, advanced glycoslylation, deamination of glutamine and asparagine, addition of glycophosphatidylinositol, disulfide bond formation, hydroxylation, or lipidation.
In some embodiments, the target is a protein kinase. In particular embodiments, the target is a phosphorylated protein kinase.
In another aspect, the invention includes a diagnostic system for identifying or detecting a target molecule, where the diagnostic system includes a nucleic acid sensor molecule of the invention and a detector in communication with the nucleic acid sensor molecule, wherein the detector detects changes in the signal generated by the optical signal generating unit of the nucleic acid sensor. In some embodiments, the diagnostic system further includes a processor for processing signals detected by the detector.
In another aspect, the invention includes a method of identifying or detecting a protein kinase in a sample by contacting a sample suspected of containing a protein kinase with a nucleic acid sensor molecule, wherein said nucleic acid sensor molecule has a target recognition domain that recognizes a protein kinase, and wherein a change in the signal generated by the optical signal generating unit indicates the presence of protein kinase in the sample. In some embodiments, the method further includes quantifying the amount of signal generated by the optical signal generating unit to quantify the amount of protein kinase in the sample.
In yet another aspect, the invention provides a method of identifying a modulator of protein kinase activity by contacting a test agent with a protein kinase and nucleic acid sensor molecule, wherein the nucleic acid sensor molecule has a target recognition domain that recognizes a protein kinase, recognition of the protein kinase by the target recognition domain of the nucleic acid sensor molecule results in a change in the signal generated by the optical signal generating unit and wherein changes in the signal generated by the optical signal generating unit in the presence and absence of the test agent indicates the test agent is a modulator, of the protein kinase activity.
In some embodiments, the catalytic domain of the nucleic acid sensor molecule includes a cis-ligase ribozyme or a trans-ligase ribozyme.
In another aspect, the invention provides a nucleic acid sensor molecule which includes a target modulation domain that recognizes ERK, a catalytic domain that includes a ligase or cis-hammerhead, and a linker domain that links the target modulation domain and the catalytic domain.
In another aspect, the invention includes a nucleic acid sensor molecule which includes a target modulation domain that recognizes phosphoERK, a catalytic domain that includes a ligase or a cis-hammerhead, and a linker domain that links the target modulation domain and the catalytic domain.
In yet another aspect, the invention provides a nucleic acid sensor molecule which includes a target modulation domain that recognizes lysozyme, a catalytic domain that includes a 1-piece cis-ligase and a linker domain that links the target modulation domain and the catalytic domain.
In still another aspect, the invention provides a nucleic acid sensor molecule which includes a target modulation domain that recognizes any one of cCMP, cAMP, or cGMP, a catalytic domain, and a linker domain that links the target modulation domain and the catalytic domain, wherein the nucleic acid sensor molecule includes an optical signal generating unit or a non-radioactive detectable label. In some embodiments, the nucleic acid sensor molecule includes an optical signal generating unit. In other embodiments, the nucleic acid sensor molecule includes a detectable label. In a particular embodiment, the label is a radioactive label, such as, for example, 32P, 33P, 14C, 35S, 3H, or 125I. In other embodiments, the nucleic acid sensor molecule comprises a fluorescent label, such as, for example, fluorescein, DABCYL, or a green fluorescent protein (GFP) moiety. In some embodiments, the optical signal generating unit includes a fluorescent moiety and a quenching moiety, wherein recognition by the target modulation domain causes causes a change in detectable fluorescence by the optical signal generating unit. In some embodiments, the nucleic acid sensor molecule includes an enzymatic label, or an affinity capture tag label.
In some embodiments, the nucleic acid sensor molecule includes a target modulation domain recognizes ERK1, ERK2 or both. In a particular embodiment, the nucleic acid sensor molecule includes a target modulation domain and catalytic domain are as shown by SEQ ID NO. 80, and the linker is randomized.
In some embodiments, the nucleic acid sensor molecule includes a target modulation domain and a catalytic domain as shown in any one of SEQ ID NOS. 47, 118 and 119, and the linker is randomized.
In another aspect, the invention provides a nucleic acid sensor molecule that recognizes ERK having the SEQ ID NO. 90–95, 108–116, 131–133, 140–295, 349, 351, or 356.
In another aspect, the invention provides a nucleic acid sensor molecule that recognizes phospoERK having the SEQ ID NO. 5–8, 37–39, 44–45, 81–89, 96–100, 121–130, 352, or 353.
In another aspect, the invention provides a nucleic acid sensor molecule that recognizes any one of cCMP, cAMP or cGMP, having the SEQ ID NO. 40–43, 103, or 135–139.
In another aspect, the invention provides a nucleic acid sensor molecule that recognizes lysozyme, having the SEQ ID NO. 46, 47, 76, or 105–107.
In another aspect, the invention provides a 1-piece ligase ribozyme including a target modulation domain that recognizes a target, a linker domain, and a catalytic domain wherein the 5′ and 3′ ends of the ligase ligate to each other upon recognition of the target by the modulation domain.
In another aspect, the invention provides a 2-piece ligase ribozyme including a target modulation domain that recognizes a target, a linker domain, and a catalytic domain including an oligonucleotide substrate ligation site and and oligonucleotide supersubstrate binding domain, wherein upon recognition of the target by the modulation domain, the 3′ end of the an oligonucleotide supersubstrate is ligated to the 5′ end of the oligonucleotide substrate ligation site.
In yet another aspect, the invention provides a 3-piece ligase ribozyme including a target modulation domain that recognizes a target, a linker domain, and a catalytic domain comprising comprising an oligonucleotide substrate binding domain capable of binding an oligonucleotide substrate and an effector-oligonucleotide binding site capable of binding an effector oligonucleotide, wherein upon recognition of the target by the modulation domain, and in the presence of binding of the effector oligonucleotide to the effector-oligonucleotide binding site, then the 3′ end of the oligonucleotide substrate is ligated to the 5′ end of the ligase.
The invention also provides a 1-piece ligase ribozyme comprising the nucleic acid sensor molecule shown in any one of SEQ ID NOS. 47, 105–107, 119.
The invention also provides a 2-piece ligase ribozyme comprising the nucleic acid sensor molecule shown in any one of SEQ ID NOS. 347, 349, and 351.
The invention further provides a 3-piece ligase ribozyme comprising the nucleic acid sensor molecule shown in any one of SEQ ID NOS. 46, 75, 76, 108–116, 118, 121–130, and 352.
Unless otherwise defined, all technical and scientific terms used herein have the same meaning as commonly understood by one of ordinary skill in the art to which this invention belongs. Although methods and materials similar or equivalent to those described herein can be used in the practice or testing of the present invention, suitable methods and materials are described below. All publications, patent applications, patents, and other references mentioned herein are incorporated by reference in their entirety. In the case of conflict, the present specification, including definitions, will control. In addition, the materials, methods, and examples are illustrative only and not intended to be limiting.
Other features and advantages of the invention will be apparent from the following detailed description and claims.
The invention is generally drawn to catalytic NASMs (also know as allosteric ribozymes, aptazymes and the like) and optical nucleic acid sensor molecules that may be used to monitor the presence or concentration of various target molecules. Target molecules include a variety of biologically relevant molecules, such as, for example, proteins (including specific post-translationally modified forms of proteins), peptides, nucleic acids, nucleotides, natural products, metabolites, drugs, toxins, biohazards, and ions.
The invention also includes methods by which a change in the activity or conformation of a nucleic acid sensor molecule upon recognition of a specific target molecule can be coupled to a quantifiable, measurable signal. The invention also includes methods which allow one to test the inhibitory activity of one or more compounds simultaneously against one or more enzymes or biochemical targets. Assays can be carried out in a variety of formats, including in vitro biochemical assays, in vitro cellular assays, in vivo cellular assays, in solution, on chips or other substrates, or in vivo animal models. These assays have applications in all phases of drug discovery, including target validation and discovery and development, high throughput screening, biochemical assays, in vitro cellular models and in vivo animal models.
Nucleic acid sensor molecules are RNAs, DNAs, RNA/DNA hybrids, or derivatives or analogs of nucleic acids that catalyze a chemical reaction and/or undergo a conformational change upon the recognition of a specific target molecule. Nucleic acid sensor molecule - based assays can be carried out using all catalytic platforms, which include endonucleases, such as the hammerhead ribozyme, the hairpin ribozyme, the HDV ribozyme, and the VS ribozyme; ligases, such as the L1 ligase, and the class I–III ligases and; group I and group II self-splicing introns.
Catalytic NASMs can be generated or selected by a variety of methods both disclosed herein and known in the art. For examples, see WO98/27104, WO01/96559, and WO 00/26226 Also disclosed herein are optical nucleic acid sensor molecules and methods making them. In general, optical catalytic NASMs generate a detectable optical signal upon recognition of a target molecule. Optical NASMs are generated from catalytic NASMs by addition of an optical signal generating unit.
Also disclosed herein are two new classes of catalytic NASMs (referred to as one-piece or cis ligases) and two piece ligases and methods of generating them.
In general, catalytic NASMs can be used, e.g., to detect target molecules either by generation of an optical signal or an amplicon detectable, e.g., by RT-PCR, size gel purification procedures and any other means of seperating variously sized or conformed nucleic acid molecules. Optical NASMs, on the other hand, can be used, e.g., to detect target molecules by generation of an optical signal.
Optical signals can be generated by optical NASMs in a number of ways. In some embodiments the signal is an optical signal generated, e.g., by the fluorescence of a fluorescent dye. In other embodiments, the signal is an optical signal generated by molecules in close proximity to the nucleic acid sensor molecule whose optical or electrochemical properties are affected by the presence of the target molecule bound nucleic acid sensor molecule. In some embodiments the nucleic acid sensor molecules comprise at least one signaling moiety. In other embodiments, the nucleic acid sensor molecules comprise first and second signaling moieties whose optical properties change in response to the binding of a target molecule through changes in the proximity of the first and second signaling moieties. Thus, detection can be direct or indirect.
In one embodiment, a plurality of nucleic acid sensor molecules are provided, either in solution, or immobilized on a substrate, generating a biosensor. In a further embodiment, a diagnostic system is provided which comprises at least one biosensor in optical communication with a optical signal detector. Methods of using the diagnostic system are also provided, as well as kits for performing the method.
In other embodiments, the NASMs are used to detect the presence of target molecules in vivo.
In order to more clearly and concisely describe and point out the subject matter of the claimed invention, the following definitions are provided for specific terms which are used in the following written description and the appended claims.
As defined herein, a “oligonucleotide” is used interchangeably with the term “nucleic acid” and includes RNA or DNA (or RNA/DNA) sequences of more than one nucleotide in either single strand or double-stranded form. A “modified oligonucleotide” includes at least one residue with any of: an altered intemucleotide linkage(s), altered sugar(s), altered base(s), or combinations thereof.
As defined herein, a “target molecule” is any molecule to be detected. The term “target molecule” refers to, any molecule for which nucleic acid sensor molecule exists or can be generated and can be naturally occurring or artificially created.
As defined herein, a “signature target molecule” is a target molecule whose expression is correlatable with a trait.
As used herein, a “diagnostic signature target molecule” is a signature target molecule whose expression is, by itself or in combination with other signature target molecules, diagnostic of a trait.
As used herein, a “pathway target molecule” is a target molecule involved in a biological or metabolic pathway and whose accumulation and/or activity is dependent on other target molecules in the same biological or metabolic pathway, or whose accumulation and/or activity affects the accumulation and/or activity of other target molecules in the same biological or metabolic pathway.
As used herein, a “diagnostic pathway target molecule” is a pathway target molecule whose expression/activity and/or structural properties, by itself or in combination with other pathway target molecules, is diagnostic of a particular trait.
As used herein, a “profiling nucleic acid sensor molecule” is a nucleic acid sensor molecule that recognizes a signature target molecule, a diagnostic signature target molecule, a pathway target molecule, and/or a diagnostic pathway target molecule.
As defined herein, a “biosensor” comprises a plurality of nucleic acid sensor molecules.
As defined herein, a “profiling biosensor” comprises a plurality of profiling nucleic acid sensor molecules.
As used herein, a molecule which “naturally binds to DNA or RNA” is one which is found within a cell in an organism found in nature.
As defined herein, a “target modulation domain” is the portion of a nucleic acid sensor molecule which recognizes a target molecule. The target modulation domain is also sometimes referred to herein as the “target activation site” or “effector modulation domain”.
As used herein a “catalytic domain” is the portion of a nucleic acid sensor molecule possessing catalytic activity which is modulated in response to binding of a target molecule to the target modulation domain.
As used herein, a “linker region” or “linker domain” is a portion of a nucleic acid sensor molecule by or at which the “target modulation domain” and “catalytic domain” are joined. Linker regions include, but are not limited to oligonucleotides of varying length, baseparring phosphodiester, phosphothiolate, and other covalent bonds, chemical moieties (e.g., PEG), PNA, formacetal, bismaleimide, disulfide, and other bifunctional linker reagents. The linker domain is also sometimes referred to herein as a “connector” or “stem”.
As used herein, a “random sequence” or a “randomized sequence” is a segment of a nucleic acid having one or more regions of fully or partially random sequences. A fully random sequence is a sequence in which there is an approximately equal probability of each base (A, T, C, and G) being present at each position in the sequence. In a partially random sequence, instead of a 25% chance that an A, T, C, or G base is present at each position, there are unequal probabilities.
As defined herein, “a fixed region” is a nucleic acid sequence which is known.
As defined herein, “amplifying” means any step or process or any combination of steps or processes that increases the amount or number of copies of a molecule or class of molecules.
As defined herein, a “catalytic nucleic acid sensor molecule” is a nucleic acid molecule 20 comprising a target modulation domain, a linker region, and a catalytic domain.
As defined herein, an “optical nucleic acid sensor molecule” is a catalytic nucleic acid sensor molecule wherein the catalytic domain has been modified to emit an optical signal as a result of and/or in lieu of catalysis by the inclusion of an optical signal generating unit.
As defined herein, a “nucleic acid sensor molecule” or “NASM” refers to either or both of a catalytic nucleic acid sensor molecule and an optical nucleic acid sensor molecule.
As used herein, a “signal” is a detectable physical quantity, impulse or object.
As used herein, an “optical signal” is a signal the optical properties of which can be detected.
As defined herein, an “optical signal generating unit” is a portion of a nucleic acid sensor molecule comprising one or more nucleic acic sequences and/or non-nucleic acid molecular entities, which change optical or electrochemical properties or which change the optical or electrochemical properties of molecules in close proximity to them in response to a change in the conformation or the activity of the nucleic acid sensor molecule following recognition of a target molecule by the target modulation domain.
As defined herein, a nucleic acid sensor molecule which “recognizes a target molecule” is a nucleic acid molecule whose activity is modulated upon binding of a target molecule to the TMD a greater extent than it is by the binding of any non-target molecule or in the absence of the target molecule. The recognition event between the nucleic acid sensor molecule and the target molecule need not be permanent during the time in which the resulting allosteric modulation occurs. Thus, the recognition event can be transient with respect to the ensuing allosteric modulation (e.g., conformational change) of the nucleic acid precursor molecule or nucleic acid sensor molecule.
As defined herein, an “array” or “microarray” refers to a biosensor comprising a plurality of nucleic acid sensor molecules immobilized on a substrate.
As defined herein, a “substrate” refers to any physical supporting surface, whether rigid, flexible, solid, porous, gel-based, or of any other material or composition.
As defined herein, an “amplicon” is the sequence of a nucleic acid sensor molecule with ligase activity covalently ligated to an oligonucleotide substrate.
As defined herein, a “cleavage substrate” is an oligonucleotide or portion of an oligonucleotide cleaved upon target molecule recognized by a target modulation domain of an endonucleolytic nucleic acid sensor molecule.
As defined herein, an “oligonucleotide substrate” is an oligonucleotide that is acted upon by the catalytic domain of a nucleic acid sensor molecule.
As defined herein, an “effector oligonucleotide” is an oligonucleotide that base pairs with the effector oligonucleotide binding domain of a nucleic acid sensor molecule with ligase activity.
As defined herein, an “effector oligonucleotide binding domain” is the portion of the nucleic acid sensor molecule with ligase activity which is complementary to the effector oligonucleotide.
As defined herein, a “capture oligonucleotide” is an oligonucleotide that is used to attach a nucleic acid sensor molecule to a substrate by complementarity and/or hybridization.
As defined herein, an “oligonucleotide substrate binding domain” is the portion on the nucleic acid sensor molecule with ligase activity that is complementary to and can base pair with an oligonucleotide substrate.
As defined herein, a “oligonucleotide supersubstrate” is an oligonucleotide substrate that is complementary to and can base pair with the oligonucleotide substrate binding domain and to the effector oligonucleotide binding domain of a nucleic acid sensor molecule with ligase activity. The oligonucleotide supersubstrate may or may not carry an affinity tag.
As defined herein, a “oligonucleotide supersubstrate binding domain” is the region of a nucleic acid sensor molecule with ligase activity that is complementary to and can base pair with the oligonucleotide supersubstrate.
As defined herein, “stem selection” refers to a process performed on a pool of nucleic molecules comprising a target modulation domain, a catalytic domain and an oligonucleotide linker region wherein the linker region is fully or partially randomized.
As defined herein, “rational design/engineering” refers to a technique used to construct nucleic acid sensor molecules in which a non-conserved region of a ribozyme is replaced with a target modulation domain and joined to the catalytic domain of the ribozyme by an oligonucleotide linker region.
As defined herein, “amplicon dependent nucleic acid amplification” refers to a technique by which one can amplify the signal of a nucleic acid sensor molecule by use of standard RT/PCR or Real-Time RT-PCR methods.”
As defined herein, “switch factor” is the enhancement observed in the catalytic activity and/or catalytic initial rate of a nucleic acid sensor molecule upon recognition of a target molecule by the target modulation domain.
As defined herein, a “cis-ligase ribozyme” is a ligase ribozyme that ligates its 3′ end to its 5′ end. The cis-ligase ribozyme is also referred herein as “1-piece ligase” and is a 1-component system where oligonucleotide substrate, oligonucleotide substrate binding domain, catalytic domain, effector oligonucleotide and effector oligonucleotide binding domains are fused in the format shown in FIG. 39 .
As defined herein, a “trans-ligase ribozyme” is a ligase ribozyme that ligates its 5′ end to the 3′ end of an oligonucleotide substrate.
As defined herein, a “2-piece ligase” is a 2-component trans-ligase ribozyme. The first component consists of the catalytic domain, the linker region, the target modulation domain, the substrate binding domain and the effector oligonucleotide binding domain. The second component is the oligonucleotide substrate that is complementary to the substrate binding domain and the effector oligonucleotide binding domain. This system follows the format shown in FIG. 41 .
As defined herein, a “3-piece ligase” is a 3-component trans-ligase ribozyme. The first component consists of the catalytic domain, the linker, the target modulation domain, the substrate binding domain and the effector oligonucleotide binding domain. The second component is the effector oligonucleotide that is complementary to the effector oligonucleotide binding domain. The third component is the oligonucleotide substrate that is complementary to the substrate binding domain. This system follows the format of the 3-piece ligase platform shown in FIG. 39 .
1. Generating a Target Specific Nucleic Acid Sensor Molecule
Catalytic nucleic acid sensor molecules (NASMs) are selected which have a target molecule-sensitive catalytic activity (e.g., ligation or self-cleavage) from a pool of randomized oligonucleotides. The catalytic NASMs have a target modilation domain to which the target molecule specifically binds and a catalytic domain for mediating a catalytic reaction. Binding of a target molecule to the target modulation domain triggers a conformation change and/or change in catalytic activity in the nucleic acid sensor molecule. In one embodiment, by modifying (e.g., removing) at least a portion of the catalytic domain and coupling it to an optical signal generating unit, an optical nucleic acid sensor molecule is generated whose optical properties change upon binding of a target molecule to the target modulation domain. In one embodiment, the pool of randomized oligonucleotides comprises the catalytic site of a ribozyme.
A. Selection and Generation of Catalytic Nucleic Acid Sensor Molecules
In one embodiment, a heterogeneous population of oligonucleotide molecules comprising randomized sequences is screened to identify a nucleic acid sensor molecule having a catalytic activity which is modified (e.g., activated) upon interaction with a target molecule. Each oligonucleotide in the population comprises a random sequence and at least one fixed sequence at its 5′ and/or 3′ end. In one embodiment, the fixed sequence comprises at least a portion of a catalytic site. In the embodiments shown in FIGS. 1 and 4 , the random sequence is flanked at both ends with fixed sequences.
In one embodiment, the random sequence portion of the oligonucleotide is about 15–70 (e.g., 30–40) nucleotides in length and can comprise ribonucleotides and/or deoxyribonucleotides. Random oligonucleotides can be synthesized from phosphodiester-linked nucleotides using solid phase oligonucleotide synthesis techniques well known in the art (see, e.g., Froehler, et al., 1986a; 1986b. Oligonucleotides can also be synthesized using solution phase methods such as triester synthesis methods (see, e.g., Sood, et al., 1977, and Hirose, et al., 1978). Typical syntheses carried out on automated DNA synthesis equipment yield 1015–1017 molecules. Sufficiently large regions of random sequence in the sequence design increases the likelihood that each synthesized molecule is likely to represent a unique sequence.
To synthesize randomized sequences, mixtures of all four nucleotides are added at each nucleotide addition step during the synthesis process, allowing for random incorporation of nucleotides. In one embodiment, random oligonucleotides comprise entirely random sequences; however, in other embodiments, random oligonucleotide can comprise stretches of nonrandom or partially random sequences. Partially random sequences can be created by adding the four nucleotides in different molar ratios at each addition step.
To generate oligonucleotide populations which are resistant to nucleases and hydrolysis, modified oligonucleotides can be used and can include one or more substitute intemucleotide linkages, altered sugars, altered bases, or combinations thereof. In one embodiment, oligonucleotides are provided in which the P(O)O group is replaced by P(O)S (“thioate”), P(S)S (“dithioate”), P(O)NR2 (“amidate”), P(O)R, P(O)OR′, CO or CH2 (“formacetal”) or 3′-amine (—NH—CH2—CH2—), wherein each R or R′ is independently H or substituted or unsubstituted alkyl. Linkage groups can be attached to adjacent nucleotide through an —O—N—, or —S— linkage. Not all linkages in the oligonucleotide are required to be identical.
In further embodiments, the oligonucleotides comprise modified sugar groups, for example, one or more of the hydroxyl groups is replaced with halogen, aliphatic groups, or functionalized as ethers or amines. In one embodiment, the 2′-position of the furanose residue is substituted by any of an O-methyl, O-alkyl, O-allyl, S-alkyl, S-allyl, or halo group. Methods of synthesis of 2′-modified sugars are described in Sproat, et al., 1991; Cotten, et al., 1991; and Hobbs, et al., 1973. The use of 2-fluoro-ribonucleotide oligomer molecules can increase the sensitivity of a nucleic acid sensor molecule for a target molecule by ten-to one hundred-fold over those generated using unsubstituted ribo- or deoxyribooligonucleotides (Pagratis, et al., 1997), providing additional binding interactions with a target molecule and increasing the stability of the nucleic acid sensor molecule's secondary structure(s) (Kraus, et al., 1998; Pieken, et al., 1991; Lin, et al., 1994; Jellinek, et al. 1995; Pagratis, et al., 1997).
In the embodiments shown in FIGS. 1 and 4 , the random sequence portion of the oligonucleotide is flanked by at least one fixed sequence which comprises a sequence shared by all the molecules of the oligonucleotide population. Fixed sequences include sequences such as hybridization sites for PCR primers, promoter sequences for RNA polymerases (e.g., T3, T4, T7, SP6, and the like), restriction sites, or homopolymeric sequences, such as poly A or poly T tracts, catalytic cores (described further below), sites for selective binding to affinity columns, and other sequences to facilitate cloning and/or sequencing of an oligonucleotide of interest. In one embodiment, the fixed sequence is approximately 50 nucleotides in length.
In a preferred embodiment, the fixed sequence comprises at least a portion of a catalytic site of an oligonucleotide molecule (e.g., a ribozyme) capable of catalyzing a chemical reaction. Catalytic sites are well known in the art and include, e.g. a ligase site (see FIG. 2 ), the catalytic sites of Group I or Group II introns (see, e.g., U.S. Pat. No. 5,780,272), the catalytic core of a hammerhead ribozyme (see, e.g., U.S. Pat. No. 5,767,263 and U.S. Pat. No. 5,700,923, and FIG. 5 , herein) or a hairpin ribozyme (see, e.g., U.S. Pat. No. 5,631,359. Other catalytic sites are disclosed in U.S. Pat. No. 6,063,566, Koizumi et al., FEBS Lett. 239: 285–288 (1988), Haseloff and Gerlach, Nature 334: 585–59 (1988), Hampel and Tritz, Biochemistry 28: 4929–4933 (1989), Uhlenbeck, Nature, 328: 596–600 (1987), and Fedor and Uhlenbeck, Proc. Natl. Acad. Sci. USA 87: 1668–1672 (1990)).
Nucleic acid sensor molecules are generally selected in a 5 to 20 cycle procedure. In one embodiment, heterogeneity is introduced only in the initial selection stages and does not occur throughout the replicating process. FIG. 1A shows a schematic diagram in which the oligonucleotide population is screened for a nucleic acid sensor molecule which comprises a target molecule activatable ligase activity. FIG. 1B shows the hammerhead nucleic acid sensor molecule selection methodology. Each of these methods are readily modified for the selection of NASMs with other catalytic activities.
In the embodiment shown in FIG. 1A , the ligation reaction involves covalent attachment of an oligonucleotide substrate to the 5′-end of the NASM through formation of a phosphodiester linkage. Other ligation chemistries can form the basis for selection of NASMs (e.g., oligonucleotide ligation to the 3′-end, alkylation's (Wilson & Szostak), peptide bond formation (Zhang & Czech), Diels-Alder reactions to couple alkenes and dienes (Seelig & Jaschke), etc.). For some chemistries, the chemical functional groups that constitute the reactants in the ligation reaction may not naturally appear within nucleic acids. Thus, it may be necessary to synthesize an RNA pool in which one of the ligation reactants is covalently attached to each member of the pool (e.g., attaching a primary amine to the 5′-end of an RNA to enable selection for peptide bond formation).
In this embodiment, the oligonucleotide population from which the NASMs will be selected is initially screened in a negative selection procedure to eliminate any molecules which have ligase activity even in the absence of target molecule binding. A solution of oligonucleotides (e.g., 100 pM) comprising a 5′ and 3′ fixed sequence (“5′-fixed: random: 3′fixed”) is denatured with a 3′ primer sequence (“3′ prime”) (e.g., 200 pM) which binds to at least a portion of the 3′ fixed sequence. In one embodiment, the 5′-fixed:random:3′-fixed sequence is
| (SEQ ID NO:1) |
| GGACUUCGGUCCAGUGCUCGUGCACUAGGCCGUUCGACC-N30–50 | |
| CUUAGACAGGAGGUUAGGUGCCUCGUGAUGUCCAGUCGC-3′, |
where N represents a random sequence having 30 to 50 nucleotides and the 3′ primer sequence used is
| 5′-GCGACTGGACATCACGAG-3′. | (SEQ ID NO:2) |
Ligation buffer (e.g., 30 mM Tris HCI, pH 7.4, 600 mM NaCl, 1 mM EDTA, 1% NP-40, 60 mM MgCl2) and a tagged oligonucleotide substrate sequence (“tag-substrate”) (e.g., Tag-UGCCACU) are added and the mixture is incubated for about 16 to about 24 hours at 25° C. in the absence of target molecule (STEP 1). Tags encompassed within the scope include, e.g., radioactive labels, fluorescent labels, a chemically reactive species such as thiophosphate, the first member of a binding pair comprising a first and second binding member, each member bindable to the other (e.g., biotin, an antigen recognized by an antibody, or a tag nucleic acid sequence). The reaction is stopped by the addition of EDTA. Alternatively, the reaction can be terminated by removal of the substrate or addition of denaturants (e.g. urea, formamide).
Ligated molecules are removed from pool of selectable molecules (STEP 2), generating a population of oligonucleotides substantially free of ligated molecules (as measured by absence of the tag sequence in the solution). In the embodiment shown in FIG. 1A , the tag is the first member of a binding pair (e.g., biotin) and the ligated molecules (“biotin-oligonucleotide substrate:5′-fixed:random:3′-fixed”) are physically removed from the solution by contacting the sample to a solid support to which the second member of the binding pair is bound (“S”) (e.g., streptavidin). The eluant collected comprises a population of oligonucleotides enriched for non-ligated molecules (5′-fixed:random:3′-fixed). This step can be repeated multiple times until the oligonucleotide population is substantially free of molecules having target-insensitive ligase activity.
This step allows for suppression of the ability of constitutively active molecules to be carried through to the next cycle of selection. Physical separation of ligated and unligated molecules is one mechanism by which this can be achieved. Alternatively, the negative selection step can be configured such that catalysis converts active molecules to a form that blocks their ability to be either retained during the subsequent positive selection step or to be amplified for the next cycle of selection. For example, the oligonucleotide substrate used for ligation in the negative selection step can be synthesized without a capture tag. Target-independent ligases covalently self-attach the untagged oligonucleotide substrate during the negative selection step and are then unable to accept a tagged form of the oligonucleotide substrate provided during the positive selection step that follows. In another embodiment, the oligonucleotide substrate provided during the negative selection step has a different sequence from that provided during the positive selection step. When PCR is carried out using a primer complementary to the positive selection oligonucleotide substrate, only target-activated ligases will be capable of amplification.
A positive selection phase follows. In this phase, more 3′ primer and tagged oligonucleotide substrate are added to the pool resulting from the negative selection step. Target molecules are then added to form a reacted solution and the reacted solution is incubated at 25 ° C. for about 2 hours (STEP 3). Target molecules encompassed within the scope include, e.g., proteins or portions thereof (e.g., receptors, antigen, antibodies, enzymes, growth factors), peptides, enzyme inhibitors, hormones, carbohydrates, polysaccharides, glycoproteins, lipids, phospholipids, metabolites, metal ions, cofactors, inhibitors, drugs, dyes, vitamins, nucleic acids, membrane structures, receptors, organelles, and viruses. Target molecules can be free in solution or can be part of a larger cellular structure (e.g., such as a receptor embedded in a cell membrane). In one embodiment, a target molecule is one which does not naturally bind to nucleic acids.
In one embodiment, nucleic acid sensor molecules are selected which are activated by target molecules comprising molecules having an identified biological activity (e.g., a known enzymatic activity, receptor activity, or a known structural role); however, in another embodiment, the biological activity of at least one of the target molecules is unknown (e.g., the target molecule is a polypeptide expressed from the open reading frame of an EST sequence, or is an uncharacterized polypeptide synthesized based on a predicted open reading frame, or is a purified or semi-purified protein whose function is unknown).
Although in one embodiment the target molecule does not naturally bind to nucleic acids, in another embodiment, the target molecule does bind in a sequence specific or non-specific manner to a nucleic acid sensor molecule. In a further embodiment, a plurality of target molecules binds to the nucleic acid sensor molecule. Selection for NASMs specifically responsive to a plurality of target molecules (i.e. not activated by single targets within the plurality) may be achieved by including at least two negative selection steps in which subsets of the target molecules are provided.
In still a further embodiment, nucleic acid sensor molecules are selected which bind specifically to a modified target molecule but which do not bind to non-modified target molecules. Targeted modifications include, e.g., post-translational modifications of a protein, such as phosphorylation, ribosylation , methylation (Arg, Asp, N, S, or 0-directed), prenylation (e.g., famesyl, geranylgeranyl, and the like), acetylation, acylation, allelic variations within a protein (e.g., single amino acid changes in a protein) and cleavage sites in a protein. In another embodiment, intermediates in a chemical synthesis pathway can be targeted, as well as starting and final products. In still a further embodiment, stereochemically distinct species of a molecules can be targeted.
The reacted solution is enriched for ligated molecules (biotin-oligonucleotide substrate: 5′- fixed :random:3′-fixed) by removing non-tagged molecules (5′-fixed:random:3′-fixed) from the solution. For example, in one embodiment, the tagged oligonucleotide substrate comprises a biotin tag and ligated molecules are isolated by passing the reacted solution over a solid support to which streptavidin (S) is bound (STEP 4). Eluant containing non-bound, non-ligated molecules (5′-fixed:random:3′-fixed) is discarded and bound, ligated molecules (biotin-oligonucleotide substrate: 5′-fixed:random:3′-fixed) are identified as nucleic acid sensor molecules and released from the support by disrupting the binding pair interaction which enabled capture of the catalytically active molecules. For example, heating to 95° C. in the presence of 10 mM biotin allows release of biotin-tagged catalysts from an immobilized streptavidin support. In another embodiment, the captured catalysts remain attached to a solid support and are directly amplified (described below) while immobilized. Multiple positive selection phases can be performed (STEPS 3 and 4). In one embodiment, the stringency of each positive selection phase is increased by decreasing the incubation time by one half.
Physically removing inactive species from the pool adds stringency to the selection process. However, to the extent that the ligation reaction increases the amplification potential of the NASMs, this step may be omitted. In the illustrated embodiment, for example, ligation of an oligonucleotide to the active species provides a primer binding site that enables subsequent PCR amplification using an oligonucleotide substrate complementary to the original oligonucleotide substrate. Unligated species do not necessarily need to be physically separated from other species because they are less likely to amplify in the absence of a covalently tethered primer binding site. Selected nucleic acid sensor molecules are amplified (or in the case of RNA molecules, first reverse transcribed, then amplified) using an oligonucleotide substrate primer (“S primer”) (e.g., 5 ′-AAAAAATGCACTGGACT-3′ (SEQ ID NO:3)) which specifically binds to the litgated oligonucleotide substrate sequence (STEP 5). In one embodiment, amplified molecules are further amplified with a nested PCR primer that regenerates a T7 promoter (“T7 Primer”) from the 5′ fixed and the litigated oligonucleotide substrate sequence (STEP 6). Following transcription with T7 RNA polymerase (STEP 7), the oligonucleotide pool may be further selected and amplified to eliminate any remaining unligated sequences (5′-fixed:random:3′-fixed) by repeating STEPS 3–7. It should be obvious to those of skill in the art that in addition to PCR, and RT-PCR, any number of amplification methods can be used (either enzymatic, chemical, or replication-based, e.g., such as by cloning), either singly, or in combination. Exemplary amplification methods are disclosed in Saiki, et al., 1985; Saiki, et al., 1988, Kwoh, et al., 1989; Joyce, 1989; and Guatelli, et al., 1990.
Because the 3′ primer (3′ prime) (see STEP 3 in FIG. 1A ) is included in the ligation mixture, selected nucleic acid sensor molecules may require this sequence for activation. In cases where this is undesirable, the 3′ primer may be omitted from the mix. Alternatively, the final nucleic acid sensor molecule can be modified by attaching the 3′ primer via a short sequence loop or a chemical linker to the 3′ end of the nucleic acid sensor molecule, thereby eliminating the requirement for added primer, allowing 3′ primer sequence to self-prime the molecule.
As shown in FIG. 1B , selection of a nucleic acid sensor molecule begins with the synthesis of a ribozyme sequence on a DNA synthesizer. Random nucleotides are incorporated generating pools of roughly 1016 molecules. Most molecules in this pool are non-functional, but a handful will respond to a given target and be useful as nucleic acid sensor molecules. Sorting among the billions of species to find the desired molecules starts from the complex sequence pool. Nucleic acid sensor molecule are isolated by an iterative process: in addition to the target-activated ribozymes that one desires, the starting pool is usually dominated by either constitutively active or completely inactive ribozymes. The selection process removes both types of contaminants. In the following amplification stage, thousands of copies of the surviving sequences are generated to enable the next round of selection. During amplification, random mutations can be introduced into the copied molecules—this ‘genetic noise’ allows functional NASMs to continuously evolve and become even better adapted as target-activated molecules. The entire experiment reduces the pool complexity from 1016 down to <100.
Pool preparation. The starting library of DNA sequences is generated by automated chemical synthesis on a DNA synthesizer. This library of sequences is transcribed in vitro into RNA using T7 RNA polymerase and subsequently purified.
Negative selection incubation. In the absence of the desired target molecule of interest, the RNA library is incubated together with the binding buffer alone. During this incubation, non-allosteric (or non-target activated) ribozymes are expected to undergo cleavage.
Size-based Purification. Undesired members of the hammerhead pool, those that are constitutively active in the absence of the target molecule, are removed from the unreacted members by PAGE-chromatography; 7M Urea, 8% acrylamide, 1×TBE. Higher molecular weight species are eluted as a single broad band from the gel matrix into TBE buffer, then purified for subsequent steps in the selection cycle.
Positive selection incubation. The remaining RNA pool is then incubated under identical conditions but now in the presence of the target molecule of interest in binding buffer.
Size-based Purification. In this step, desired members of the hammerhead pool, those that are only active in the presence of the target molecule, are removed from the remaining unreacted members by PAGE-chromatography; 7M Urea, 8% acrylamide, 1×TBE. In this step, lower molecular weight species are eluted as a single broad band from the gel matrix into TBE buffer, then purified for subsequent steps in the selection cycle.
Amplification. RT-PCR amplified DNA is purified and transcribed to yield an enriched pool for a subsequent round of reselection.
Iteratively repeat. Rounds of selection and amplification (steps 2–5) are repeated until functional members sufficiently dominate the resultant library.
In another embodiment, as shown in FIG. 4 , an oligonucleotide population is screened for a nucleic acid sensor molecule which comprises a target molecule having activatable self-cleaving activity. In this embodiment, the starting population of oligonucleotide molecules comprises 5′ and 3′ fixed regions (“5′-fixed and 3′ fixed A-3′fixed B”) and at least fixed regions, in this example, the 3′ fixed region, comprises a ribozyme catalytic core including a self cleavage site (the junction between 3′ fixed A-3 ′ fixed B). In one embodiment, the 5′-fixed: random:3′ fixed A-3′-fixed B molecule is GGGCGACCCUGAUGAGCCUGG-N20-50-UUAGACGAAACGGUGAAAGCCGUAGGUUGCCC (SEQ ID NO:4), where N20-50 is a random sequence of 20–50 nucleotides.
The population of oligonucleotide molecules comprising random oligonucleotides flanked by fixed 5′ and 3′ sequences (5′-fixed:random:3′-fixed A: 3′ fixed B) are negative selected to remove oligonucleotides which self-cleave (i. e., 5′-fixed:random:3′-fixed-A molecules) even in the absence of target molecules. The oligonucleotide pool is incubated in reaction buffer (e.g., 50 mM Tris HCl, pH 7.5, 20 mM MgCl2) for 5 hours at 25° C., punctuated at one hour intervals by incubation at 60° C. for one minutes (STEP 1). In one embodiment, the uncleaved fraction of the oligonucleotide population (containing 5′-fixed and 3′ fixed A-3′-flxed B molecules) is purified by denaturing 10% polyacrylamide gel electrophoresis (PAGE) (STEP 2). Target molecule dependent cleavage activity is then selected in the presence of target molecules in the presence of reaction buffer by incubation at 23° C. for about 30 seconds to about five minutes (STEP 3). Cleaved molecules (5′-fixed:random:3′fixed-A molecules) are identified as nucleic acid sensor molecules and are purified by PAGE (STEP 4).
Amplification of the cleaved molecule is performed using primers which specifically bind the 5′-fixed and the 3′-fixed A sequences, regenerating the T7 promoter and the 3′-fixed B site (STEP 5), and the molecule is further amplified further by RNA transcription using T7 polymerase (STEP 6). In one embodiment, the process (STEPS 1–6) is repeated until the nucleic acid sensor precursor population is reduced to about one to five unique sequences.
Alternative methods for separating cleaved from uncleaved RNAs can be used. Tags can be attached to the 3′-fixed B sequence and separation can be based upon separating tagged sequences from non-tagged sequences at STEP 4. Chromatographic procedures that separate molecules on the basis of size (e.g., gel filtration) can be used in place of electrophoresis. One end of each molecule in the RNA pool can be attached to a solid support and catalytically active molecules isolated upon release from the support as a result of cleavage. Alternate catalytic cores may be used. These alternate catalytic cores and methods using these cores are also are encompassed within the scope of the invention.
Nucleic acid sensor molecules which combine both cleavage and ligase activities in a single molecule can be isolated by using one or a combination of both of the selection strategies outlined independently above for ligases and endonucleases. For example, the hairpin ribozyme is known to catalyze cleavage followed by ligation of a second oligonucleotide substrate (Berzal-Herranz et al.). Target activated sensor precursors based on the hairpin activity can be isolated from a pool of randomized sequence RNAs prepared as described previously with a sequence of the form 5′-GGAGTTACCTAACAAGAAACAGNgaagtcaaccagNgaaacNCACGGAGACGTGNNaNattaNct ggt(N20-N50)GGACCTACTGAGCTGACAGTCCTGTTTGATGCATACCGAGTAAGTG-3′ (SEQ ID NO:36) where N indicates any nucleotide, lower case letters represent doped nucleotides, and uppercase letters represent fixed nucleotides. Hairpin-based NASMs can be isolated on the basis of target molecule dependent release of the fragment 5′-GUCCUGUUUGAUGCAUACCGAGUAAGUG-3′ (SEQ ID NO:74) in the same way that hammerhead-based NASMs are isolated (e.g.,. target molecule dependent increase in electrophoretic mobility or target molecule dependent release from a solid support). Alternatively, nucleic acid sensor molecules can be selected on the basis of their ability to substitute the 3′-sequence released upon cleavage for another sequence as described in an target molecule independent manner by Berzal-Heranz et al. In this scheme, the original 3′-end of the NASM is released in an initial cleavage event-and an exogenously provided oligonucleotide substrate with a free 5′-hydroxyl is ligated back on. The newly attached 3′-end provides a primer binding site that can form the basis for preferential amplification of catalytically active molecules. Constitutively active molecules that are not activated by a provided target molecule can be removed from the pool by (1) separating away molecules that exhibit increased electrophoretic mobility in the absence of an exogenous oligonucleotide substrate or in the absence of target molecule, or (2) capturing molecules that acquire an exogenous oligonucleotide substrate (e.g., using a 3′-biotinylated substrate and captured re-ligated species on an avidin column.
Like the hairpin ribozyme, the group I intron self-splicing ribozymes combine cleavage and ligation activities to promote ligation of the exons that flank it. In the first step of group I intron-catalyzed splicing, an exogenous guanosine cofactor attacks the 5′-splice site. As a result of an intron-mediated phosphodiester exchange reaction, the 5′-exon is released coincident with attachment of the guanosine cofactor to the ribozyme. In a second chemical step, the 3′-hydroxyl at the end of the 5′-exon attacks the phosphodiester linkage between the intron and the 3′-exon, leading to ligation of the two exons and release of the intron. Group I intron-derived NASMs can be isolated from degenerate sequence pools by selecting molecules on the basis of either one or both chemical steps, operating in either a forward or reverse direction. NASMs can be isolated by specifically enriching those molecules that fail to promote catalysis in the absence of target molecule but which are catalytically active in its presence. Specific examples of selection schemes follow. In each case, a pool of RNAs related in sequence to a representative group I intron (e.g., the Tetrahymena thermophila pre-rRNA intron or the phage T4 td intron) serves as the starting point for selection. Random sequence regions can be embedded within the intron at sites known to be important for proper folding and activity (eg., substituting the P5abc domain of the Tetrahymena intron, Williams et al.). Intron nucleic acid sensor molecules, in this case, sensitive to thio-GMP can be generated as follows.
First step, forward direction
The intron is synthesized with a short 5′-exon. In the negative selection step, a guanosine cofactor is provided and constitutively active molecules undergo splicing. In the positive selection step, the target molecule is provided together with thio-GMP. Molecules responsive to the target undergo activated splicing and as a result acquire a unique thiophosphate at their 5′-termini. Thio-tagged NASMs can be separated from untagged ribozymes by their specific retention on mercury gels or activated thiol agarose columns.
First step, reverse direction
The method is performed as described in Green & Szostak. An intron is synthesized with a 5′-guanosine and no 5′-exon. An oligonucleotide substrate complementary to the 5′-intemal guide sequence is provided during the negative selection step and constitutively active molecules ligate the substrate to their 5′-ends, releasing the original terminal guanosine. A second oligonucleotide substrate with a different 5′-sequence is provided together with target in the positive selection step. NASMs specifically activated by the target molecule ligate the second oligonucleotide substrate to their 5′-ends. PCR amplification using a primer corresponding to the second substrate can be carried out to preferentially amplify target molecule sensitive nucleic acid sensor molecules.
Second step, reverse direction
The method is performed as described in Robertson & Joyce. The intron is synthesized with no flanking exons. During the negative selection step, pool RNAs are incubated together with a short oligonucleotide substrate under conditions which allow catalysis to proceed. During the positive selection step, a second oligonucleotide substrate with a different 3′-sequence is provided together with the sensor target. NASMs are activated and catalyze ligation-of the 3′-end of the second substrate. Reverse transcription carried out using a primer complementary to the 3′-end of the second substrate specifically selects NASMs for subsequent amplification.
Once nucleic acid sensor molecules are identified, they can be isolated, cloned, sequenced, and/or resynthesized using natural or modified nucleotides. Accordingly, synthesis intermediates of nucleic acid sensor molecules are also encompassed within the scope, as are replicatable sequences (e.g., plasmids) comprising nucleic acid sensor precursor molecules and nucleic acid sensor molecules.
B. Converting a Catalytic Nucleic Acid Sensor Molecule to an Optical Nucleic Acid Sensor Molecule
The nucleic acid sensor molecules identified above through in vitro selection comprise a catalytic domain (i.e., a signal generating moiety), coupled to a target modulation domain, (i.e., a domain which recognizes a target molecule and which transduces that molecular recognition event into the generation of a detectable signal). In general, the target modulation domain is defined by the minimum number of nucleotides sufficient to create a three-dimensional structure which recognizes a target molecule. In addition, the nucleic acid sensor molecules of the present invention use the energy of molecular recognition to modulate the catalytic or conformational properties of the nucleic acid sensor molecule. The selection process as described in detail in the present invention identifies novel nucleic acid sensor molecules through target modulation of the catalytic core of a ribozyme. Hence, the in vitro selection procedures described herein are distinct from those previously described for affinity-based aptamer selections (e.g., SELEX) in that we show that selective pressure on the starting population of NASMs (starting pool size is as high as 1014 to 1017 molecules) results in nucleic acid sensor molecules with enhanced catalytic properties, but not in enhanced binding properties, FIG. 59 . Specifically, the NASM selection procedures place selective pressure on catalytic effectiveness of potential NASMS by modulating both target concentration and reaction time-dependence. Either parameter, when optimized throughout the selection, can lead to nucleic acid molecular sensor molecules which have custom-designed catalytic properties, e.g., NASMs that have high switch factors (FIG. 47 and FIG. 59 ), and or NASMs that have high specificity (FIG. 57 ). The kinetic properties of the NASMs of the present invention are consistent with that obtained from a nucleoprotein-selection reported previously by Robertson and Ellington (2001) in which the resulting ribozyme (switch factor equal to 1,700 fold) has the same affinity for RNA (1 μM) as did the starting pool.
In the examples described above, the catalytic site is a known sequence (a ligase site or a hammerhead catalytic core) and is at least a portion of either the 5′ and/or 3′ fixed region (the other portion being supplied by the random sequence), or is a complete catalytic site. However, in other embodiments, the catalytic site may be selected along with the target molecule binding activity of oligonucleotides within the oligonucleotide pool.
In one embodiment, in order to convert a catalytic nucleic acid sensor molecule into an optical nucleic acid sensor molecule, at least a portion of the catalytic domain is modified (e.g., deleted). In one embodiment, the deletion enhances the conformational stability of the optical nucleic acid sensor molecule in either the bound or unbound forms. In one embodiment, shown in FIGS. 6A and B, deletion of the entire catalytic domain of the catalytic NASM shown in FIG. 5 is shown to stabilize the unbound form of the nucleic acid sensor molecule. In another embodiment, the deletion may be chosen so as to take advantage of the inherent fluorescence-quenching properties of unpaired guanosine (G) residues (Walter, N. G. and Burke, J. M., “Real-time monitoring of hairpin ribozyme kinetics through base-specific quenching of fluorescein-labeled substrates”, RNA 3:392 (1997).)
In another embodiment, the target modulation domain from a previously identified nucleic acid sensor molecule is incorporated into an oligonucleotide sequence that changes conformation (e.g., from a duplexed hairpin to a G-quadruplex) upon target binding. Optical Nucleic acid sensor molecules of this type can be derived from allosteric ribozymes, such as those derived from the hammerhead, hairpin, L1 ligase, or group 1 intron ribozymes and the like, all of which transduce molecular recognition into a detectable signal. For example, 3′,5′-cyclic nucleotide monophosphate (cNMP)-dependent hammerhead ribozymes were reengineered into (RNA) optical nucleic acid sensor molecules which specifically bound to cNMP (Garretta et al., 2001). The catalytic cores for hammerhead ribozymes were removed and replaced with 5-base duplex forming sequences. The binding of these reengineered RNA optical NASMs to c-NMP was then confirmed experimentally. By adjusting the duplex length, they can be redesigned to undergo significant conformational changes. The conformational changes can be coupled to detection via FRET or simply changes in fluorescence intensity (as in the case of a molecular beacon). For example, by adding an appropriate probe on the each end of the duplex, the stabilization of duplex by target binding can be monitored with the change in fluorescence.
While the above experimental example is performed in solution and utilizes a cuvette-based fluorescence spectrometer, in alternative embodiments the methods are performed in microwell multiplate readers (e.g., the Packard Fusion, or the Tecan Ultra) for high-throughput solution phase measurements.
In another embodiment, a nucleic acid sensor molecule is bound to a surface by a linker attached to one end of the molecule. For example, a nucleic acid sensor molecule is modified to include a 12 carbon linker terminated with an amine group. This free amine group allows the NASM to be attached to an aldehyde-derivatized glass surface via standard protocols for Schiff base formation and reduction. The nucleic acid sensor molecules can be bound in discrete regions or spots to form an array or uniformly distributed to cover an extended area. In the absence of target molecule, the optical nucleic acid sensor molecule forms a stem-loop conformation with duplex formation along the stem due to the complementarity of the nucleotides at the 3′ and 5′ ends of the molecule. In the presence of the target molecule, the optical nucleic acid sensor molecule undergoes a conformational rearrangement. In some embodiments, this conformational rearrangement results in a change in the distance between the fluorophore attached to the 5′ end and the quencher attached to the 3′ end. With the quencher separated from the fluorophore, the detected fluorescence emission intensity from the fluorophore increases sharply. The detected increase in fluorescence intensity with target molecule concentration can be used to detect and quantify the amount of target present in a sample solution introduced onto the surface. A sample solution can be laterally confined about the sensor surface by a coverslip, microwell, incubation chamber seal, or flowcell.
In one embodiment, after deletion of at least a portion of the catalytic site from a catalytic nucleic acid sensor molecule, an optical signaling unit is either added to, or inserted within, the nucleic sensor molecule, generating a sensor molecule whose optical properties change in response to binding of the target molecule to the target modulation domain. In one embodiment, the optical signaling unit is added by exposing at least a 5′ or 3′ nucleotide that was not previously exposed. The 5′ nucleotide or a 5′ subterminal nucleotide (e.g., an internal nucleotide) of the molecule is couplable to a first signaling moiety while the 3′ nucleotide or 3′ subterminal nucleotide is couplable to a second signaling moiety. Target molecule binding to the optical nucleic acid sensor molecule alters the proximity of the 5′ and 3′ nucleotide (or subterminal nucleotides) with respect to each other, and when the first and second signaling moieties are coupled to their respective nucleotides, this change in proximity results in a target sensitive change in the optical properties of the nucleic acid sensor molecule. Detection of changes in the optical properties of the nucleic acid sensor molecule can therefore be correlated with the presence and/or quantity of a target molecule in a sample.
In another embodiment optical NASMs are generated by adding first and second signaling moieties, that are coupled to the 5′ terminal or subterminal sequences, and 3 ′-terminal and subterminal sequences respectively, of the catalytic NASM. Signaling molecules can be coupled to nucleotides which are already part of the nucleic acid sensor molecule or may be coupled to nucleotides which are inserted into the nucleic acid sensor molecule, or can be added to a nucleic acid sensor molecule as it is synthesized. Coupling chemistries to attach signaling molecules are well known in the art (see, for example, The Molecular Probes Handbook, R. Haughland). Suitable chemistries include, e.g., derivatization of the 5-position of pyrimidine bases (e.g., using 5′-amino allyl precursors), derivatization of the 5′-end (e.g., phosphoroamidites that add a primary amine to the 5′-end of chemically-synthesized oligonucleotide) or the 3′-end (e.g., periodate treatment of RNA to convert the 3′-ribose into a dialdehyde which can subsequently react with hydrazide-bearing signaling molecules).
In another embodiment, a single signaling moiety is either added to, or inserted within, the catalytic nucleic sensor molecule. In this embodiment, binding of the target molecule results in changes in both the conformation and physical aspect (e.g., molecular volume, and thus rotational diffusion rate, etc.) of the optical nucleic acid sensor molecule. Conformational changes in the optical nucleic acid sensor molecule upon target binding will modify the chemical environment of the signaling moiety, while changes in the physical aspect of the nucleic acid, sensor molecule will alter the kinetic properties of the signaling moiety. In both cases, the result will be a detectable change in the optical properties of the nucleic acid sensor molecule.
In one embodiment, the optical nucleic acid sensor molecule is prepared without a quencher group. Instead of a quencher group a moiety with a free amine group can be added. This free amine group allows the sensor molecule to be attached to an aldehyde-derivatized glass surface via standard protocols for Schiff base formation and reduction. The nucleic acid sensor molecules can be bound in discrete regions or spots to form an array, or uniformly distributed to cover an extended area. In the absence of target, the optical nucleic acid sensor molecule will diffusionally rotate about its point of attachment to the surface at a rate characteristic of its molecular volume and mass. After target binding, the optical NASM-target complex will have a correspondingly larger volume and mass. This change in molecular volume (mass) will slow the rate of rotational diffusion, and result in a measurable change in the polarization state of the fluorescence emission from the fluorophore.
In one embodiment of the invention, a single signaling moiety is attached to a portion of a catalytic NASM that is released as a result of catalysis (e.g., either end of a self-cleaving ribozyme or the pyrophosphate at the 5′-end of a ligase). Target molecule-activated catalysis leads to release of the signaling moiety from the optical NASM to generate a signal correlated with the presence of the target. Release can be detected by either (1) changes in the intrinsic optical properties of the signaling moiety (e.g., decreased fluorescence polarization as the released moiety is able to tumble more freely in solution), or (2) changes in the partitioning of the signaling moiety (e.g., release of a fluorophore from a chip containing immobilized ribozymes such that the total fluorescence of the chip is reduced following washing).
In another embodiment of the invention, the catalytic nucleic acid sensor molecule is unmodified and the optical signaling unit is provided as a substrate for the NASM. One example of this embodiment includes a fluorescently tagged oligonucleotide substrate which can be joined to a NASM with ligase activity. In a heterogeneous assay using the ligase as a sensor molecule, analyte-containing samples are incubated with the fluorescent oligonucleotide substrate and the ligase under conditions that allow the ligase to function. Following an incubation period, the ligase is separated from free oligonucleotide substrate (e.g., by capturing ligases onto a solid support on the basis of hybridization to ligase-specific sequences or by pre-immobilizing the ligases on a solid support and washing extensively).
Quantitation of the captured fluorescence signal provides a means for inferring the concentration of analyte in the sample. In a second example of this embodiment, catalytic activity alters the fluorescence properties of a oligonucleotide substrate without leading to its own modification. Fluorophore pairs or fluorophore/quencher pairs can be attached to nucleotides flanking either side of the cleavage site of an oligonucleotide substrate for a trans-acting endonuclease ribozyme (Jenne et al.). Target activated cleavage of the substrate leads to separation of the pair and a change in its optical properties.
In another embodiment of the invention, the ligase catalytic NASM and its oligonucleotide substrates are unmodified and detection relies on catalytically-coupled changes in the ability of the NASM to be enzymatically amplified. In one example, a target-activated ligase is incubated together with oligonucleotide substrate and an analyte-containing sample under conditions which allow the ligase to function. Following an incubation period, the reaction is quenched and the mixture subjected to RT/PCR amplification using a primer pair that includes the oligo sequence corresponding to the ligation substrate. Amplification products can be detected by a variety of generally practiced methods (e.g. Taqman®). Only those ribozymes that have self-ligated an oligonucleotide substrate are capable of amplification under these conditions and will generate a signal that can be coupled to the concentration of the sensor target.
i. Proximity Dependent Signaling Moieties
Many proximity dependent signaling moieties are known in the art and are encompassed within the scope of the present invention (see, e.g., Morrison, 1992, in Nonisotopic DNA Probe Techniques, Kricka, ed., Academic Press, Inc., San Diego, Calif., chapter 13; and Heller and Morrison, 1985, in Rapid Detection and Identification of Infectious Agents, Academic Press, Inc., San Diego, Calif., pages 245–256). Systems using these signaling moieties rely on the change in fluorescence that occurs when the moieties are brought into close proximity. Such systems are described in the literature as fluorescence energy transfer (FET), fluorescence resonance energy transfer (FRET), nonradiative energy transfer, long-range energy transfer, dipole-coupled energy transfer, or Forster energy transfer (see, e.g., U.S. Pat. No. 5,491,063, Wu, and Brand, 1994).
Other proximity-dependent signaling systems that do not rely on direct energy transfer between signaling moieties are also known in the art and can be used in the methods described herein. These include, e.g., systems in which a signaling moiety is stimulated to fluoresce or luminesce upon activation by the target molecule. This activation may be direct (e.g., as in the case of scintillation proximity assays (SPA), via a photon or radionuclide decay product emitted by the bound target), or indirect (e.g., as in the case of AlphaScreen™ assays, via reaction with singlet oxygen released from a photosensitized donor bead upon illumination). In both scenarios, the activation of detected signaling moiety is dependent on close proximity of the signaling moiety and the activating species. In general, for both fluorescence, fluorescence polarization, and scintillation-proximity-type assays, the nucleic acid sensor molecule may be utilized in either solution-phase or solid-phase formats. That is, in functional form, the nucleic acid sensor molecule may be tethered (directly, or via a linker) to a solid support or free in solution.
In one embodiment, a scintillation proximity assay (SPA) is used. In this embodiment, the nucleic acid sensor molecules, ligate on oligonucleotide substrate in the presence of a target molecule (see FIGS. 2A and B), are bound to a scintillant-impregnated microwell plate (e.g., FlashPlates, NEN Life Sciences Products, Boston, Mass.) coated with, for example, streptavidin via a (biotin) linker attached to the 5′ end of the effector oligonucleotide sequence (for example, GCGACTGGACATCACGAG (SEQ ID NO:51) in FIG. 2A ). The various plate-sensor coupling chemistries are determined by the type and manufacturer of the plates, and are well-known in the art. Upon the addition of a solution containing target molecule and excess radiolabeled (e.g., with 32P or 35S) oligonucleotide substrate in ligation buffer, the NASMs hybridize and ligate the substrate oligonucleotide. Some fraction of the radiolabeled oligonucleotide substrate will be ligated to surface-immobilized NASMs on the plate, while unligated oligonucleotide substrate will be free in solution. Only those oligonucleotide substrates ligated to surface-immobilized NASMs on the plate will be in close enough proximity to the scintillant molecules embedded in the plate to excite them, thereby stimulating luminescence which can be easily detected using a luminometer (e.g., the TopCount luminescence plate reader, Packard Biosciences, Meriden, Conn.). This type of homogeneous assay format provides straightforward, real-time detection, quantification, and kinetic properties of target molecule binding.
In another embodiment, a similar SPA assay format is performed using scintillant-impregnated beads (e.g., Amersham Pharmacia Biotech, Inc., Piscataway, N.J.). In this embodiment, the NASMs which ligate on oligonucleotide substrate in the presence of a target molecule (see FIGS. 2A and B) are coupled to scintillant-impregnated beads which are suspended in solution in, for example, a microwell plate. The various bead-sensor coupling chemistries are determined by the type and manufacturer of the beads, and are well-known in the art. Upon the addition of a solution containing target molecule and excess radiolabeled (e.g., with 32P or 35S) oligonucleotide substrate in ligation buffer, the NASMs hybridize and ligate the oligonucleotide substrate. Some fraction of the radiolabeled substrate will be ligated to surface-immobilized NASMs on the beads, while unligated substrate will be free in solution. Only those substrates ligated to surface-immobilized NASMs on the beads will be in close enough proximity to the scintillant molecules embedded in the beads to excite them, thereby stimulating luminescence which can be easily detected using a luminometer (e.g., the TopCount luminescence plate reader, Packard Biosciences, Meriden, Conn.). In addition to enabling real-time target detection and quantification, this type of homogeneous assay format can be used to investigate cellular processes in situ in real time. This could be done by culturing cells directly onto a microwell plate and allowing uptake of scintillant beads and radioisotope by cells. Biosynthesis, proliferation, drug uptake, cell motility, etc. can then be monitored via the luminescence signal generated by beads in presence of selected target molecules (see Cook et al.,1992, or Heath et al., 1992).
Suitable fluorescent labels are known in the art and commercially available from, for example, Molecular Probes (Eugene, Oreg.). These include, e.g., donor/acceptor (i.e., first and second signaling moieties) molecules such as: fluorescein isothiocyanate (FITC) /tetramethylrhodamine isothiocyanate (TRITC), FITC/Texas Red TM Molecular Probes), FITC/N-hydroxysuccinimidyl 1 -pyrenebutyrate (PYB), FITC/eosin isothiocyanate (EITC), N-hydroxysuccinimidyl 1 -pyrenesulfonate (PYS)/FITC, FITC/Rhodamine X (ROX), FITC/tetramethylrhodamine (TAMRA), and others. In addition to the organic fluorophores already mentioned, various types of nonorganic fluorescent labels are known in the art and are commercially available from, for example, Quantum Dot Corporation, Inc. Hayward Calif.). These include, e.g., donor/acceptor (i.e., first and second signaling moieties) semiconductor nanocrystals (i.e., ‘quantum dots’) whose absorption and emission spectra can be precisely controlled through the selection of nanoparticle material, size, and composition (see, for example, Bruchez et al., 1998, Chan and Nie, 1998, Han et al., 2001).
The selection of a particular donor/acceptor pair is not critical to practicing the invention provided that energy can be transferred between the donor and the acceptor. P-(dimethyl aminophenylazo) benzoic acid (DABCYL) is one example of a non-fluorescent acceptor dye which effectively quenches fluorescence from an adjacent fluorophore, e.g., fluorescein or 5-(2′-aminoethyl) aminonaphthalene (EDANS).
In the embodiment shown in FIGS. 3A and B, a catalytic nucleic acid sensor molecule from which a portion of a ligase site (e.g., the AGUCG sequence at the 3′ end of the nucleic acid sensor precursor molecule, as shown in FIG. 2 ) has been removed is coupled to a first signaling moiety (F) at a first nucleotide (1) and to a second signaling moiety (D) at a second nucleotide (2). In a further embodiment, the first and second signaling moieties molecules are attached to non-terminal sequences. The position of the non-terminal sequences coupled to signaling moieties is limited to a maximal distance from the 5′ or 3′ nucleotide which still permits proximity dependent changes in the optical properties of the molecule. Coupling chemistries are routinely practiced in the art, and oligonucleotide synthesis services provided commercially (e.g., Integrated DNA Technologies, Coralville, Iowa) can also be used to generate labeled molecules. In a further embodiment, the nucleic acid sensor molecule is used, either tethered to a solid support or free in solution, to detect the presence and concentration of target molecules in a complex biological fluid.
In the embodiment shown in FIGS. 3A and B, the first signaling moiety (F) is a fluorescein molecule coupled to the 5′ end and the second signaling molecule (D) is a DABCYL molecule (a quenching group) coupled to the 3′ end. Because of the nearly complete base pairing of the non-target molecule activated form (see FIG. 3B ), this is the favored form of the nucleic acid sensor molecule in the absence of the target molecule. When the nucleic acid sensor molecule is not activated by target molecule, the fluorescent group and the quenching group are in close proximity and little fluorescence is detectable from the fluorescent group. Addition of target molecule causes a change in the conformation of the optical nucleic acid sensor molecule shown in FIG. 3B to that shown in FIG. 3A . When the molecule assumes the conformation shown in FIG. 3A , the first and second signaling moieties (F and D, respectively) are no longer in sufficient proximity for the quenching group to quench the fluorescence of the fluorescent group, resulting in a detectable fluorescent signal being produced upon recognition of the target molecule.
In one embodiment, the target modulation domain sequence from a previously identified nucleic acid sensor molecule is incorporated into a separate oligonucleotide sequence which changes conformation upon target recognition as shown in FIGS. 6A and B. During or after synthesis, an optical signal generating unit is either added or inserted into the oligonucleotide sequence comprising. the derived nucleic acid sensor molecule. As noted previously, nucleic acid sensor molecules of this type can be derived from allosteric ribozymes, such as those derived from the hammerhead, hairpin, L1 ligase, or group 1 intron ribozymes and the like (see Soukup et al., 2001, or Hamaguchi et al., 2001), all of which transduce molecular recognition into a detectable optical signal.
In the embodiment shown in FIGS. 9A , B, and C, a self-cleaving ribozyme such as the hammerhead (in this case attached to a solid support via a linker molecule is shown) is labeled with a fluorphore. In FIG. 9A , the labeled NASM in the unactivated state comprises two oligonucleotide including a transacting cleavage substrate which bears a second fluorescent label. In the unactivated state, i.e., in the absence of target molecule, the donor fluorophore (on one oligonucleotide NASM) and the acceptor fluorophore (on the cleavage substrate) are in sufficiently close proximity for FRET to occur; thus, minimal fluorescent emission is detected from the donor fluorophore at wavelength 3, λ3, upon epi-illumination excitation at wavelength 1, λ1. Upon target molecule recognition, the cleavage fragment of the cleavage substrate bearing the acceptor fluorophore dissociates from the ribozyme-target complex. Once separated from the acceptor fluorophore, the donor fluorophore can no longer undergo de-excitation via FRET, resulting in a detectable increase in its fluorescent emission at wavelength 2, λ2 (see, for example, Singh. et al., 1999; Wu, and Brand, 1994; Walter and Burke, 1997; Walter et al., 1998). In a further embodiment, the change in the polarization state of the fluorescent emission from the donor fluorophore (due to the increased diffusional rotation rate of the smaller cleavage fragment) can be detected/monitored in addition to changes in fluorescent emission intensity (see, for Singh, 2000). In a further embodiment, the NASMs are free in solution.
In another embodiment, shown in FIG. 9B , the acceptor fluorophore attached to the cleavage substrate is replaced by a quencher group. This replacement will also result in minimal fluorescent donor emission at wavelength 2, λ2, when the NASM is in the unbound state under epi-illumination excitation at wavelength 1, λ1. Upon target molecule recognition, the cleavage fragments of the cleavage substrate bearing the donor and quencher groups dissociate from the NASM-target molecule complex. Once separated from the quencher, the donor fluorophore will exhibit a detectable increase in its fluorescent emission at wavelength 2, λ2. In a further embodiment, the change in the polarization state of the fluorescent emission from the donor fluorophore (due to the increased diffusional rotation rate of the smaller cleavage fragment) can be detected/monitored in addition to changes in fluorescent emission intensity. In a further embodiment, NASMs are free in solution.
In a different embodiment, the optical configuration is designed to provide excitation via total internal reflection (TIR)-illumination, as shown in FIG. 9C . Also, the donor fluorophore is attached to the NASM body while the quencher is attached to the cleavage substrate. In this configuration, with the surface-immobilized NASM in the unbound state, the fluorescent donor emission at wavelength 2, λ2, will be minimal. Upon target module recognition, the cleavage fragment of the cleavage substrate bearing the quencher group dissociates from the NASM-target module complex. Once separated from the quencher, the donor fluorophore will exhibit a detectable increase in its fluorescent emission at wavelength 2, λ2. In an alternative embodiment to that shown in shown in FIG. 9C , the quencher group can be replaced with an acceptor fluorophore. In yet another alternative embodiment to those shown in FIGS. 9A , B, and C, the donor fluorophore is coupled to the cleavage fragment of the cleavage substrate and the acceptor fluorophore or quencher group is deleted. Upon target molecule recognition and dissociation of the cleavage fragment, the polarization state of the fluorescent emission from the donor fluorophore will undergo a detectable change due to the difference in the diffusional rotation rates of the surface-bound ribozyme-target complex and the free cleavage fragment.
In one embodiment, a universal FRET trans-substrate is synthesized for all NASMs derived from self-cleaving allosteric ribozymes. This substrate would have complementary optical signaling units (i.e., donor and acceptor groups) coupled to opposite ends of the synthetic oligonucleotide sequence. Such a universal substrate would obviate the need for coupling optical signaling units to the sensor (i.e., ribozyme) molecule itself.
The relative stabilities of the activated and unactivated forms of the nucleic acid sensor molecules is optimized to achieve the highest sensitivity of detection of target molecule. In one embodiment, the nucleic acid sensor molecule is further engineered to enhance the stability of one form over another. In one embodiment, the boxed UA in FIGS. 3A and B is changed to a CC, favoring the formation of the target molecule activated form. Because these bases do not form base pairs when the nucleic acid sensor molecule is unactiaved, the unactivated form is not stabilized.
In addition to the herein described methods, any additional proximity dependent signaling system known in the art can be used to practice the method according to the invention, and are encompassed within the scope.
A number of methods can be used to evaluate the relative stability of different conformations of the nucleic acid sensor molecule. In one embodiment, the free energy of the structures formed by the nucleic acid sensor molecule is determined using software programs such as mfold®, which can be found on, the Rensselaer Polytechnic Institute (RPI) web site (www.rpi.edu/dept.).
In another embodiment, a gel assay is performed which permits detection of different conformations of the nucleic acid sensor molecule. In this embodiment, the nucleic acid sensor molecule is allowed to come to equilibrium at room temperature or the temperature at which the nucleic acid sensor molecule will be used. The molecule is then cooled to 4° C. and electrophoresed on a native (non-denaturing) gel at 4° C. Each of the conformations formed by the nucleic acid sensor molecule will run at a different position on the gel, allowing visualization of the relative concentration of each conformation. Similarly, the conformation of nucleic acid sensor molecules which form in the presence of target molecule is then determined by a method such as circular dichroism (CD). By comparing the conformation of the nucleic acid sensor molecule formed in the presence of target molecule with the conformations formed in the absence of target molecule, the conformation which corresponds to the activated conformation can be identified in a sample in which there is no target molecule. The nucleic acid sensor molecule can then be engineered to minimize the formation of the activated conformation in the absence of target molecule. The sensitivity and specificity of nucleic acid sensor molecule can be further tested using target molecule modulation assays with known amounts of target molecules.
In another embodiment, shown in FIGS. 6A and B, a catalytical nucleic acid sensor molecule from which a portion of a self-cleaving site has been removed, is coupled to a first signaling moiety (F) at a first nucleotide and to a second signaling moiety,(D) at a second nucleotide. In this embodiment, the entire catalytic site of the catalytic nucleic acid molecule (see FIG. 5 ) has been removed. In one embodiment (FIGS. 6A and B), additional bases (e.g., UGGUAU) are added to one end of the portion of the nucleic acid sensor molecule comprising the modulation domain, to stabilize the unbound form of the nucleic acid sensor molecule (FIG. 6B ). These bases are selected to be complementary to bases at the opposite end of the nucleic acid sensor molecule (ACCAUA). Additional bases may be added to either the 5′ or the 3′ end of the nucleic acid sensor molecule.
Modifications to stabilize one conformation of the nucleic sensor molecule over another may be identified using the mfold program or native gel assays discussed above. A labeled nucleic acid sensor molecule is generated by coupling a first signaling moiety (F) to a first nucleotide and a second signaling moiety (D) to a second nucleotide as discussed above. As above, the sensitivity and specificity of the nucleic acid sensor molecule can be further assayed by using target molecule modulation assays with known amounts of target molecules.
ii. Optical Signal Generating Units With Single Signaling Moieties
In one embodiment, the optical nucleic acid sensor molecule comprises an optical signaling unit with a single signaling moiety introduced at either an internal or terminal position within the nucleic acid sensor molecule. In this embodiment, binding of the target molecule results in changes in both the conformation and physical aspect (e.g., molecular volume or mass, rotational diffuision rate, etc.) of the nucleic acid sensor molecule. Conformational changes in the nucleic acid sensor molecule upon target recognition will modify the chemical environment of the signaling moiety. Such a change in chemical environment will in general change the optical properties of the signaling moiety. Suitable signaling moieties are described in Jhaveri, et al, 2000, and include, e.g., fluorescein, acridine, and other organic and nonorganic fluorophores.
In one embodiment, a signaling moiety is introduced at a position in the catalytic nucleic acid molecule near the target activation site (identifiable by footprinting studies, for example). Binding of the target molecule will (via a change in conformation of the nucleic acid molecule) alter the chemical environment and thus affect the optical properties of the signaling moiety in a detectable manner.
Recognition of the target molecule by the NASM will result in changes in the conformation and physical aspect of the nucleic acid sensor molecule, and will thus alter the kinetic properties of the signaling moiety. In particular, the changes in conformation and mass of the sensor-target complex will reduce the rotational diffusion rate for the sensor-target complex, resulting in a detectable change in the observed steady state fluorescence polarization (FP) from the signaling moiety. The expected change in FP signal with target concentration can be derived using a modified form of the well-known Michaelis-Menten model for ligand binding kinetics (Lakowicz, 1999). FP is therefore a highly sensitive means of detecting and quantitatively determining the concentration of target molecules in a sample solution (Jameson and Sawyer, 1995; Jameson and Seifried, 1999; Jolley, 1999; Singh, 2000; Owicki et al., 1997). FP methods are capable of functioning in both solution- and solid-phase implementations.
Numerous additional methods can be used that, e.g., make use of a single fluorescent label and an unpaired guanosine residue (instead of a quencher group), to enable the use of FRET in target detection and quantitation as described in the embodiments above (see Walter and Burke, 1997).
In a further embodiment, shown in FIGS. 10A , B, and C an unlabeled ligating ribozyme such as the lysozyme-dependent L1 ligase is shown (see, for example, Robertson, M. P. and Ellington, A. D, 2000). In the unactivated state, i.e., in the absence of target, no fluorescent emission is detected from the surface-bound ribozymes under total internal reflection (TIR)-illumination (see FIG. 10A ), or epi-illumination (see FIG. 10B ). Upon recognition of target molecules in the presence of an oligonucleotide substrate with a tag (where the tag is capable of binding to a subsequently added fluorescent label via interactions including, but not limited to, biotin/streptavidin, amine/aldehyde, hydrazide, thiol, or other reactive groups) those oligonucleotide substrates hybridized to NASMs will undergo ligation and become covalently bonded to the thereto. In order to maximize the probability of hybridization for a given NASM, oligonucleotide substrate can be added in excess relative to NASM, the temperature of the ambient solution in which the reaction takes place can be kept below room temperature (e.g., 4° C.), and agitation of the reaction vessel can be employed to overcome the kinetic limitation of diffusion-limited transport of species in solution. Given the above conditions, as well as sufficient time for maximal hybridization and subsequent ligation to occur, fluorescent label with the appropriate reactive group to bind the substrate tag is added to the reaction mixture. Again, the degree of substrate-label binding can be maximized through control of label concentration, solution temperature, and agitation. Once the fluorescent label has bound to all available ligated substrate-ribozyme-target complex, the solution temperature can be raised to drive off all of the hybridized but unligated substrate. With TIR-illumination, the spatial extent of the excitation region above the solid substrate surface to which the ribozymes are bound is only on the order of 100 nm. Therefore, the bulk solution above the substrate surface is not illuminated and the detected fluorescent emission will be primarily due to fluorophores which are bound to ligated oligonucleotide substrate-NASM- target molecule complexes tethered to the substrate surface. The fluorescence emission from surface-bound NASM-target molecule complexes in this homogeneous solid phase assay format represents an easily detectable optical signal. In another embodiment, the fluorescence polarization (FP) of the labeled substrate can be monitored, as shown in FIG. 10C . Upon ligation, the steady state fluorescence polarization signal from the substrate-NASM complex will increase detectably relative to the FP signal from the free labeled oligonucleotide substrate in solution, due to the difference in the diffusional rotation rates between the free and ligated forms.
In another embodiment, an unlabeled ligating ribozyme such as the lysozyme-dependent Li ligase (see, for example, Robertson, M. P. and Ellington, A. D, 2000) is bound to a solid surface. In this embodiment, the oligonucleotide substrate is coupled to an enzyme-linked luminescent moiety, such as horse radish peroxidase (HRP) by a tag (where the tag is capable of binding to a subsequently added label via interactions including, but not limited to, biotin/streptavidin, amine/aldehyde, hydrazide, thiol, or other reactive groups). In the absence of target molecule, no luminescent emission is detected from the surface-bound ribozymes. Upon recognition of target molecules in the presence of labeled oligonucleotide substrate, those oligonucleotide substrates hybridized to NASMs will undergo ligation and become covalently bonded to the NASMs. After removal of excess, unbound oligonucleotide substrate, the activation empty for the enzyme-linked luminescent label is added to the reaction volume. The resulting luminescent signal (e.g., from HRP, luciferase, etc.) is easily detectable using standard luminometers (e.g., the Fusion multifunction plate reader, Packard Bioscience). In a further embodiment, the activated solution can be precipitated, followed by calorimetric detection. In a particular embodiment, the enzyme linked signal amplification, TSA, (sometimes referred to as CARD-catalyzed reporter deposition) is an ultrasensitive detection method. The technology uses turnover of multiple tyramide substrates per horseradish peroxidase (HRP) enzyme to generate high-density labeling of a target protein or nucleic acid probe in situ. Tyramide signal amplification is a combination of three elementary processes: (1) Ligation (or not) of a biotinylated ligase oligonucleotide substrate oligo, followed by binding (or not) of a streptavidin-HRP to the probe; (2) HRP-mediated conversion of multiple copies of a fluorescent tyramide derivative to a highly reactive radical; (3) Covalent binding of the reactive, short lived tyramide radicals to nearby nucleophilic residues, greatly reducing diffusion-related signal loss.
2. Generating Biosensors
Optical nucleic acid sensor molecules for the detection of a target molecule of interest are generated by first selecting catalytic nucleic acid molecules with catalytic activity modifiable (e.g., activatable) by a selected target molecule. In one embodiment, at least a portion of the catalytic site of the catalytic NASM is then removed and an optical signal generating unit is either added or inserted. Recognition of the target molecule by the nucleic acid sensor molecule activates a change in the properties of the optical signaling unit.
In one embodiment, a biosensor is provided which comprises a plurality of optical nucleic acid sensor molecules labeled with first and second signaling moieties specific for a target molecule. In another embodiment, the optical NASMs are labeled with a single signaling moiety. In one embodiment, the labeled nucleic acid sensor molecules are provided in a solution (e.g., a buffer). In another embodiment, the labeled nucleic acid sensor molecules are attached directly or indirectly (e.g., through a linker molecule) to a substrate. In further embodiments, nucleic acid sensor molecules can be synthesized directly onto the substrate. Suitable substrates which are encompassed within the scope include, e.g., glass or quartz, silicon, encapsulated or unencapsulated semiconductor nanocrystal materials (e.g., CdSe), nitrocellulose, nylon, plastic, and other polymers. Substrates may assume a variety of configurations (e.g., planar, slide shaped, wafers, chips, tubular, disc-like, beads, containers, or plates, such as microtiter plates, and other shapes).
Numerous attachment chemistries, both direct and indirect, can be used to: immobilize the sensor molecules on a solid support. These include, e.g., amine/aldehyde, biotin/streptavidin (avidin, neutravidin), ADH/oxidized 3′ RNA. In a particular embodiment, the nucleic acid sensor molecules ligate a substrate in the presence of a target molecule (see FIGS. 2A and B). In this embodiment the ribozymes are bound to a solid substrate via the effector oligonucleotide sequence (for example, GCGACTGGACATCACGAG (SEQ ID NO:51) in FIG. 2A ).
In one embodiment, a manual or computer-controlled robotic microarrayer is used to generate arrays of nucleic acid sensor molecules immobilized on a solid substrate. In one embodiment, the arrayer utilizes contact-printing technology (i.e., it utilizes printing pins of metal, glass, etc., with or without quill-slots or other modifications). In a different embodiment, the arrayer utilizes non-contact printing technology (i.e., it utilizes ink jet or capillary-based technologies, or other means of dispensing a solution containing the material to be arrayed). Numerous methods for preparing, processing, and analyzing microarrays are known in the art (see Schena et al., 2000; Mace et al., 2000; Heller et al., 1999; Basararsky et al., 2000; Schermer, 1999). Robotic and manual arrayers are commercially available for example, the SpotArray from Packard Biosciences, Meriden, Conn., and the RA-1 from GenomicSolutions, Ann Arbor, Mich.).
In one embodiment, larger substrates can be generated by combining a plurality of smaller biosensors forming an array of biosensors. In a further embodiment, nucleic acid sensor molecules placed on the substrate are addressed (e.g., by specific linker or effector oligonucleotide sequences on the nucleic acid sensor molecule) and information relating to the location of each nucleic acid sensor molecule and its target molecule specificity is stored within a processor. This technique is known as spatial addressing or spatial multiplexing. Techniques for addressing nucleic acids on substrates are known in the art and are described in, for example, U.S. Pat. No. 6,060,252, U.S. Pat. No. 6,051,380, U.S. Pat. No. 5,763,263, U.S. Pat. No. 5,763,175, and U.S. Pat. No. 5,741,462.
In one embodiment different nucleic acid sensor molecules are immobilized on a streptavidin-derivatized glass substrate via biotin linkers. The individual sensor spots can be manually arrayed. Solution measurements of target molecule concentration can be made by bathing the surface of the biosensor array in a solution containing the targets (analytes) of interest. In practice this is accomplished either by incorporating the array within a microflowcell (with a flow rate of ˜25 microliters/min), or by placing a small volume (˜6–10 microliters) of the target solution on the array surface and covering it with a cover slip. Detection and quantification of target concentration is accomplished by monitoring changes in the fluorescence polarization (FP) signal emitted from the fluorescein label under illumination by 488 nm laser radiation. The rotational diffusion rate is inversely proportional to the molecular volume; thus the rotational correlation time for the roughly 20-nucleotide unbound sensor (i.e., in the absence of target molecule) will be significantly less than that for the target-NASM complex. The fluorescence emission from the target-NASM complex will therefore experience greater residual polarization due to the smaller angle through which the emission dipole axis of the sensor fluorophore can rotate within its radiative lifetime. In another embodiment, different surface attachment chemistries are used to immobilize the NASMs on a solid substrate. As previously noted, these include, e.g., interactions involving biotin/streptavidin, amine/aldehyde, hydrazide, thiol, or other reactive groups.
The specificity of the biosensors and NASMs according to the invention is determined by the specificity of the target modulation domain of the nucleic acid sensor molecule. In one embodiment, a biosensor is provided in which all of the nucleic acid sensor molecules recognize the same molecule. In another embodiment, a biosensor is provided which can recognize at least two different target molecules allowing for multi-analyte detection. Multiple analytes can be distinguished by using different combinations of first and second signaling molecules. In addition to the wavelength/color and spatial multiplexing techniques previously described, biosensors may be used to detect multiple analytes using intensity multiplexing. This is accomplished by varying the number of fluorescent label molecules on each biosensor in a controlled fashion. Since a single fluorescent label is the smallest integral labeling unit possible, the number of fluorophores (i.e., the intensity from) a given biosensor molecule provides a multiplexing index. Using the combination of 6-wavelength (color) and 10-level intensity multiplexing, implemented in the context of semiconductor nanocrystals derivatized as bioconjugates, would theoretically allow the encoding of million different analyte-specific biosensors (Han et al., 2001).
In one embodiment, multiple single target biosensors can be combined to form a multianalyte detection system which is either solution-based or substrate-based according to the needs of the user. In this embodiment, individual biosensors can be later removed from the system, if the user desires to return to a single analyte detection system (e.g., using target molecules bound to supports, or, for example, manually removing a selected biosensor(s) in the case of substrate-based biosensors). In a further embodiment, nucleic acid sensor molecules binding to multiple analytes are distinguished from each other by referring to the address of the nucleic acid sensor molecule on a substrate and correlating its location with the appropriate target molecule to which it binds (previously described as spatial addressing or multiplexing).
In one embodiment, subsections of a biosensor array can be individually subjected to separate analyte solutions by use of substrate partitions or enclosures that prevent fluid flow between subarrays, and microfluidic pathways and injectors to introduce the different analyte solutions to the appropriate sensor subarray.
3. Nucleic Acid Sensor Molecule and Biosensor Systems
In one embodiment, a nucleic acid sensor molecule or biosensor system is provided comprising a nucleic acid sensor molecule in communication with a detector system. In a further embodiment, a processor is provided to process optical signals detected by the detector system. In still a further embodiment, the processor is connectable to a server which is also connectable to other processors. In this embodiment, optical data obtained at a site where the NASM or biosensor system resides can be transmitted through the server and data is obtained, and a report displayed on the display of the off-site processor within seconds of the transmission of the optical data. In one embodiment, data from patients is stored in a database which can be accessed by a user of the system.
Data obtainable from the biosensors according to the invention include diagnostic data, data relating to lead compound development, and nucleic acid sensor molecule modeling data (e.g., information correlating the sequence of individual sensor molecules with specificity for a particular target molecule). In one embodiment, these data are stored in a computer database. In a further embodiment, the database includes, along with diagnostic data obtained from a sample by the biosensor, information relating to a particular patient, such as medical history and billing information. Although, in one embodiment, the database is part of the nucleic acid sensor molecule system, the database can be used separately with other detection assay methods and drug development methods.
Detectors used with the nucleic acid sensor molecule systems according to the invention, can vary, and include any suitable detectors for detecting optical changes in nucleic acid molecules. These include, e.g., photomultiplier tubes (PMTs), charge coupled devices (CCDs), intensified CCDs, and avalanche photodiodes (APDs). In one embodiment, a nucleic acid sensor molecule comprising labeled nucleic acid sensor molecules is excited by a light source in communication with the biosensor. In a further embodiment, when the optical signaling unit comprises first and second signal moieties that are donor/acceptor pairs (i.e., signal generation relies on the fluorescence of a donor molecule when it is removed from the proximity of a quencher acceptor molecule), recognition of a target molecule will cause a large increase in fluorescence emission intensity over a low background signal level. The high signal-to-noise ratio permits small signals to be measured using high-gain detectors, such as PMTs or APDs. Using intensified CCDs, and PMTs, single molecule fluorescence measurements have been made by monitoring the fluorescence emission, and changes in fluorescence lifetime, from donor/acceptor FRET pairs (see Sako, et al., 2000; Lakowicz et al, 1991)).
Light sources include, e.g., filtered, wide-spectrum light sources, (e.g., tungsten, or xenon arc), laser light sources, such as gas lasers, solid state crystal lasers, semiconductor diode lasers (including multiple quantum well, distributed feedback, and vertical cavity surface emitting lasers (VCSELs)), dye lasers, metallic vapor lasers, free electron lasers, and lasers using any other substance as a gain medium. Common gas lasers include Argon-ion, Krypton-ion, and mixed gas (e.g., Ar–Kr) ion lasers, emitting at 455, 458, 466, 476, 488, 496, 502, 514, and 528 nm (Ar ion); and 406, 413, 415, 468, 476, 482, 520, 531, 568, 647, and 676 nm (Kr ion). Also included in gas lasers are Helium Neon lasers emitting at 543, 594, 612, and 633 mn. Typical output lines from solid state crystal lasers include 532 nm (doubled Nd:YAG) and 408/816 nm (doubled/primary from Ti:Sapphire). Typical output lines from semiconductor diode lasers are 635, 650, 670, and 780 rnm.
Excitation wavelengths and emission detection wavelengths will vary depending on the signaling moieties used. In one embodiment, where the first and second signaling moieties are fluorescein and DABCYL, the excitation wavelength is 488 nm and the emission wavelength is 514 mn. In the case of semiconductor nanocrystal-based fluorescent labels, a single excitation wavelength or broadband UV source may be used to excite several probes with widely spectrally separated emission wavelengths (see Bruchez et al., 1998; Chan et al., 1998).
In one embodiment, detection of changes in the optical properties of the nucleic acid sensor molecules is performed using any of a cooled CCD camera, a cooled intensified CCD camera, a single-photon-counting detector (e.g., PMT or APD), or other light sensitive sensor. In one embodiment, the detector is optically coupled to the nucleic acid sensor molecule through a lens system, such as in an optical microscope (e.g., a confocal microscope). In another embodiment, a fiber optic coupler is used, where the input to the optical fiber is placed in close proximity to the substrate surface of a biosensor, either above or below the substrate. In yet another embodiment, the optical fiber provides the substrate for the attachment of nucleic acid sensor molecules and the biosensor is an integral part of the optical fiber.
In one embodiment, the interior surface of a glass or plastic capillary tube provides the substrate for the attachment of nucleic acid sensor molecules. The capillary can be either circular or rectangular in cross-section, and of any dimension. The capillary section containing the biosensors can be integrated into a microfluidic liquid-handling system which can inject different wash, buffer, and analyte-containing solutions through the sensor tube. Spatial encoding of the sensors can be accomplished by patterning them longitudinally along the axis of the tube, as well as radially, around the circumference of the tube interior. Excitation can be accomplished by coupling a laser source (e.g., using a shaped output beam, such as from a VCSEL) into the glass or plastic layer forming the capillary tube. The coupled excitation light will undergo TIR at the interior surface/solution interface of the tube, thus selectively exciting fluorescently labeled biosensors attached to the tube walls, but not the bulk solution. In one embodiment, detection can be accomplished using a lens-coupled,or proximity-coupled large area segmented (pixelated) detector, such as a CCD. In a particular embodiment, a scanning (i.e., longitudinal/axial and azimuthal) microscope objective lens/emission filter combination is used to image the biosensor substrate onto a CCD detector. In a different embodiment, a high resolution CCD detector with an emission filter in front of it is placed in extremely close proximity to the capillary to allow direct imaging of the biosensors. In a different embodiment, highly efficient detection is accomplished using a mirrored tubular cavity that is elliptical in cross-section. The sensor tube is placed along one focal axis of the cavity, while a side-window PMT is placed along the other focal axis with an emission filter in front of it. Any light emitted from the biosensor tube in any direction will be collected by the cavity and focused onto the window of the PMT.
In still another embodiment, the optical properties of a nucleic acid sensor molecule are analyzed using a spectrometer (e.g., such as a luminescence spectrometer) which is in communication with the biosensor. The spectrometer can perform wavelength discrimination for excitation and detection using either monochromators (i.e., diffraction gratings), or wavelength bandpass filters. In this embodiment, biosensor molecules are excited at absorption maxima appropriate to the signal labeling moieties being used (e.g., acridine at 450 nm, fluorescein at 495 nm) and fluorescence intensity is measured at emission wavelengths appropriate for the labeling moiety used (e.g., acridine at 495 nm; fluorescein at 515 nm). Achieving sufficient spectral separation (i.e., a large enough Stokes shift) between the excitation wavelength and the emission wavelength is critical to the ultimate limit of detection sensitivity. Given that the intensity of the excitation light is much greater than that of the emitted fluorescence, even a small fraction of the excitation light being detected or amplified by the detection system will obscure a weak biosensor fluorescence emission signal. In one embodiment, the biosensor molecules are in solution and are pipetted (either manually or robotically) into a cuvette or a well in a microtiter plate within the spectrometer. In a further embodiment, the spectrometer is a multifinction plate reader capable of detecting optical changes in fluorescence or luminescence intensity (at one or more wavelengths), time-resolved fluorescence, fluorescence polarization (FP), absorbance (epi and transmitted), etc., such as the Fusion multifunction plate reader system (Packard Biosciences, Meriden, Conn.). Such a system can be used to detect optical changes in biosensors either in solution, bound to the surface of microwells in plates, or immobilized on the surface of solid substrate (e.g., a biosensor microarray on a glass substrate). This type of multiplate/multisubstrate detection system, coupled with robotic liquid handling and sample manipulation, is particularly amenable to high-throughput, low-volume assay formats.
In embodiments where nucleic acid sensor molecules are attached to substrates, such as a glass slide or in microarray format, it is desirable to reject any stray or background light in order to permit the detection of very low intensity fluorescence signals. In one embodiment, a small sample volume (˜10 nL) is probed to obtain spatial discrimination by using an appropriate optical configuration, such as evanescent excitation or confocal imaging. Furthermore, background light can be minimized by the use of narrow-bandpass wavelength filters between the sample and the detector and by using opaque shielding to remove any ambient light from the measurement system.
In one embodiment, spatial discrimination of nucleic acid sensor molecules attached to a substrate in a direction normal to the interface of the substrate (i.e., excitation of only a small thickness of the solution layer directly above and surrounding the plane of attachment of the biosensor molecules to the substrate surface) is obtained by evanescent wave excitation. This is illustrated in FIG. 12 . Evanescent wave excitation utilizes electromagnetic energy that propagates into the lower-index of refraction medium when an electromagnetic wave is totally internally reflected at the interface between higher and lower-refractive index materials. In this embodiment a collimated laser beam is incident on the substrate/solution interface (at which the biosensors are immobilized) at an angle greater than the critical angle for total internal reflection (TIR). This can be accomplished by directing light into a suitably shaped prism or an optical fiber. In the case of a prism, as shown in FIG. 12 , the substrate is optically coupled (via index-matching fluid) to the upper surface of the prism, such that TIR occurs at the substrate/solution interface on which the biosensors are immobilized. Using this method, excitation can be localized to within a few hundred nanometers of the substrate/solution interface, thus eliminating autofluorescence background from the bulk analyte solution, optics, or substrate. Target recognition is detected by a change in the fluorescent emission of the nucleic acid sensor, whether a change in intensity or polarization. Spatial discrimination in the plane of the interface (i.e., laterally) is achieved by the optical system.
In one embodiment, a large area of the biosensor substrate is uniformly illuminated, either via evanescent wave excitation or epi-illumination from above, and the detected signal is spatially encoded through the use of a pixelated detector, such as CCD camera. An example of this type of uniform illumination/CCD detection system (using epi-illumination)) for the case of microarrayed biosensors on solid substrates is the GeneTAC 2000 scanner (GenomicSolutions, Ann Arbor, Mich.). In a different embodiment, a small area (e.g., 10×10 microns to 100×100 microns) of the biosensor substrate is illuminated by a micro-collimated beam or focused spot. In one embodiment, the excitation spot is rastered in a 2-dimensional scan across the static biosensor substrate surface and the signal detected (with an integrating detector, such as a PMT) at each point correlated with the spatial location of that point on the biosensor substrate (e.g., by the mechanical positioning system responsible for scanning the excitation spot). Two examples of this type of moving spot detection system for the case of microarrayed biosensors on solid substrates are: the DNAScope scanner (confocal, epi-illumination, GeneFocus, Waterloo, ON, Canada), and the LS IV scanner (non-confocal, epi-illumination, GenomicSolutions, Ann Arbor, Mich.). In yet another embodiment, a small area (e.g., 10×10 microns to 100×100 microns) of the biosensor substrate is illuminated by a stationary micro-collimated beam or focused spot, and the biosensor substrate is rastered in a 2-dimensional scan beneath the static excitation spot, with the signal detected (with an integrating detector, such as a PMT) at each point correlated with the spatial location of that point on the biosensor substrate (e.g., by the mechanical positioning system responsible for scanning the substrate). An example of this type of moving substrate detection (using confocal epi-illumination) system for the case of microarrayed biosensors on solid substrates is the ScanArray 5000 scanner (Packard Biochip, Billerica, Mass.).
In the embodiment shown in FIG. 12 , a TIR evanescent wave excitation optical configuration is implemented, with a static substrate and dual-capability detection system. The detection system is built on the frame of a Zeiss universal fluorescence microscope. The system is equipped with 2 PMTs on one optical port, and an intensified CCD camera (Cooke, St. Louis, Mo.) mounted on the other optical port. The optical path utilizes a moveable mirror which can direct the collimated, polarized laser beam through focusing optics to form a spot, or a beam expander to form a large (>1 cm) beam whose central portion is roughly uniform over the field of view of the objective lens. Another movable mirror can direct the light either to the intensified CCD camera when using large area uniform illumination, or to the PMTs in the scanned spot mode. In spot scanning mode, a polarizing beamsplitter separates the parallel and perpendicular components of the emitted fluorescence and directs each to its designated PMT. An emission filter in the optical column rejects scattered excitation light from either type of detector. In CCD imaging mode, manually adjusted polarizers in the optical column of the microscope must be adjusted to obtain parallel and perpendicular images from which the fluorescence polarization or anisotropy can be calculated. A software program interfaces with data acquisition boards in a computer which acquires the digital output data from both PMTs and CCD. This program also controls the PMT power, electromechanical shutters, and galvanometer mirror scanner, calculates and plots fluorescence polarization in real time, and displays FP and intensity images.
In another embodiment, the detection system is a single photon counter system (see, e.g., U.S. Pat. No. 6,016,195 and U.S. Pat. No. 5,866,348) requiring rastering of the sensor substrate to image larger areas and survey the different binding regions on the biosensor.
In another embodiment of the invention, the biosensor is used to detect a target molecule through changes in the electrochemical properties of the nucleic acid sensor moleculeor molecules in close proximity to it which occur upon recognition of the NASM to the target molecule.
In a preferred embodiment, the biosensor system would consist of three major components: One, optical nucleic acid sensor molecules immobilized on an array of independently addressable gold electrodes. The nucleic acid sensor molecules immobilized on each electrode may be modulated by the same or different target molecules, including proteins, metabolites and other small molecules, etc.; two, an oligonucleotide substrate which acts as a signaling probe, hybridizing to the oligonucleotide substrate binding domain of the ligase sensor and forming a covalent phosphodiester bond with the nucleic acid sensor molecule nucleotide adjacent to its 3′ terminus in the presence of the appropriate target. This oligonucleotide substrate is typically a nucleic acid sequence containing one or more modified nucleotides conjugated to redox active metallic complexes, e.g., ferrocene moieties, which can act as electron donors; and three, an immobilized mixed self-assembled surface monolayer (SAM), comprised of conductive species separated by insulating species, covering the surface of the electrodes. Examples of conductive species include thiol-terminated linear molecules, such as oligophenylethyl molecules, while examples of nonconductive thiol-terminated linear molecules, include alkane-thiol molecules terminated with polyethylene glycol (PEG). All immobilized species can be covalently attached to the electrode surface by terminal thiol groups. FIG. 15 schematically shows the structure of the mixed self-assembled surface monolayer (SAM) coating the gold electrode, as well as the immobilized nucleic acid sensor molecule (NASM) with a ligated oligonucleotide substrate conjugated to several redox active moieties. Upon recognition of the target molecule by the target modulation domain and subsequent ligation of the oligonucleotide substrate at the site indicated in the figure, the redox active signaling moieties coupled to the substrate oligo will be brought into close proximity to the conductive surface layer, resulting in a detectable increase in electronic surface signal.
In another preferred embodiment, the biosensor system would consist of two major components: (1) Optical nucleic acid sensor molecules immobilized on an array of independent addressable gold electrodes. The nucleic acid sensor molecules immobilized on each electrode may be modulated by the same or different target molecules, including proteins, metabolites and other small molecules, etc. The NASM will contain one or more nucleotides conjugated to redox active metallic complexes, e.g., ferrocene moieties, which can act as electron donors; and (2) an immobilized mixed self-assembled surface monolayer (SAM), comprised of conductive species separated by insulating species, covering the surface of the electrodes. Examples of conductive species include thiol-terminated linear molecules, such as oligophenylehtynyl molecules, while examples of nonconductive thiol-terminated linear molecules include alkane-thiol molecules terminated with polyethylene glycol (PEG). FIG. 16 shows the SAM-coated molecule immobilized via a capture oligonucleotide. In this case, the redox active signaling moieties are coupled to the body of the NASM, as shown in the figure. Upon recognition of the target molecule by the target modulation domain and subsequent cleavage at the site indicated in the figure, the bulk of the NASM, including the nucleotides coupled to the redox active signaling moieties will dissociate from the surface, resulting in a detectable loss of electronic current signal.
In another embodiment, the array would be subjected, e.g., by an integrated microfluidic flowcell, to an analyte solution containing the target(s) of interest at some unknown concentration. The range of possible sample analyte solutions may include standard buffers, biological fluids, and cell or tissue extracts. The sample solution will also contain the signaling probe at a saturating concentration relative to the immobilized nucleic acid sensor molecule. This ensures that at any given time during analysis, there is a high probability that each nucleic acid sensor molecule will have a signaling probe hybridized to it. In the presence of the target molecules in the sample solution, the nucleic acid sensor molecule will form a covalent phosphodiester bond, i.e., ligate, with the signaling probe, thus immobilizing it with its redox active electron donor species in electrical contact with the conductive molecules within the mixed self-assembled surface monolayer. After some integration time, during which signal probe ligation occurs, it may be necessary to denature the hybridized but unligated signaling probes. This denaturation step, which effectively removes ‘background’ signaling probes and their associated redox moieties from the vicinity of the electrode, can be accomplished by a small temperature increase (e.g., from 21° C. to 25° C.), or by a brief negative voltage spike applied to the sensor electrodes followed by the application of a large positive DC voltage to a separate electrode that would collect unligated signaling. For the case of a sufficiently short hybridization region, e.g., 5 base-pairs, on the signaling probe, a separate denaturation step may not be necessary. In either case, following nucleic acid sensor molecule activation by target molecules, a linear electrical potential ramp is applied to the electrodes. The redox species conjugated to the immobilized signaling probe-nucleic acid sensor molecule will be electrochemically oxidized, liberating one or more electrons per moiety. The conductive molecules within the surface monolayer will provide an electrical path for the liberated electrons to the electrode surface, as shown in FIG. 17 .
The net electron transfer to or from the electrode will be measured as a peak in the faradaic current, centered at the redox potential of the electron donor species (specified for a given reference electrode) and superposed on top of the capacitive current baseline which is observed in the absence of surface-immobilized signaling probes. This is shown schematically in FIG. 18 .
Quantitative analysis of the sensor signal, and therefore accurate determination of target molecule concentration, is based on the fact that the measured faradaic peak height is directly proportional to number of redox moieties immobilized at the electrode, that is, the number of nucleic acid sensor molecules ligated to signaling probes times the multiplicity of redox moieties per signaling probe molecule. Signal generation by the nucleic acid sensor molecules is thus amplified by virtue of multiple redox species per signaling probe. In addition, if an alternating current (AC) bias voltage is applied (superposed) on top of the DC linear voltage ramp applied to the sensor electrodes, i.e., in the case of AC voltammetry, signal amplification would result from the cyclic repetition of the signal-generating redox reaction.
The system described above for the case of a surface-immobilized nucleic acid sensor molecule which ligates a signaling probe containing one or more modified nucleotides conjugated to redox active species suggests a general method and instrumentation for the detection and quantitation of an arbitrary target molecule in solution in real time. Detection of a particular target would require development of a nucleic acid sensor molecule against that recognizes the target molecule. Additionally, nucleic acid sensor molecules have been developed which are activated only in the presence of two different target molecules. Such dual-effector sensors could be used to detect the simultaneous presence of two or more targets, or could be used in conjunction with single-target molecule sensors to form biological logic (i.e., AND, OR, etc.) circuits.
Multiplexed detection of multiple target molecules simultaneously in a complex sample solution could be accomplished by immobilizing nucleic acid sensor molecules against the target molecules of interest on separate electrodes within a two-dimensional array of electrodes. A complex sample solution containing multiple target molecules and a common signaling probe could then be introduced to the array. All nucleic acid sensor molecules would be exposed simultaneously to all targets, with the target-activated nucleic acid sensor molecule response(s) being observed and recorded only at the spatial location(s) known to contain a nucleic acid sensor molecule specific for the target molecules present in the (unknown) sample. The utility of such a nucleic acid sensor molecule array would be greatly enhanced by the integration of a microfluidic sample and reagent delivery system. Such an integrated microfluidic system would allow the application of reagents and samples to the sensor array to be automated, and would allow the reduction of sample volume required for analysis to <1 uL.
The sensor array electrodes may be of any configuration, number, and size. In a preferred embodiment, the sensor and reference electrodes would be circular gold pads on the order of 100–500 uM in diameter, separated by a center-to center distance equal to twice their diameter. Each electrode would be addressed by separate electrical interconnects. The application of electrical signals to the sensor electrodes can be accomplished using standard commercially available AC and DC voltage sources. Detection of faradaic electrical signals from the sensor electrodes can be accomplished easily using standard commercially available data acquisition boards mounted within and controlled by a microcomputer. Specifically, the raw sensor current signals would need to be amplified, and then converted to a voltage and analyzed via a high resolution (i.e., 16 bit) analog to digital converter (ADC). It is possible to reduce the signal background and to increase the signal to noise ratio (SNR) by using the common technique of phase-sensitive detection. In this detection method, an alternating current (AC) bias voltage (at a frequency between, for example, 100 to 1000 Hz) is superposed on top of the DC linear voltage ramp applied to the sensor electrodes. The frequency of the applied bias voltage is called the fundamental frequency. It can be shown that the sensor response signal contains multiple frequency components, including the fundamental frequency and its harmonics (integral multiples of the fundamental frequency). It can further be shown that the nth harmonic signal is proportional to the nth derivative of the signal. Detecting these derivative signals (by means of a lock-in amplifier) minimizes the effects of constant or sloping backgrounds, and can enhance sensitivity by increasing the signal to noise ratio and allowing the separation of closely spaced signal peaks. It should be noted that digital, computer-controlled AC and DC voltage sources (i.e., digital to analog converters, DACs), current preamplifiers, analog to digital converters (ADCs), and lock-in amplifiers are all available as integrated signal generation/acquisition boards that can be mounted within and controlled by a single microcomputer.
In a preferred embodiment, an integrated nucleic acid sensor molecule system with electrochemical detection would include the following elements one, a independently addressable multielement electrode array with immobilized surface layer composed of conductive species separated by insulating species and sensors; two, optical nucleic acid sensor molecules immobilized on the electrode array; three, an oligonucleotide substrate/signaling probe which ligates with the nucleic acid sensor molecule in the presence of the appropriate target; four, an automated or semi-automated microfluidic reagent and sample delivery system; and five, a reader instrument/data acquisition system consisting of a microcomputer controlling the appropriate voltage sources, current and lock-in amplifiers, data acquisition boards, and software interface for instrument control and data collection.
In another embodiment, the change in activity of the nucleic acid sensor molecule can be detected by watching the change in fluorescence of a nucleic acid sensor molecule when it is immobilized on a chip. A ligase can be attached to a chip and its ligase activity monitored. Ligase ERK nucleic acid sensor molecules, labeled with one fluorophore, e.g., Cy3 is attached via an amino modification to an aldehyde chip. The initial Cy3 fluorescence indicates the efficiency of immobilization of the nucleic acid sensor molecules. Next, the chip is exposed to a substrate labeled with a second fluorophore, e.g., Cy5, with or without the ERK protein target. In the presence of ERK the nucleic acid sensor molecule ligates the substrate to itself, and becomes Cy5-labeled. Without ERK, the ligation does not occur.
The use of a labeled effector oligonucleotide does not change the rate of ligation of the nucleic acid sensor molecule whether ERK is present or not. When using nucleic acid sensor molecules in the context of a chip based system, in one embodiment, an effector oligonucleotide is used to attach the nucleic acid sensor molecule to the chip. Whether one uses effector oligonucleotide or not, the TaqMan (real-time PCR)traces obtained in the presence or absence of target (ERK) for ERK dependent ligases are identical. The presence or absence of this effector oligonucleotide does not affect the activity of the nucleic acid sensor molecule.
In another embodiment, a hammerhead nucleic acid sensor molecule could be used to measure the concentration of an analyte through the use of fluorescence. FIG. 82 shows how many nucleic acid sensor molecules with different effector molecules and/or analytes could be integrated onto one chip to study the concentration of many molecules at once.
Any optical method known in the art, in addition to those described above can be used in the detection and/or quantification of all targets of interest in all sensor formats, in both biological and nonbiological media. These targets include, e.g., those listed in Table 1, below.
Any other detection method can also be used in the detection and/or quantification of targets. For example, radioactive labels could be used, including 32P, 33P, 14C, 3H, or 125I. Also enzymatic labels can be used including horse radish peroxidase or alkaline phosphatase. The detection method could also involve the use of a capture tag for the bound nucleic acid sensor molecule.
4. Methods of Using Nucleic Acid Sensor Molecules
A. Diagnostic Assays
The nucleic acid sensor molecules according to the invention can be used to detect virtually any target molecule. In one embodiment, the target molecule is a target molecule associated with a pathological condition and detection of changes in the optical properties of the nucleic acid sensor molecules of the biosensor provides a means of diagnosing the condition. Target molecules which are contemplated within the scope include, e.g. proteins, modified forms of proteins, metabolites, organic molecules, and metal ions, as discussed above. Because signal generation in this system is reversible, washing of the biosensor(s) in a suitable buffer will allow the biosensor(s) to be used multiple times, enhancing the reproducibility of the any diagnostic assay since the same reagents can be used over and over. Suitable wash buffers include, e.g., binding buffer without target or, for faster washing, a high salt buffer or other denaturing conditions, followed by re-equilibration with binding buffer.
Re-use of the biosensor is enhanced by selecting optimal fluorophores. For example, Alexa Fluor 488, produced by Molecular Probes, has similar optical characteristics compared to fluorescein, but has a much longer lifetime. However, in one embodiment, a site recognized by a nuclease is engineered proximal to the signal generating site, and sequences comprising signaling moieties are removed from the biosensor and replaced by new sequences, as needed.
Profiling Biosensors for Use in Diagnostic Assays
In one embodiment, the expression pattern of a plurality of target molecules is determined to obtain a profile of target molecules associated with a trait in an individual to determine an expression pattern which is diagnostic of that trait. In this embodiment, combinations of biosensors targeted to individual target molecules are selected until a signature optical profile is determined which is characteristic of a trait. Traits include, e.g., a disease, a genetic alteration, a combination of genetic alterations (e.g., a polygenic disorder), a physiological reaction to an environmental condition, or a wild type state (e.g., of an organism or of an organ system). The target molecules which generate the signature optical profile are identified (based on the type of biosensors used) as signature target molecules. The expression of the signature target molecules can thereafter be determined to identify the presence of the trait in a patient.
The expression of the target molecules can be identified using any molecular detection system known in the art; however, in a preferred embodiment, the detection system comprises optical nucleic acid sensor molecules and the trait is identified by detecting the signature optical profile. In one embodiment, data relating to the signature optical profile is stored in the memory of a computer. Signature optical profiles can be generated for individual patients or can be generated for populations of individuals. In the latter embodiment, data relating to a composite signature profile (e.g., comprising normalized data) is stored in the memory of a computer or in a computer program product.
Because the biological function of the target molecules does not need to be known, biosensors according to the invention can be generated which are diagnostic of diseases/traits whose biological basis is not yet known or are the result of complex polygenic interactions and/or of environmental influences. In one embodiment, nucleic acid sensor molecules are identified which are activatable by synthetic polypeptides obtained from putative open reading frames identified in the human genome project and/or in other sequencing efforts. Combinations of these activatable nucleic acid sensor molecules (along with activatable nucleic acid sensor molecules specific for target molecules with known functions) are identified which generate a diagnostic optical signal, and signature target molecules are in turn identified which are linked to a particular trait, allowing a biological-activity to be associated with a previously uncharacterized molecule.
Data relating to signature target molecules or to the optical signals generated upon activation of nucleic acid sensor molecules upon binding to signature target molecules is stored in a database, which can include further information such as sequence information or chemical structure information relating to the signature target molecule. A signature profile relating to a particular trait is generated based on normalized data from a plurality of tests. In one embodiment, a signature profile is obtained by determining any or all of the level, chemical structure, or activity, of signature target molecules associated with a disease in samples from a population of healthy individuals to determine a signature profile corresponding to a healthy state. In a further embodiment, signature profiles are obtained using data from subsets of populations which are divided into groups based on sex, age, exposure to environmental factors, ethnic background, and family history of a disease.
B. Drug Discoverv
Generally, methods of drug discovery comprise steps of 1) identifying target(s) molecules associated with a disease; 2) validating target molecules (e.g., mimicking the disease in an animal or cellular model); 3) developing assays to identify lead compounds which affect that target (e.g., such as using libraries to assay the ability of a compound to bind to the target); 4) prioritizing and modifying lead compounds identified through biochemical and cellular testing; 5) testing in animal models; and 6) testing in humans (clinical trials). Through the power of genomics and combinatorial chemistry, large numbers of lead compounds can be identified in high throughput assays (step 3); however, a bottleneck occurs at step 4 because of the lack of efficient ways to prioritize and optimize lead compounds and to identify those which actually offer potential for clinical trials. The target activatable nucleic acid sensor molecules according to the present invention offer a way to solve this problem by providing reagents which can be used at each step of the drug development process. Most importantly, the target activatable nucleic acid sensor molecules according to the present invention offer a way to correlate biochemical data, from in vitro biochemistry and cellular assays, with the effect of a drug on physiological response from a biological assay.
In one embodiment of invention, a method for identifying a drug compound is provided, comprising identifying a profile of target molecules associated with a disease trait in a patient, administering a candidate compound to the patient, and monitoring changes in the profile. In another embodiment, the monitored profile is compared with a profile of a healthy patient or population of healthy patients, and a compound which generates a profile which is substantially similar to the profile of target molecules in the healthy patient(s) (based on routine statistical testing) is identified as a drug. In a further embodiment, both the profiling and the drug identification step is performed using at least one nucleic acid sensor molecule whose properties change upon binding to a target molecule.
In a further embodiment, a method for identifying a drug compound comprises identifying a plurality of pathway target molecules, each belonging to a pathway, monitoring the level, chemical structure, and/or activity of pathway target molecules in a patient having a disease trait, administering a candidate compound to the patient, and monitoring changes in the level, chemical structure, and/or activity of the pathway target molecules. In another embodiment, the monitored level, chemical structure, and/or activity of the pathway target molecules is compared to the level, chemical structure, and/or activity of pathway target molecules in a wild type patient or patients. In a further embodiment, both profiling and the identification of drug compounds is performed using at least one nucleic acid sensor molecule whose properties change upon binding to a pathway target molecule.
Properties according to this aspect include, e.g., optical properties, change in sequence, chemical structure, catalytic activity, and/or molecular weight. In a preferred embodiment, sensor molecules are target activated optical nucleic acid sensor molecules.
i. Nucleic Acid Sensor Molecules for Use in Identifying Lead Compounds
In one embodiment, biosensors activatable by signature target molecules, identified as described above, are provided and are validated by testing against multiple patient samples in vitro to verify that the optical signal generated by these molecules is diagnostic of a particular disease. Validation can also be performed ex vivo, e.g., in cell culture, (using microscope-based detection systems and other optical systems as described in U.S. Pat. No. 5,843,658, U.S. Pat. No. 5,776,782, U.S. Pat. No. 5,648,269, and U.S. Pat. No. 5,585,245) and/or in vivo, for example, by providing a profile biosensor in communication with an optical fiber.
The incorporation of biosensors into fiber optic waveguides is known in the art (see, e.g., U.S. Pat. No. 4,577,109, U.S. Pat. No. 5,037,615, U.S. Pat. No. 4,929,561, U.S. Pat. No. 4,822,746, and U.S. Pat. No. 4,762,799). The selection of fluorescent energy transfer molecules for in vivo use is described in EP-A 649848, for example. In this embodiment, nucleic-acid based biosensors are introduced into the body by any suitable medical access device, such as an endoscope or a catheter. The optical fiber is provided within a working lumen of the access device and is in communication with an optical imaging system.
In one embodiment, the same methods which are used to validate the diagnostic value of particular sets of target molecule/nucleic acid sensor molecule combinations are used to identify lead compounds which can function as drugs. Thus, in one embodiment, the effects of a compound on target dependent optical signaling is monitored to identify changes in a signature profile arising as a result of treatment with a candidate compound.
In one embodiment, samples from a treated patient are tested in vitro; however, samples can also be tested ex vivo or in vivo. When the diagnostic profile identified by the biosensor changes from a profile which is a signature of a disease to one which is substantially similar to the signature of a wild type state (e.g., as determined using routine statistical tests), the lead compound is identified as a drug. Target molecules which activate the biosensor can comprise molecules with characterized activity and/or molecules with uncharacterized activity. Because large number of target molecules can be monitored simultaneously, the method provides a way to assess the affects of compounds on multiple drug targets simultaneously, allowing identification of the most sensitive drug targets associated with a particular trait (e.g., a disease or a genetic alteration).
Examples of suitable target molecules include, e.g., nuclear hormone receptor (NHR) polypeptides; G-coupled protein receptor (GPCR) polypeptides, phosphodiesterase (PDE), and protein kinases.
NHR Polypeptides
Included in the invention are methods of identifying nucleic acid sensor molecules for detection of conformational isoforms of nuclear hormone receptors, as well as the nucleic acid sensor molecules identified by the methods described herein.
Nuclear hormone receptors (NHRs) act as ligand-inducible transcription factors by directly interacting as monomers, homodimers, or heterodimers in complex with DNA response elements of target genes. The activation of these transcription regulators is induced by the change in conformation of the NHR upon complex formation with ligand.
Provided are methods for generating unique NASMs for each NHR ligand binding domain (LBD). The NASMs described herein can include, e.g., those derived from the hammerhead, hairpin, L1 ligase or group 1 intron ribozymes and the like, any of which transduce molecular recognition into a detectable signal.
Also provided is a direct mechanistic assay for the action of small molecule ligand-agonism, -antagonism and partial antagonism of members of the NHR family. The mechanistic assays function in both in vitro biochemical as well as with in vitro cell-based settings. In the in vitro assay setting, the nucleic acid sensor molecules are designed to recognize one conformational isomer of the NHR. In one embodiment, the nucleic acid sensor molecule recognizes the unique conformation that exists for the agonist bound form of a hormone receptor; such as that observed for the estrogen receptor ligand binding domain ER-LBD when bound to estrogen (Shiau A K, Barstad D, Loria P M, Cheng L, Kushner P J, Agard D A, Greene G L. Cell. 1998;95(7):927–37) and then produces a detectable signal, such as release of fluorescently labeled oligonucleotide, radiolabeled oligonucleotide, or reveals a change in nucleic acid sensor molecule conformation driven by ligand binding through a change in fluorescence or the like. Hence, in this embodiment, the nucleic acid sensor molecule transduces molecular recognition of the ER-LBD-estrogen agonist complex into a detectable signal. The level of the signal is then used to quantify the amount of ER-LBD-estrogen agonist complex present in solution. In another embodiment, the ER-LBD-estrogen specific nucleic acid sensor molecule is used as a screening tool in assays designed to detect inhibitors of ER-LBD-estrogen complex formation. These screening tools can be used to determine the inhibition potency of compounds in in vitro biochemical assays or in in vitro cell-based assays. Inhibitors of estrogen binding to ER-LBD are useful as anti-proliferative agents for treatment of breast cancers (e.g., tamoxifen) and other estrogen dependent diseases. In another embodiment, nucleic acid sensor molecules are introduced into cell lines by known methods of electroporation, transfection or coupling to peptide translocating agents such as tat or antennapedia peptides. In another embodiment, the ER-LBD-estrogen complex specific nucleic acid sensor molecule is an allosteric intron imbedded in a reporter gene such as GFP or luciferase or the like. When the intron derived nucleic acid sensor molecule is inserted into the reporter gene it renders reporter gene expression effector dependent. Thus, in one embodiment functional GFP protein is expressed only when the ER-LBD-estrogen complex is present in the cell, and inhibitors of ER-LBD-estrogen complex formation thus block functional GFP protein expression in appropriate mammalian, such as MCF7 or T47D, yeast or bacterial cell lines. In a further embodiment, the MCF7 or T47D tumor cell lines transfected with GFP-ER-LBD-estrogen nucleic acid sensor molecule sensitive construct are used to form tumor xenografts in nude mice. Thus, the transfected tumor xenograft cell lines can be used to form tumors in mice which are not only estrogen dependent but also regulate reporter gene expression in ER-LBD-estrogen dependent manner. These cell lines and tumor models are used to discover inhibitors of ER-LBD-estrogen complex formation in vivo.
NHR ligand binding domains bind antagonists, forming additional conformational isomers. When antagonists are bound to the receptor a new conformer results such as that observed upon tamoxifen binding to the estrogen receptor to form a stable ER-LBD-tamoxifen complex (Shiau A K, Barstad D, Loria P M, Cheng L, Kushner P J, Agard D A, Greene G L. Cell. 1998 Dec 23;95(7):927–37). Accordingly, the invention includes use of an ER-LBD-tamoxifen specific nucleic acid sensor molecule that is used to detect the levels of antagonist specific complex in both in vitro biochemical, cell-based and, in in vivo assays as described above.
Nucleic acid sensor molecules can be developed that are specific for the ligand binding domains of all NHRs. In addition, it should be clear that nucleic acid sensor molecules for agonist, antagonist, dimeric or multimeric forms of NHR LBDs can be used to screen for inhibitors of LBD function and therefore for inhibitors of NHR dependent transcriptional activation or repression. It should be clear to one skilled in the art that nucleic acid sensor molecules specific for individual LBD complexes can be used to screen for agents that modify NHR function in in vitro and in in vivo assays.
NHRs are multidomain proteins containing a variable NH2-terminal region (A/B), a conserved DNA binding domain (DBD) or region (C), a linker region (D), and a conserved region (E) that contains the ligand binding domain (LBD). NHRs also contain regions required for transcriptional activation, of particular interest is the region AF-2 which is located in the COOH-terminus and whose function is strictly ligand dependent. Provided herein is a method for generating unique nucleic acid sensor molecules to each of the 63 known human NHR LBDs. In addition, methods are described that enable the generation of nucleic acid sensor molecules capable of recognizing the activated state of the NHR by selection for nucleic acid sensor molecules geometries which signal the presence of either the activated or inactivated conformation (NHR with bound ligand), but whose signaling action is quiescent in the presence of other forms of the NHR.
The nucleic acid sensor molecules allow the direct, simultaneous, and rapid detection of the activation states of all NHRs. This tool can be used in in vitro assays for receptor activation with agonists and antagonists, and can be used to generate cell lines and animal models that report on the activation state of such receptors in a biological setting and as a function of drug or drug lead.
GPCR Nucleic Acid Sensor Molecules
Also provided by the invention are nucleic acid sensor molecules for detection of conformational isoforms of G-protein coupled receptors.
G-protein coupled receptors (GPCRs) play fundamental roles in regulating the activity of virtually every cell. Upon binding of extracellular ligands, GPCRs interact with a specific subset of heterotrimeric G-proteins that can then, in their activated forms, inhibit or activate various effector enzymes and/or ion channels. Molecular cloning studies have identified multiple human GPCRs, and have identified the ligands for many of these.
GPCRs include three domains: an extracellular N-terminus, a central domain of seven trans-membrane helices connected by unstructured loops, and a cytoplasmic C-terminus. Activation of GPCRs is induced by ligand binding, which causes a conformational change in the receptor transmitting a signal across the plasma membrane to intracellular members of a signaling pathway. The methods described herein allow for generating unique nucleic acid sensor molecules to any GPCR. In addition, methods are described that enable the generation of nucleic acid sensor molecules capable of recognizing the activated state of the GPCR by selecting for nucleic acid sensor molecule geometries which signal the presence or absense of the activated conformation of the receptor through recognition of one or all of the mobile domains, but whose signaling action is quiescent in the presence of other forms of the GPCR. The biosensors described herein include nucleic acid sensor molecules such as allosetric ribozymes (AR), including those derived from the hammerhead, hairpin, LI ligase, or group 1 intron ribozymes and the like. Nucleic acid sensor molecules may also be derived from aptamer beacons or signaling aptamers which transduce molecular recognition into a detectible signal.
Upon the activation by an extracellular ligand or stimuli, G-protein coupled receptor(GPCR) polypeptides activate intracellular Gec-protein. A single GPCR can activate a number of Gα-proteins. For example, adrenergic receptors activate Gi, which inhibit adenylyl cyclases, Gs, which stimulate adenylyl cyclases, and Gq, which regulate cellular Calcium-ion level (Wenzel-Seifert and Seifert 2000). Thus, it is highly desirable to distinguish which class of Gα-proteins are activated through the GPCR of interest in cells.
The initial drug screening of the GPCRs is normally performed by competition assay with radiolabeled ligands. For a cell based GPCR assay, incorporation of radiolabeled GTP can be measured to detect the coupling of Gα-protein and GPCR, however this assay does not distinguish the type of Gα-proteins involved. The assays for the effect on individual effectors, such as the Ca++ flow or cellular cAMP level, are also commonly used, but only one downstream signal can be measured at a time using these assays.
Upon activation, a Gα-protein undergoes significant conformational change which results in release of GDP and association with GTP (Coleman and Sprang 1998). The Gα-protein also dissociates from its βγ-subunits. This activated form of Gα-protein then becomes capable of interacting with its effector (Li, Stemweis et al. 1998). The well-characterized conformation change takes place in three switches; switch I (residues 177–187 in Giα1), switch II (residues 199–219 in Giα1), and switch III (residues 231–242 in Giα1). The sequences and the conformational changes in these switches are well conserved among Gα-proteins.
Ras is a member of the small GTPase protein family, which shares significant similarity with other family members. GTP-bound ras and GDP-bound ras can be distinguished by the RBD (ras binding domain) of Raf-1 (Taylor, Resnick et al. 2001). The activated state of Raf-1 can be identified by RaIRDS (Franke, Akkerman et al. 1997). This indicates significant change in the surface of the protein, and the effector binding surface are only available for interaction in GTP complex form.
The invention provides methods for selecting nucleic acid sensor molecules which recognize the conformational change upon GTP binding and/or specifically interact with newly exposed G-protein effector binding sites upon the activation. Class-specific activated Gα-protein nucleic acid sensor molecules recognize the activated Gα-proteins or its effector binding site, which allow us to interpret the multiple type of downstream signal affect by the GPCR. It can used in both in vitro HTS (high throughput screening) and cell-based HTS.
Also described is a method for developing a direct mechanistic assay of the action of small molecule ligand-agonism, -antagonism, and partial antagonism of members of the GPCR family. The mechanistic assays function in both in vitro biochemical and in vitro cell-based settings. In the in vitro assay setting, the nucleic acid sensor molecules are designed to recognize one conformational isomer of the GPCR.
In one embodiment, the nucleic acid sensor molecule recognizes the unique conformation that exists for the activated state when in complex with ligand, e.g., such as that observed for the beta-2 adrenergic receptor when in complex with the artificial ligand isoproterenol (Ghanouni et al., PNAS USA, 98:5997–6002(2001)) and then produces a detectable signal, e.g., by release of a fluorescently labeled oligonucleotide, release of a radiolabeled oligonucleotide, or a change in conformation of the NASM driven by ligand binding through a change in fluorescence or the like. Hence, in this embodiment, the nucleic acid sensor molecule transduces molecular recognition of the beta-2 adrenergic receptor—in complex with epinephrine, norepinephrine or an artificial ligand such as isoproterenol into a detectible signal. The level of the signal is then used to quantify the amount of beta-2 adrenergic receptor-agonist complex present in solution.
In another embodiment, the beta-2 adrenergic-agonist nucleic acid sensor molecule is used as a screening tool in assays designed to detect agonists of the beta-2 adrenergic receptor. These screening tools can be used to determine the activation potency of compounds in in vitro biochemical assays or in in vitro cell-based assays. Agonists of the beta-2 receptor are useful in the treatment of asthma (Robinson, et al. Lancet 357:2007–2011(2001)). In another embodiment, nucleic acid sensor molecules are introduced into cell lines by known methods of electroporation, transfection, or coupling to peptide translocating agents such as tat or antennapedia peptides.
In another embodiment, the beta-2 adrenergic receptor-agonist complex specific nucleic acid sensor molecule is an allosteric intron imbedded in a reporter gene such as GFP or luciferase or the like. When the intron-derived reporter is inserted into the reporter gene it renders reporter gene expression effector dependent. Thus, in one embodiment functional GFP protein is expressed only when the beta-2 adrenergic receptor-agonist complex is present in the cell, and inhibitors of beta-2 adrenergic receptor-agonist complex formation block functional GFP protein expression in appropriate cells such as mammalian human peripheral blood leukocytes, yeast, insect, or bacterial cell lines.
In a further embodiment, Chinese hamster fibroblasts, which do not express beta-adrenergic receptors (Sheppard, et al., PNAS USA 80:233–236(1983)), are transfected with both the nucleic acid sensor molecule and the gene coding for the beta-adrenergic receptor under a constitutive promoter, and are used to create a model cell line suitable for HTS screening of candidate beta-2 agonists. Furthermore, cells can be caused to express known allelic variants, such as gln27-to-glu associated with obesity (Large, et al., J Clin. Invest 100:3005–3013), to create cells lines which model specific disease states. Furthermore, chimeric mice can be created by “knock-in” (Monroe et al., Immunity 11:201–212(1999)) which will express the nucleic acid sensor molecule in every cell as the result of blastocyst fusion (Chen et al., PNAS USA 90:4528–4532(1993)), and used for pharmokinetic or bioavailability studies in which the GPCR activation states of various tissues in the organism are of concern.
GPCRs bind antagonists, which cause the GPCRs to become resistant to conformational changes, or result in conformations not susceptible to activation, or blockade the ligand binding domain from interaction with the appropriate ligand and thus prevent activation of the GPCR, such as the beta-2 adrenergic receptor antagonist butoxamine (Horinouchi et al., Pharmacology 62:98–102(2001)). Hence, the invention also provides a method for using a nucleic acid sensor molecule to detect conformers which result from binding of GPCRs to antagonists. Furthermore, when the cell line described above is transfected with a mutant variants of GPCRs which spontaneously adopt the active conformation, such as lys272-to-ala (Pei, et al., PNAS USA 91:2699–2702(1994) and references therein) the nucleic acid sensor molecule can be employed in a screen for compounds which are beta-2 antagonists (Ramsay et al, Br J Pharmacol 133:315–323(2001)). Antagonists of the beta-2 receptor are useful in the treatment of cardiovascular diseases (Nagatomo, et al., Cardiovasc Drug Rev 19:9–24(2001)). The invention accordingly provides a method for using a Beta-2 adrenergic receptor—butoxamine complex-specific nucleic acid sensor molecule that is used to detect the levels of an antagonist specific complex in both in vitro biochemical, cell-based, and in vivo assays as described above.
Nucleic acid sensor molecules can also be developed that are specific for the occupancy state of the ligand-binding domains of all GPCRs. In addition, nucleic acid sensor molecules for the agonist, antagonist, dimeric, or multimeric forms of all GPCRs can be used to screen for inhibitors or activators of GPCR function and therefore for inhibitors or activators of GPCR-dependent cell signaling pathways. Nucleic acid sensor molecules specific for individual GPCR complexes can be additionally used to screen for agents that modify GPCRs in in vitro and in vivo assays.
Phosphodiesterase-specific Nucleic Acid Sensor Molecules
Multiple classes of phosphodiesterases (PDEs) have been identified in humans. These enzymes catalyze a reaction that converts second messenger cAMP and cGMP into 5′-AMP and 5′-GMP. Different class of PDEs have different substrate specificity as well as different physiological function. For example, PDE4s are specific for cAMP and PDE5 are specific for cGMP.
The invention provides multiple classes of PDE nucleic acid sensor molecules. The first class of nucleic acid sensor molecules can distinguish cAMP vs. 5′ AMP (cGMP vs 5′GMP) (Koizumi, Kerr et al. 1999) (Koizumi, Soukup et al. 1999). The second class of nucleic acid sensor molecule binds to the active site of PDE in a class specific manner and inhibits PDE catalytic activity. This class of nucleic acid sensor molecule can be raised using PDEs in the presence and absence of high affinity known inhibitors (e.g., Ropalim for PDE4). The third class of nucleic acid sensor molecule recognizes PDE in a class-specific (e.g., PDE1–11) or subclass-specific (PDE4A–D) manner.
Protein Kinase-specific Nucleic Acid Sensor Molecules
The invention also provides nucleic acid sensor molecules raised against protein kinases. In one embodiment, the invention provides nucleic acid sensor molecules that are modulated by the phosphorylation state in a given peptide sequence. Alternatively, native proteins can be used with different phosphorylation states in order to raise nucleic acid sensor molecules that can distinguish the different phosphorylation states. For example, ERK1/2 and phosphorylated ERK1/2 can be distinguished by specific nucleic acid sensor molecules (Seiwert, Stines Nahreini et al. 2000). The nucleic acid sensor molecule also can be a competitive inhibitor for a kinase by binding at ATP or substrate binding sites.
Alternatively, an ADP-dependent nucleic acid sensor molecule can be obtained at lower pH. These nucleic acid sensor molecules can be used to detect the production of ADP.
ii. Pathway Profiling Biosensors
As shown in FIG. 7 , physiological function is modulated by complex pathways, each of which may have multiple overlapping and intersecting steps. Furthermore, the proteins involved in these pathways are highly homologous and can have overlapping substrates and drug specificities. Using current techniques, it is possible only to monitor the response of single elements of a pathway. These techniques are inadequate to understand the mechanism of drug interactions. For example, a particular drug found to have a particular in vitro activity against a single target in biochemical assays might interact with other proteins in the same pathway, or in other unrelated pathways. Consequently, physiological function is often uncorrelated with the results of biochemical assays of a single target.
The nucleic acid sensor molecules according to the invention provide reagents to simultaneously quantify the level and chemical state of all components in a molecular pathway As used herein, “pathway target molecules” are target molecules involved in the same pathway and whose accumulation and/or activity is dependent on other pathway target molecules, or whose accumulation and/or activity affects the accumulation and/or activity of other pathway target molecules. Pathway target molecules according to the invention include, e.g., proteins, such as enzymes, modified forms of proteins, such as phosphorylated, sulfated, ribosylated proteins, methylated proteins (Arg, Asp; N, S or O directed), prenylated proteins (such as by farnesyl, geranylgeranyl, and other types of prenylation) acetylated or acylated proteins, cleaved or clipped proteins, bound or unbound forms of proteins, allelic variants of a protein (e.g., proteins differing from each other by single amino acid changes in a protein), as well as substrates, intermediates, and products of enzymes (including both protein and non-protein molecules).
In another embodiment, diagnostic pathway target molecules are identified by pre-selecting a plurality of nucleic acid sensor molecules activatable by pathway-specific target molecules. In one embodiment, a profiling biosensor is provided comprising at least one nucleic acid sensor molecule specific for every molecular species within a pathway (e.g., a signaling pathway), to generate a biosensor which can monitor the levels, chemical structure, and/or activity of every molecular species in the pathway.
Because of the finite number of target molecules (as determined from data obtained from the Human Genome Project) and the high throughput of the biosensors of the instant invention (greater than 10,000 target molecules can be monitored simultaneously), the profiling biosensors of the instant invention make it feasible to evaluate the response of all the components of a pathway to a drug compound simultaneously.
In one embodiment, a profiling biosensor reactive to the components of an entire pathway, is contacted with a sample from a patient having a disease, and ani optical signal corresponding to a disease state is determined to identify diagnostic pathway target molecules which are diagnostic of that disease. Samples from a plurality of patients are obtained and tested using the profiling biosensor to identify a pathway profile that is diagnostic of the disease, the pathway profile comprising normalized data relating to any or all of the level, structure, and activity, of the signature pathway molecules. A pathway profile corresponding to a wild type state is determined by testing the profiling biosensor molecules against samples from a population of healthy patients, or subsets of populations of healthy patients. In one embodiment, data relating to the optical signals generated by nucleic acid sensor molecules activated by the diagnostic pathway target molecules is stored within the memory of a computer or within a computer program product.
The pathway profiles can be used in diagnostic testing as discussed above. In one embodiment, a profiling biosensor is used in which the pathway is one which is known or suspected of being disrupted in patients having a particular trait (e.g., having a particular disease or genetic alteration(s)). For example, in one embodiment, one profiling biosensor used to evaluate samples from a patient with cardiovascular disease is a cholesterol metabolism pathway profiling biosensor. However, random combinations of profiling biosensors can be used to assess the physiological state of a patient, to identify diagnostic pathway profiles which are diagnostic of diseases whose molecular basis has not yet been identified or characterized.
In one embodiment, profiling biosensors according to the invention are used to assess the affect of a candidate drug on any or all of the level, chemical structure, or activity of diagnostic pathway target molecules to generate a drug treatment pathway profile. In this embodiment, a profiling biosensor is contacted with a sample from a cell or physiological system (e.g., a group of cells, a tissue system, an organ system, or a patient), and changes in optical signals are obtained which are correlated to any, or all of, the level, chemical structure, or activity of a particular pathway target molecule by relating the optical signal obtained to the address of the nucleic acid sensor molecule, as described above. In one embodiment, a drug treatment profile which is substantially similar to a diagnostic pathway profile obtained from a healthy population of patients (as determined by observing no significant differences in the profile by routine statistical testing, to within 95% confidence levels) is used to identify a candidate drug as one which is suitable for further testing. The profile produced by such a drug is used to produce an effective drug treatment profile, against which other candidate drugs can be compared.
In another embodiment, a candidate drug is tested against a plurality of profiling biosensors including the one which will generate a diagnostic signature profile, to identify drugs which produce an effective drug treatment profile without effecting significant changes in other pathway profiles. In this embodiment, the systemic effects of a candidate drug can be predicted.
In further embodiments, it is desirable to use a biosensor representing less than an entire pathway. In one embodiment, a biosensor is provided comprising nucleic acid sensor molecules diagnostic pathway target molecules. In a further embodiment, a biosensor is provided which comprises nucleic acid sensor molecules necessary to evaluate particular components of a pathway suspected of being involved in a disease. For example, compounds being screened to identify candidate drugs that affect diseases relating to defective DNA repair can be tested against a pathway biosensor comprising only S phase cell cycle target molecule reactive nucleic acid sensor molecule.
Exemplary pathway target molecules include various proteins and modified form thereof. Modifications include post-translational modifications such as phosphorylation, prenylation, glycosylation, methionine removal, N-acetylation, acylation, acylation of cysteines, myristoylation, alkylation, ubiquitinylation, prolyl-4-hydroxylation, carboxylation of glutaminyl residues, advanced glycoslylation (e.g., of hemoglobin), deamination of glutamine and asparagine, addition of glycophosphatidylinositol, disulfide bond formation, hydroxylation, and lipidation. Examples of such proteins include ERK and phosphorylated ERK, CDK and phosphorylated CDK, modified cyclin A, cyclin D, cyclin E, k-Ras, h-Ras, Rho A, MEK-1, MEKK-1, Raf-1, Raf-A, JNK, PKA, ATK, PTEN, p53, P16, and INK4. Other proteins include those listed in Table 1 as well as post-translationally modified forms thereof.
| TABLE 1 | |
| apoptotic pathways | Bcl, Bak, ICE proteases, Ich-1, CrmA, CPP32, APO-1/Fas, |
| DR3, FADD containing proteins, perform, p55 tumor | |
| necrosis factor (TNF) receptor, NAIP. TAP, TRADD- | |
| TRAF2 and TRADD-FADD, TNF, D4-GDI, NF-kB, | |
| CPP32/apopain, CD4O, IRF-i, p53, apoptin | |
| blood clotting pathways | thrombin, fibrinogen, factor V, Factor VIII-FVa, FVIIIa, |
| Factor XI, Factor Xia, Factors IX and X, thrombin receptor, | |
| thrombomodulin (TM), protein C (PC) to activated protein C | |
| (aPC). aPC, plasminogen activator inhibitor-i (PAT-i), tPA | |
| (tissue plasminogen activator) | |
| calcium signaling pathways | calmodulin, calcineurin, |
| Cell cycle | G0 | MPS, CYTOSTATIC FACTOR (CSF) (INCLUDING MOS) |
| Pathway | G1 | mid GI phase: cdk4/cycin D1–3 and cdk6/cyclin D1–3 |
| |
||
| others: p53, p21, p16, Rb, p2′1, E2F, Cdc25A, Cdc25B | ||
| S | cyclin A/CDK2, cyclin B/Cdc2, SPA-i, Cdc25A, Cdc25B | |
| G2 | G2/M transition phase: cdk1/ |
|
| Cdc25A, Cdc25B, Cdc25C. PIN!, Chki, Myt 1, Wee 1 | ||
| M | Cdc2/cyclin B, P1k, Cdc25C, |
| Cholesterol metabolism pathway | LDL, LDL-receptor, VLDL, HDL, cholesterol |
| acyltransferase, apoprotein E, Cholesteryl esters, ApoA-I and | |
| A-I1, HMGCoA reductase, cholesterol | |
| Flt-3 pathway | flt-3 pathway flt-3, GRP-2, SHP-2, SHIP, She |
| JAK/STATS signaling pathway | Jak1, Jak2, IL-2, IL-4 and IL-7, Jak3, Ptk-2, Tyk2, EPO, GH, |
| prolactin, IL-3, GM-CSF, G-CSF, IFN gamma, LW, OSM, | |
| IL-12 and IL-6, IFNR-alpha, IFNR-gamma, IL-2R beta, IL- | |
| 6R, CNTFR, Stat 1 alpha, Stat 1 beta, and Stats2–6 | |
| MAP kinase signaling pathways | flt-3, ras, raf, Grb2, Erk-i, Erk-2, and Src, Erb2, gpl3O, |
| MEK-1, MEK-2, hsp 90, JNK, p38, Sin!, Styi/Spcl, MKK's, | |
| MAPKAP kinase-2, JNK, SAPK | |
| P53 pathway | bax, bid, caspases, cytochrome c |
| PI 3 kinase pathway | SHIP, Akt |
| ras activation pathways | p120-Ras GAP, neurofibromin, Gapl, Ra!-GDS, Rsbs 1, 2, |
| and 4, Rinl, MEKK-1, and phosphatidylinositol-3-OH | |
| kinase (P13K), ras | |
| SIP signaling pathways | GRB2, SIP, ras, P1 3-kinase |
| SHC signaling pathways | trkA, trkb, NGF, BDNF, NT-4/5, trkC, fNT-3, Shc, PLC |
| gamma 1, P1–3 kinase, SNT, ras, rafi, MEK and MAP kinase | |
| TGF-13 signaling pathways | BMP, Smad 2, Smad4, activin, TGF |
| T-cell receptor complex | lck, fyn, CD4, CD8, T cell receptor proteins |
| MHC-I pathways | TAP proteins, LMP 2, LMP 7, gp 96, HSP 90, HSP 70 |
If desired, nucleic acid sensor molecules can be raised against particular amino acid sequences in the polypeptides. Some representative peptide regions are presented in Table 2.
| TABLE 2 | |||
| Sequence | Enzyme | ||
| L-R-A-S-L-G | (SEQ ID NO:52) | PKA | |
| A-A-K-I-Q-A-S-F-R-G-H-M-A-R-K-K | (SEQ ID NO:53) | PKC | |
| P-K-T-P-K-K-A-K-K-L | (SEQ ID NO:54) | cdc2 | |
| E-P-P-L-S-Q-E-A-F-A-D-L-W-K-K | (SEQ ID NO:55) | DNA-PK | |
| D-D-D-E-E-S-I-T-R-R | (SEQ ID NO:56) | CK-1 | |
| R-R-R-E-E-E-T-E-E-E | (SEQ ID NO:57) | CK-2 | |
| K-K-A-L-R-R-Q-E-T-V-D-A-L | (SEQ ID NO:58) | CaM KII | |
| S-T-K-V-P-Q-T-P-L-H-T-S-R-V | (SEQ ID NO:59) | P38 | |
| R-R-R-R-S-I-I-F-I | (SEQ ID NO:60) | PKA | |
| R-R-R-R-R-K-G-S-F-R-R-K-A | (SEQ ID NO:61) | PKCα | |
| R-K-L-K-R-K-G-S-F-R-R-K-A | (SEQ ID NO:62) | PKCβ I, II | |
| R-R-R-R-R-K-G-S-F-K-K-F-A | (SEQ ID NO:63) | PKCγ | |
| A-A-R-K-R-K-G-S-F-F-Y-G-G | (SEQ ID NO:64) | PKCδ | |
| Y-Y-X-K-R-K-M-S-F-F-E-F-D | (SEQ ID NO:65) | PKCε | |
| A-R-L-R-R-R-R-S-F-R-R-X-R | (SEQ ID NO:66) | PKCη | |
| R-R-F-K-R-Q-G-S-F-F-Y-F-F | (SEQ ID NO:67) | PKCζ | |
| A-A-L-V-R-Q-M-S-V-A-F-F-F | (SEQ ID NO:68) | PKCμ | |
| K-R-Q-Q-S-F-D-L-F | (SEQ ID NO:69 | CaM KII | |
| F-R-M-M-S-F-F-L-F | (SEQ ID NO:70) | Phosphorylase kinase | |
| R-R-F-G-S-L-R-R-F | (SEQ ID NO:71 | SLK1 | |
| R-R-R-H-S-R-R-R-R | (SEQ ID NO:72) | SRPK2 | |
| R-K-R-X-R-T-Y-S-F-G | (SEQ ID NO:73) | AKT/PKB | |
In one embodiment, a profiling biosensor array is generated comprising target activatable nucleic acid sensor molecules which are activatable by components of a cell cycle pathway. In this embodiment, a cell cycle biosensor is generated comprising nucleic acid nucleic acid sensor 10 molecules activatable by at least two members selected from the group consisting of: MPS, Cytostatic factor (CSF) (including Mos), cdk4, cyclins D1–3, cdk6, cdk2, cyclin E, p53, p21, p16, Rb, p27, E2F, cyclin A, cyclin B, cdkl, cyclin B1–3, Cdc2, SPA-1, and other biomolecules involved in cell cycle regulation.
In another embodiment, the cell cycle biosensor array generated is used to evaluate samples from patients suspected of having a disorder affecting cell proliferation (e.g., cancer) and a signature target molecule profile is determined which is diagnostic of this disorder. Changes in the signature target molecule profile upon treatment with a candidate compound are subsequently monitored by any or all of in vitro, ex vivo, and in vivo methods, as described above, to identify and/or validate lead compounds for use in cancer therapies.
In further embodiments, a cell cycle biosensor is provided comprising a plurality of locations, each location comprising a set of nucleic acid sensor molecules activatable by target molecules which identify a different portion of the cell cycle. Thus, in one embodiment, a cell cycle biosensor comprises at a first location, nucleic acid sensor molecules activatable by G0 specific target molecules (e.g., MPS, Cytostatic factor (CSF) (including Mos)), at a second location, nucleic acid sensor molecules activatable by G1 specific target molecules (cdk4, cyclin D1–3, cdk6, cdk2, cyclin E, p53, p21, p16, Rb, p27, E2F), at a third location, nucleic ac molecules which are activatable by S specific target molecules (e.g., cyclin A/CDK2, cyclin B/Cdc2, SPA-), at a fourth location, nucleic acid sensor molecules activatable by G2 specific target molecules-(e.g., cdk1, cyclin B 1–3, cyclin A), and at a fifth location, nucleic acid sensor molecules activatable by M specific target molecules (e.g., Cdc2, cyclin B). In this way the effects of diseases and/or drugs on specific phases of the cell cycle can be assessed.
Similarly, pathway specific biosensors can be generated for any of apoptotic pathways, blood clotting pathways, calcium regulation pathways, cholesterol metabolism pathways, the JAK/STATS signaling pathway, MAP kinase signaling pathways, p53 pathway, PI 3 kinase pathway, ras activation pathways, SIP signaling pathways, SHC signaling pathways, TGF-13 signaling pathways, T-cell receptor complex, and MHC-I pathways, using exemplary target molecules listed above, or other target molecule components of the respective pathways.
It should be apparent to those of ordinary skill in the art, that many other pathways exist whose components have been characterized and that target molecules within these pathways are also encompassed within the scope of the present invention (e.g., including, but not limited to, phosphatase pathways, transcription factor pathways, hormone dependent pathways, as well as intermediary metabolism pathways, and developmental pathways). Further, additional pathways can be identified using the nucleic acid based biosensor profiling techniques discussed above (e.g., identifying pathway molecules involved in the functioning of a wild type or diseased organ system, such as the cardiovascular system, central nervous system, digestive system, reproductive system, pulmonary system, skin system, and the like), and these also are encompassed within the scope of the invention.
Alternatively, or additionally, pathway specific molecules can be identified by other techniques known in the art (see, e.g., U.S. Pat. No. 6,087,4717, U.S. Pat. No. 6,054,558, U.S. Pat. No. 6,048,709, and U.S. Pat. No. 6,046, 165) and used to engineer additional pathway target activatable nucleic acid sensor molecules. Because there is a finite number of pathway target molecules in each pathway (constrained by the absolute number of gene products which have been identified) (see, e.g., Drews, Science 287: 1960–1964), it is feasible using the target activatable nucleic acid sensor molecules to generate biosensors representative of an entire pathway.
In further embodiments, sets of profiling biosensors are used to monitor the expression/activity of target molecules representing complex systems. Thus, for example, the effect of target molecules on the cardiovascular system and pulmonary system can be monitored simultaneously. In one embodiment, an array representative of a plurality of systems in the human body is used in methods to assess the effects of drug compounds on multiple systems in the body.
iii. Using Pathway Nucleic Acid Sensor Molecules in Drug Optimization
The profiling nucleic acid sensor molecules according to the invention can be used in every step of a drug optimization process, as shown in FIG. 8 , and are suitable reagents for use in conventional high throughput screening systems making them extremely adaptable for use alone, or in conjunction with, other drug development assays.
As discussed above, profiling nucleic acid sensor molecules can be used to identify signature target molecules which are correlatable to particular traits, such as disease. Signature target molecules are drug targets whose levels, structure, and/or activity can be used to evaluate the efficacy of compounds. A large number of signature drug targets, both characterized and uncharacterized, can be identified simultaneously using a single profiling biosensor according to one embodiment. In one embodiment, a profiling biosensor recognizes and is independently activated by about 1–5,000 molecules. In another embodiment, a profiling biosensor recognizes and is independently activated by about 500–10,000 molecules, and in another embodiment, by greater than 10,000 molecules.
In one embodiment, the drug targets identified in step 1 are evaluated in high throughput screening assays, using either solution-based biosensors or substrate-based biosensors, to characterize the biological activity of a drug target. For example, in one embodiment, nucleic acid sensor molecules are used to assess levels of substrate, product and intermediates produced by an enzyme in a wild type vs. a disease state, to identify other components of a pathway that would be affected by a drug acting on that target (i.e., secondary drug targets). In another embodiment, the levels, structure, and/or activity of all of the modified forms of a drug target, or the active and inactive forms of a drug target (e.g., a receptor) is determined in a wild type vs. a disease state, to further develop a diagnostic profile of a diagnostic pathway target molecule and to evaluate changes of that profile in the presence of a drug.
In a further embodiment, the same type of profiling biosensor used to identify a diagnostic profile is contacted with samples from patients exposed to a compound. A compound-treated sample which produces substantially similar levels, structure, and/or activity of target and secondary drug targets in a sample from a healthy patient is used to identify a compound as a candidate drug. Because this testing is done in a high throughput format, a single dose of a candidate drug is evaluated in any given test.
In one embodiment, the nucleic acid sensor molecules used in step 2, are tested in an in vitro biochemical assay to determine compound potency. In this embodiment, a preliminary dosing effect is determined to identify the IC50 of candidate drug. In one embodiment, multiple biosensors of the type used in step 2 are contacted with samples from patients exposed to different doses of the candidate drugs identified in step 2, to identify candidate drugs with the highest potency (e.g., requiring the least amount of drug to generate a wild type profile or an effective drug profile.
In one embodiment, nucleic acid sensor molecules are used in cellular assays where the effect of adding a compound on cell physiology is known and the researcher wants to determine that the drug is in fact acting through the drug target selected in steps 1–3. Here a candidate drug is added to a physiological system (e.g., cell(s), tissue(s), organ(s), or a patient). Cells from the physiological system are lysed and the substrate or product of an enzyme reaction is monitored using the nucleic acid sensor molecule either in an ELISA format or other solid support-based format (e.g., a profiling array) or a solution phase format. In another embodiment, cell lysates are contacted with a profiling biosensor specific for a target or pathway of interest to determine the profile of target molecules in the lysed sample. The profile is then compared to the wild type profile and the disease profile to determine if the drug is operating in vivo to restore a cell to its wild type state. Thus, the physiological effect of a candidate drug on a physiological system is correlated with the in vivo mechanism of action of the candidate drug.
In a preferred embodiment, pathway profiling arrays comprised of nucleic acid sensor molecules affixed to a solid support are used in cellular assays to determine the selectivity of a compound for one target in a pathway relative to other candidate targets in a signal transduction pathway(s) or in another biochemical pathway(s). This data can be used to validate a drug lead or drug target.
In one embodiment, nucleic acid sensor molecules are expressed in vivo or intracellularly using plasmids, viruses or other extra-chromosomal DNA vectors and the cellular nucleic acid sensor molecules are extracted and used to determine the activity of a drug or drug target. These cellular assays can also determine the selectivity of a compound for one target in a pathway relative to other candidate targets in a signal transduction pathway(s) or in another biochemical pathway(s). This data can be used to validate a drug lead or drug target.
In vivo Detection:
With (Amersham) SPA scintillant beads coupled to nucleic acid sensor molecules, one can look at cellular processes in situ in real time, by culturing cells directly onto a microtiter plate and allowing uptake of scintillant beads and radioisotope by cells. One can then monitor biosynthesis, proliferation, drug uptake, cell motility, etc. via luminescence generated by beads in the presence of selected target.
In one embodiment, drug-lead potency, specificity, and/or in vivo activity is optimized by an iterative repetition of any or all of steps 1–4. In one embodiment, steps 1–4 are repeated until the desired potency, selectivity and in vivo mechanism of action of a candidate drug is obtained. Potency can range from picomolar affinity to nanomolar affinity as measured by in vitro IC50 values. The desired selectivity of a drug candidate for its target can vary from 2 to a million-fold, and can be obtained by measuring the potency (IC50) of a drug lead toward the drug target, versus the drug's potency (IC50) values against other pertinent targets (target pertinence is determined by the requirements of the biological system under investigation). A drug lead is deemed optimal when the parameters of potency, selectivity and cellular action are optimized with respect to each other.
In another embodiment, known drug leads from Steps 1–4 are found to be specific for targets that were not known to the researcher in step 2. This is also termed target discovery and validation, and occurs when steps 1–4 are repeated in an iterative fashion of any or all steps and the drug target is identified by the profiling array to, in fact, exist in an alternative signal transduction pathway, or to be a novel protein or enzyme in the pathway originally under investigation. Thus, MPP arrays can identify the site of action of a drug lead, and can determine the relative selectivity of a drug for one drug target of a drug target pathway.
In this embodiment, target cells (e.g., tissue(s)) are removed from an animal model of the disease being targeted for treatment and lysed for testing. The lysate is contacted with nucleic acid sensor molecules either in a solid phase assay, a solution phase assay, or in a pathway profiling biosensor array format to assess the in vivo biological activity of a candidate drug identified by any of the previous steps or by some other method, on a target or pathway. Thus, in this embodiment, the physiological effect of a drug on a diseased or normal tissue is correlated with the in vivo mechanism of action of the drug.
In one embodiment, drug-lead potency, specificity, and/or in vivo activity are optimized by an iterative repetition of any or all of steps 1–6. In one embodiment, steps 1–5 are repeated until the desired potency, selectivity and in vivo mechanism of action of a candidate drug are obtained.
In one embodiment, the nucleic acid sensor molecules are used in pharmaco-kinetic studies, where the effect of a drug on the physiology of a cell, group of cells, tissue(s), organ(s), or animal model is assessed by obtaining blood, plasma, tissue, or a cell, and contacting this material with nucleic acid sensor molecules either in a solid phase (e.g., ELISA), solution or array format to assess the in vivo pharmacological or toxicological activity of a compound. In this embodiment, the nucleic acid sensor molecules used are developed against the candidate drug itself, its metabolic products, and/or the metabolic products of proteins and small ligands involved in a xenobiotic or toxicological response to drug treatment.
In one embodiment, nucleic acid sensor molecules are employed to follow the fate of a drug or its metabolic by-products. In this embodiment, nucleic acid sensor molecules are generated to the drug and its metabolites. The drug is administered to the test animal either subcutaneously, intraperitoneally or by gavage. Subsequent to administration, the blood plasma or disease tissue is removed and its contents are screened for the remaining drug by Liquid chromatography (LC) or LC-mass spectrometry. Drug exposure is then determined as a function of time, dose and method of administration and is reported in values of half-life, bioavailability, AUC and Cmax. Metabolic products of a drug lead can be similarly followed.
Nucleic acid sensor molecules generated against enzymes or proteins known to those skilled in the art to be involved in drug metabolism (P450 enzymes, multi-drug transporter) can be used to follow the effect of a drug on xenobiotic or toxicological response to drug treatment.
In one embodiment, drug-lead potency, specificity, and/or in vivo activity, and pharmacokinetic, or toxological properties are optimized by an iterative repetition repetition of any or all of steps 1–7. In one embodiment, steps 1–7 are repeated until the desired potency, selectivity and in vivo activity and pharmaco-kinetic, or toxicological properties of a candidate drug are obtained.
In one embodiment, nucleic acid sensor molecules are used in clinical trials to determine the fate of a drug in human or animal models, or used to follow the effect of drug treatment on a target or molecular pathway of choice, as described above. In one embodiment, the nucleic acid sensor molecules, in a solid phase assay (e.g., ELISA format), a solution phase assay, or in a pathway profiling biosensor array format, are used to assess the in vivo biological activity of a drug being tested using lysed cell samples as described above.
In another embodiment, the appropriate profiling biosensor is used in vivo, to monitor the effects of the compound on the patient, for example, by providing the biosensor in communication with a fiber optic probe inserted into the patient, or ex vivo, monitoring optical signals in a cell using a microscope based detection system. In another embodiment, an in vivo assay is done by introducing a nucleic acid sensor molecule which retains its catalytic activity into a physiological system (e.g., by injection at a target site in the body, through liposome carriers, and other means of administration routinely used in the art), obtaining cells from the physiological system and detecting the effect of the compound on the catalytic activity of the nucleic acid sensor molecule (e.g., by evaluating the sequence of the nucleic acid sensor molecule) as a means of determining the level, structure, or activity of a drug target, and relating the level, structure, or activity or the target molecules to the efficacy of the drug.
In one embodiment, any or all of steps 1–10 are repeated to further optimize the properties of the candidate drug.
In one embodiment, individuals who would be suitable for treatment with the candidate drugs identified steps 1–11, are identified using nucleic acid sensor molecules in the diagnostic assays discussed previously.
In one embodiment, nucleic acid sensor molecules are used in chemical genomic assays in which a drug or plurality of drug leads, with known or unknown physiological effects, and with unknown targets, are contacted with a physiological system and the site of action of the drug or plurality of drugs is determined using a plurality of the profiling biosensors described previously. Drug optimization then occurs as in steps 1–11.
5. Use of a Profilinz Biosensor in Target Molecule Separation
In addition to, or instead of, their use in detection methods, and drug discovery methods, the nucleic acid sensor molecules according to the invention can also be used to retrieve the target molecules which they specifically recognize. Additional embodiments exploiting the recognition capacity of the biosensors disclosed are contemplated and encompassed within the scope.
6. Reagents for Generating and Using Nucleic Acid Sensor Molecules
In one embodiment, reagents are provided for generating and using nucleic acid sensor molecules. In one embodiment, a kit is provided comprising standardized reagents for making and/or using the nucleic acid sensor molecules according to the invention. In one embodiment, the kit comprises at least a first optical nucleic acid sensor molecule whose optical properties change upon recognition of a target molecule. In another embodiment, the kit additionally comprises any of: a control target molecule, a second nucleic acid sensor molecule which recognizess a different target molecule, suitable buffers, printed instructions, and combinations thereof. In a further embodiment, a nucleic acid sensor molecule is provided with reagents for attaching a label and/or quencher or with reagents for attaching charge transfer molecules to the nucleic acid sensor molecule, which can sensitize the optical properties of the nucleic acid molecule to the presence of a target molecule.
In another embodiment, a composition is provided comprising a target molecule and a nucleic acid sensor molecule. The composition provides a reference against which to compare modified nucleic acid sensor molecules which recognizes to the same target, in order to select those with preferred cataytic activity or conformational change in the presence of the target. In a further embodiment, sets of complexes are provided. In still a further embodiment, a set of pathway target molecules and nucleic acid sensor molecules are provided. In another embodiment, a set of profiling target molecules and nucleic acid sensor molecules are provided. In still a further embodiment, solid supports are provided for isolation of target molecules from nucleic acid sensor molecules.
In yet another embodiment, a computer program product is provided comprising stored data relating to optical signals generated by profiling and or pathway target molecules. In another embodiment, a means to compare this data to other optical signals is provided. In a further embodiment, the memory comprises data relating to patient information or chemical structure information relating to either target molecules or nucleic acid sensor molecules.
The nucleic acid sensor molecules and biosensors according to the invention are amenable for use with high throughput screening systems and methods and the use of the nucleic acid sensor molecules and biosensors in these systems and methods is encompassed within the scope. In one embodiment, the system is a robotic workstation, comprising, at least one of an: arrayer, microplate or microarray feeders, stackers, washers, and dispensers, an optical system, a carousel, a conveyer for conveying microplates or microarrays from one part of the system to another (in a vertical or horizontal direction), a shaker system or other mixing system, a temperature control system, a synthesizer, a solid phase extraction system, and sample concentrators. Components of the robotic workstation can be part of a single integrated. system or can be provided separately for use at any stage of the drug optimization process according to the invention. In a further embodiment, the system comprises a processor connectable to the network which comprises or can access applications comprising stored data relating to profiling information obtained using nucleic acid sensor molecules according to the invention, and/or statistical applications, applications for performing structure/activity analysis of target molecules and nucleic acid sensor molecules, applications for performing nucleic acid sequence alignment and simultaneous structure superposition of proteins (e.g., MOE-Align'TM), applications for predicting binding conformations of molecules to receptor structures, and applications for controlling the processing functions of the robotic workstations.
The invention is further illustrated in the following non-limiting examples.
General Procedures
A. Generation nucleic acid sensor molecules from pools of ribozymes comprised of randomized linker and target modulation domains.
Direct selection of nucleic acid sensor molecules. Target modulated nucleic acid sensor molecules are isolated by in vitro selection. Pool of partially randomized ribozymes with 1015–1017 unique sequences serve as the starting point for in vitro selection. As with the engineering approach, both the L1 ligase and hammerhead ribozyme are used as platforms for the selection of allosterically-controlled molecules. Selections are designed to yield ribozymes that specifically respond to any target. Nucleic acid sensor molecules with cross-specificity (i.e. modulated by alternate target molecules, or by alternate ligand-bound states, or by alternate post-translationally modified forms of protein or peptides) are selected against by including the undesired form of the target in an initial negative selection step. The specific sequence of operations comprising the selection experiment is outlined in FIG. 1A and 1B for ligase and hammerhead-based selections, respectively
-
- 1. Pool preparation. The starting library of DNA sequences is generated by automated chemical synthesis on a DNA synthesizer. This library of sequences is transcribed in vitro into RNA using T7 RNA polymerase, purified, and captured onto beads using an oligonucleotide tag complementary to the 3′-end.
- 2. Negative selection incubation. In the absence of the desired modulator (target), the RNA library are incubated together with the undesired form of the modulator and an arbitrary sequence oligonucleotide substrate (substrate 1). (During this incubation, non-modulated ribozymes undergo ligation (
FIG. 1A ) or cleavage (FIG. 1B ). - 3. Positive selection incubation. The undesired form of the modulator and
oligonucleotide substrate 1 are removed by washing. The immobilized RNA pool is then incubated under identical conditions but now in the presence of the intended modulator and a second biotinylated oligonucleotide substrate (substrate 2), in the case of ligase selections (FIG. 1A ). - 4. Partitioning on the basis of activity (coupled to amplification). Ligases active only in the presence of the desired modulator are isolated using streptavidin capture and selective PCR amplification (relying on sequence differences between
substrates - 5. Purification. PCR amplified DNA are purified and transcribed to yield an enriched pool for subsequent reselection.
- 6. Iteratively repeat. Rounds of selection and amplification (
steps 2–5) are repeated until functional members sufficiently dominate the resultant library.
Once NASMs have been selected as described above, they are characterized as follows:
Nucleic acid sensor molecules which are derived from in vitro selection are tested as target modulated biosensors. The pool of NASMs is cloned into various plasmids that contain a T7 promoter transformed into E. coli. Individual NASM encoded DNA clones are isolated, linearized and the NASM is transcribed in vitro to generate NASM RNA. The NASM RNAs are then tested in target modulation assays which determine the rate or extent of ribozyme modulation. For hammerhead NASMs, the extent of target dependent and independent reaction is determined by quantifying the extent of endonucleolytic cleavage of an oligonucleotide substrate. The extent of reaction can be followed by electrophoresing the reaction products on a denaturing PAGE gel, and subsequently analyzed by standard radiometric methods. For Ligase NASMs, the extent of target dependent and independent reaction is determined by quantifying the extent of ligation of an oligonucleotide substrate, resulting in an increase in NASM molecular weight, as determined in denaturing PAGE gel electrophoresis.
Individual NASM clones which display high target dependent switch factor values, or high kact rate values are subsequently chosen for further modification and evaluation.
Hammerhead derived NASM clones are then further modified to render (the NASM sequences) them suitable for the optical detection applications that are described in detail below. In brief, these NASMs are used as fluorescent biosensors affixed to solid supports, as fluorescent biosensors in homogeneous FRET-based assays, and as biosensors in SPR applications.
Ligase derived NASM clones are further modified to render them suitable for a number of detection platforms and applications; including, but not limited to, the PCR and nucleotide amplification detection methods; fluorescent-based biosensors detectable in solution and chip formats; and as in vivo, intracellular detection biosensors.
The various detection applications of hammerhead ligase and intron-based NASMs are described in detail below.
B. Preparation of an array of immobilized effector oligonucleotides or NASMs
The following protocol describes a method for preparing an array of immobilized effector oligonucleotides with terminal amine groups attached to a solid substrate derivatized with aldehyde groups. The resulting array can then be used to spatially address (i.e., the sequence of nucleotides for each effector oligonucleotide can be synthesized as a cognate to the effector oligonucleotide binding domain of a nucleic acid sensor molecule specific for a particular target molecule) and immobilize the nucleic acid sensor molecules prior to their use in a solid-phase assay (see, e.g., Zammatteo et al., 2000):
Protocol for Attachment of Effector Oligonucleotides to Aldehyde Derivatized Substrate (www.arrayit.com):
-
- 1. Print discrete spots of solution containing effector oligonucleotides with amine-reactive terminal groups or linkers with terminal amine groups using microarraying pins, pipette, etc.
- 2. Allow spotted substrate to dry for 12 hrs. at room temperature and <30% relative humidity.
- 3. Rinse
substrate 2 times in dH2O with 0.2% SDS for 2 min. with vigorous agitation at room temperature. - 4. Rinse
substrate 1 time in dH2O for 2 min. with vigorous agitation at room temperature. - 5. Transfer substrate to boiling (100° C.)
dH 2 O for 3 min. to denature DNA. - 6. Dry substrate by centrifugation at 500×g for 1 min.
- 7. Treat substrate in 0.1 M NaBH4 in phosphate buffered saline (PBS, pH 7) for 5 min. with mild agitation at room temperature.
- 8. Rinse
substrate 2 times in dH2O with 0.2% SDS for 1 min. with vigorous agitation at room temperature. - 9. Rinse
substrate 1 time indH 20 for 2 min. with vigorous agitation at room temperature. - 10. Transfer substrate to boiling (100 degrees C)
dH 20 for 10 sec. to denature DNA. - 11. Dry substrate by centrifugation at 500×g for 1 min.
- 12. Store effector oligonucleotide-bound substrate at 4 ° C prior to hybridization.
The nucleic acid sensor molecules can be, e.g., those which possess either ligating or cleaving activity in the presence of a target molecule. (See, e.g., FIGS. 2A and B for the ligater, FIG. 5 for the cleaver).
In the case where it is desirable to immobilize an array of NASMs by direct attachment to a solid surface, the nucleic acid sensor molecules are bound to a solid substrate directly via their 3′ termini. The attachment is accomplished by oxidation (using, e.g., Na periodate) of the 3′ vicinal diol of the nucleic acid sensor molecule to an aldehyde group. This aldehyde group will react with a hydrazide group to form a hydrazone bond. The hydrazone bond is quite stable to hydrolysis, etc., but can be further reduced (for example, by treatment with NaBH4 or NaCNBH3). The use of adipic acid dihydrazide (ADH, a bifunctional linker) to derivatize an aldehyde surface results in a hydrazide-derivatized surface which provides a linker of approximately 10 atoms between the substrate surface and point of biomolecular attachment (see Ruhn et al., 1994; O'Shaughnessy, 1990; Roberston et al., 1972, Schluep et al., 1999; Chan et al., 1998). Preparation of a hydrazide-terminated surface via ADH treatment can be accomplished by treating an aldehyde-derivatized substrate according to the following protocol:
Protocol for ADH treatment of aldehyde substrate:
-
- 1. To 50 mL of 0.1 M phosphate buffer (pH 5) add 100-fold excess of adipic acid dihydrazide (ADH) relative to concentration of aldehyde groups on substrate surface.
- 2. Place substrate in a 50 mL tube containing the ADH in phosphate buffer and shake mixture for 2 hrs.
- 3. Remove the substrate and wash 4 times with 0.1 M phosphate buffer (pH 7).
- 4. Reduce free aldehyde groups on substrate surface by placing substrate in a 50 mL tube containing a 25-fold excess of NaBH4 or NaCNBH3 in 0.1 M phosphate buffer.
- 5. Shake the mixture for 90 min.
- 6.
Wash 4 times with 0.1 M phosphate buffer (pH 7). - 7. Store ADH-treated substrates in 0.1 M phosphate buffer (pH 7) at 4° C.
Preparation of the nucleic acid molecules for specific coupling to the ADH-terminated surface via their 3′ termini can be accomplished according to the following protocol (see, Proudnikov et al., 1996; Wu et al., 1996):
Protocol for Periodate oxidation of RNA:
-
- 1. Dissolve up to 20 micrograms of RNA in 5 microliters of H20 at 20° C.
- 2. Add 1 ML of 0.1 M NaIO4 (˜20-fold excess relative to RNA).
- 3. Incubate for 30 min. in a light-tight tube or enclosure.
- 4. Add 1 ML of 0.2 M Na sulphite (˜2-fold excess relative to NaIO4) to stop reaction.
- 5. Incubate for 30 min. at room temperature.
- 6. Ethanol precipitate or use spin-separation column to recover oxidized RNA.
Selection for a Nucleic Acid Sensor Molecule Selective for the Estrogen Receptor LBD
A nucleic acid sensor molecule which is modulated by the estrogen receptor (ER) ligand binding domain (LBD) is obtained by in vitro selection methods to identify candidate nucleic acid sensor molecules that are modulated by an estrogen receptor LBD.
The full length gene for the estrogen receptor is known. One source of the full-length estrogen receptor clone is Acc. No. M12674 (see also Greene et al., Science 231:1150–54, 1986). The clone includes a 2092 nucleotide mRNA with the sequence presented in Table 3 below:
| TABLE 3 | |||
| 1 | gaattccaaa attgtgatgt ttcttgtatt tttgatgaag gagaaatact gtaatgatca | (SEQ ID NO:9) | |
| 61 | ctgtttacac tatgtacact ttaggccagc cctttgtagc gttatacaaa ctgaaagcac | ||
| 121 | accggacccg caggctcccg gggcagggcc ggggccagag ctcgcgtgtc ggcgggacat | ||
| 181 | gcgctgcgtc gcctctaacc tcgggctgtg ctctttttcc aggtggcccg ccggtttctg | ||
| 241 | agccttctgc cctgcgggga cacggtctgc accctgcccg cggccacgga ccatgaccat | ||
| 301 | gaccctccac accaaagcat ctgggatggc cctactgcat cagatccaag ggaacgagct | ||
| 361 | ggagcccctg aaccgtccgc agctcaagat ccccctggag cggcccctgg gcgaggtgta | ||
| 421 | cctggacagc agcaagcccg ccgtgtacaa ctaccccgag ggcgccgcct acgagttcaa | ||
| 481 | cgccgcggcc gccgccaacg cgcaggtcta cggtcagacc ggcctcccct acggccccgg | ||
| 541 | gtctgagqct gcggcgttcg gctccaacgg cctggggggt ttccccccac tcaacagcgt | ||
| 601 | gtctccgagc ccgctgatgc tactgcaccc gccgccgcag ctgtcgcctt tcctgcagcc | ||
| 661 | ccacggccag caggtgccct actacctgga gaacgagccc agcggctaca cggtgcgcga | ||
| 721 | ggccggcccg ccggcattct acaggccaaa ttcagataat cgacgccagg gtggcagaga | ||
| 781 | aagattggcc agtaccaatg acaagggaag tatggctatg gaatctgcca aggagactog | ||
| 841 | ctactgtgca gtgtgcaatg actatgcttc aggctaccat tatggagtct ggtcctgtga | ||
| 901 | gggctgcaag gccttcttca agagaagtat tcaaggacat aacgactata tgtgtccagc | ||
| 961 | caccaaccag tgcaccattg ataaaaacag gaggaagagc tgccaggcct gccggctccg | ||
| 1021 | caaatgctac gaagtgggaa tgatgaaagg tgggatacga aaagaccgaa gaggagggag | ||
| 1081 | aatgttgaaa cacaagcgcc agagagatga tggggagggc aggggtgaag tggggtctgc | ||
| 1141 | tggagacatg agagctgcca acctttggcc aagcccgctc atgatcaaac gctctaagaa | ||
| 1201 | gaacagcctg gccttgtccc tgacggccga ccagatggtc agtgccttgt tggatgctga | ||
| 1261 | gccccccata ctctattccg agtatgatcc taccagaccc ttcagtgaag cttcgatgat | ||
| 1321 | gggcttactg accaacctgg cagacaggga gctggttcac atgatcaact gggcgaagag | ||
| 1381 | ggtgccaggc tttgtggatt tgaccctcca tgatcaggtc caccttctag aatgtgcctg | ||
| 1441 | gctagagatc ctgatgattg gtctcgtctg gcgctccatg gageacceag tgaagctact | ||
| 1501 | gtttgctcct aacttgctct tggacaggaa ccagggaaaa tgtgtagagg gcatggtgga | ||
| 1561 | gatcttcgac atgctgctgg ctacatcatc tcggttccgc atgatgaatc tgcagggaga | ||
| 1621 | ggagtttgtg tgcctcaaat ctattatttt gcttaattct ggagtgtaca catttctgtc | ||
| 1681 | cagcaccctg aagtctctgg aagagaagga ccatatccac cgagtcctgg acaagatcac | ||
| 1741 | agacactttg atccacctga tggccaaggc aggcctgacc ctgcagcagc agcaccagcg | ||
| 1801 | gctggcccag ctcctcctca tcctctccca catcaggcac atgagtaaca aaggcatgga | ||
| 1861 | gcatctgtac agcatgaagt gcaagaacgt ggtgcccctc tatgacctgc tgctggagat | ||
| 1921 | gctggacgcc caccgcctac atgcgcccac tagccgtgga ggggcatccg tggaggagac | ||
| 1981 | ggaccaaagc cacttggcca ctgcgggctc tacttcatcg cattccttgc aaaagtatta | ||
| 2041 | catcacgggg gaggcagagg gtttccctgc cacagtctga gagctccctg ga | ||
The polynucleotide encodes a polypeptide with the amino acid sequence presented in Table 4 below:
| TABLE 4 | ||
| MTMTLHTKASGMALLHQIQGNELEPLNRPQLKIPLERPLEGEVYLDSSKPAVYNYPEGAAYEFNAAAAANAQVYGQTG | (SEQ ID NO:10) | |
| LPYGPSGSEAAAFGSNGLGGFPPLNSVSPSPLMLLHPPPQLSPFLQPHGQQVPYYLENEPSGYTVREAGPPAFYRPNS | ||
| DNRRQGGRERLASTNDKGSMAMESAKETRYCAVDNDYASGYHYGVWSCEGCKAFFKRSIQGHNDYMCPATNQCTIDK | ||
| NRRKSCQACRLRKCYEVGMMKGGIRKDRRGGRMLKHKRQRDDGEGRGEVGSAGMRAANLWPSPLMIKRSKKNSLAL | ||
| SLTADQMVSALLDAEPPILYSEYDPTRPFSEASMMGLLTNLADRELVHMINWAKRVPGFVDLTLHDQVHLLECAWLE | ||
| ILMIGLVWRSMEHPVKLLFAPNLLLDRNQGKCVEGMVEIFDMLLATSSRFRMMNLQGEEFVCLKSIILLNSGVYTFL | ||
| SSTLKSLEEKDHIHRVLDKITDTLIHLMAKAGLTLQQQHQRLAQLLLILSHIRHMSNKGMEHLYSMKCKNVVPLYDL | ||
| LLEMLDAHRLHAPTSRGGASVEETDQSHLATAGSTSSHSLQKYYITGEAEGFPATV | ||
The gene encoding either full length ER or the ligand binding domain is cloned and expressed in BL21 (DE3)-pLysS E. coli cells [Shiau A K, Barstad D, Loria P M, Cheng L, Kushner P J, Agard D A, Greene G L. Cell. 1998 Dec. 23;95(7):927–37]. Human ER alpha LBD (residues 297–554) are purified from estradiol-sepharose column by published procedures [Shiau A K, Barstad D, Loria P M, Cheng L, Kushner P J, Agard D A, Greene G L. Cell. 1998 Dec. 23;95(7):927–37].
Selection of nucleic acid sensor molecules which are activated by ER-LBD not bound to ligand: A library of up to 1017 variants of in vitro synthesized (1 ,μM) nucleic acid sensor molecules is allowed to react with purified apo-ER-LBD at a final concentration of 1 uM. Selection of catalytic nucleic acid sensor molecules and optionally, generation of an optical NASM, is carried out by procedures outlined in prior examples and elsewhere herein.
Selection of Nucleic Acid Sensor Molecules which are Modulated by the ER-LBD-Estradiol Complex:
Stable complexes of ER-LBD and estradiol ligand are formed with from 1–10 equivalents of ligand. A library of up to 1017 variants of in vitro synthesized ribozymes is then allowed to react with purified ER-LBD-Estradiol at a final complex concentration of luM. Selection of allosterically activated ribozymes is carried out by procedures outlined the detailed description. Selection of nucleic acid sensor molecules which are modulated by the ER-LBD-Tamoxifen complex stable complexes of ER-LBD and tamoxifen ligand are formed with from 1–10 equivalents of ligand. A library of up to 1017 variants of in vitro synthesized ribozymes (1 μM containing a plurality of potential target modulation domains and linker domains coupled to the catalytic domain of the ribozyme, is then allowed to react with purified ER-LBD-Tamoxifen at a final complex concentration of 1uM. Selection of catalytic nucleic acid sensor molecules target modulated ribozymes (nucleic acid sensor molecules) is carried out by procedures outlined in prior examples.
Selection for a Library of Nucleic Acid Sensor Molecules which Signal the Presence of all Known Nuclear Hormone Receptor LBDs:
A wide variety of nuclear hormone receptor (“NHR”) ligand binding domains and their ligands, many of which are described in Table 5 below, are known for which a nucleic acid sensor molecule can be selected.
| TABLE 5 | ||
| Symbol | Description | Ligand |
| AIB3 | nuclear receptor coactivator RAP250; peroxisome | thyroid hormone |
| proliferator-activated receptor interacting protein; | ||
| thyroid hormone receptor binding protein | ||
| AR | androgen receptor (dihydrotestosterone receptor; | dihydroxytestosteron |
| testicular feminization; spinal and bulbar muscular | ||
| atrophy; Kennedy disease) | ||
| C1D | nuclear DNA-binding protein | |
| ESR1 | estrogen receptor 1 | estrogen |
| ESR2 | estrogen receptor 2 (ER beta) | estrogen |
| ESRRA | estrogen-related receptor alpha | estrogen and TFIIB |
| ESRRB | estrogen-related receptor beta | estrogen and TFIIB |
| ESRRG | estrogen-related receptor gamma | estrogen and TFIIB |
| HNF4A | hepatocyte nuclear factor 4, alpha | |
| HNF4G | hepatocyte nuclear factor 4, gamma | |
| similar to retinoid X receptor, alpha (H. sapiens) | ||
| similar to nuclear receptor subfamily 1, group D, | ||
| member 1 (H. sapiens) | ||
| NCOA1 | nuclear receptor coactivator 1 | Binds to steroid hormone |
| receptors | ||
| NCOR1 | nuclear receptor co-repressor 1 | Thyroid hormone receptor |
| without TH | ||
| NCOR2 | nuclear receptor co-repressor 2 | RXR without retinoic acid |
| and THR without TH | ||
| NR0B1 | nuclear receptor subfamily 0, group B, member 1 | |
| NR0B2 | nuclear receptor subfamily 0, group B, member 2 | |
| NR1D1 | nuclear receptor subfamily 1, group D, member 1 | |
| NR1H2 | nuclear receptor subfamily 1, group H, member 2 | |
| NR1H3 | nuclear receptor subfamily 1, group H, member 3 | Intertacts with RXR |
| NR1H4 | nuclear receptor subfamily 1, group H, member 4 | Bile acid, farnesol, or |
| chenodoxycholic acid | ||
| NR1I2 | nuclear receptor subfamily 1, group I, member 2 | pregnane |
| NR1I3 | nuclear receptor subfamily 1, group I, member 3 | androstane S |
| NR2C1 | nuclear receptor subfamily 2, group C, member 1 | |
| NR2C2 | nuclear receptor subfamily 2, group C, member 2 | |
| NR2E1 | nuclear receptor subfamily 2, group E, member 1 | |
| NR2E3 | nuclear receptor subfamily 2, group E, member 3 | |
| NR2F1 | nuclear receptor subfamily 2, group F, member 1 | |
| NR2F2 | nuclear receptor subfamily 2, group F, member 2 | |
| NR2F6 | nuclear receptor subfamily 2, group F, member 6 | Thyroid hormone |
| NR3C1 | nuclear receptor subfamily 3, group C, member 1 | glutocorticoid receptor, |
| cortisol, corticosterone | ||
| NR3C2 | nuclear receptor subfamily 3, group C, member 2 | Aldosterone |
| NR4A1 | nuclear receptor subfamily 4, group A, member 1 | |
| NR4A2 | nuclear receptor subfamily 4, group A, member 2 | |
| NR4A3 | nuclear receptor subfamily 4, group A, member 3 | |
| NR5A1 | nuclear receptor subfamily 5, group A, member 1 | |
| NR5A2 | nuclear receptor subfamily 5, group A, member 2 | |
| NR6A1 | nuclear receptor subfamily 6, group A, member 1 | |
| PAX8 | paired box gene 8 | |
| PGR | progesterone receptor | progesterone |
| PPARA | peroxisome proliferative activated receptor, alpha | nafenopin, clofibrate, |
| WY14643 | ||
| PPARBP | PPAR binding protein | binds to PPAR gamma |
| PPARD | peroxisome proliferative activated receptor, delta | WY1463 |
| PPARG | peroxisome proliferative activated receptor, gamma | 9-HODE, 13-HODE |
| PTHR1 | parathyroid hormone receptor 1 | parathyroid hormone |
| RARA | retinoic acid receptor, alpha | retinoic acid |
| RARB | retinoic acid receptor, beta | retinoic acid |
| RARG | retinoic acid receptor, gamma | retinoic acid |
| RORA | RAR-related orphan receptor A | |
| RORB | RAR-related orphan receptor B | |
| RORC | RAR-related orphan receptor C | |
| RXRA | retinoid X receptor, alpha | 9-cis retonoic acid, |
| complexes with activated | ||
| VDR and THR | ||
| RXRB | retinoid X receptor, beta | 9-cis retonoic acid, |
| complexes with activated | ||
| VDR and THR | ||
| RXRG | retinoid X receptor, gamma | 9-cis retonoic acid, |
| complexes with activated | ||
| VDR and THR | ||
| SMAP | thyroid hormone receptor coactivating protein | activated THR |
| THRA | thyroid hormone receptor, alpha (avian | thyroid hormone |
| erythroblastic leukemia viral (v-erb-a) oncogene | ||
| homolog) | ||
| THRB | thyroid hormone receptor, beta (avian erythroblastic | thyroid hormone |
| leukemia viral (v-erb-a) oncogene homolog 2) | ||
| TNRC11 | trinucleotide repeat containing 11 (THR-associated | activated THR |
| protein, 230 kDa subunit) | ||
| TRAP150 | thyroid hormone receptor-associated protein, 150 kDa | activated THR |
| subunit | ||
| TRAP240 | thyroid hormone receptor-associated protein, 240 kDa | activated THR |
| subunit | ||
| TRAP95 | thyroid hormone receptor-associated protein, 95-kD | activated THR |
| subunit | ||
| TRIP13 | thyroid hormone receptor interactor 13 | inactive THR |
| VDR | vitamin D (1,25-dihydroxyvitamin D3) receptor | vitamin D |
N-terminally GST-tagged or N-/C-terminally His-tagged nuclear hormone receptor ligand binding domains, defined on the basis of structural homology are cloned and expressed in BL21 (DE3)-pLysS E. coli cells, or are cloned and expressed in standard baculovirus expression systems.
Human NHR LBDs (homologous to ER-alpha residues including the region aa 297–554) are purified from GSH-sepharose or nickel affinity columns by published procedures available from the manufacturers. LBDs are produced in a either a parallel or serial fashion and the purified proteins are stored in buffer containing 50 mM TrisHCl, 1 mM EDTA, 1 mM DTT and 50–250 NaCl/SCN salt, pH 7 to pH 8.5, 10% glycerol or other stabilizing agent. Protein sequence and MW is verified by electrospray LC-MS mass spectrometry.
1. Selection of nucleic acid sensor molecules which are modulated by NHR-LBD not bound to ligand: A library of up to 1017 variants of in vitro synthesized ribozymes (1 μM) containing a plurality of potential target modulation domains and linker domains coupled to the catalytic domain of the ribozyme, is allowed to react with purified apo-NHR-LBDs at a final concentration of 1 uM LBD. Selection of catalytic nucleic acid sensor molecules is carried out by procedures outlined in the Detailed Description. Selections are carried out in parallel fashion. Selections can also be carried out in mixed pools of anywhere from 5–10 NHR-LBDs. In the final rounds of nucleic acid sensor molecule selection, the RNA pools may separated into aliquots which may then be used to carry out in vitro selection against single NHR-LBD proteins to yield unique nucleic acid sensor molecules selective for multiple NHR-LBDs.
2. Selection of nucleic acid sensor molecules which are activated by ligand bound forms of NHR-LBDs.
Stable complexes of each NHR-LBD are formed with from 1 –10 equivalents of ligand. A library of up to 1017 variants of in vitro synthesized ribozymes (1 μM) containing a plurality of potential target modulation domainsland linker domains coupled to the catalytic domain of the ribozyme is then allowed to react with purified NHR-LBD-Ligand complexes at a final complex concentration of 1uM. Selection of catalytic nucleic acid sensor molecules is carried out by procedures outlined in the Detailed Description and Example 1 below. Selections are carried out in parallel fashion. Selections can also be carried out in mixed pools of anywhere from 5–10 NHR-LBD-Ligand complexes. In the final rounds of nucleic acid sensor molecule selection, the RNA pools may separated into aliquots which may then be used to carry out in vitro selection against single NHR-LBD-Ligand complexes to yield unique nucleic acid sensor molecules selective for all NHR-LBDs, bound to their ligands.
Thus, the invention provides an in vitro selection protocol against purified LBDs, bound to their ligands or not, for each known NHR. In vitro selections can be carried out with less than 1 mg of the purified forms of the LBDs. In addition the selection of nucleic acid sensor molecules can be done in vitro with mixed pools of LBD and subsequently deconvoluted after selection is complete. Alternatively, the final selection can be carried out with fractionally purified extracts containing a slight excess of recombinant LBD. In one embodiment the LBD is expressed in E. coli, or insect cell lines or mammalian cell lines. In another embodiment, the selection is carried out in cell free lysates in which the LBD is expressed in an in vitro transcription-translation procedure such as is described in the literature or can be purchased using common reagents from Roche or Promega. In another embodiment, the fractionated or purified LBDs are combined with known ligands, (as described above) agonist, antagonists or partial agonist/antagonists to form stable complexes, and these complexes are then used for in vitro selection of nucleic acid sensor molecules. Upon interaction of the nucleic acid sensor molecule with the NHR-LBD, a signal will be generated detectable to an external monitoring device. In this manner, the activation state of any or all NHRs can be monitored in vivo or in vitro as will be described in detail in subsequent examples.
Selection for a Nucleic Acid Sensor Molecule Selective for the Beta-2 Adrenergic Receptor.
The full-length gene for the Beta-2 adrenergic receptor is described (Emorine et al., Proc.
Natl. Acad. Sci. USA 84:6995–99, 1987) and is available at Acc. No. AAA88017. The nucleic acid sequence is set forth in Table 6 below:
| TABLE 6 | ||
| GCACCGCGAGCCCCTAGCACCCGACAAGCTGAGTGTGCAGGACGAGTCCCCACCACACCC | (SEQ ID NO:11) | |
| ACACCACAGCCGCTGAATGAGGCTTCCAGGCGTCCGCTCGCGGCCCGCAGAGCCCCGCCG | ||
| TGGGTCCGCCCGCTGAGGCGCCCCCAGCCAGTGCGCTTACCTGCCAGACTGCGCGCCATG | ||
| GGGCAACCCGGGAACGGCAGCGCCTTCTTGCTGGCACCCAATGGAAGCCATGCGCCGGAC | ||
| CACGACGTCACGCAGGAAAGGGACGAGGTGTGGGTGGTGGGCATGGGCATCGTCATGTCT | ||
| CTCATCGTCCTGGCCATCGTGTTTGGCAATGTGCTGGTCATCACAGCCATTGCCAAGTTC | ||
| GAGCGTCTGCAGACGGTCACCAACTACTTCATCACTTCACTGGCCTGTGCTGATCTGGTC | ||
| ATGGGCCTGGCAGTGGTGCCCTTTGGGGCCGCCCATATTCTTATGAAAATGTGGACTTTT | ||
| GGCAACTTCTGGTGCGAGTTTTGGACTTCCATTGATGTGCTGTGCGTCACGGCCAGCATT | ||
| GAGACCCTGTGCGTGATCGCAGTGGATCGCTACTTTGCCATTACTTCACCTTTCAAGTAC | ||
| CAGAGCCTGCTGACCAAGAATAAGGCCCGGGTGATCATTCTGATGGTGTGGATTGTGTCA | ||
| GGCCTTACCTCCTTCTTGCCCATTCAGATGCACTGGTACCGGGCCACCCACCAGGAAGCC | ||
| ATCAACTGCTATGCCAATGAGACCTGCTGTGACTTCTTCACGAACCAAGCCTATGCCATT | ||
| GCCTCTTCCATCGTGTCCTTCTACGTTCCCCTGGTGATCATGGTCTTCGTCTACTCCAGG | ||
| GTCTTTCAGGAGGCCAAAAGGCAGCTCCAGAAGATTGACAAATCTGAGGGCCGCTTCCAT | ||
| GTCCAGAACCTTAGCCAGGTGGAGCAGGATGGGCGGACGGGGCATGGACTCCGCAGATCT | ||
| TCCAAGTTCTGCTTGAAGGAGCACAAAGCCCTCAAGACGTTAGGCATCATCATGGGCACT | ||
| TTCACCCTCTGCTGGCTGCCCTTCTTCATCGTTAACATTGTGCATGTGATCCAGGATAAC | ||
| CTCATCCGTAAGGAAGTTTACATCCTCCTAAATTGGATAGGCTATGTCAATTCTGGTTTC | ||
| AATCCCCTTATCTACTGCCGGAGCCCAGATTTCAGGATTGCCTTCCAGGAGCTTCTGTGC | ||
| CTGCGCAGGTCTTCTTTGAAGGCCTATGGGAATGGCTACTCCAGCAACGGCAACACAGGG | ||
| GAGCAGAGTGGATATCACGTGGAACAGGAGAAAGAAAATAAACTGCTGTGTGAAGACCTC | ||
| CCAGGCACGGAAGACTTTGTGGGCCATCAAGGTACTGTGCCTAGCGATAACATTGATTCA | ||
| CAAGGGAGGAATTGTAGTACAAATGACTCACTGCTGTAAAGCAGTTTTTCTACTTTTAAA | ||
| GACCCCCCCCCCCCCAACAGAACACTAAACAGACTATTTAACTTGAGGGTAATAAACTTA | ||
| GAATAAAATTGTAAAAATTGTATAGAGATATGCAGAAGGAAGGGCATCCTTCTGCCTTTT | ||
| TTATTTTTTTAAGCTGTAAAAAGAGAGAAAACTTATTTGAGTGATTATTTGTTATTTGTA | ||
| CAGTTCAGTTCCTCTTTGCATGGAATTTGTAAGTTTATGTCTAAAGAGCTTTAGTCCTAG | ||
| AGGACCTGAGTCTGCTATATTTTCATGACTTTTCCATGTATCTACCTCACTATTCAAGTA | ||
| TTAGGGGTAATATATTGCTGGTAATTTGTATCTGAAGGAGATTTTCCTTCCTACACCCTT | ||
| GGACTTGAGGATTTTGAGTATCTCGGACCTTTCAGCTGTGAACATGGACTCTTCCCCCAC | ||
| TCCTCTTATTTGCTCACACGGGGTATTTTAGGCAGGGATTTGAGGAGCAGCTTCAGTTGT | ||
| TTTCCCGAGCAAAGGTCTAAAGTTTACAGTAAATAAAATGTTTGACCATG | ||
The amino acid sequence of the polypeptide encoded by the nucleic acid sequence is set forth in Table 7 below:
| TABLE 7 | |||
| 1 | mgqpgngsaf llapngshap dhdvtqqrde vwvvgmgivm slivlaivfg nvlvitaiak | (SEQ ID NO:12) | |
| 61 | ferlqtvtny fitslacadl vmglavvpfg aahilmkmwt fgntwcefwt sidvlcvtas | ||
| 121 | ietlcviavd ryfaitspfk yqslltknka rviilmvwiv sgltsflpiq mhwyrathqe | ||
| 181 | aincyanetc cdfftnqaya iassivsfyv plvimvfvys rvfqeakrql qkidksegrf | ||
| 241 | hvqnlsqveq dgrtghglrr sskfclkehk alktlgiimg tftlcwlpff ivnivhviqd | ||
| 301 | nlirkevyil lnwigyvnsg fnpliycrsp dtriatqell clrrsslkay gngyssngnt | ||
| 361 | geqsgyhveq ekenkliced lpgtedfvgh qgtvpsdnid sqgrncstnd sil | ||
The gene encoding either the full-length Beta-2 adrenergic receptor or cytoplasmic loop II or III or helix VII is cloned, expressed and purified from E. coli or baculovirus infected cells (Hampe, et al., J Biotechnol 77:219–234 (2000)) according to published procedures, and incorporated into detergent micelles to simulate the cellular milieu (Min, et al., J Biol Chem 268:9400–9404 (1993)). A library of up to 1017 variants of in vitro synthesized ribozymes (1 μM) containing a plurality of potential target modulation domains and linker domains coupled to the catalytic domain of the ribozyme is allowed to react with purified Beta-2 adrenergic receptor at a final concentration of 1 uM. Selection of catalytic nucleic acid sensor molecules is carried out by procedures outlined in Example 1.
Selection of nucleic acid sensor molecules which are activated by the butoxamine- Beta-2 adrenergic complex. 1:1 complexes of butoxamine and purified Beta-2 adrenergic receptor are formed and selection of catalytic nucleic acid sensor molecules is carried out by procedures outlined in Example 1.
Selection of nucleic acid sensor molecules which are activated by the isoproterenol- Beta-2 adrenergic complex is accomplished as follows. 1:1 complexes of isoproterenol and purified Beta-2 adrenergic receptor are formed and selection of catalytic nucleic acid sensor molecules is carried out by procedures outlined in Example 1 and the Detailed Description.
Selection for a Library of Nucleic Acid Sensor Molecules which Signal the Presence of all Known GPCRs
The full-length gene sequences for over 400 G-protein coupled receptors (“GPCR”) is known. GPCR polypeptides, peptides and peptide fragments are also know as set forth in Table 8 and Table 9 below. The entire gene, or peptides derived from these sequences, is N-terminally tagged or N-/C- terminally His-tagged and cloned, expressed, and purified, or synthesized by chemical means. All 400 plus GPCRs are produced in either a serial or parallel fashion and the purified proteins or peptides stored in buffer containing 50 mM Tris-HCl, 1 mM EDTA, 1 mM DTT, and 50–250 mM NaCl/SCN salt, pH 7 to pH 8.5, 10% glycerol or other stabilizing agent.
| TABLE 8 | |
| ref|NP_006134.1| | G protein-coupled receptor 19 [Homo sapiens] |
| ref|XP_049562.1| | G protein-coupled receptor 19 [Homo sapiens] |
| ref|NP_004876.1| | neuropeptide G protein-coupled receptor; n . . . |
| ref|XP_011102.1| | 46228 [Homo sapiens] >gi|14723215|ref|XP_0 . . . |
| ref|NP_057624.1| | G protein-coupled receptor 72; reserved; G . . . |
| ref|XP_011520.3| | orexin receptor 2 [Homo sapiens] |
| ref|NP_001517.1| | orexin receptor 2 [Homo sapiens] |
| ref|NP_001471.1| | |
| ref|NP_071429.1| | |
| ref|XP_005747.4| | tachykinin receptor 2 [Homo sapiens] |
| ref|NP_001048.1| | |
| ref|NP_000901.1| | neuropeptide Y receptor Y2 [Homo sapiens] . . . |
| ref|NP_003848.1| | galanin receptor 2 [Homo sapiens] >gi|1365 . . . |
| ref|XP_004030.2| | adrenergic, beta-2-, receptor, surface [Ho . . . |
| ref|NP_000015.1| | adrenergic, beta-2-, receptor, surface [Ho . . . |
| ref|XP_001777.1| | orexin receptor 1 [Homo sapiens] |
| ref|XP_011871.3| | |
| ref|NP_001516.1| | orexin receptor 1 [Homo sapiens] |
| ref|NP_001041.1| | somatostatin receptor 2 [Homo sapiens] >gi . . . |
| ref|NP_001040.1| | somatostatin receptor 1 [Homo sapiens] >gi . . . |
| ref|NP_001044.1| | somatostatin receptor 5 [Homo sapiens] |
| ref|XP_012565.1| | somatostatin receptor 5 [Homo sapiens] |
| ref|NP_115940.1| | G protein-coupled receptor; G protein-coup . . . |
| ref|XP_037563.1| | G protein-coupled receptor [Homo sapiens] |
| ref|NP_001050.1| | |
| ref|XP_011942.1| | prolactin-releasing hormone receptor [Homo . . . |
| ref|XP_017624.1| | G protein-coupled receptor 58 [Homo sapiens] |
| ref|NP_004239.1| | prolactin-releasing hormone receptor [Homo . . . |
| ref|NP_071640.1| | histamine receptor H2; |
| ref|NP_055441.1| | G protein-coupled receptor 58 [Homo sapiens] |
| ref|XP_009594.2| | somatostatin receptor 4 [Homo sapiens] |
| ref|NP_003605.1| | |
| ref|NP_001049.1| | |
| ref|XP_039747.1| | opioid receptor, mu 1 [Homo sapiens] >gi|1 . . . |
| ref|NP_000905.1| | opioid receptor, mu 1 [Homo sapiens] |
| ref|XP_004341.2| | 53355 [Homo sapiens] |
| ref|XP_052174.1| | 50635 [Homo sapiens] |
| ref|XP_052175.1| | 5-hydroxytryptamine (serotonin) |
| ref|XP_052165.1| | 5-hydroxytryptamine (serotonin) |
| ref|XP_052164.1| | 50636 [Homo sapiens] >gi|14732317|ref|XP_0 . . . |
| ref|NP_000861.1| | 5-hydroxytryptamine (serotonin) |
| ref|NP_001043.1| | somatostatin receptor 4 [Homo sapiens] |
| ref|NP_000721.1| | cholecystokinin A receptor [Homo sapiens] . . . |
| ref|NP_006670.1| | putative opioid receptor, neuromedin K (ne . . . |
| ref|NP_055442.1| | G protein-coupled receptor 57 [Homo sapiens] |
| ref|NP_000698.1| | arginine vasopressin receptor 1B; arginine . . . |
| ref|NP_001718.1| | bombesin-like receptor 3 [Homo sapiens] >g . . . |
| ref|XP_040306.1| | similar to SOMATOSTATIN RECEPTOR |
| TYPE 2 (S . . . | |
| ref|NP_056542.1| | |
| ref|NP_001042.1| | somatostatin receptor 3 [Homo sapiens] >gi . . . |
| ref|NP_000722.1| | cholecystokinin B receptor [Homo sapiens] |
| ref|NP_000789.1| | dopamine receptor D5; Dopamine receptor D1 . . . |
| ref|NP_000612.1| | 5-hydroxytryptamine (serotonin) |
| ref|NP_004215.1| | G protein-coupled receptor 50 [Homo sapiens] |
| ref|XP_010228.2| | G protein-coupled receptor 50 [Homo sapiens] |
| ref|NP_000907.1| | oxytocin receptor [Homo sapiens] |
| ref|XP_052179.1| | oxytocin receptor [Homo sapiens] >gi|14725 . . . |
| ref|NP_005192.1| | chemokine (C-C motif) |
| ref|NP_000670.1| | adrenergic, alpha-1B-, receptor; adrenergi . . . |
| ref|XP_046588.1| | G protein-coupled receptor slt [Homo sapie . . . |
| ref|NP_000671.1| | adrenergic, alpha-1A-, receptor; adrenergi . . . |
| ref|NP_110411.1| | brain expressed G-protein-coupled receptor . . . |
| ref|XP_003199.2| | growth hormone secretagogue receptor [Homo . . . |
| ref|XP_017623.1| | G protein-coupled receptor 57 [Homo sapiens] |
| ref|NP_005949.1| | melatonin receptor 1A; melatonin receptor . . . |
| ref|NP_115892.1| | G protein-coupled receptor slt; melanin-co . . . |
| ref|NP_000903.1| | opioid receptor, |
| ref|NP_000900.1| | neuropeptide Y receptor Y1; Neuropeptide Y . . . |
| ref|XP_011716.2| | similar to opioid receptor, |
| ref|XP_011707.2| | adrenergic, alpha-1A-, receptor [Homo sapi . . . |
| ref|XP_048085.1| | adrenergic, alpha-1A-, receptor [Homo sapi . . . |
| ref|XP_048084.1| | adrenergic, alpha-1A-, receptor [Homo sapi . . . |
| ref|NP_000785.1| | dopamine receptor D1 [Homo sapiens] |
| ref|XP_048082.1| | adrenergic, alpha-1A-, receptor [Homo sapi . . . |
| ref|NP_003292.1| | thyrotropin-releasing hormone receptor [Ho . . . |
| ref|NP_005305.1| | gastrin-releasing peptide receptor [Homo s . . . |
| ref|XP_006335.4| | dopamine receptor D2 [Homo sapiens] |
| ref|XP_006334.3| | dopamine receptor D2longer [Homo sapiens] |
| ref|NP_000786.1| | dopamine receptor D2 [Homo sapiens] >gi|14 . . . |
| ref|XP_036647.1| | dopamine receptor D2 [Homo sapiens] >gi|14 . . . |
| ref|XP_041422.1| | similar to dopamine receptor D2 (H. sapien . . . |
| ref|NP_057658.1| | dopamine receptor D2longer [Homo sapiens] . . . |
| ref|NP_000697.1| | arginine vasopressin receptor 1A; V1a vaso . . . |
| ref|NP_002502.1| | neuromedin B receptor [Homo sapiens] |
| ref|XP_018475.1| | neuromedin B receptor [Homo sapiens] |
| ref|NP_062874.1| | 5- |
| ref|NP_000730.1| | cholinergic receptor, muscarinic 2; muscar . . . |
| ref|NP_062873.1| | 5- |
| ref|NP_000863.1| | 5- |
| ref|NP_000667.1| | adenosine A2b receptor [Homo sapiens] >gi| . . . |
| ref|NP_000675.1| | beta-1-adrenergic receptor [Homo sapiens] |
| ref|NP_005963.1| | pancreatic polypeptide receptor 1 [Homo sa . . . |
| ref|NP_000732.1| | cholinergic receptor, muscarinic 4; muscar . . . |
| ref|XP_039923.1| | 44527 [Homo sapiens] |
| ref|NP_000787.1| | dopamine receptor D3 [Homo sapiens] |
| ref|XP_011027.3| | dopamine receptor D3 [Homo sapiens] |
| ref|NP_061822.1| | G protein-coupled receptor 14 [Homo sapiens] |
| ref|NP_000731.1| | cholinergic receptor, muscarinic 3; muscar . . . |
| ref|NP_000669.1| | adrenergic, alpha-1D-, receptor; adrenergi . . . |
| ref|NP_005282.1| | G protein-coupled receptor 17 [Homo sapien . . . |
| ref|XP_048332.1| | similar to purinergic receptor (family A g . . . |
| ref|XP_041897.1| | similar to G protein-coupled receptor 17 ( . . . |
| ref|NP_005152.1| | angiotensin receptor-like 1 [Homo sapiens] . . . |
| ref|NP_000016.1| | adrenergic, beta-3-, receptor [Homo sapien . . . |
| ref|NP_001286.1| | chemokine (C-C motif) |
| ref|NP_000902.1| | opioid receptor, delta 1 [Homo sapiens] |
| ref|NP_005758.1| | purinergic receptor (family A group 5) [Ho . . . |
| ref|XP_006296.1| | cholinergic receptor, muscarinic 4 [Homo s . . . |
| ref|XP_006058.1| | similar to MUSCARINIC ACETYLCHOLINE |
| RECEPT . . . | |
| ref|NP_000729.1| | cholinergic receptor, muscarinic 1; muscar . . . |
| ref|NP_000904.1| | opiate receptor-like 1; opiod receptor-lik . . . |
| ref|NP_006630.1| | cysteinyl leukotriene receptor 1 [Homo sap . . . |
| ref|NP_001828.1| | chemokine (C-C motif) receptor 3 [Homo sap . . . |
| ref|NP_000530.1| | rhodopsin; rhodopsin (retinitis pigmentosa . . . |
| ref|NP_009154.1| | putative G protein coupled receptor [Homo . . . |
| ref|XP_009882.2| | adenosine A2a receptor [Homo sapiens] |
| ref|XP_045486.1| | adrenergic, alpha-1D-, receptor [Homo sapi . . . |
| ref|NP_000397.1| | gonadotropin-releasing hormone receptor; g . . . |
| ref|NP_000666.2| | adenosine A2a receptor; adenosine A2 recep . . . |
| ref|XP_002299.1| | G protein-coupled receptor 45 [Homo sapiens] |
| ref|NP_003958.1| | putative neurotransmitter receptor [Homo s . . . |
| ref|NP_000854.1| | 5-hydroxytryptamine (serotonin) |
| ref|XP_001811.2| | opioid receptor, delta 1 [Homo sapiens] >g . . . |
| ref|NP_005950.1| | melatonin receptor 1B; melatonin receptor . . . |
| ref|NP_001548.1| | |
| ref|NP_064552.1| | neuromedin U receptor 2 [Homo sapiens] |
| ref|NP_009158.1| | G protein-coupled receptor 45 [Homo sapiens] |
| ref|NP_000625.1| | |
| ref|XP_017622.1| | putative neurotransmitter receptor [Homo s . . . |
| ref|NP_036257.1| | cholinergic receptor, muscarinic 5; muscar . . . |
| ref|NP_000743.1| | leukotriene b4 receptor (chemokine recepto . . . |
| ref|NP_000788.1| | dopamine receptor D4 [Homo sapiens] |
| ref|XP_006145.2| | dopamine receptor D4 [Homo sapiens] |
| ref|XP_001543.1| | G protein-coupled receptor 52 [Homo sapiens] |
| ref|XP_009663.1| | G protein-coupled receptor 8 [Homo sapiens] |
| ref|XP_007212.1| | purinergic receptor (family A group 5) [Ho . . . |
| ref|NP_006165.1| | neuropeptide Y receptor Y5 [Homo sapiens] |
| ref|NP_002522.1| | neurotensin receptor 1 [Homo sapiens] |
| ref|XP_003692.2| | 5-hydroxytryptamine (serotonin) |
| ref|XP_009612.2| | neurotensin receptor 1 [Homo sapiens] |
| ref|NP_005277.1| | G protein-coupled receptor 8 [Homo sapiens] |
| ref|NP_000515.1| | 5-hydroxytryptamine (serotonin) |
| ref|NP_001707.1| | |
| ref|NP_005675.1| | G protein-coupled receptor 52 [Homo sapiens] |
| ref|NP_000852.1| | histamine receptor H1; histamine receptor, . . . |
| ref|NP_000639.1| | chemokine (C-C motif) |
| ref|NP_116743.1| | |
| ref|NP_006574.1| | retinal pigment epithelium-derived rhodops . . . |
| ref|NP_031395.1| | G-protein coupled receptor [Homo sapiens] . . . |
| ref|XP_009373.1| | formyl peptide receptor-like 2 [Homo sapie . . . |
| ref|NP_076917.1| | 5-hydroxytryptamine (serotonin) |
| ref|XP_005280.2| | G protein-coupled receptor 7 [Homo sapiens] |
| ref|XP_039818.1| | G protein-coupled receptor 91 [Homo sapien . . . |
| ref|NP_006164.1| | neuropeptide Y receptor Y6 (pseudogene) [H . . . |
| ref|XP_012748.2| | galanin receptor 1 [Homo sapiens] >gi|1476 . . . |
| ref|NP_000862.1| | 5-hydroxytryptamine (serotonin) |
| ref|NP_005281.1| | G protein-coupled receptor 15 [Homo sapien . . . |
| ref|XP_010406.1| | angiotensin receptor 2 [Homo sapiens] >gi| . . . |
| ref|NP_001328.1| | chemokine (C-X3-C) |
| ref|NP_002554.1| | purinergic receptor P2Y, G-protein coupled . . . |
| ref|NP_004942.1| | EBV-induced G protein-coupled |
| ref|NP_000672.1| | adrenergic, alpha-2A-, receptor [Homo sapi . . . |
| ref|XP_005827.3| | beta-1-adrenergic receptor [Homo sapiens] |
| ref|NP_005288.1| | G protein-coupled receptor 24 [Homo sapien . . . |
| ref|NP_002021.2| | formyl peptide receptor-like 2 [Homo sapie . . . |
| ref|NP_005276.1| | G protein-coupled receptor 7 [Homo sapiens] |
| ref|XP_010009.2| | similar to somatostatin receptor-like prot . . . |
| ref|NP_003458.1| | chemokine (C-X-C motif), receptor 4 (fusin . . . |
| ref|NP_000673.1| | adrenergic, alpha-2B-, receptor [Homo sapi . . . |
| ref|XP_051229.1| | similar to C-X-C |
| TYPE | |
| 4 . . . | |
| ref|NP_001453.1| | formyl peptide receptor-like 1; lipoxin A4 . . . |
| ref|NP_006047.1| | G protein-coupled receptor 66 [Homo sapien . . . |
| ref|NP_000856.1| | 5-hydroxytryptamine (serotonin) |
| ref|XP_048737.1| | 41064 [Homo sapiens] |
| ref|NP_005499.1| | chemokine (C-C motif) |
| ref|NP_000638.1| | chemokine (C-C motif) |
| ref|XP_009664.1| | opiate receptor-like 1 [Homo sapiens] >gi| . . . |
| ref|NP_005285.1| | G protein-coupled receptor 21 [Homo sapien . . . |
| ref|XP_009561.2| | 34426 [Homo sapiens] |
| ref|NP_004063.1| | chemokine-like receptor 1 [Homo sapiens] > . . . |
| ref|XP_035769.1| | chemokine-like receptor 1 [Homo sapiens] |
| ref|NP_000855.1| | 5-hydroxytryptamine (serotonin) |
| ref|NP_000045.1| | arginine vasopressin receptor 2 [Homo sapi . . . |
| ref|NP_064445.1| | opsin 1 (cone pigments), long-wave-sensiti . . . |
| ref|XP_048964.1| | similar to PROBABLE G PROTEIN-COUPLED |
| RECE . . . | |
| ref|NP_000665.1| | adenosine A1 receptor [Homo sapiens] >gi|1 . . . |
| ref|XP_011880.1| | similar to pancreatic polypeptide receptor . . . |
| ref|NP_000676.1| | |
| ref|NP_000674.1| | adrenergic, alpha-2C-, receptor [Homo sapi . . . |
| ref|XP_002705.3| | G protein-coupled receptor 17 [Homo sapiens] |
| ref|NP_000677.1| | angiotensin receptor 2 [Homo sapiens] |
| ref|XP_004279.1| | chemokine (C-C motif) receptor 6 [Homo sap . . . |
| ref|NP_000504.1| | opsin 1 (cone pigments), medium-wave-sensi . . . |
| ref|XP_033840.1| | similar to chemokine (C-C motif) receptor . . . |
| ref|NP_002555.1| | purinergic receptor P2Y, G-protein coupled . . . |
| ref|XP_006367.1| | purinergic receptor P2Y, G-protein coupled . . . |
| ref|NP_004358.1| | chemokine (C-C motif) |
| ref|XP_045851.1| | opsin 1 (cone pigments), short-wave-sensit . . . |
| ref|NP_057641.1| | orphan seven-transmembrane receptor, chemo . . . |
| ref|XP_003251.1| | chemokine (C-C motif) receptor 9 [Homo sap . . . |
| ref|NP_001699.1| | opsin 1 (cone pigments), short-wave-sensit . . . |
| ref|XP_002838.5| | similar to C-C |
| TYPE | |
| 11 . . . | |
| ref|NP_000570.1| | chemokine (C-C motif) |
| ref|NP_006632.2| | chemokine (C-C motif) |
| ref|NP_000859.1| | 5-hydroxytryptamine (serotonin) |
| ref|NP_115942.1| | putative purinergic receptor [Homo sapiens . . . |
| ref|NP_001497.1| | G protein-coupled receptor 32 [Homo sapien . . . |
| ref|NP_061843.1| | G protein-coupled |
| ref|NP_006555.1| | G protein-coupled receptor [Homo sapiens] . . . |
| ref|NP_065110.1| | cysteinyl leukotriene CysLT2 receptor; cDN . . . |
| ref|NP_004113.1| | growth hormone secretagogue receptor [Homo . . . |
| ref|NP_055137.1| | opsin 3 (encephalopsin) [Homo sapiens] |
| ref|XP_001515.3| | opsin 3 (encephalopsin) [Homo sapiens] >gi . . . |
| ref|NP_005274.1| | G protein-coupled receptor 5 [Homo sapiens . . . |
| ref|NP_061842.1| | super conserved receptor expressed in brai . . . |
| ref|NP_005291.1| | G protein-coupled receptor 34 [Homo sapien . . . |
| ref|NP_037477.1| | G protein-coupled receptor [Homo sapiens] . . . |
| ref|XP_003126.1| | chemokine binding protein 2 [Homo sapiens] . . . |
| ref|XP_007392.1| | G protein-coupled receptor 65 [Homo sapiens] |
| ref|NP_005284.1| | G protein-coupled receptor 20 [Homo sapiens] |
| ref|NP_005287.1| | G protein-coupled receptor 23 [Homo sapien . . . |
| ref|NP_009195.1| | adrenomedullin receptor; G-protein-coupled . . . |
| ref|NP_003941.1| | coagulation factor II (thrombin) receptor- . . . |
| ref|NP_000701.1| | bradykinin receptor B1 [Homo sapiens] |
| ref|NP_000857.1| | 5-hydroxytryptamine (serotonin) |
| ref|NP_057652.1| | G-protein coupled receptor SALPR; somatost . . . |
| ref|XP_012745.1| | histamine H4 receptor [Homo sapiens] >gi|1 . . . |
| ref|NP_000858.1| | 5-hydroxytryptamine (serotonin) |
| ref|NP_003599.1| | G protein-coupled receptor 65; T-cell deat . . . |
| ref|NP_001499.1| | G protein-coupled receptor 39 [Homo sapien . . . |
| ref|XP_007275.2| | bradykinin receptor B1 [Homo sapiens] |
| ref|XP_006230.3| | G protein-coupled receptor 72 [Homo sapien . . . |
| ref|XP_037208.1| | histamine receptor H3 [Homo sapiens] |
| ref|XP_010168.2| | arginine vasopressin receptor 2 [Homo sapi . . . |
| ref|NP_009163.1| | histamine receptor H3; G protein-coupled r . . . |
| ref|XP_037209.1| | 34432 [Homo sapiens] >gi|14786758|ref|XP_0 . . . |
| ref|NP_005273.1| | G protein-coupled receptor 4 [Homo sapiens . . . |
| ref|NP_000668.1| | adenosine A3 receptor [Homo sapiens] >gi|1 . . . |
| ref|XP_001499.1| | endothelial differentiation, sphingolipid . . . |
| ref|NP_114142.1| | G protein-coupled receptor 61 [Homo sapiens] |
| ref|NP_002020.1| | formyl peptide receptor 1 [Homo sapiens] > . . . |
| ref|XP_007108.2| | endothelin receptor type B, isoform 1 [Hom . . . |
| ref|NP_000106.1| | endothelin receptor type B, isoform 1 [Hom . . . |
| ref|NP_003982.1| | endothelin receptor type B isoform 2 [Homo . . . |
| ref|XP_007276.2| | bradykinin receptor B2 [Homo sapiens] >gi| . . . |
| ref|NP_000614.1| | bradykinin receptor B2 [Homo sapiens] >gi| . . . |
| ref|XP_001907.1| | G protein-coupled receptor 25 [Homo sapiens] |
| ref|XP_051522.1| | G protein-coupled receptor [Homo sapiens] |
| ref|NP_003476.1| | G protein-coupled receptor 68; Ovarian can . . . |
| ref|NP_001498.1| | G protein-coupled receptor 38 [Homo sapien . . . |
| ref|NP_073625.1| | platelet ADP receptor [Homo sapiens] >gi|1 . . . |
| ref|NP_039226.1| | olfactory receptor, |
| ref|XP_040869.1| | similar to cannabinoid receptor 1 (brain) . . . |
| ref|NP_004145.1| | pyrimidinergic receptor P2Y, G-protein cou . . . |
| ref|NP_057167.1| | central cannabinoid receptor, isoform a; C . . . |
| ref|NP_062813.1| | seven transmembrane receptor BLTR2; leukot . . . |
| ref|NP_149046.1| | olfactory receptor, |
| ref|NP_000943.1| | platelet-activating factor receptor [Homo . . . |
| ref|XP_008010.2| | similar to MELANOCYTE STIMULATING |
| HORMONE . . . | |
| ref|NP_063950.1| | olfactory receptor, |
| ref|NP_001831.1| | central cannabinoid receptor, isoform a; C . . . |
| ref|XP_003761.3| | 48895 [Homo sapiens] >gi|14724697|ref|XP_0 . . . |
| ref|NP_002377.2| | |
| ref|XP_032638.1| | neuromedin U receptor 2 [Homo sapiens] |
| ref|NP_005270.1| | G protein-coupled receptor 1 [Homo sapiens] |
| ref|NP_005293.1| | G protein-coupled receptor 37 (endothelin . . . |
| ref|NP_004092.1| | coagulation factor II (thrombin) receptor- . . . |
| ref|NP_005289.1| | G protein-coupled receptor 25 [Homo sapiens] |
| ref|NP_001727.1| | complement |
| ref|XP_002667.1| | 41743 [Homo sapiens] |
| ref|XP_008392.1| | CC chemokine receptor 10 [Homo sapiens] >g . . . |
| ref|NP_001496.1| | G protein-coupled |
| ref|NP_057686.1| | CC chemokine receptor 10 [Homo sapiens] |
| ref|NP_001829.1| | chemokine (C-C motif) |
| ref|XP_016412.1| | 28082 [Homo sapiens] >gi|14721034|ref|XP_0 . . . |
| ref|NP_006009.1| | putative chemokine receptor; GTP-binding p . . . |
| ref|NP_000136.1| | follicle stimulating hormone receptor; ova . . . |
| ref|NP_002541.1| | olfactory receptor, |
| ref|XP_002212.2| | follicle stimulating hormone receptor [Hom . . . |
| ref|NP_004769.1| | G protein-coupled |
| ref|XP_015921.1| | similar to putative chemokine receptor; GT . . . |
| ref|XP_015923.1| | putative chemokine receptor; GTP-binding p . . . |
| ref|NP_055380.1| | olfactory receptor, |
| ref|NP_065133.1| | putative G protein-coupled receptor 92 [Ho . . . |
| ref|XP_008716.1| | |
| ref|NP_039225.1| | olfactory receptor, |
| ref|NP_002556.1| | pyrimidinergic receptor P2Y, G-protein cou . . . |
| ref|NP_005903.1| | |
| ref|NP_005297.1| | G protein-coupled receptor 43 [Homo sapien . . . |
| ref|XP_012667.1| | olfactory receptor, |
| ref|NP_112221.1| | olfactory receptor, |
| ref|NP_039227.1| | olfactory receptor, |
| ref|NP_059976.1| | olfactory receptor, |
| ref|NP_005279.1| | G protein-coupled receptor 12 [Homo sapien . . . |
| ref|NP_001948.1| | endothelin receptor type A [Homo sapiens] |
| ref|NP_005904.1| | |
| ref|NP_110401.1| | prostate specific G-protein coupled recept . . . |
| ref|NP_004758.1| | endothelin type b receptor- |
| ref|NP_003544.1| | olfactory receptor, |
| ref|NP_000520.1| | |
| ref|NP_036492.1| | olfactory receptor, |
| ref|NP_002557.1| | purinergic receptor P2Y, G-protein coupled . . . |
| ref|XP_030219.1| | gonadotropin-releasing hormone receptor [H . . . |
| ref|XP_009029.4| | purinergic receptor P2Y, G-protein coupled . . . |
| ref|NP_036284.1| | endothelial |
| ref|NP_039228.1| | olfactory receptor, |
| ref|NP_036484.1| | olfactory receptor, |
| ref|XP_012668.1| | olfactory receptor, |
| ref|NP_001983.1| | coagulation factor II receptor precursor; . . . |
| ref|NP_036501.1| | olfactory receptor, |
| ref|NP_055694.1| | putative G-protein-coupled receptor; G pro . . . |
| ref|XP_004852.1| | olfactory receptor, |
| ref|NP_000949.1| | prostaglandin E receptor 4 (subtype EP4) [ . . . |
| ref|NP_072093.1| | putative leukocyte platelet-activating fac . . . |
| ref|NP_110503.1| | olfactory receptor, |
| ref|XP_003907.1| | coagulation factor II receptor precursor [ . . . |
| ref|XP_004216.1| | similar to olfactory receptor 89 (H. sapie . . . |
| ref|NP_112167.1| | olfactory receptor, |
| ref|NP_002542.1| | olfactory receptor, |
| ref|NP_036505.1| | olfactory receptor, |
| ref|NP_005292.1| | G protein-coupled receptor 35 [Homo sapiens] |
| ref|NP_004045.1| | complement |
| ref|NP_005290.1| | G protein-coupled receptor 31 [Homo sapiens] |
| ref|NP_005233.2| | coagulation factor II (thrombin) receptor- . . . |
| ref|NP_003546.1| | olfactory receptor, |
| ref|XP_003671.3| | coagulation factor II (thrombin) receptor- . . . |
| ref|NP_112163.1| | olfactory receptor, |
| ref|NP_039229.1| | olfactory receptor, |
| ref|NP_002539.1| | olfactory receptor, |
| ref|XP_037263.1| | similar to coagulation factor II (thrombin . . . |
| ref|NP_067647.1| | leucine-rich repeat-containing G protein-c . . . |
| ref|NP_065103.1| | inflammation-related G protein-coupled rec . . . |
| ref|NP_055314.1| | putative purinergic receptor [Homo sapiens . . . |
| ref|NP_036509.1| | olfactory receptor, |
| ref|NP_036507.1| | olfactory receptor, family 52, subfamily A . . . |
| ref|XP_035507.1| | similar to NONE_RETURNED (H. sapiens) |
| [Hom . . . | |
| ref|XP_004280.1| | G protein-coupled receptor 31 [Homo sapiens] |
| ref|NP_003545.1| | olfactory receptor, |
| ref|XP_036497.1| | olfactory receptor, |
| ref|NP_061844.1| | super conserved receptor expressed in brai . . . |
| ref|NP_063941.1| | |
| ref|NP_009091.1| | olfactory receptor, |
| ref|XP_008678.2| | olfactory receptor, |
| ref|NP_003543.1| | olfactory receptor, |
| ref|XP_011731.3| | similar to adrenergic, beta-3-, receptor ( . . . |
| ref|XP_009545.1| | |
| ref|NP_076403.1| | G protein-coupled receptor 86 [Homo sapiens] |
| ref|XP_042200.1| | G protein-coupled receptor 86 [Homo sapiens] |
| ref|NP_004711.2| | endothelial differentiation, lysophosphati . . . |
| ref|NP_037440.1| | platelet activating receptor homolog [Homo . . . |
| ref|NP_005217.1| | endothelial differentiation, sphingolipid . . . |
| ref|NP_005295.1| | G protein-coupled receptor 41 [Homo sapien . . . |
| ref|NP_005296.1| | G protein-coupled receptor 42 [Homo sapiens] |
| ref|NP_115943.1| | putative chemokine receptor [Homo sapiens] . . . |
| ref|NP_055381.1| | olfactory receptor, |
| ref|XP_042826.1| | luteinizing hormone/choriogonadotropin rec . . . |
| ref|XP_010797.3| | luteinizing hormone/choriogonadotropin rec . . . |
| ref|NP_000224.1| | luteinizing hormone/choriogonadotropin rec . . . |
| TABLE 9 | |
| >G(S)-1 | |
| mgclgnskte dqrneekaqr eankkiekql qkdkqvyrat hrllllgage sgkstivkqm | (SEQ ID NO:13) | |
| rilhvngfng eggeedpqaa rsnsdgekat kvqdiknnlk eaietivaam snlvppvela | ||
| npenqfrvdy ilsvmnvpdf dfppefyeha kalwedegvr acyersneyq lidcaqyfld | ||
| kidvikqady vpsdqdllrc rvltsgifet kfqvdkvnfh mfdvggqrde rrkwiqcfnd | ||
| vtaiifvvas ssynmvired nqtnrlqeal nltksiwnnr wlrtisvilf lnkqdllaek | ||
| vlagkskied yfpefarytt pedatpepge dprvtrakyf irdefirist asgdgrhycy | ||
| phftcavdte nirrvfndcr diiqrmhlrq yell. | ||
| >G(S)-2 | ||
| mgclgnskte dqrneekaqr eankkiekql qkdkqvyrat hrllllgage sgkstivkqm | (SEQ ID NO:14) | |
| rilhvngfng eggeedpqaa rsnsdgseka tkvqdiknnl keaietivaa msnlvppvel | ||
| anpenqfrvd yiisvmnvpd fdfppefyeh akalwedegv racyersney qlidcaqyfl | ||
| dkidvikqad yvpsdqdllr crvltsgife tkfqvdkvnf hmfdvggqrd errkwiqcfn | ||
| dvtaiifvva sssynmvire dnqtnriqea lnlfksiwnn rwlrtisvil flnkqdilae | ||
| kviagkskie dyfpefaryt tpedatpepg edprvtraky firdeflris tasgdgrhyc | ||
| yphftcavdt enirrvfndc rdiiqrmhlr qyell. | ||
| >G(S)-3 | ||
| mgclgnskte dqrneekaqr eankkiekqi qkdkqvyrat hrllllgage sgkstivkqm | (SEQ ID NO:15) | |
| rilhvngfng dekatkvqdi knnikeaiet ivaamsnlvp pveianpenq frvdyilsvm | ||
| nvpdfdfppe fyehakalwe degvracyer sneyqiidca qyflakidvi kqadyvpsdq | ||
| dllrcrvlts gifetkfqvd kvnfhmfdvg gqrderrkwi qcfndvtaii fvvasssynm | ||
| virednqtnr iqeainifks iwnnrwlrti svilflnkqd llaekviagk skiedyfpef | ||
| aryttpedat pepgedprvt rakyfirdef lristasgdg rhycyphftc avdtenirrv | ||
| fndcrdiiqr mhirqyell. | ||
| >G(S)-4 | ||
| mgclgnskte dqrneekaqr eankkiekql qkdkqvyrat hrlillgage sgkstivkqm | (SEQ ID NO:16) | |
| rilhvngfng dsekatkvqd iknnlkeaie tivaamsnlv ppveianpen qfrvdyilsv | ||
| mnvpdfdfpp efyehakalw edegvracye rsneyqlidc aqyfidkidv ikqadyvpsd | ||
| qdllrcrvit sgifetkfqv dkvnfhmfdv ggqrderrkw iqcfndvtai ifvvasssyn | ||
| mvirednqtn riqealnifk siwnnrwlrt isvilflnkq dliaekvlag kskiedyfpe | ||
| faryttpeda tpepgedprv trakyfirde firistasgd grhycyphft cavdtenirr | ||
| vfndcrdiiq rmhirqyeli. | ||
| >G(s)-xl | ||
| meisgppfei gsapagvddt pvnmdsppia ldgppikvsg apdkreraer ppveeeaaem | (SEQ ID NO:17) | |
| egaadaaegg kvpspgygsp aagaasadta araapaapad pdsgatpedp dsgtapadpd | ||
| sgafaadpds gaapaapadp dsgaapdapa dpdsgaapda padpdagaap eapaapaaae | ||
| traahvapaa pdagaptapa asatraaqvr raasaapasg arrkihlrpp speiqaadpp | ||
| tprptrasaw rgksessrgr rvyydegvas sdddssgdes ddgtsgclrw fqhrrnrrrr | ||
| kpqrnilrnf ivqafggcfg rsespqpkas rsikvkkvpi aekrrqmrke alekraqkra | ||
| ekkrsklidk qlqdekmgym cthrllll. | ||
| >g-olf | ||
| mgclggnskt tedqgvdeke rreankkiek qiqkerlayk athrllllga gesgkstivk | (SEQ ID NO:18) | |
| qmriihvngf npeekkqkil dirknvkdai vtivsamsti ippvplanpe nqfrsdyiks | ||
| iapitdfeys qeffdhvkkl wddegvkacf ersneyqlid caqyflerid svsivdytpt | ||
| dqdllrcrvl tsgifetrfq vdkvnfhmfd vggqrderrk wiqcfndvta iiyvaacssy | ||
| nmvirednnt nriresidlf esiwnnrwir tisijifink qdmlaekvia gkskiedyfp | ||
| eyanytvped atpdagedpk vtrakffird lflristatg dgkhycyphf tcavdtenir | ||
| rvfndcrdii qrmhlkqyel l. | ||
| >I1 | ||
| mgctisaedk aaverskmid rniredgeka arevkilllg agesgkstiv kqmkiiheag | (SEQ ID NO:19) | |
| yseeeckqyk avvysntiqs iiaiiramgr lkidfgdsar addarqifvi agaaeegfmt | ||
| aelagvikri wkdsgvqacf nrsreyqlnd saayylndld riaqpnyipt qqdvlrtrvk | ||
| ttgivethft fkdihfkmfd vggqrserkk wihcfegvta iifcvalsdy dlvlaedeem | ||
| nrmhesmklf dsicnnkwft dtsiiiflnk kdlfeekikk spiticypey agsntyeeaa | ||
| ayiqcqfedi nkrkdtkeiy thftcatdtk nvqfvfdavt dviiknnikd cglf. | ||
| >I2 | ||
| mgctvsaedk aaaerskmid kniredgeka arevklliig agesgkstiv kqmkiihedg | (SEQ ID NO:20) | |
| yseeecrqyr avvysntiqs imaivkamgn iqidfadpsr addarqifal sctaeeqgvi | ||
| pddlsgvirr iwadhgvqac fgrsreyqln dsaayyindl eriaqsdyip tqqdvlrtrv | ||
| kttgivethf ttkdlhfkmf dvggqrserk kwihcfegvt aiifcvalsa ydlviaedee | ||
| mnrmhesmki fdsicnnkwf tdtsiiifin kkdifeekit hspiticfpe ytgankydea | ||
| asyiqskfed inkrkdtkei ythftcatdt knvqfvfdav tdviiknnik dcgif. | ||
| >I3 | ||
| mgctisaedk aaverskmid rniredgeka akevkiilig agesgkstiv kqmkiihedg | (SEQ ID NO:21) | |
| ysedeckqyk vvvysntiqs iiaiiramgr lkidfgeaar addarqifvi agsaeegvmt | ||
| peiagvikri wrdggvqacf srsreyqlnd sasyyindid risqsnyipt qqdvirtrvk | ||
| ttgivethft fkdlyfkmfd vggqrserkk wihcfegvta iifcvalsdy dlviaedeem | ||
| nrmhesmkif dsicnnkwft etsiiiflnk kdifeekikr spiticypey tgsntyeeaa | ||
| ayiqcqfedi nrrkdtkeiy thftcatdtk nvqfvfdavt dviiknnike ogly. | ||
| >G01 | ||
| mgctlsaeer aaierskaie knikedgisa akdvkiiiig agesgkstiv kqmkiihedg | (SEQ ID NO:22) | |
| fsgedvkqyk pvvysntiqs laaivramdt lgieygdker kadakmvcdv vsrmedtepf | ||
| saeilsammr iwgdsgiqec fnrsreyqln dsakyyidsi drigaadyqp teqdilrtrv | ||
| kttgivethf tfknihfrif dvggqrserk kwihcfedvt aiifcvaisg ydqvlhedet | ||
| tnrmheslmi fdsicnnkff idtsiilfin kkdlfgekik ksplticfpe ytgpntyeda | ||
| aayiqaqtes knrspnkeiy chmtcatdtn niqvvfdavt diiiannlrg cgly. | ||
| >g02 | ||
| mgctvsaedk aaaerskmid kniredgeka arevkiillg agesgkstiv kqmkiihedg | (SEQ ID NO:23) | |
| yseeecrqyr avvysntiqs imaivkamgn lqidfadpsr addarqlfal sctaeeqgvl | ||
| pddisgvirr iwadhgvqac fgrsreyqln dsaayyindl eriaqsdyip tqqdvlrtrv | ||
| kttgivethf tfkdihfkmf dvggqrserk kwihcfegvt aiifcvalsa ydiviaedee | ||
| mnrmhesmkl fdsicnnkwf tdtsiilfin kkdlfeekit hsplticfpe ytgankydea | ||
| asyiqskfed inkrkdtkei ythftcatdt knvqfvfdav tdviiknnlk dogif. | ||
| >G(T-1) | ||
| mgagasaeek hsieiekkik edaekdartv kililgages gkstivkqmk iihqdgysle | (SEQ ID NO:24) | |
| eclefiaiiy gntlqsilai vramttlniq ygdsarqdda rklmhmadti eegtmpkems | ||
| diiqrlwkds giqacteras eyqindsagy ylsdierlvt pgyvpteqdv lrsrvkttgi | ||
| ietqfsfkdl nfrmfdvggq rserkkwihc fegvtciifi aaisaydmvl veddevnrmh | ||
| eslhitnsic nhryfattsi vifinkkdvf fekikkahis icfpdydgpn tyedagnyik | ||
| vqflelnmrr dvkeiyshmt catdtqnvkf vfdavtdiii kenikdcglf. | ||
| >G(T-2) | ||
| mgsgasaedk elakrskele kklqedadke aktvkiiiig agesgkstiv kqmkiihqdg | (SEQ ID NO:25) | |
| yspeeciefk aiiygnviqs iiaiiramtt igidyaepsc addgrqinni adsieegtmp | ||
| pelvevirrl wkdggvqacf eraaeyqlnd sasyylnqle ritdpeylps eqdvirsrvk | ||
| ttgiietkfs vkdinfrmfd vggqrserkk wihcfegvtc iifcaaisay dmvlveddev | ||
| nrmheslhlf nsicnhkffa atsivlfink kdlfeekikk vhisicfpey dgnnsyddag | ||
| nyiksqfldl nmrkdvkeiy shmtcatdtq nvkfvfdavt diiikenlkd cgif. | ||
| >G(Z) | ||
| mvflsgnasd ssnctqppap vniskaillg viiggiilfg vignilvils vachrhihsv | (SEQ ID NO:26) | |
| thyyivnlav adllltstvl pfsaifevlg ywafgrvfcn iwaavdvicc tasimglcii | ||
| sidryigvsh plryptivtq rrglmalicv waisivisig pifgwrqpap edeticqine | ||
| epgyvifsal gsfylpiaii lvmycrvyvv akresrgiks glktdksdse qvtlrihrkn | ||
| apaggsgmas aktkthfsvr likfsrekka aktigivvgc fvlcwlpffl vmpigsffpd | ||
| fkpsetvfki vfwlgyinsc inpiiypcss qefkkafqnv iriqclcrkq sskhalgytl | ||
| hppsqavegq hkdmvripvg sreafygisr tdgvcewkff ssmprgsari tvskdqssct | ||
| tarvrsksfl qvcccvepst psldknhqvp tikvhtisis engeev. | ||
| >G(Q) | ||
| macclseeak earrindeje rqlrrdkrda rrelkllllg tgesgkstfi kqmriihgsg | (SEQ ID NO:27) | |
| ysdedkrgft kivyqnitta mqamiramdt lkipykyehn kahaqlvrev dvekvsafen | ||
| pyvdaiksiw ndpgiqecyd rrreyqisds tkyylndldr vadpaylptq qdvlrvrvpt | ||
| tgiieypfdl qsvifrmvdv ggqrserrkw ihcfenvtsi mflvalseyd qvlvesdnen | ||
| rmeeskaifr tiitypwfqn ssvilflnkk dileekimys hivdyfpeyd gpqrdaqaar | ||
| efilkmfvdl npdsdkiiys hftcatdten irfvfaavkd tilqlnlkey nay. | ||
| >G(Y-11) | ||
| mtlesmmacc isdevkeskr inaeiekqlr rdkrdarrel kllllgtges gkstfikqmr | (SEQ ID NO:28) | |
| iihgagysee dkrgftklvy qniftamqam irametikil ykyeqnkana llirevdvek | ||
| vtttehqyvs aiktlwedpg iqecydrrre yqlsdsakyy itdvdriatl gyiptqqdvl | ||
| rvrvpttgii eypfdlenii frmvdvggqr serrkwihcf envtsimflv aiseydqviv | ||
| esdnenrmee skaifrtiit ypwfqnssvi lflnkkdlle dkilyshlvd yfpefdgpqr | ||
| daqaarefii kmfvdlnpds dkiiyshfto atdtenirfv faavkdtilq lnlkeynlv. | ||
| >G(Y-12) | ||
| msgvvrtisr cilpaeagga rerragsgar daerearrrs raidailare rravrrlvki | (SEQ ID NO:29) | |
| illgagesgk stfikqmrii hgrefdqkai lefrdtifdn ilkgsrvlvd ardkigipwq | ||
| ysenekhgmf imafenkagi pvepatfqiy vpalsalwrd sgireafsrr sefqlgesvk | ||
| yfidnidrig qinyfpskqd iilarkatkg ivehdfvikk ipfkmvdvgg qrsqrqkwfq | ||
| cfdgitsilf mvssseydqv lmedrrtnrl vesmnifeti vnnkiffnvs iilfinkmdi | ||
| ivekvktvsi kkhfpdfrgd phqiedvqry ivqcfdrkrr nrskplfhhf ttaidtenvr | ||
| fvfhavkdti iqenikdiml q. | ||
| >G(Y-13) | ||
| madflpsrsv lsvcfpgcii tsgeaeqqrk skeidkclsr ektyvkrivk illlgagesg | (SEQ ID NO:30) | |
| kstflkqmri ihgqdfdqra reefrptiys nvikgmrvlv darekThipw gdnsnqqhgd | ||
| kmmsfdtrap maaqgmvetr vfiqyipair alwadsgiqn aydrrrefqi gesvkyfldn | ||
| ldklgepdyi psqqdiilar rptkgiheyd feiknvpfkm ldvggqrser krwfecfdsv | ||
| tsilfivsss efdqvimedr itnrltesln ifetivnnrv fsnvsiilfl nktdileekv | ||
| qivsikdyfl efegdphcir dvqkfivecf rnkrrdqqqk piyhhfttai ntenirivfr | ||
| dvkdtilhdn ikqimiq. | ||
| >G(Y-14) | ||
| magccclsae ekesqrisae ierqlrrdkk darrelklll lgtgesgkst fikqmriihg | (SEQ ID NO:31) | |
| sgysdedrkg ftkivyqnif tamqamiram dtlriqyvce qnkenaqiir evevdkvsml | ||
| sreqveaikq iwqdpgiqec ydrrreyqls dsakyyltdi driatpsfvp tqqdvlrvrv | ||
| pttgiieypf dieniifrmv dvggqrserr kwihcfesvt siifivaise ydqvlaecdn | ||
| enrmeeskai fktiitypwf lnssvilfin kkdileekim yshiisyfpe ytgpkqdvra | ||
| ardfilklyq dqnpdkekvi yshftcatdt dnirfvfaav kdtilqlnlr efnlv. | ||
| >G(Y-15) | ||
| marsitwrcc pwcltedeka aarvdqeinr illeqkkqdr gelkllllgp gesgkstfik | (SEQ ID NO:32) | |
| qmriihgagy seeerkgfrp ivyqnifvsm ramieameri qipfsrpesk hhaslvmsqd | ||
| pykvttfekr yaaamqwlwr dagiracyer rrefhlidsa vyylshieri teegyvptaq | ||
| dvlrsrmptt gineycfsvq ktnlrivdvg gqkserkkwi hcfenviali ylaslseydq | ||
| cieennqenr mkeslalfgt iielpwfkst sviifinktd iieekiptsh latyfpsfqg | ||
| pkqdaeaakr fiidmytrmy tgcvdgpegs kkgarsrrif shytcatdtq nirkvfkdvr | ||
| dsviaryide mu. | ||
| >Gusducin | ||
| mfdvggqrse rkkwihcfeg vtciifcaal saydmvlved eevnrmhesl hlfnsicnhk | (SEQ ID NO:33) | |
| yfsttsivif inkkdifqek vtkvhlsicf peytgpntfe dagnyiknqf ldlnikkedk | ||
| eiyshmtcat dtqnvkfvfd avtdiiiken lkdcglf. | ||
1. Selection of nucleic acid sensor molecules which are activated by GPCRs not bound to ligand:
A library of up to 1017 variants of in vitro synthesized ribozymes is allowed to react with purified GPCRs at a final concentration of luM GPCR. Selection of catalytic nucleic acid sensor molecules is carried out by procedures outlined in prior examples. Selections are carried out in parallel fashion. Selections can also be carried out in mixed pools of anywhere from 5–10 GPCRs. In the final rounds of nucleic acid sensor molecule selection, the RNA pools may separated into aliquots which may then be used to carry out in vitro selection against single GPCR proteins to yield unique nucleic acid sensor molecules selective for all 400 plus GPCRs.
2. Selection of nucleic acid sensor molecules which are activated by ligand bound GPCRs.
Stable complexes of each GPCR and corresponding -ligand are formed with from 1–10 equivalents of ligand. Selection of catalytic nucleic acid sensor molecules is carried out by procedures outlined in the Detailed Description. Selections are carried out in parallel fashion. Selections can also be carried out in mixed pools of anywhere from 5–10 GPCR-ligand complexes. In the final rounds of nucleic acid sensor molecule selection, the RNA pools may separated into aliquots which may then be used to carry out in vitro selection against single GPCR-ligand complexes to yield unique nucleic acid sensor molecules selective for all GPCR-ligand complexes.
Selection of nucleic acid sensor molecules using peptide fragments of GPCRs Nucleic acid sensor molecules that specifically recognize conformational isoforms of GPCRs that are revealed upon ligand binding can also be selected for using the methods described herein.
Molecular cloning studies have identified over 400 human GPCRs, and have identified the ligands for 120. GPCRs consist of three domains: an extracellular N-terminus, a central domain of seven trans-membrane helices, and a cytoplasmic C-terminus. Activation of GPCRs is induced by ligand binding, which causes a conformational change in the receptor transmitting a signal across the plasma membrane to intracellular members of a signaling pathway. This method provides for generation of unique biosensors for each GPCR.
A library of up to 1017 variants of in vitro synthesized ribozymes is allows to react with peptide fragments of the GPCRs comprising regions of the GPCR that are exposed upon activation. Nucleic acid sensor molecules which recognize these domains are then capable of recognizing them within the context of the full length protein and hence recognize the activated state of the GPCR. Examples of the use of peptide fragments to generate nucleic acid sensor molecules which recognize the full length protein are known in the art and are incorporated herein. See, for example, data on nucleic acid sensor molecule selection and recognition of HIV rev peptide and full length protein [Michael Robertson, 2001, University of Texas, Austin, Ph.D. Dissertation]. In the case of HIV rev, unique peptide sequences are recognized both as free peptides and in the context of the full protein.
Nucleic acid sensor molecules specific for GPCRs are generated by in vitro selection for recognition of peptide fragments of the GPCRs comprising regions of the GPCR that are exposed to the inside face of the plasma membrane when ligand binds to the GPCR. Exemplary suitable GPCR peptide fragments are presented in Table 9. Nucleic acid sensor molecules which recognize these peptides are then capable of recognizing them within the context of the full length protein and hence recognize the activated state of the GPCR.
Nucleic Acid Sensor Molecule Specific to Phosphodiesterase (PDE) for Target Validation
Nucleic acid sensor molecules are generated to be specific to various subclasses of PDEs are used for understanding the role of PDE subclasses in the molecular pathology of disease, and as PDE target validation. For example, nucleic acid sensor molecules which are modulated by each of four PDE4 subtypes have specific utility in understanding the role of PDE4 in human disease. The four subclasses of PDE4 are differentially localized between cell type and also the PDE4 isozymes differ with respect to their intracellular localization. This differential localization, together with the transcriptional regulation and post-translational modification, controls the cAMP level in cells in response to the cells' environment (Muller, Engels et al. 1996).
The cDNAs for four PDE4 subtypes are cloned from human blood leukocyte cDNA library as described (Wang, Myers et al. 1997). Each subclass of PDE4 is expressed as recombinant protein fused with a His-tag in E. coli or SF9 insect cells (Richter, Hermsdorf et al. 2000) (Wang, Myers et al. 1997). The expressed proteins are purified through Ni++ columns according to established procedures. Catalytic nucleic acid sensor molecules modulated by the four subclasses of PDE4 are then selected as described above. The nucleic acid sensor molecules are tested for their subclass specificity, by determining the switch factor.
Tissue samples from different organs can be prepared, and the cell extract can be tested against a panel of PDE4 subclass-specific nucleic acid sensor molecules to determine the protein level of each PDE in the organ. Thus, one can obtain more precise information about PDE4 levels relative to methods based on measuring the mRNA level (Bloom and Beavo 1996) (Obernolte, Ratzliff et al. 1997) (Nagaoka, Shirakawa et al. 1998).
Likewise, different classes of PDE (PDE1–11) are expressed in a tissue-specific manner and play different physiological roles (Conti 2000), and the subcellular localization of PDE regulates their activity. Accordingly, the nucleic acid sensor molecule can be used to determine the subcellular localization of each PDE from fractionated cell extracts (Bolger, Erdogan et al. 1997), or in situ hybridization technique (Sirinarumitr, Paul et al. 1997).
The nucleotide sequences of a cAMP-dependent PDE nucleic acid sensor molecule and cGMP-dependent nucleic acid sensor molecule are presented in Table 10. Allosteric domains are 15 shown in bold font and the cleavage site nucleotide is underlined. CGMP modulated NASMs that are configured for homogeneous, solution based fluorescence assays (FRET) are shown the FIG. 62 . Multiplexed camp and cGMP-modulated FRET-sensor NASM-based assays are shown in FIG. 65B . The optical NASMs modulated by cAMP and cGMP are used in PDE assays as described in detail below.
| TABLE 10 | |
| cAMP-Hammerhead RNA seq: | |
| 5′-GGGC GAC CC UGA UGA GCC UGU GGA AAC AGA CGU GGC ACA UGA CUA CGU CGA AAC | (SEQ ID NO:34) | |
| GGU GAA AGC CGU AGG UUG CCC -3′ | ||
| cGMP-Hammerhead RNA seq: | ||
| 5′-GGGC GAC CC UGA UGA GCC CUG CGA UGC AGA AAG GUG CUG ACG ACA CAU CGA AAC | (SEQ ID NO:35) | |
| GGU GAA AGC CGU AGG UUG CCC -3′ | ||
The cAMP and cGMP-dependent nucleic acid sensor molecules were added to a solution containing various amounts of PDE and the corresponding cyclic nucleotide (cAMP or cGMP). A decreasing amount of the cyclic nucleotide was found to correspond to the increasing amount of PDE. These results demonstrate that the cyclic nucleotide-dependent nucleic acid sensor molecules can be used to measure PDE activity.
The calmodulin activated PDE specific for cGMP was used under the following enzyme assay conditions: Assay conditions (10 mM Tris, 20 mM MgCl2, 100 FM CaCl2) 200 nM cGMP-NASM; the assay is quenched with 0.1% SDS and then 200 nM cGMP-NASM is added to the mixture. Remaining cGMP was determined by the amount of conversion of nucleic acid sensor molecule to product using a gel based radioactive product-release (gel-shift) assay format. The nucleic acid sensor molecule is active in a variety of formats and is not inhibited by GMP produced by the components of the PDE assay. Similarly, the cAMP nucleic acid sensor molecule is active in a variety of assay formats and is not inhibited by GMP produced by the components of the PDE assay. The conversion of cGMP to GMP is followed by the optical NASM formats described in FIGS. 62–72 .
High Throughput Screening (HTS) Assays Using cAMP-dependent PDE Nucleic Acid Sensor Molecules:
A cAMP-dependent nucleic acid sensor molecule is used in HTS assays for PDEs (PDE1, PDE2, PDE3, PDE4, PDE7, PDE8, PDE10, and PDE11). Similarly, cGMP-dependent-nucleic acid sensor molecules can be used in HTS assays for PDEs (PDE5, PDE9, PDE10, and PDE I1). Representative cAMP-dependent and cGMP-dependent PDE nucleic acid sensor molecules are shown above, and in FIGS. 62–72 for all solution and chip-based NASM assay configurations.
Each class of PDE can be isolated from human tissue (Ballard, Gingell et al. 1998), or expressed as recombinant proteins in various system (e.g. E coli, SF9 cells). Thus, the nucleic acid sensor molecule monitors the PDE activity in the presence and the absence of candidate drugs. For example, PDE and its substrate (i.e., cAMP and/or cGMP) are incubated at predetermined durations in a multiwell chamber (e.g., 96, 384 well) with various concentration of compounds for screening, and the reaction is terminated by changing the buffer conditions (e.g., addition of sufficient amount of EGTA, shifting buffer pH), or by separating enzyme and substrate (e.g., filtration). Next, the nucleic acid sensor molecules are added to measure the altered concentration of the substrate, cAMP and cGMP. Alternatively, optical nucleic acid sensor molecules can be added without terminating the PDE activity. CAMP and cGMP modulated these HTS assays, as described in FIG. 62 and FIG. 63 .
cAMP- or cGMP-dependent nucleic acid sensor molecules can also be used to characterize the IC50 of the drug in vitro. A PDE assay is performed with serial dilutions of a compound of interest. Purified PDE or, alternatively, soluble extract from cells (Moreland, Goldstein et al. 1998) can be used for the assay. The assay can be performed as described herein.
Alternatively, cAMP- or cGMP-dependent nucleic acid sensor molecules (FIGS. 62 , 33, and 64) are used to characterize the IC50 values of drug candidate in vitro by analyzing cAMP-or cGMP synthesized by adenyl and guanyl cyclases. Adenylate and guanylate cyclase assays are set up with serial dilution of a compound of interest. Membrane fractions containing adenylate and guanylate cyclases are used for the assay. The assay can be setup as described in the literature using ATP or GTP as the substrate.
Competitive Assays using PDE Nucleic Acid Sensor Molecules:
Nucleic acid sensor molecules are generated that interact with the active sites of PDEs. PDE4 proteins are obtained as described above. The nucleic acid sensor molecules are selected against PDE4 with negative selection in the presence of PDE4 complexed with subnanomolar inhibitor (e.g., Rolipram). Thus, the nucleic acid sensor molecule is modulated by free, uncomplexed PDE4, the PDE nucleic acid sensor molecules compete for PDE binding with inhibitors.
The direct inhibition by the nucleic acid sensor molecules can be tested using commercially available PDE assay kits (Amersham SPA assay kit for cAMP, Molecular Devices HEEP cAMP assay kit). In drug screening, the competition is performed by monitoring the signal from the nucleic acid sensor molecules in the presence of various inhibitors. Purified PDE or soluble cell extract from appropriate source (e.g., Wistar rat brain (Andersson, Gemalmaz et al. 1999) ) is incubated with nucleic acid sensor molecules (100 rtM) in the presence and the absence of compounds in 10 mM Tris buffer pH 7.5 containing 10 mM MgCl2. The changes in the initial rate of each nucleic acid sensor molecule response in the presence and the absence of the drug can be monitored in homologous system. Multiple PDEs can be tested against a same compound in the same well. This assay is expanded if desired to determine the tissue specific interaction of each class of PDE and any compounds.
Cell-based Assays using Cyclic Nucleotide-dependent PDE Nucleic Acid Sensor Molecules
Nucleic acid sensor molecules are used to monitor the cellular cAMP and cGMP level in response to the injection of drugs in tissue or rat cell lines. For example, strips of human corpus collasum (HCC) tissue or rat HCC cell lines (N1S1 and McA-RH7777 cells) can be incubated in the presence and absence of a drug against PDE5 (Min, Kim et al. 2000) (Arora, de Groen et al. 1996), and the cGMP specific nucleic acid sensor molecule can be used to measure the amount of cGMP in soluble extract from the tissue or cell sample as described above.
Alternatively, the cAMP, and cGMP-dependent nucleic acid sensor molecules are incorporated into a reporter-gene plasmid as described above. This construct is introduced in cell lines by standard transfection (e.g. lipid-mediated transfection, calcium-phosphate co-precipitation, microinjection, electroporation, retroviral infection). The level of cGMP or camp in the cell is measured by the expression of the reporter gene.
Class Specific PDE Assay:
Nucleic acid sensor molecules are selected for the catalytic domains of each class of PDE1–11 are prepared. These nucleic acid sensor molecules are then used for target validation as described above.
Alternatively, the nucleic acid sensor molecules are used in competitive inhibition assays. Competitive nucleic acid sensor molecules are used in in vitro assays to screen compounds against multiple PDEs in multiplex assays, as described above.
Pharmacokinetics Studies using Nucleic Acid Sensor Molecules
Nucleic acid sensor molecules modulated by drug leads or drug compounds used in preclinical testing and clinical trial for pharmacokinetics studies are selected and identified as described in the Detailed Description. A human serum sample with or without the administration of a drug or other therapeutic agent is prepared (Berzas Nevado, Rodriguez Flores et al. 2001). The nucleic acid sensor molecule is added to the sample. The nucleic acid sensor molecule is then used in optical or PCR based detection methods as described in later examples, thereby quantifying the drug concentration in the whole serum or extract from the serum.
The nucleic acid sensor molecule modulated by various drugs or leads can also be used to determine the drug distribution in an animal model system. For example, a drug can be administrated in animals (e.g., Sprague Dawley rats, New Zealand white rabbit) by IV or orally (Andersson, Gemalmaz et al. 1999) (Jeremy, Ballard et al. 1997). At various time intervals after drug administration, the animal is sacrificed. Various organs are tested for the drug distribution by in situ hybridization using the drug-dependent nucleic acid sensor molecule. Alternatively, each organs/serum is prepared for pharmacokinetic studies.
Cell-permeability Studies using Nucleic Acid Sensor Molecules
Nucleic acid sensor molecules against a test compound are used to test cell permeability of the compound. These nucleic acid sensor molecules can be incorporated into a reporter gene construct, if desired, to make a drug-sensitive reporter gene system as described above. This construct is introduced in established cell lines (e.g. HELA cells, 293 cell, CHO cell). The cells are cultured in various concentrations of drug in media, and the expression of the reporter gene is monitored.
Expression and Purification of Recombinant MAPKs
All protein ORFs were obtained from Upstate Biotech, and cloned into pRSET (Invitrogen), except for ERK which was cloned directly downstream from a hexahistidine tag into pRSET from which the leader sequence had been removed. Constructs were sequence verified before transformation into Rosetta plys(S) cells (Novagen). After growth and induction as described below, cells were washed in 10 ml PBS per liter of culture and resuspended in 7.5 ml Lysis Buffer (500 mM KCl, 20 mM Tris-Cl, pH 8.0, 10% glycerol, 0.5% NP-40, supplemented with 1 Complete EDTA-Free Protease Inhibitor tablet (Roche) per 50 ml) per liter of culture. Cells were frozen in liquid nitrogen and stored at −80 ° C. Lysis and clarification was accomplished by rapid thawing in a 40° C. bath for 10 minutes, incubation at 4° C. for thirty minutes, and centrifugation for 60 minutes at 100,000×g. As a standard first step, metal chelate affinity chromatography (MCAC) was performed as follows: cell lysate was diluted 1:2 with Buffer A (500 mM KCI, 20 mM Tris-Cl, pH 8.0, 10% glycerol) and applied to a 5 ml HiTrap Chelating column (Amersham Biosciences) charged with nickel. The column was washed with 10 column volumes of Buffer A, and eluted stepwise with 10 column volumes of Buffer A plus 16, 56, 167 and 500 mM imidazol, pH 8.0 at a flow rate of 1.5 ml/min and collecting 5 ml fractions. MAPKs eluted in either the 167 or 500 mM imidazol fractions. After the purification described below, proteins were essentially pure as determined by silver staining of SDS-PAGE gels.
For purification of ERK, cells were grown to an OD600 of 0.7 at 37° C. and induced with 1 mM IPTG for 2 hours at 37° C. The MCAC fraction was diluted tenfold with Buffer B (20 mM HEPES 8.0, 1 mM DTT, 1 mM EDTA, 10% glycerol) and loaded onto a 5 ml HiTrap Q column (Amersham Biosciences) previously equilibrated with Buffer B plus 50 mM KCl. ERK was eluted in a 10 column gradient to Buffer B plus 500 mM KCI, at a flow rate of 1.5 ml/min, taking 2.5 ml fractions.
For purification of Jnkl, stationary phase culture was diluted to OD600 of 0.7 and grown at 37° C. for one hour, and induced with 0.5 mM IPTG for 2 hours at 37° C. MCAC fractions containing Jnk1 were pooled and desalted into Buffer C (20 mM HEPES 7.0, 1 mM DTT, 1 mM EDTA, 10% glycerol) plus 100 mM NaCl by passage over a PD-10 column (Amersham Biosciences). PD-10 eluate was diluted 1:5 with buffer C immediately before loading on a 1 ml HiTrap SP column (Amersham Biosciences) equilibrated in Buffer C. The column was washed with 5 column volumes Buffer C, 5 column volumes Buffer C plus 50 mM NaCl, eluted with a 7 column volume gradient to Buffer C plus 300 mM NaCl, and finished with 5 column volumes of Buffer C plus 300 mM NaCl. The SP column was run at 0.5 ml/min collecting 0.5 ml fractions.
Ion-exchange chromatograpy conditions for p38gamma, h-Ras, and RhoA were identical to ERK, except KCl was substituted for NaCl in Buffer D additions. For purification of p38gamma, cultures were grown to an OD600 of 0.8 and induced with 0.5 mM IPTG for 3 hours at 30° C. For purification of RhoA and h-Ras, cells were grown at 37° C. to an OD600 of 0.8 at 37 ° C., and induced with 0.5 mM IPTG for 3 hours. MCAC fractions were diluted two fold with ddH2O, and dialyzed into Buffer D (20 mM HEPES 7.4, 1 mM DTT, 1 mM EDTA, 10% glycerol) plus 50 mM NaCl. Dialysate was applied to a 1 ml HiTrap Q column (Amersham Biosciences), washed with 5 column volumes Buffer D plus 50 mM NaCl, eluted with 8 column volumes to Buffer D plus 500 mM NaCl, and flushed with 3 column volumes Buffer D plus 500 mM NaCl. Column flow rate and fractionation parameters were identical to Jnk1 purification.
For purification of p38delta, cells were grown at 37° C. to OD600 1.0 and induced with 0.5 mM IPTG for 2 hours. MCAC fractions were dialysed against Buffer B plus 100 mM KCI, then diluted threefold with Buffer B immediately before loading on a 1 ml HiTrap SP column. The column was washed with 5 column volumes of Buffer B plus 50 mM KCl, and eluted with 10 column volumes to Buffer B plus 500 mM KCl, at a flow rate of 0.5 ml/min taking 0.5 ml fractions.
For purification of Mek1, a fresh transformation was grown for 12 hours at 30° C., split 1:100 into fresh media, and grown to OD600 0.7 at 37° C., then induced with 1 mM IPTG for 3 hours. MCAC fractions were desalted on a PD-10 column into Buffer E (40 mM HEPES, pH 7.4, 1 mM EDTA, 1 mM DTT, 10% glycerol) and applied to a 1 ml HiTrap Q column. The column was washed with 10 CV Buffer E and MekI was eluted in a single step of Buffer E plus 85 mM NaCl. Q column run parameters were as for Jnkl; fractions containing Mek1 were collected and dialyzed into Buffer F (150 mM NaCI, 10 mM HEPES, pH 7.5, 1 mM DTT, 1 mM EDTA) and applied to a Superdex 75 column (Amersham Biosciences). The Superdex 75 column was run at 1 ml/min and 1 ml fractions were collected. Fractions containing Mekl were pooled and concentrated tenfold on a Centricon YM-10 (Amicon), and glycerol was added to 10% v/v before proteins were frozen in liquid nitrogen.
For purification of Mek1-DD (Huand and Erikson, 1994), cells were grown to OD600 of 0.7 at 37C and induced with 0.5 mM IPTG for 3 hours. Purification conditions were identical to RhoA and H-ras.
Activation of ERK and Generation of ppERK.
Recombinant ERK and Mek1-DD were mixed in a 20:1 molar ratio in 1×Kinase Activation Buffer (100 mM NaCl, 10 mM MgCl2, 10 mM HEPES, pH 8.0, 10% glycerol). ATP was added to 1 mM and the mixture incubated for 30 minutes at 23° C. Excess ATP was removed from the reaction by desalting on a PD-10 column into Buffer G (20 mM HEPES, pH 8.0, 2 mM DTT, 10% glycerol) plus 25 mM NaCl. The eluate was loaded on a 1 ml HiTrap Q column and washed with 20 column volumes of Buffer G plus 100 mM NaCl. ppERK was eluted with a 60 column volume gradient to Buffer G plus 300 mM NaCl at 0.5 ml/min, collecting 0.5 ml fractions. Activated ERK eluted at 176 mM NaCl, while inactivated ERK eluted at 228 mM NaCl. Fractions containing ppERK were diluted six fold with buffer G and reapplied to a 1 ml HiTrapQ column. The column was washed with 50 mM NaCl, and the ppERK was eluted with a single step of Buffer G plus 500 mM NaCl.
In Vitro Selection of Cis-hammerhead Derived ERK and ppERK NASMs
Library design. FIG. 1B , illustrates an RNA ribozyme library derived from a hammerhead sequence pool consisting of up to 1017 variants of randomized sequences appended to the hammerhead ribozyme motif (FIG. 19 ). The ribozyme library is prepared on DNA synthesizer. Random nucleotides are incorporated during the synthesis to generate pools of roughly 1017 molecules. FIG. 19 illustrates linker scanning library designed to identify cis-hammerhead NASMs that are modulated by the protein kinase ERK. The linker library was generated by appending an ERK target modulation domain to the randomized linker domain to create a library of potential ERK-modulated cis-hammerhead NASMs. The linker library of ERK-modulated cis-hammerhead NASMs consists of up to 65,000 variants. Most molecules in the randomized NASM pools are non-functional NASMs.
Selection of NASMs. Sorting among the billions of NASMs to find the desired molecules starts from the complex sequence pool, whereby desired target-modulated NASMS are isolated through an iterative in vitro selection process: in addition to the target-activated ribozymes that one desires, the starting pool is usually dominated by either constitutively active or completely inactive ribozymes. The selection process removes both types of contaminants. In a following amplification stage, thousands of copies of the surviving sequences are generated to enable the next round of selection. During amplification, random mutations can be introduced into the copied molecules—this ‘genetic noise’ allows functional nucleic acid sensor molecules to continuously evolve and become even better adapted as target-activated enzymes. The entire experiment reduces the pool complexity from 1017 molecules down to around 100 NASMs that require detailed characterization.
In vitro Selection Method. Negative selections were set up in which 100 gl reactions containing the library (c.f. FIG. 19 , where the linker library of ERK NASMs consists of up to 65,000 variants, alternatively the library consists of up to 1017 variants of randomized sequences appended to the hammerhead ribozyme motif) of target modulated ribozymes containing randomized target modulation domains and randomized linker regions (1 μM), were incubated at 72° C., 5 seconds, followed by 25° C. for lhr in a reaction buffer containing KCl (0–150 mM), HEPES pH 7.5 (20 mM), MgCl2 (20 mM), EDTA (0.5 mM). Cleaved RNA molecules (radiolabeled internally) were then removed from the mixture by electrophoresis through a 7M urea, 8% PAGE gel, followed by cutting the uncleaved band from the gel. Detection of cleaved and uncleaved RNAs were carried out using a phosphor-imager system. The uncleaved hammerhead-derived RNAs were then subjected to a round of positive selection for ERK, or ppERK, target modulation, by incubating the pool of RNA in selection to which the protein target (50 nM to 1 μM ERK, or 50 nM to 1 μM ppERK) were added, and the mixture was further incubated at 37° C. for 30 minutes. Cleaved RNA molecules (radiolabeled internally) were then isolated and removed from the mixture by electrophoresis through a 7M urea, 8% PAGE gel, followed by cutting the cleaved band from the gel. incubated with reverse transcription mix at 65° C. for 1 hour using a thermostable reverse transcriptase. The pool was subsequently separated from the reverse transcription mixture by filtration and was then amplified using PCR first with the substrate 3-specific 5′-PCR primer and the library-specific 3′-PCR primer, and secondly with the regeneration 5′-PCR primer and the library-specific 3 ′-PCR primer in order to add the T7 promoter. Transcriptions were performed with these PCR products directly and after denaturing PAGE purification the entire process was repeated for several rounds with assays run after every round.
Cleavage Assays
Cleavage assays were performed using radiolabeled RNA and analytical denaturing polyacrylamide gel elecrophoresis (PAGE) (gel-based assays). Assays were performed upon both the library and clonal sequences. In a representative gel-based assay transcription was performed in the presence of alpha-32P-labelled UTP, and the resultant transcripts were gel-purified using denaturing PAGE. Assay mixtures were then made in which 10 μl reactions containing RNA (1u μM), and protein target (1 μM) were incubated at 37° C. for between 15 min and 16 h in a reaction buffer containing buffer containing KCl (0–150 mM), HEPES pH 7.5 (20 mM), MgCl2 (20 mM), EDTA (0.5 mM). The resultant samples are quenched by the addition of EDTA and the relative extents of cleavage measured by comparison of the intensity of the corresponding bands on a denaturing PAGE observed by reading a phosphorimager plate that had been exposed to the gel.
See general Example 1A for a discussion of the cloning, sequencing and characterization of individual NASMs.
Nucleic Acid Sensor Molecules Modulated by ERK and Phosphorylated ERK Generated by Engineering Target Modulation Domains into Hammerhead Catalytic Domains.
ERK and ppERK modulated nucleic acid sensor molecules were generated by a strategy combining both engineering and in vitro selection, FIG. 19 . Target modulation domains selected for binding to ERK and to the phosphorylated form of ERK (ppERK) are the starting point of the engineering efforts (Seiwert et al. 2000). These target modulation domains when isolated as discrete aptamers specifically recognize ERK but do not detectably interact with other mitogen-activated protein kinases such as Jun N-terminal kinase or p38 (as monitored by the ability to inhibit kinase activity). An aptamer (target modulation domain) selected for ppERK binding efficiently discriminates between phosphorylated and non-phosphorylated forms of the protein, binding ppERK with a KD of 4.7 nM and ERK with a KD of 50 nM (Seiwert et al. 2000). Simply engineering an ERK aptamer sequence onto a stably duplexed linker domain appended to the hammerhead ribozyme motif as shown in FIG. 21 , results in non-functional NASMs, e.g., certain ribozyme NASMs, derived through direct engineering, when assayed as described above, exhibit little or no cleavage activity in the absence of ERK and no detectable ERK-modulation of cleavage activity in the presence of ERK. Inactive NASMs remained unresponsive to added ERK protein in concentrations ranges tested from 50 nM to 5 uM. Hence, ERK concentrations greater than 1000 fold over the aptamer KD values does not result in target modulation of the NASM, suggesting that functional NASM activity will require more than a finctional target modulation domain appended to a ribozyme motif.
In vitro selection of cis-hammerhead NASMs based on the 65,000 member ERK target modulated ribozyme library shown in FIG. 19 , were performed as described in Example lA. In vitro selection of hammerhead derived ERK and ppERK NASMs, and the subsequently identified and characterized a series of ERK-modulated NASMs are shown in FIG. 19 , and in Table 11. The detailed methods for the analysis ERK-modulated NASM clones is given in Example 1A Cloning, sequencing and characterization of individual NASMs.
Example 13. In vitro selection of L1-ligase derived ERK and ppERK NASMs
Starting from a random linker domain library of L1-ligase derived NASMs as shown in FIG. 31 , we carried out in vitro selection to identify ERK-modulated and or ppERK-modulated L1-ligase NASMs. Negative selections were set up in which 100 μl reactions containing the library of ribozymes (1 μM), effector oligonucleotide (1.5 μM) and substrate 3 (5 μM) were incubated at 25° C. for between 16 and 160 h in a reaction buffer containing KCl (150 mM), HEPES (20 mM), MgCl2 (10 mM), EDTA (1 mM), DTT (1 mM), tRNA (0.1 mg/ml) and glycerol (10% w/v). Ligated RNA molecules were then removed from the mixture by incubation with immobilized neutravidin. The flow through was collected by filtration and to this was added more substrate 3 (2 μM), protein target (1 μM ERK or ppERK) and RNase inhibitor were added and the mixture was further incubated at 25 ° C for between 15 minutes and 1 hour. Ligated RNA molecules were then captured by incubation with immobilized neutravidin and, after washing, the matrix was incubated with reverse transcription mix at 65° C. for 1 hour using a thermostable reverse transcriptase. The matrix was subsequently separated from the reverse transcription mixture by filtration and was then amplified using PCR first with the substrate 3-specific 5′-PCR primer and the library-specific 3′-PCR primer, and secondly with the regeneration 5′-PCR primer and the library-specific 3′-PCR primer in order to add the T7 promoter. Transcriptions were performed with these PCR products directly and after denaturing PAGE purification the entire process was repeated for several rounds with assays run after every round.
Ligation Assays
Ligation assays were performed using radiolabeled RNA and analytical denaturing polyacrylamide gel elecrophoresis (PAGE) (gel-based assays), or by PCR utilizing the substrate 3-specific 5′-PCR primer (PCR-based assay). Assays were performed upon both the library and clonal sequences. In a representative gel-based assay transcription was performed in the presence of alpha-32P-labelled UTP, and the resultant transcripts were gel-purified using denaturing PAGE. Assay mixtures were then made in which 10 μl reactions containing RNA (1u μM), effector oligonucleotide (1.5 μM), substrate 3 (5 μM) and optionally RNase-inhibitor and protein target (1 μM) were incubated at 25° C. for between 15 min and 16 h in a reaction buffer containing protein target (1 μM ERK or ppERK), KCl (150 mM), HEPES (20 mM), MgCl2 (10 mM), EDTA (1 mM), DTT (1 mM), tRNA (0.1 mg/ml) and glycerol (10% w/v) . The resultant samples were quenched by the addition of EDTA and the relative extents of ligation were measured by comparison of the intensity of the corresponding bands on a denaturing PAGE observed by reading a phosphorimager plate that had been exposed to the gel. PCR assays were performed using the same reaction mixture except that the relative extents of ligation in different samples were compared by observing the relative rates of appearance of PCR products using the substrate 3-specific 5′-PCR primer and the library-specific 3′-PCR primers. The detailed methods for the analysis ERK-modulated NASM clones is given in Example 1A, Cloning, sequencing and characterization of individual NASMs.
Example 14. Rational design and Engineering of ERK dependent ligases.
ERK-dependent ligase ribozymes were built on the catalytic core of the L1 ligase ribozyme of Robertson and Ellington (2000; NAR 28, 1751–1759) in which the non-conserved, stem C element was replaced with the ERK-interacting domain and joined to the catalytic core by a 2–4 base pair helical element, or “communication module”. Ten different ribozymes were designed, identical in sequence except for the bases in the linker domain (FIG. 32 ). (SEQ ID NOs:109–1 16)
Templates for transcription by T7 RNA polymerase were prepared for each ribozyme by PCR amplification using a set of three overlapping primer oligonucleotides. The forward, or 5′ primer TAATACGACTCACTATAGGACTTCGGCGAAAGCCGTTCGACC (SEQ ID NO:315), included the T7 RNA polymerase promoter and sequence corresponding to the 5′-proximal region of the L1 ligase catalytic core. The other two primers corresponded to sequences spanning the 3′-proximal portion of the L1 ligase core ATTCGAGATGTCCTTGGACCAAAGCCGCACCTAACCTCCTGTCTAAG (SEQ ID NO:316) and the ERK interacting domain (including sequences), respectively. RNA was synthesized by in vitro transcription (Milligan & Uhlenbeck (1989) Methods Enzymol 180, 51 –62) using the T7-MEGAshortscript™ transcription kit from Ambion, and purified by gel-filtration (to remove transcription buffer components) and/or polyacrylamide gel electrophoresis (PAGE). The purified RNAs were then quantified by their absorbance at 260 nm, and stored in TE buffer (10 mM Tris-HCI, 1 mM EDTA, pH 8.0) at −20 ° C. Radiolabeled RNAs were prepared exactly as described above, except that a-32P-UTP was included in the in vitro transcription reaction.
Example 15. Rational design and Engineering of ppERK dependent ligases.
ppERK-dependent ligase ribozymes were built on the catalytic core of the L1 ligase ribozyme of Robertson and Ellington (2000; NAR 28, 1751–1759) in which the non-conserved, stem C element was replaced with the ERK-interacting domain and joined to the catalytic core by a 2–4 base pair helical element, or “communication module”. Fourteen different ribozymes were designed, identical in sequence except for the bases in the linker domain (FIG. 41 ) (SEQ ID NO:352).
Templates for transcription by T7 RNA polymerase were prepared for each ribozyme by PCR amplification using a set of three overlapping primer oligonucleotides. The forward, or 5′ primer TAATACGACTCACTATAGGACTTCGGCGAAAGCCGTTCGACC (SEQ ID NO:315), included the T7 RNA polymerase promoter and sequence corresponding to the 5′-proximal region of the L1 ligase catalytic core. The other two primers corresponded to sequences spanning the 3′-proximal portion of the L1 ligase core ATTCGAGATGTCCTTGGACCAAAGCCGCACCTAACCTCCTGTCTAAG (SEQ ID NO:316) and the ppERK target modulation domain (including sequences), respectively. RNA was synthesized by in vitro transcription (Milligan & Uhlenbeck (1989) Methods Enzymol 180, 51–62) using the T7-MEGAshortscript™ transcription kit from Ambion, and purified by gel-filtration (to remove transcription buffer components) and/or polyacrylamide gel electrophoresis (PAGE). The purified RNAs were then quantified by their absorbance at 260 nm, and stored in TE buffer (10 mM Tris-HCl, 1 mM EDTA, pH 8.0) at −20° C. Radiolabeled RNAs were prepared exactly as described above, except that α-32P-UTP was included in the in vitro transcription reaction.
Linker-region Selection of Effector-dependent Ligases Oligonucleotides
Synthetic DNA and the DNA-RNA chimeric substrates were synthesized using standard solid-phase methodology and purified by denaturing (8M urea) polyacrylamide gel electrophoresis (PAGE). Random-sequence regions of synthetic DNA were generated using a single mixed “N” bottle on the DNA synthesizer that contains all four nucleotide phosphoramidites mixed in proportions. Variable-length regions of synthetic DNA were generated by interrupting the synthesis and removing part of the reaction mixture, re-starting the synthesis and then replacing the removed material after a subsequent interruption. Templates for transcription were generated by PCR, and the transcripts thus generated were also purified by denaturing (8M urea) polyacrylamide gel electrophoresis (PAGE). Gel-purification is followed by the localization of nucleic acids within the gel by UV-shadowing, nucleic-acid containing gel pieces are excised and the purified nucleic acids are recovered by electroelution. The following synthetic oligonucleotides were utilized:
| Oligonucleotides common to all selections: | ||
| Substrate 3 (DNA, RNA underlined) | (SEQ ID NO:321) | |
| Biotin-TEG-CATGCGACCTTACGATCAGATGACCTUGCACU | ||
| Substrate 3-specific 5′-PCR primer | (SEQ ID NO:322) | |
| CATGCGACCTTACGATCAGAT | ||
| Regeneration 5′-PCR primer | (SEQ ID NO:323) | |
| TCTAATACGACTCACTATAGGACTTCGGCGAAAGC | ||
| ERK selection-specific oligonucleotides: | ||
| Library (DNA) (random regions 3–5 nucleotides in length) | (SEQ ID NO:324) | |
| GGACTTCGGCGAAAGCCGTTCGACCNNN(N)(N)AAGGAGGATTTCCGAAAGCGGCTA | ||
| CGGTCCGCCNNN(N)(N)CTTAGACAGGAGGTTAGGTGCGTAGGTAACCGATAGTTCC | ||
| G | ||
| Effector (2′-O-methyl DNA), 3′-PCR primer (DNA) and RT primer (DNA) | (SEQ ID NO:325) | |
| CGGAACTATCGGTTACCTAC | ||
| B ppERK selection-specific oligonucleotides: | ||
| Library | (SEQ ID NO:326) | |
| GGACTTCGGCGAAAGCCGTTCGACCNNNN(N)(N)CAGACGCTAGCGAATTGGTTCCT | ||
| CGAAAGGGGAAAGCGTTATTAAGAAACCAAAATGNNNN(N)(N)CTTAGACAGGAGG | ||
| TTAGGTGCGTCAATGCTGCAAGTTACTG | ||
| Effector (2′-O-methyl DNA), 3′-PCR primer (DNA) and RT primer (DNA) | (SEQ ID NO:327) | |
| CAGTAACTTGCAGCATTGAC | ||
| bFGF selection-specific oligonucleotides: | ||
| Library (random regions 5–7 nucleotides in length) | (SEQ ID NO:328) | |
| GGACTTCGGCGAAAGCCGTTCGACCNNNNN(N)(N)GCAACGCTACAGACAAG | ||
| TGCANNNNN(N)(N)CTTAGACAGGAGGTTAGGTGCCCGAGTTGTTCGAACGAGAC | ||
| Effector (2′-O-methyl DNA), 3′-PCR primer (DNA) and RT primer (DNA) | (SEQ ID NO:329) | |
| GTCTCGTTCGAACAACTCGG | ||
| Thrombin selection-specific oligonucleotides | ||
| Library | (SEQ ID NO:330) | |
| GGACTTCGGCGAAAGCCGTTCGACCNNNN(N)(N)ATCGAAGTTAGTAGGNNN(N)(N)C | ||
| TTAGACAGGAGGTTAGGTGCGTCAATCGATTGCAGATCCG | ||
| Effector (2′-O-methyl DNA), 3′-PCR primer (DNA) and RT primer (DNA) | (SEQ ID NO:331) | |
| CGGATCTGCAATCGATTGAC |
Nucleic Acid Sensor Molecules Modulated by Native ERK Enzyme.
Hammerhead-derived nucleic acid sensor molecules (88 nucleotides in length) were selected from populations of nucleic acid molecules with randomized linker domain in stem II, as shown in FIG. 19 . The Table in FIG. 19 depicts illustrative linker-domain sequences of several of the ERK-modulated nucleic acid sensor molecules isolated from in vitro selection linker randomized clones (described in detail in Example 11). Each NASM displays a varying degree of modulation driven by addition of equal amounts (1 uM) native ERK. Individual ERK-modulated cis-hammerhead nucleic acid sensor molecules are shown in FIG. 19 . Clones 1-14, 1-13, 1-2, 1-6, 2-7, 2-2, 2-3, 2-13, 2-14, and 2-20 were tested in target modulation assays as described previously. The NASM's relative dependence on ERK is denoted in the Table in FIG. 19 by the extent of activity of the ribozyme in the presence of ERK protein.
The time course of signal generation in the presence of nonphosphorylated ERK, phosphorylated ERK, and in the absence of protein is determined by measuring signal released over time by a radiolabeled nucleic acid sensor molecule. Significant amounts signal, corresponding to cleavage of the nucleic acid sensor molecule is observed over time only with the nonphosphorylated ERK. Clones1-2, 1-13 and 1-14 all display sensitivity to ERK concentration, as shown in FIGS. 20A , B and C. However, of these three clones, clone 1-14 displays the greatest enhancement in activity upon addition of ERK. Clone 1-14 is able to differentiate between varying concentrations of ERK, as indicated by the dose-dependent change in the activity of clone-14 upon the addition of 5, 10, 20, 50 and 100 nM ERK (FIG. 21 ).
ERK-modulated NASM-based Competitive Inhibition Assays, & Target-protein Specific Profiling Biosensors.
The specificity of the interaction between clone 1-14 and ERK was assessed by measuring the activity of clone 1-14 in the presence of 50 nM ERK and increasing concentrations of known protein kinase inhibitors. The kinase inhibitors staurosporine and 5-iodo-tubercidin are compounds that are known bind to in an ATP-substrate competitive manner to ERK and to modulate ERK kinase catalytic activity, decreasing its ability to phosphorylate other proteins. We tested whether kinase inhibitors would compete directly for the ATP-binding site in ERK, and thereby block NASM activation by ERK. As shown in FIG. 22A , increasing concentrations of the compounds staurosporin and or ITU disrupt the interaction between clone 1-14 and ERK protein, suppressing the activation of the nucleic acid sensor molecule. We have used NASM-based assay to confirm the known kinase-inhibitory IC50 values of staurosporin and ITU (5 and 1 uM, respectively). This result indicates that clone 1-14 recognizes free unliganded ERK and is not modulated by the ERK-stuaroporine or ERK-ITU complex. Since, staurosporin or ITU (ATP analogs) are general kinase inhibitors, and bind to the active/ATP binding sites of kinases, these data suggest that the NASMs either bind directly to the kinase active site, or are exquisitely sensitive to the conformational state of the enzyme. Hence, when saturating levels of the kinase inhibitors are present (10 uM) in the NASM-assay, along with uM levels of ERK, the nucleic acid sensor molecule does not signal the presence of ERK protein. Thus, the ERK-modulated NASMs are used as general HTS screening reagents for the discovery of small molecule drug leads.
Similar results to those described above for the hammerhead-derived NASMs of FIG. 19 have been obtained with ERK-modulated L1-ligase NASMs described in detail in Example 13. FIG. 58 , shows additional staurosporine competitive NASM assay results using an L1-ligase-derived NASM which is also modulated by ERK protein. Additional modifications of the 3-piece L1-ligase NASM (c.f., FIG. 36 , constructs 27 and constructs 28) render these biosensors suitable for cellular assays as intracellular biosensors (c.f., FIG. 37 and the detailed description of the 3-piece, and 1-piece ligases described in detail in Example 22). Thus, ERK-modulated nucleic acid sensor molecules are used for cell-based drug discovery and drug candidate screening.
The data in FIG. 22B and FIGS. 57A and 57B indicates that ERK NASMs (clone 1-14 and constructs 27 and 28) are modulated specifically by ERK only in its fully active, and not by ppERK, or by related homologues and MAP Kinase pathway molecules, For example clone 1-14 recognizes only ERK, and not related kinase MEK. Hence, NASMs and more specifically, the ERK and ppERK NASMs, are shown here to be useful specific protein profiling biosensors.
A compilation of novel hammerhead ERK-modulated nucleic acid sensor molecule sequences are disclosed in Table 11.
| TABLE 11 | |
| Cis-hammerhead nucleic acid sensor molecules | |
| Sequences of 157 ERK activated cis-hammerhead clones. | |
| SEQ ID | ||
| Sequence | NO: | |
| |
140 | |
| GGGCGACCCUGAUGAGGGAGGCUAAGGAGGAUUUCCGAAAGCGGCUACGGUCCGCCAGUUGCGCGAAACGGUGAAAGCCGUAGGUUGCC | 141 | |
| GGGCGACCCUGAUGAGGGUUGCUAAGGAGGAUUUCCGAAAGCGGCUACGGUCCGCCAGUGGCCAAACAGNGAAANNNGNANGUGGNC | 142 | |
| GGGCGACCCUGAUGAGUACGGCUAAGGAGGAUUUCCGAAAGCGGCUACGGUCCGCCAGUAGAACGAAACGGUGAAAGCCGUAGGUUGCC | 143 | |
| GGGCGACCCUGAUGAGNCAUGCUAAGGAGGAUUUCCGAAAGCGGCUACGGUCCGCCAGUAACNCGAAACGGUGAAAGCCGUAGGUUGCC | 144 | |
| GGGCGACCCUGAUGAGUUGCGCUAAGGAGGAUUUCCGAAAGCGGCUACGGUCCGCCAGUAUAACGAAACGGUGAAAGCCGUAGGUUGCC | 145 | |
| GGGCGACCCUGAUGAGUGUUGCUAAGGAGGAUUUCCGAAAGCGGCUACGGUCCGCCAGUUCUACGAAACGGUGAAAGCCGUAGGUUGCC | 146 | |
| GGGCGACCCUGAUGAGUAAUGCUAAGGAGGAUUUCCGAAAGCGGCUCGGGCCGCCAGUUAGGCCAAACGGNGAAAGCCCGUANGNUGCC | 147 | |
| GGGCGACCCUGAUGAGCUCUGCUAAGGAGGAUUUCCGAAAGCGGCUACGGUCCGCCAGUAUGGCCGAAACGGUGAAAGCCGUAGGUUGCC | 148 | |
| GGGCGACCCUGAUGAGGCAUGCUAAGGAGGAUUUCCGAAAGCGGCUACGGUCCGCCAGUGCGGCGAAACGGUGAAAGCCGUAGGUUGCC | 149 | |
| |
150 | |
| GGGCGACCCUGAUGAGUACGGCUNAGGAGGAUUUCCGAAGCGGNUACUGGUCCGNCAGUNANACGAAACNGNGAAAGCCGUAGGUUGCC | 151 | |
| GGGCGACCCUGAUGAGCCAUGCUAAGGAGGAUUUCCGAAAGCGGCUACUGGUCCGCCAGUACUACAGAAACGGUGAAAGCCGUAGGUUGCC | 152 | |
| GGGCGACCCUGAUGAGUGACGCUAAGGAGGAUUUCCGAAAGCGGCUACUGGUCCGCCAGUUGCGCGAAACGGUGAAAGCCGUAGGUUGCC | 153 | |
| GGGCGACCCUGAUGAGUCUGGCUAAGGAGGAUUUCCGAAAGCGGCUACUGGUCCGCCAGUUUCGCGAAACGGUGAAAGCCGUAGGUUGCC | 154 | |
| GGGCGACCCUGAUGAGNANCGCUAAGGAGGAUUUCCGAAAGCGGCUACUGGUCCGCCAGUGAUACGAAACGGUGAAAGCCGUAGGUUGCC | 155 | |
| GGGNGACCCUGANGANNGACGCUNAAGAGGAUUUCCGAAGCGGCUACUAGUCCNCAUUGNACCGAAACGGCCUAAAGCCGGAGGUUGCC | 156 | |
| GGGCGACCCUGAUGAGAUACGCUAAGGAGGAUUUCCGAAAGCCGGNUACGGUCCGACAGUCUAGCCCAAACGGUGAAAGCCGUAGGUUGUCC | 157 | |
| GGGCGACCCUGAUGAGUGGCGCUAAGGAGGAUUUCCGAAAGCGGCUACGGUCCGCCAGUUCAACGAAACGGUGAAAGCCGUAGGUUGCC | 158 | |
| GGGCGACCCUGAUCAGCUGUGCUAAGGAGGAUUUCCGAAAGCGGCUACGGUCCGCCAGUUCGACGAAACGGUGAAAGCCGUAGGUUGCC | 159 | |
| GGGCGACCCUGAUGAGGCUGGCUAAGGAGGAUUUCCGAAAGCGGCUACGGUCCGCCAGUUAGACGAAACGGUGAAAGCCGUAGGUUGCC | 160 | |
| GGGCGACCCUGAUGAGAACUGCUAAGGAGGAUUUCCGAAAGCGGCUACGGUCCGUCAGNUACUCGAAACGGUGAAAGCCUGUAGGUUGCC | 161 | |
| GGGCGACCCUGAUGAGNGCUGCUAAGGAGGAUUUCCGAAAGCGGCUACGGUCCGCCAGUGCUGCGAAACGGUGAAAGCCGUAGGUUGCC | 162 | |
| GGGCGACCCUGAUGAGNANGGCUAAGGAGGAUUUCCGAAAGCGGCUACGGUCCGCCAGUAAUGCGAAACGGUGAAAGCCGUAGGUUGCC | 163 | |
| GGGCGACCCUGAUGAGNUNUGCUAAGGAGGAUUUCCGAAAGCGCUUNCGGCCNCACNACNCCGAAACNGNGAAANNCCGNANGUGGNC | 164 | |
| GGGCGACCCUGAUGAGGAGUGCUAAGGAGGAUUUCCGAAAGCGGCUACGGUCCGCCAGUUAUACGAAACGGUGAAAGCCGUAGGUUGCC | 165 | |
| GGGCGACCCUGAUGAGACCUGCUAAGGAGGAUUUCCGAAAGCGGCUACGGUCCGCCAGUCNCACGAAACGGUGAAAGCCGUAGGUUGCC | 166 | |
| GGGCGACCCUGAUGAGGCGCGCUAAGGAGGAAUUCCGAAAGCGGCUACGGUCCGCCAGUGUAACGAAACGGUGAAAGCCGUAGGUUGCC | 167 | |
| GGGCGACCCUGAUGAGUAACGCUAAGGAGGAUUUCCGAAAGUCGGGUACGGUCCGCCAGUUUAUCGAAACGGNGAAAGCCGUAGGUUGCC | 168 | |
| GGGCGACCCUGAUGAGNUACGCUAAGGAGGAUUUCCGAAAGCGGCUACGGUCCGCCAGUGUCACGAAACGGUGAAAGCCGUAGGUUGCC | 169 | |
| GGGCGACCCUGAUGAGUUGCGCUAAGGAGGAUUUCCGAAAGCGGCUACGGUCCGCCAGUUACGCGAAACGGUGAAAGCGUANGNUGCC | 170 | |
| GGGCGACCCUGAUGAGUNUNGCUAAGGAGGAUUUCCGAAAGCGGCUACGGUCCGCCAGUNNUACGAAACGGUGAAAGCCGUAGGUUGCC | 171 | |
| GGGCGACCCUGAUGAGACUG-CUAAGGAGGAUUUCCGAAAGCGGCUACGGUCCGCCAGUUGGACGAAACGGUGAAAGCCGUAGGUUGCC | 172 | |
| GGGCGACCCUGAUGAGGUGCGCUAAGGAGGAUUUCCGAAAGCGGCUACGGUCCGCCAGACGUCGAAACGGUGAAAGCCGUAGGUUGCC | 173 | |
| GGGCGACCCUGAUGAGUAUUGCUAAGGAGGAUUUCCGAAAGCGGCUACGGUCCGCCAGUUUAGCGAAACGGUGAAAGCCGUAGGUUGCC | 174 | |
| GGGCGACCCUGAUGAGUGGCGCUAAGGAGGAUUUCCGAAAGCGGCUACGGUCCGCCAGUUAACCGAAACGGUGAAAGCCGUAGGUUGCC | 175 | |
| GGGCGACCCUGAUGAGCUCAGCUAAGGAGGAUUUCCGAAAGCGGCUACGGUCCGCCAGUUUGGCGAAACGGUGAAAGCCGUAGGUUGCC | 176 | |
| GGGCGACCCUGAUGAGCCUNGCUAAGGAGGAUUUCCGAAAGCGGCUACGGUCCGCCAGUNACUGCGAAACGGUGAAAGCCGUAGGUUGCC | 177 | |
| GGGCGACCCUGAUGAGUCAUGCUAAGGAGGAUUUCCGAAAGCGGCUACGGUCCGCCAGUUUUGCGAAACGGUGAAAGCCGUAGGUUGCC | 178 | |
| GGGCGACCCUGAUGAGAACCGCUAAGGAGGAUUUCCGAAAGCGGCUACGGUCCGCCAGUUAUGCGAAACGGUGAAAGCCGUAGGUUGCC | 179 | |
| |
180 | |
| GGGCGACCCUGAUGAGUGACGCUAANGAGGAUUUCCGAAAGCGGCUACGGUCCNCCAGUUUAACGAAACGGUGAAAGCCGUANGUUGCC | 181 | |
| GGGCGACCCUGAGAGUACNNGCUAAGGAGGAUUUCCGAA-GCGGCUACGGUCCGCCAGUNNAACGAAACGGUGAAAGCCGUAGGUUGCC | 182 | |
| GGGCGACCCUGAGGAGCUCAGCUAAGGAGGAUUUCCGAAAGCGGCUACGGUCCGCCAGUCAGUACGAAACGGUGAAAGCCGUAGGUUGCC | 183 | |
| GGGCGACCCUGAGAGGAUA-GCUAAGGAGGAUUUCCGAA-GCGGCUACGGUCCGCCAGUACAACGAAACGGUGAAAGCCGUAGGUUGCC | 184 | |
| GGGCGACCCUGAUGAGUAGUGCUAAGGAGGAUUUCCGAAAGCGGCUACGGUCCGCCAGUGUGACGAAACGGUGAAAGCCGUAGGUUGCC | 185 | |
| GGGCGACCCUGAUGAGUCGUGCUAAGGAGGAUUUCCGAAAGCGGCUACGGUCCGCCAGUUGAACGAAACGGUGAAAGCCGUAGGUUGCC | 186 | |
| GGGCGACCCUGNNGAGAACUGCUAAGGAGGAUUUCCGAAAGCGGCUACGGUCCGCCAGUUAUGCGAAACGGUGAAAGCCGUANGUUGCC | 187 | |
| GGGCGACCCUGANGAGNUCNGCUNAGGAGGAUUUCCGAAAGCGGCUACGGAGCCGUCAGUAUUGCGAAACGGCGAAAGCCGUAGGUUGNC | 188 | |
| GGGCGACCCUGAUGAGUAACGCUAAGGAGGAUUUCCGAAAGCGGCUACGGUCCGCCAGUAUUGCGAAACGGUGAAAGCCGUAGGUUGCC | 189 | |
| GGGCGACCCUGAUGAGCUUAGCUAAGGAGGAUUUCCGAAAGCGGCUACGGUCCGCCAGUGAAACGAAACGGUGAAAGCCGUAGGUUGCC | 190 | |
| GGGCGACCCUGAUGAGNCCAGCUAAGGAGGAUUUCCGAAAGCGGCUACGGNCCGCCAGUUACCCGAAACGGNGAAAGCCGUANGUUGCC | 191 | |
| GGGCGACCCUGAUGAGNNCAGCUAAGGAGGAUUUCCGAAAGCGGCUACGGNCCGCCAGUUACCCGAAACGGNGAAAGCCGUAGGUUGCC | 192 | |
| GGGCGACCCUGAUGAGCUUCGCUAAGGAGGAUUUCCGAAAGCGGCUACGGUCCGCCAGUUAGUCGAAACGGUGAAAGCCGUAGGUUGCC | 193 | |
| GGGCGACCCUGAUGAGCNNNGCUAAGGAGGAUUUCCGAAAGCGGCUACGGUCCGCCAGUUNUNCGAAACGGUGAAAGCCGUAGGUUGCCU | 194 | |
| GGGCGACCCUGAUGAGACCUGCUAAGGAGGAUUUCCGAAAGCGGCUACGGUCCGCCAGUUAAUCGAAACGGUGAAAGCCGUAGGUUGCC | 195 | |
| GGGCGACCCUGAUGAGCACUGCUAAGGAGGAUUUCCGAAAGCGGCUACGGUCCGCCAGUCGCGCGAAACGGUGAAAGCCGUAGGUUGCC | 196 | |
| GGGCGACCCUGAUGAGAUCUGCUAAGGAGGAUUUCCGAAAGCGGCUACGGUCCGCCAGUNACGCGAAACGGUGAAAGCCGUAGGUUGCC | 197 | |
| GGGCGACCCUGA-GAGUUUUGCUAAGGAGGAUUUCCGAA-GCGGCUACGGUCCGCCAGUAAUCCGAAACGGUGAAAGCCGUAGGUUGCC | 198 | |
| GGGCGACCCUGN-GAGUUUAGCUAAGGAGGAUUUCCGAA-GCGGCUACGGUCCGCCAGUUUAGCGAAACGGUGAAAGCCGUAGGUUGCC | 199 | |
| GGGCGACCCUGNNGAGGCGUGCUAAGGAGGAUUUCCGAA- |
200 | |
| GGGCGACCCUGAUGAGUACUGCUAAGGAGGAUUUCCGAA- |
201 | |
| GGGCGACCCUGAUGAGCAGAGCUAAGGAGGAUUUCCGAAAGCGGCUACGGUCCGCCAGUUUUACGAAACGGUGAAAGCCGUAGGUUGCC | 202 | |
| GGGCGACCCUGAUGAGCAUAGCUAAGGAGGAUUUCCGA-AGCGGCUACGGUCCGCCAGUUGCACGAAACGGUGAAAGCCGUAGGUUGCC | 203 | |
| ---------UGNAGAGCGUUGCUAAGGAGGAUUUCCGAAAGC-GCUACGUCCGCCAGUAACACGAAACGGUGAAAGCCGUAGGUUGCCUU | 204 | |
| GGGCGACCCUGAUGAGCAACGCUAAGGAGAAUUUCCGAAAGCGGCUACGGUCCGCCAGUUACCCGAAACGGUGAAAGCCGUAGGUUGCC | 205 | |
| GGGCGACCCUGAUGAGGGAGGCUAAGGAGGAUUUCCGAAAUCGGCUACGGUCCGCCAGUCAUACGAAACGGUGAAAGCCGUAGGUUGCC | 206 | |
| GGGCGACCNUGAUGAGCUUCGCUAAGGAGGAUUUCCGAAAGCGGNUACGGUCCGCCAGUGAUUCGAAACGGUGAAAGCCGUAGGUUGCC | 207 | |
| GGGCGACCCUGAUGAGACCGGCUAAGGAGGAUUUCCGAAAGCGGNUACGGUCCGCCAGUCUAUCGAAACGGUNAAAGCCGUAGGUUGCC | 208 | |
| GGGCGACCNUGAUGAGUUAUGCUAAGGAGGAUUUCCGAAAGCGGNUACGGUCCGCCAGUGAAUCGAAACGGUGAAAGCCGUAGGUUGCC | 209 | |
| GGGCGACCNUGAUGAGUAUAGCUAAGGAGGAUUUCCGAAAGCGGNUACGGUCCGCCAGUCAGACGAAACGGUGAAAGCCGUAGGUUGCC | 210 | |
| GGGCGACCNUGAUGAGUNGCGCUAAGGAGGAUUUCCGUAAGCGGCUACGGUCCGCCAGUUAUNCGAAACGGUGAAAGCCGUAGGUUGCC | 211 | |
| GGGCGACCCUGAUGAGCAACGCUAAGGAGGAUUUCCGAAAGCGGCUACGGUCCGCCAGUACCACGAAACGGUGAAAGCCGUAGGUUGCC | 212 | |
| GGGCGACCCUGAUGAGUCGCGCUAAGGAGGAUUUCCGAAAGCGGCUACGGUCCGCCAGUNAANCGAAACGGUGAAAGCCGUAGGUUGCC | 213 | |
| GGGCGACCCUGAUGAGUCACGCUAAGGAGGAUUUCCGAAAGCGGNUACGGUCCGCCAGUUACACGAAACGGUGAAAGCCGUAGGUUGCC | 214 | |
| GGGCNACCUCUGAGUAGCAGGCUAAGNAGNAUUUCCGNAANCGGNUACGGUCNGCCAGUAUGACGAAACGGUNAAAGCCGUAGGUUGCC | 215 | |
| GGGCGACCCUGAUGAGCUGUGCUAAGGAGGAUUUCCGAAAGCGGNNACGGUCCGCCAGUUUCCCGAAACGGUGAAAGCCGUAGGUUGCC | 216 | |
| GGGCNACCUUGAUGAGCANNGCUAAGNAGUAUUUCCNNAANCGGAUACGGUCCGCCAGUNNNNCGNAACGGUNAAAGCCGUAGGUUGCC | 217 | |
| GGGCGACCCUGAUGAGCAUAGCUAAGGAGGAUUUCCGAAAGCGGCUACGGUCCGCCAGUACGACGAAACGGUGAAAGCCGUAGGUUGCC | 218 | |
| GGGCGACCNUGAUGAGCUCUGCUAAGGAGGAUUUCCGAAAGCGGNUACGGUCCGCCAGUUCAACGAAACGGUGAAAGCCGUAGGUUGCC | 219 | |
| |
220 | |
| GGGCGACCNUGAUGAGCNUGGCUAAGGAGGAUUUCCGAAAGCGGNUACGGUCCGCCAGUGUUACGAAACGGUGAAAGCCGUAGGUUGCC | 221 | |
| |
222 | |
| GGGCNACCUUGAUGAGGUGGGNUAAGGAGUAUUUCCGAAANCGGAUACGGUCCGCCAGUAACCCGAAACGGUNAAAGCCGUAGGUUGCC | 223 | |
| GGGNGACCCUGAUGAGUAGGGCUAAGGAGGAUUUCCNAAAGCGGCUACGGUCCGCCANANGUCGAAACGGUGAAAGCCGUAGGUUGCC | 224 | |
| GGGNAGACUUGAUGAGUAGCGCUAAGGAGNAUUUCCGAAANCGGNUACGGUCNGCCAGUUGAGCGCAACGGUGAAAGCCGUAGGUUGCC | 225 | |
| GGGCGACCCUGAUGAGCUCUGCUAAGGAGGAUUUCCGAAAGCGGCUACGGUCCGCCAGUUGGUCGAAACGGUGAAAGCCGUAGGUUGCC | 226 | |
| GGGCGACCCUGAUGAGGGCUGCUAAGGAGGAUUUCCGAAAGCGGCUACGGUCCGCCAGUUAAACGAAACGGUGAAAGCCGUAGGUUGCC | 227 | |
| GGGNGACCCUGAUGAGCCAUGCUAACGAGNAUUUCUNAAAGCGGC-ACGGUCCGCCAGUUUCGCGAAACGGUGAAAGCCGUAGGUUGCC | 228 | |
| GGGCGACCNUGAUGAGUCACGCUAAGNAGGAUUUCCGAAAGCGGCUACGGUCCGCCAGUCUCACGAAACGGUGAAAGCCGUAGGUUGCC | 229 | |
| GGGCGACCCUGAUGAGACUUGGUAAGGAGGAUUUCCGAAANCGNNUACGGUCCGCCAUGUUUAGCGAAACGGUGAAAGCCGUAGGUUGCC | 230 | |
| GGGCGACCNUGAUGAGNUUUGCUAAGGAGGAUUUCCGAAAGCGGNUACGGUCCGCCAGUUUAUCGAAACGGUGAAAGCCGUAGGUUGCC | 231 | |
| GGGCGACCNUGAUGAGCUACGCUAAGGAGGAUUUCCGAAAGCGGNNACGGUCCGCCAGUUCCACGAAACGGUGAAAGCCGUAGGUUGCC | 232 | |
| GGGCGACCNUGAUGAGNNCNGNUAAGGAGNAUUUCCGAAAGCGGANACGGUCNGCCAGUNANCCGNAACGGUGAAAGCCGUAGGUUGCC | 233 | |
| GGGCGACCNUGAUGAGGAAUGCUAAGGAGGAUUUCCGAAAGCGGNUACGGUCCGCCAGUACAGCGAAACGGUGAAAGCCGUAGGUUGCC | 234 | |
| GGGCGACCNUGAUGAGUCCUGCUAAGGAGGAUUUCCGAAAGCGGNNACGGUCCGCCAGUAAAGCGAAACGGUGAAAGCCGUAGGUUGCC | 235 | |
| GGGCGACCCUGAUGAGUUCUGCUAAGGAGGAUUUCCGAAAGCGGNUACGGUCCGCCAGUUUUACGAAACGGUGAAAGCCGUAGGUUGCC | 236 | |
| GGGCGACCNUGAUGAGNAUNGCUAAGGAGGAUUUCCGAAAGCGGCUACGGUCCGCCAGUUANNCGAAACGGUGAAAGCCGUAGGUUGCC | 237 | |
| GGGCGACCCUGAUGAGGAAUGCUAAAGAGGAUUUCCGAAAGCGGCUACGGUCCGCCAGUUAAGCGAAACGGUGAAAGCCGUAGGUUGCC | 238 | |
| GGGCGACCCUGAUGAGCAGUGCUAAGGAGGAUUUCCGAAAGCGGCUACGGUCCGCCAGUGGAGCGAAACGGUGAAAGCCGUAGGUUGCC | 239 | |
| GGGCGACCCUGAUGAGNUAUGCUAAGGAGGAUUUCCGAAAGCGGCUACGGUCCGCCAGUNAGNCGAAACGGUGAAAGCCGUAGGUUGCC | 240 | |
| GGGCGACCCUGAUGAGCACUGCUAAGGAGGAUUUCCGAAAGCGGCUACGGUCCGCCAGUGAGACGAAACGGUGAAAGCCGUAGGUUGCC | 241 | |
| GGGCGACCCUGAUGAGCUCAGCUAAGGAGGAUU-CCGAAAGCGGCUACGGUCCGCCAGUUUCGCGAAACGGUGAAAGCCGUAGGUUGCC | 242 | |
| GGGCGACCCUGAUGAGGCUUGCUAAGGAGGAUUUCCGAAAGCGGCNACGGUCCGCCAGUCCGUCGAAACGGUGAAAGCCGUAGGUUGCC | 243 | |
| GGGCGACCCUGAUGAGCUCUGCUAAGGAGGAUUUCCGAAAGCGGCUACGGUCCGCCAGUUCGGCGAAACGGUGAAAGCCGUAGGUUGCC | 244 | |
| GGGCGACCCUGAUGAGGCAAGCUAAGGAGGAUUUCCGAAAGCGGCUACGGUCCGCCAGUUCAACGAAACGGUGAAAGCCGUAGGUUGCC | 245 | |
| GGGCGACCCUGAUGAGCGUCGCUAAGGAGGAUUUCCGAAAGCGGCUACGGUCCGCCAGUAUCUCGAAACGGUGAAAGCCGUA | 246 | |
| GGGCGACCCUGAUGAGCUUCGCUAAGGAGGAUUUCCGAAAGCGGCUACGGUCCGCCAGUUAAACGAAACGGUGAAAGCCGUAGGU | 247 | |
| GGGCGACCCUGAUGAGUGGCGCUAAGGAGGAUUUCCGAAAGCGGCUACGGUCCGCCAGUUUAACGAAACGGUGAA | 248 | |
| GGGCGACCCUGAUGAGACUCGCUAAGGAGGAUUUCCGAAAGCGGCUACGGUCCGCCAGUGGUACGAAACGGUGAAAGCCGUAGGU | 249 | |
| GGGCGACCCUGAUGAGUAUUGCUAAGGAGGAUUUNCCGAAAGCGGCUCACGGUGCCGCCAGUUGAGCGAAACGGUGAAAGCCUAGGUUGCC | 250 | |
| GGGCGACCCUGAUGAGCNUCGCUAAGGAGGAUUUCCGAAAGCGGCUACGGUCCGCCAGUAAUACGAAACGGUGAAAGCCGUAGGUUGC | 251 | |
| GGGCGACCCUGAUGAGCUNNGCUAAGGAGGAUUUCCGAAAGCGGCUACGGUCCGCCAGUUCNACGAAACGGUGAAAGCCGUAGGUUGCC | 252 | |
| GGGCGACCCUGAUGAGUUCGGCUAAGGAGGAUUUCCGAAAGCGGCUACGGUCCGCCAGUGAAGCGAAACGGUGAAAGCCGUAGGU | 253 | |
| GGGCGACCCUGAUGAGAUGAGCUAAGGAGGAUUUCCGAAAGCGGCUACGGUCCGCCAGUAAACCGAAACGGUGAAAGCCGUAGGUUGCC | 254 | |
| GGGCGACCCUGAUGAGAAUCGCUAAGGAGGAUUUCCGAA-GCG-CUACGGUCCGCCAGUUCCCCGAAACGGUGAAAG | 255 | |
| GGGCGACCCUGAUGAGUCACGCUAAGGAGGAUUUCCGAAAGCGGCUACGGUCCGCCAGUUGNCGCGAAACGGUGAAAGCCGUAGGUUGCC | 256 | |
| GGGCGACCCUGAUGAGCAUCGCUAAGGAGGAUUUCCGAAAGCGGCUACGGUCCGCCAGUUAAGCGAAACGGUGAAAGCCGUAGGUUGCC | 257 | |
| GGGCGACCCUGAUGAGGUCAGCUAAGGAGGAUUUCCGAAAGCGGCUACGGUCCGCCAGUUCAGCGAAACGGUGAAAGCCGUAGG | 258 | |
| GGGCGACCCUGAUGAGAAGCGCUAAGGAGGAUUUCCGAAAGCGGCUACGGUCCGCCAGUCUAGCGAAACGGUGAAAGCC | 259 | |
| GGGCGACCCUGAUGAGGCUUGCUAAGGAGGAUUUCCGAAAGCGGCUACGGUCCGCCACUUGAUCGAAACGGUGAAAGCCGUGAGGUUGCC | 260 | |
| GGGCGACCCUGAUGAGGCUGGCUAAGGAGGAUUUCCGAAAGCGGCUCACGGUCCGCCAGUCCUAACGAAACGGUGAAAGCCGUAGGUUGCC | 261 | |
| GGGCGACCCUGAUGAGCCUUGCUAAGGAGGAUUUCCGAAAGCGGCUACGGUCCGCCAGUUAGUCGAAACGGUGAAAGCCGUAGGUUGC | 262 | |
| GGGCGACCCUGAUGAGUCACGCUAAGGAGGAUUUCCGAAAGCGGCUACGGUCCGCCAGUUNCGCGAA | 263 | |
| GGGCGACCCUGAUGAGAACUGCUAAGGAGGAUUUACCGAAAGCGGCUACGGUCCGCCAGUUGCGCGAAACGGUGAAAGCCGUAGGUUGCC | 264 | |
| GGGCGACCCUGAUGAGCGACGCUAAGGAGGAUUUCCGAAAGCGGCUACGGUCCGCCAGUUGGGCGAAACGGUGAAAGCCGUAGG | 265 | |
| GGGCGACCCUGAUGAGUAACGCUAAGGAGGAUUUCCGAAAGCGGCUACGGUCCGCCAGUCAGACGAAACGGUGAAAGCCGUAGGU | 266 | |
| GGGCGACCCUGAUGAGGACUGCUAAGGAGGAUUUCCGAAAGCGGCUACGGUCCGCCAGUUACUCGAAACGGUGAAAGCCGUAGGU | 267 | |
| GGGCGACCCUGAUGAGCCGGGCUAAGGAGGAUUUCCGAAAGCGGCUACGGUCCGCCAGUUGAGCGAAACGGUGAAAGCCGUAGGUUGCC | 268 | |
| GGGCGACCCUGAUGAGCANAGCUAAGGAGGAUUUCCGAAAG | 269 | |
| GGGCGACCCUGAUGAGUUGCGCUAAGGAGGAUUUCCGAAAGCGGCUACGGUCCGCCAGUUUAGCGAAACGGUGAAAGCCGUAGGU | 270 | |
| GGGCGACCCUGAUGAGCAGCGCUAAGGAGGAUUUCCGAAAGCGGCUAGGUCCGCCAGUCUUCGAAACGGUGAAAGCCGUAGGUUG | 271 | |
| GGGCGACCCUGAUGAGUAAGGCUAAGGAGGAUUUCCGAAAGCGGCUACGGUCCGCCAGUGUUGCGAAACGGUGAA | 272 | |
| GGGCGACCCUGAUGAGCACCGCUAAGGAGGAUUUCCGAAAGCGGCUACGGUCCGCCAGUUACGCGAAACGGUGAAAGCCGUAGGUUGCC | 273 | |
| GGGCGACCCUGAUGAGGCAUGCUAAGGAGGAUUUCCGAAAGCGGCUACGGUCCGCCAGUAAGGCGAAACGGUGAAAGCCGUA | 274 | |
| GGGCGACCCUGAUGAGUUUAGCUAAGGAGGAUUUCCGAAAGCGGCUACGGUCCGCCAGUAGACCGAAACGGUGAAAG | 275 | |
| GGGCGACCCUGAUGAGAAGCGCUAAGGAGGAUUUCCGAAAGCGGCUACGGUCCGCCAGUAAUGCGAAACGGUGAAAG | 276 | |
| GGGUGACCUCUGAUAGUGUUGCUAAGGAGGGAUUUCCGAAAGCGGNUACGGUCCGCCAGUAGAGCGAAACGGUGAAAGCCGUAGGUUGCC | 277 | |
| GGGCGACCNUGAUGAGCANGCGCUAAGGAGGAUUUCCGAAAGCGGNUACGGUCCGCCAGUGACUCGAAACGGUGAAAGCCGUAGGUUGCC | 278 | |
| GGGCGACCCUGAUAGUAGCGCUAAGUAAGGAUNUUCCGAAAGCGCGCUCACGGUCCGCCAGUCUCACGANNCGGUNAAAG | 279 | |
| GGGNGACCCUGAUGAGUAUNAGCUAAGGAGGAUUUCCGAAAGCGGCUACGGNCCGCCAGUAAUGNGAAACGGUGAAAGCCGUAGGUUGCC | 280 | |
| GCGCGACCUUGAUGAAGGNCAGNUAAGGAGGAUUUCCGAAAGCGGNUACGGUCAGCCAGUGGCACGAAACGGUGAAAGCCGUAGGUUGCC | 281 | |
| GGGCGACCCUGAUGAGCAUGCUAAGGAGGAUUUCCGAAAGCGGCUACGGUCCGCCAGUUAGUCGAAACGGUGAAAGCCGUAGGUUGCC | 282 | |
| GGGCGACCCUGAUGANNGCUGNUAGGAGGAUUUCCGAAANUGCUUCUGGCCCGCANUUANNCCGAACGGGCNAAANCGAANGGUGNC | 283 | |
| GGGCGACCCUGAUGAGUAGGCUAAGGAGGAUUUCGAAAGCGGCUACGGUCCGCCAGUGUGCCGAA | 284 | |
| GGGCGACCCUGCUGAGCNACGCUANGAGGAUUUCCGAAAGCGGCUACGGNCCGCCAGUCNGACGAAACGGUGAAAGCCGUAGGUUGCC | 285 | |
| Construct 1-14 | ||
| GGGCGACCCUGAUGAGGGUCGCUAAGGAGGAUUUCCGAAAGCGGCACGGUCCGCCAGACGUCGAAACGGUGAAAGCCGUAGGUUGCC | 286 | |
| Construct 1-13 | ||
| GGGCGACCCUGAUGAGUCUUCUAAGGAGGAUUUCCGAAAGCGGCACGGUCCGCCAGUACGUCGAAACGGUGAAAGCCGUAGGUUGCC | 287 | |
| Construct 1-2 | ||
| GGGCGACCCUGAUGAGCCUUCUAAGGAGGAUUUCCGAAAGCGGCACGGUCCGCCAGACGUCGAAACGGUGAAAGCCGUAGGUUGCC | 288 | |
| Construct 1-6 | ||
| GGGCGACCCUGAUGAGUCAUGCUAAGGAGGAUUUCCGAAAGCGGCACGGUCCGCCAGACGUCGAAACGGUGAAAGCCGUAGGUUGCC | 289 | |
| Construct 2-7 | ||
| GGGCGACCCUGAUGAGCCUUGCUAAGGAGGAUUUCCGAAAGCGGCACGGUCCGCCAGUCAGUCGAAACGGUGAAAGCCGUAGGUUGCC | 290 | |
| Construct 2-2 | ||
| GGGCGACCCUGAUGAGCCUCGCUAAGGAGGAUUUCCGAAAGCGGCACGGUCCGCCAGCUAGCGAAACGGUGAAAGCCGUAGGUUGCC | 291 | |
| Construct 2-3 | ||
| GGGCGACCCUGAUGAGAACUGCUAAGGAGGAUUUCCGAAAGCGGCACGGUCCGCCAGUUUAACGAAACGGUGAAAGCCGUAGGUUGCC | 292 | |
| Construct 2-13 | ||
| GGGCGACCCUGAUGAGUAAAGCUAAGGAGGAUUUCCGAAAGCGGCACGGUCCGCCAGUCUGGCGAAACGGUGAAAGCCGUAGGUUGCC | 293 | |
| Construct 2-14 | ||
| GGGCGACCCUGAUGAGUUUUGCUAAGGAGGAUUUCCGAAAGCGGCACGGUCCGCCAGUGAUCCGAAACGGUGAAAGCCGUAGGUUGCC | 294 | |
| Construct 2-20 | ||
| GGGCGACCCUGAUGAGGCGAGCUAAGGAGGAUUUCCGAAAGCGGCACGGUCCGCCAGUUUAACGAAACGGUGAAAGCCGUAGGUUGCC | 295 | |
These results demonstrate that the nucleic acid sensor molecule is specific for the non-phosphorylated form of the ERK.
Cis-hammerhead-derived Nucleic Acid Sensor Molecules Activated by ppERK
A stem-selection library of hammerhead-derived nucleic acid sensor molecules modulated by ppERK is shown in FIG. 23A . ppERK-modulated nucleic acid sensor molecules were designed to by joining ppERK a target modulation domain (TMD) to a hammerhead core sequence via a linker region. FIG. 23A shows the general structure of ppERK-modulated hammerhead ribozyme with the linker region depicted as a randomized sequence (N6). Individual ppERK dependent cis hammerhead RNA sequences are shown in FIG. 23B .
Characterization of the ERK and ppERK Modulated L1-Ligase Derived NASMs
A template for an ERK dependent ligase is shown in FIG. 31 . FIG. 32 discloses the different clones of ERK dependent ligases based on this template. The ERK dependence of these clones is shown in FIG. 33 . Constructs 17 and 19 are particularly sensitive to 2μM ERK. Construct 19, also known as Clone E, was tested to see if it could be used to detect increasing concentrations of ERK. Construct 19 was found to have a distinct signal at 1 μM, 100 nM, and 10 nM ERK. Time dependency was also tested for Construct 19 as shown in FIG. 34 . Increasing signal from Construct 19 could be seen at 1, 2, 3, and 4 hours. Concentration dependence of Construct 19 (Clone E) is also shown in the graph in FIG. 35 . Construct 19 can differentiate between different concentrations of ERK. Two formats that can be used with nucleic acid sensor molecule ligases are the 3-piece ligase platform, and the 1-piece ligase platform, both shown in FIG. 36 . The different platforms allow the nucleic acid sensor molecules to be used in different applications. For example, the 3-piece could be used in vitro, while the 1 -piece could be used in vivo, even intracellularly. The performance of these two formats is shown in FIG. 37 . There is also a 2-piece platform shown generally in FIG. 38 and shown as ERK regulated 2-piece ligases as shown in FIG. 39A . The 2-piece platform of Construct 19 is also ERK dependent as shown in FIG. 39B .
Ligase nucleic acid sensor molecules can be used in the presence of cell extracts. Construct 19 shows ERK activation dependence in the presence of 50% HeLa cell extract as shown in FIG. 40 .
Ligase based nucleic acid sensor molecules were also found that were specifically activated by ppERK. FIG. 41 shows a template for the ppERK sensitive ligase. FIG. 42 show the specific sequences left generalized in FIG. 41 . ppERK sensitivity was shown in the clones described FIG. 57 shows activation of 3-piece Construct 19 (DG.20.58E) (ERK2-dependent) (SEQ ID NO:111) and TK.16.118.M (ppERK2-dependent) (SEQ ID NO:123) ligases in the presence of purified proteins. Ligation assays (10 mM MgCl2, 100 mM NaCl, 30 mM Tris, pH 7.5) were performed at room temperature for 1 hour, using 1 μM ligase RNA, 1 μM effector oligonucleotide, 2 μM substrate oligonucleotide and 1 μM protein. RNAs were incubated in the presence of: (A) purified ERK, in either its non-phosphorylated or diphosphorylated form; or (B) other members of the MAP kinase pathway (Ras, MEKI and p38), and ricin. Ligase activity was measured in solution, using real-time RT-PCR detection.
It has been shown that Construct 19 still has activity in low magnesium ion. In one embodiment of the invention, these nucleic acid sensor molecules can be used in cell extracts and intracellularly, to detect ppERK. There is very low magnesium ion concentrations in these environments, so it is important that these nucleic acid sensor molecules maintain function even in low concentrations of magnesium ion.
Amplicon Detection
Amplicon dependent nucleic amplification is a high-throughput method for cell or tissue profiling of proteins and metabolites. The method can include using real-time PCR to follow the activity of nucleic acid sensor molecules over time to follow the changing concentrations of a protein or metabolite.
The method can also comprise the use of multiplexed chips. A chip can be exposed to a sample solution containing proteins or metabolites to be analyzed. Using multiple nucleic acid sensor molecules on one chip, the concentrations of many analytes can be shown simultaneously. This can also be extended to cellular assays as shown in FIG. 72 .
TaqMan can also be used in Protein-PCR, as shown in FIG. 58 . FIG. 58 shows solution-based detection of ligase activity using real-time RT-PCR. Ligation reactions (10 mM MgCl2, 100 mM NaCI, 30 mM Tris, pH 7.5) were performed for 0.5–2 hours at room temperature using 1 μM 3-piece construct 19 (DG.20.58E), (SEQ ID NO:111) ligase, 2 μM effector oligonucleotide, 2 μM substrate oligonucleotide and purified ERK protein. Part A shows the effect of 293 cell extracts on the ERK concentration dependence of ligase activity. The increase in ligation product observed with increasing concentrations of ERK (0–3.2 μM) is shown in the presence of buffer only (circles) or buffer containing 10% 293 cell extract (squares). (inset) The ERK2 concentration dependence of ligation is shown as the decrease in cycles of amplification required for detection of ligase product RNA, as measured by real-time RT-PCR. In Panel B ligation in the presence of 1 μM ERK and increasing concentrations of the kinase inhibitor staurosporine is shown. ERK nucleic acid sensor molecules can be used to detect ERK in a concentration dependent manner even in the presence of 293 cell extract. This detection is sensitive to the presence of staurosporine, a kinase inhibitor, which indicates that the activity of ERK is important to the detection of ERK by the nucleic acid sensor molecule.
Amplicon dependent nucleic acid amplification technique can be used to show the downstream effects of EGF and MEK inhibitor administration in a cell. The diphosphorylated ERK is detected in the presence of EGF and not in the presence of the MEK inhibitor as would be expected. This technique can be used to screen other substances for their ability to have ERK phosphorylated. In one embodiment, this technique could be used to screen for carcinogens in certain cell types.
Analysis of Radiolabeled Ligation Products in 3,2,1-piece Systems.
The ERK-modulated 3-piece ligase is converted to the 1-piece ligase NASM by displacement of the effector oligonucleotide binding domain by a stable tetraloop , as depicted in FIG. 36 . The deletion of the effector oligonucleotide binding domain of construct 27 (in general), and construct 27, specifically, to generate construct 28 has no effect on the switch factor of the 1-piece ligase NASM (in comparison to the 3-piece ligase NASM), nor does it have an effect on the ERK-modulation KD value for the 1-piece ligase NASM (in comparison to the 3-piece ligase NASM), FIG. 37 . The exact sequence constraints for the displacement of the effector oligonucleotide binding domain in construct 27 to generate construct 28, were in fact delineated by the analysis obtained from the lysozyme-modulated 1-piece ligase NASMs shown in FIG. 26 . The data in FIG. 26 also indicates that the length of the stem region proximal to the tetraloop has a significant effect on ligase (e.g. self-circularization) efficiency. The self-circularizing ligase NASMs are then used as biosensors in intracellular target modulation assays, FIG. 30 . Detailed assay conditions are described in subsequent Examples.
Additionally, the ERK-modulated 3-piece ligase is converted to the 2-piece ligase NASM by linking the effector oligonucleotide substrate to the oligonucleotide substrate (FIG. 38 ), effectively creating the oligonucleotide supersubstrate, which base pairs with both the effector oligonucleotide binding domain and the oligonucleotide substrate binding domain. The 2-piece ligase NASM configuration has particular utility in chip applications, described in detail in subsequent Examples (cf., FIGS. 75 and 79 ).
Ligation reactions containing 32P-labeled ligase RNA were analyzed by 8–12% PAGE to separate unligated and ligated products, and quantified using a PhosphorImager (Molecular Dynamics). Initial rates of ligation were calculated by linear regression from plots of the increase in ligation product over time.
Analysis of ligation products can also be performed by amplicon dependent nucleic acid amplification (ADNA). Amplicon dependent nucleic acid amplification (ADNA) was performed using the TaqMan® One-Step RT-PCR protocol from the same Applied Biosystems. In a typical assay, approximately 0.7 nM ligase RNA (diluted from the EDTA-quenched ligation reaction) was mixed in 25 μL of TaqMan® One-Step master mix with 300 nM each of both the forward (5′-GCGACCTTACGATCAGATGAC (SEQ ID NO:317)) and reverse (5′-CCGCACCTAACCTCCTGTCTAA (SEQ ID NO:318)) PCR primers (Integrated DNA Technologies), and 350 nM TaqMan® fluorescent probe oligonucleotide (ERK-ligase: 5′-6FAM-AAGGAGGATTTCCGAAAGCGGCTACG-TAMRA (SEQ ID NO:319); ppERK-ligase: 5′-6FAM-CGCTAGCGAATTGGTTCCTCGAAAGG-TAMRA (SEQ IDNO:320)). RT-PCR amplification was performed in the ABI Prism™ 7000 Sequence Detection System by incubating the reaction mixes at 48° C. for 30 min to generate the cDNA complement of the ligated RNA product, followed by 40 cycles of PCR amplification. The increase in fluorescence upon amplification is quantified in units of CT (threshold cycles), equal to the number of cycles of amplification required for sample fluorescence to exceed background levels. The molar quantity of ligation product can be calculated from these data by comparison with a standard curve generated using a series of known product (ligated biosensor) concentrations.
Measurement of Affinity Between ERK Protein and ERK-dependent Nucleic Acid Sensor Molecules.
The affinity of the ERK protein target for the ERK-dependent nucleic acid sensor molecule can be measured directly, by a filter-binding assay, or indirectly, by an activity-based assay. In the direct method, increasing concentrations of ERK protein target (0–10 μM) are equilibrated with trace (<1 nM) concentrations of 32P-labeled, ERK-dependent nucleic acid sensor. The samples are drawn through a sandwich of Protran BA85 nitrocellulose (Schleicher and Schuell) and Hybond P nylon (Amersham-Pharmacia) filter papers, using a 96-well vacuum manifold. Protein and protein-bound RNA species adhere to the nitrocellulose, and free RNA to the nylon. The concentration of ERK protein/sensor complex is plotted as the fraction of the total radioactivity per sample bound to the nitrocellulose versus total ERK protein concentration. The dissociation constant (KD; FIG. 59 ) is determined as the ERK protein concentration at which 50% of the nucleic acid sensor RNA is bound to protein.
In the indirect method, the activity of the ERK-dependent nucleic acid sensor molecule is measured as a function of increasing ERK protein concentration. In a typical measurement, 50 nM nucleic acid biosensor is incubated with ERK protein (0–10 μM) for one hour at room temperature. The extent of ligation at each concentration of ERK protein is determined by real-time RT-PCR (FIG. 60 , Panels C and D). The ligation product (nM) is plotted against ERK protein concentration, and the apparent dissociation constant (Kact) is determined as the protein concentration at which the extent of ligation is half-maximal. Panels A and B show ERK-dependent ligation is determined by RT-PCR on an agarose gel containing ethidium bromide.
High Throughput Screening (HTS) Assays Using ppERK Nucleic Acid Sensor Molecules
The competitive inhibitor nucleic acid sensor molecule can be used in a HTS assay. A nucleic acid sensor molecule specific for phosphorylated ERK is used as a competitive inhibitor for ATP binding (Seiwert, Stines Nahreini et al. 2000). A competitive assay for compounds is established by incubating ERK with 10 nM nucleic acid sensor molecule in the presence of various concentrations of the inhibitors in 10 mM Tris buffer pH 7.5 containing 0.5 μg/μl tRNA and 10 mM MgCl2. The reactions are terminated by addition of EDTA and the amount of reacted nucleic acid sensor molecule has been determined.
In other embodiment, the nucleic acid sensor molecules that are sensitive for the phosphorylation state of peptides (or protein substrates) can be used in HTS assays for kinase activity. The nucleic acid sensor molecules can be generated to be specific for the phosphorylation state of substrates or its peptides. HTS assay can be performed using these substrate (Mansour, Candia et al. 1996). For example, MEK can be expressed as GST-tagged protein and purified by a standard method. The activity are measured at 30° C. under standard reaction conditions of 20 mM HEPES (pH 7.4), 2 mM dithiothreitol, 0.01% Triton X-100, 10 mM MgCl2, 0.1 mM ATP, and 1M His-tagged ERK, at concentrations of MEK, 0.5 nM, in the presence of various concentration of compounds. After incubation, the reaction is terminated by absorbing MEK with GST-column. Phosphorylation of ERK is quantified by nucleic acid sensor molecule. Alternatively, the nucleic acid sensor molecule can be used in western-blotting format (Bianchini, Radrizzani et al. 2001).
The nucleic acid sensor molecule specific for phosphoERK (ppERK) described above binds to ppERK, presumably in a competitive manner at the active site of the kinase enzyme, and inhibits the phosphorylation of the ppERK substrate by ppERK enzyme. Up to 200 nM nucleic acid sensor molecule inhibits up to 80% of the ppERK phosphorylation of ERK substrate.
In Vivo Assays Using Phosphorylation State-sensitive Nucleic Acid Sensor Molecules
The phosphorylation state sensitive ppERK nucleic acid sensor molecule is used to determine drug efficacy in vivo (e.g., tissue and cell culture). For example, T84 cells on glass coverslips are incubated in the presence and the absence of the MEK kinase inhibitor, and cells are fixed by 4% paraformaldehyde and permeabilized using 0.3% Triton X-100. The slides are incubated with FRET nucleic acid sensor molecule (Bianchini, Radrizzani et al. 2001). The localization of phosphorylated substrate can be observed using a confocal microscope.
Alternatively, phosphorylation-state-sensitive nucleic acid sensor molecule are incorporated into reporter-gene constructs. These constructs are introduced into cells, and phosphorylation of the substrates is monitored.
Nucleic acid sensor molecules made of nuclease resistant forms of hammerhead, -ligase or -hairpin ribozymes are transfected into mammalian cells using standard lipofectamine reagents or liposomal solutions known to effect internalization an cellular uptake of polynucleotides. If desired, the nucleic acid sensor molecules are attached to polypeptides such as tat or antennapoedia or the like and are transported into mammalian cells by methods known in the art.
The activity of nucleic acid sensor molecule systems is followed by changes in fluorescence if the nucleic acid sensor molecule is fluorescently tagged, i.e., is an optical nucleic acid sensor molecule or by changes in size as determined by RT-PCR.
Detection of Analytes in Crude Biological Samples.
Nucleic acid sensor molecules can also be used to detect the presence of and measure the concentration of non-nucleic acid analytes in crude biological samples as shown in FIG. 56 .
As noted above, nucleic acid sensor molecules can be created whose activity is activated in the presence of a specific target molecule. These nucleic acid sensor molecules together with any required substrates, can be combined with a complex mixture of biological origin and allowed to undergo reaction. Subsequent quantification of the product of the reaction can be used to infer the concentration of the analyte in the sample.
In a preferred embodiment, the crude biological sample is human serum or mammalian cell extract. The nucleic acid sensor molecule catalyzes self-ligation with an oligonucleotide substrate. RNAse-inhibitors such as ribonucleoside vanadyl complex can be used to prevent degradation of the product. The product of catalysis can be measured by a variety of means (e.g., a gel mobility shift assay as shown in FIG. 50 ).
Ribonucleoside vanadyl complex (RVC) can be used as a general purpose inhibitor of endogenous RNAses to enable the use of allosteric ribozymes in assays of samples containing RNAse activity (e.g. human serum, mammalian cell extracts, bacterial extracts). RVC inhibits RNA degradation mediated by generic RNAses as well as RNAse H-like activities that specifically target RNA-DNA hybrids. Inhibition of RNAse activity prevents degradation of the reaction product generated by ribozyme action that ultimately forms the basis for readout in a ribozyme-based assay. In a specific example, a lysozyme-dependent nucleic acid sensor molecule RNA with the sequence 5′ GGACCUCGGCGAAAGCUAACGUCUCAUGGCUAAAUUGCCAUGUUGCUACAAAU GAUAUGACUAGAGAGGUUAGGUGCCUCGUGAUGUCCAGUCGC (SEQ ID NO:312) is prepared through transcription off a double-stranded DNA template using T7 polymerase (Ambion MegaShortscript kit, Ambion, Austin, Tex.), including trace amounts of [alpha-32P]UTP. For the ligation reaction, 1 μM nucleic acid sensor molecule RNA, 2 μM DNA effector oligo 5′ GCGACTGGACATCACGAG (SEQ ID NO:313) and 2 μM oligonucleotide substrate 5′ GTACGATGCGATGCTAGCGATTGTTgugcacu (SEQ ID NO:314) (DNA: upper case; RNA: lower case) were incubated in the presence or absence of 1 μM hen egg white lysozyme in reaction buffer (50 mM Tris pH 7.4, 100 mM KCI, 10 mM MgCl2) as previously described (Robertson M P & Ellington A D, Nature Biotechnol. 2001, 19, 650–655). HeLa extract is added to some of the samples (10% v/v), plus one of various RNase inhibitors (human placenta RNase inhibitor (Sigma, St. Louis, Mo.), RNasin (Ambion, Austin, Tex.) and vanadyl ribonucleoside complex, RVC, (Sigma, St. Louis, Mo.)). After 60 min at room temperature, the reaction is stopped by addition of loading buffer containing formamide, and the samples are analyzed by electrophoresis on a 6% denaturing gel, followed by Phosphorimager scanning (FIG. 51 , left). The HeLa extract samples that contain protein-based RNase inhibitors show significant broadening of the precursor RNA band compared to a buffer-only control, suggesting RNase H degradation where the RNA is bound to the DNA effector oligonucleotide. The sample containing the VRC RNase inhibitor does not show any significant degradation. All of the samples show lysozyme-dependent product formation. To further test this hypothesis, additional test are done with an analog of the nucleic acid sensor molecules where the oligonucleotide effector domain is deleted (5′ GGACCUCGGCGAAAGCUAACGUCUCAUGGCUAAAUUGCCAUGUUGCUACAAAU GAUAUGACUAGAGAGGUUAGGUGC) (SEQ ID NO:332) under otherwise identical conditions (FIG. 51 , right). No broadening of the RNA bands is observed, suggesting that the RNase activity was indeed specific to the RNA/DNA hybrid region. In a series of related experiments the above described reactions with the lysozyme-dependent nucleic acid sensor molecule are done in buffer to which 10% v/v human serum is added (FIG. 53 ). Without the addition of RVC complete degradation of the RNA is observed. In the presence of VRC, however, no difference in RNA stability and lysozyme-dependent product formation is observed.
By inactivating endogenous RNAse H-like activity, it is possible to carry out allosteric ribozyme assays in which the ribozymes have been immobilized on a chip surface through hybridization with a tethered DNA probe.
Formatting an ERK Nucleic Acid Sensor Molecule Chip
Immobilization of nucleic acid sensor molecules on a substrate provides a straightforward mechanism for carrying out multiple arrays in parallel. Initially, the optimal attachment chemistries were determined to be used to immobilize these molecules on a solid substrate. These molecules are were further configured such that their activity and allosteric behavior is maintained following immobilization. Generally, the chip is configured such that it may be placed at the bottom of a sample holder and overlaid with sample solution, target (ERK and ppERK) (and substrate oligonucleotide). Following an incubation to allow ERK and pERK present within the sample to activate catalysis, the sample is washed away and the extent of ribozyme catalysis quantified.
Detection. Immobilized nucleic acid sensor molecules for ERK and pERK are prepared as described in the following section and are assayed for activity by monitoring either retention of end-labeled oligonucleotide substrate (for L1 ligase-based ribozymes) or release of end-labeled ribozyme (for endonucleases as originally described by (Seetharaman et al. 2001). Radioactive tracers are used for labeling RNAs and substrates. To the extent that different attachment chemistries do not interfere, both fluorescent and biotin labels are used in end-labeling the oligo substrate.
Attachment chemistries. One advantage of using nucleic acid sensor molecule arrays as opposed to protein arrays is the relative ease with which nucleic acid sensor molecules can be attached to chip surfaces. Several different chemistries for attaching nucleic acid sensor molecules to solid supports were tested and optimized, such as:
-
- 1. Conventional DNA arrays using aldehyde coated slides and 5′-amino modified oligonucleotides. The attached oligonucleotide serves as a capture tag that specifically hybridizes to a 3′-end extension on the ribozyme.
- 2. Nucleic acid sensor molecule RNA treated with periodate to specifically introduce an aldehyde modification at the 3′-end. Modified RNA can be used in two different ways:
- Subsequent reaction with biotin hydrazide enables RNA capture on commercially-available streptavidin coated slides.
- Subsequent reaction with adipic acid dihydrazide enables RNA capture on commercially-available aldehyde coated slides.
- 3. (Endonuclease) Nucleic acid sensor molecules are generated by transcription in the presence of γ-thio-GTP (introducing a unique thiol at their 5′-end) and subsequently attached to a thiol-reactive surface (e.g gold-coated polystyrene as described by Seetharaman et al.).
Attachment methodologies are evaluated on the basis of the following criteria:
-
- efficiency—what is the yield of nucleic acid sensor molecule capture?
- capacity—what is the maximum concentration of nucleic acid sensor molecules that can be localized in a given spot size?
- stability—are ribozymes efficiently retained under a variety of solution conditions and during long-term storage?
- detection—do immobilization chemistries interfere with the ability to generate a detectable signal?
Reconfiguring ribozymes for activity in solid phase applications. To the extent, that allosteric activity for immobilized ERK and pERK nucleic acid sensor molecules is diminished, three different strategies are possible:
-
- 1. Immobilization chemistries. A variety of different immobilization chemistries are compared on the basis of their ability to maintain allosteric behavior. To the extent that they leave different surfaces available for protein effectors to interact with, that they tether different ends of the nucleic acid sensor molecules, and that they position the NASM either directly at the surface or displaced from the surface (in the case of streptavidin capture), different behaviors are observed depending upon the immobilization method. Protein-target activated NASMs have been shown to function in both direct and indirect attachment scenarios.
- 2. Blocking chemistries. Blocking agents (e.g., carrier proteins) are tested to determine whether losses in allosteric responsiveness are due to non-specific interactions between the allosteric activators and the chip surface.
- 3. Tethers. Steric effects may cause decreased catalytic activity upon direct end attachment to a solid support. Arbitrary sequence tethers are added as needed to increase the spacing between the attachment end and the core of the ribozyme.
While endogenous activators and nucleases do not appear to be an issue for the lysozyme-responsive nucleic acid sensor molecules, the following strategies are used in the eventuality that they are a problem for the ERK/pERK (or other) nucleic acid sensor molecules.
Nucleic acid sensor molecule pre-screening. As noted above, individual clones isolated from the selection experiment are tested early for allosteric activation in the presence of ERK-depleted extracts. Molecules that respond to endogenous non-specific activators are eliminated from further consideration.
Negative selection with depleted extracts. To the extent that all isolated nucleic acid sensor molecules are activated by ERK-depleted extracts, depleted extracts are included in the negative selection step of the selection process.
Nuclease inhibition. Commercially available RNase inhibitors and competing RNAse substrates (e.g. tRNA) are added to test samples.
Kinetic considerations. RNAse-mediated degradation of the nucleic acid sensor molecule proceeds at a rate in competition with the rate of nucleic acid sensor molecule catalysis. As such, nucleic acid sensor molecules with fast turnover rates can be assayed for shorter times and are thus less susceptible to RNAse problems. Nucleic acid sensor molecules with fast turnover can be obtained by (1) reducing the length of the incubation during the positive selection step, and/or (2) choosing fast nucleic acid sensor molecules (potentially with less favorable allosteric activation ratios) when screening individual clones emerging from the selection experiment.
Nuclease-Resistant Nucleic acid sensor molecules. By carrying out selection in the presence of nucleases (e.g. by including depleted extracts during the negative selection step), the experiment intrinsically favors those molecules that are resistant to degradation.
Modified RNA. Covalent modifications to RNA that can render it highly nuclease-resistant are performed. Several of these modifications, including for example 2′-O-methylation, are compatible with hammerhead cleavage activity and are used to minimize non-specific cleavage in the presence of biological samples (Usman and Blatt 2000).
Rolling Circle Amplification.
A circularized nucleic acid product generated by the target-activated ligase nucleic acid sensor molecule serves as a template to promote rolling circle replication. In most cases, rolling circle replication initially requires that an oligonucleotide primer be annealed to the circular nucleic acid template. This oligonucleotide primer may be provided subsequent to the nucleic acid sensor molecule reaction that generates the circular template. Alternatively, the primer may be present during the nucleic acid sensor molecule reaction as either a separate oligonucleotide or as part of the nucleic acid sensor molecule itself (FIG. 53 ). Also, the primer may exist free in solution or be tethered either covalently (e.g., via 5′-end modification) or non-covalently (e.g., association of biotinylated primer with immobilized streptavidin or through base-pairing with complementary immobilized oligonucleotide) to a solid support. In a preferred embodiment for solid-state (e.g., chip) applications, an immobilized nucleic acid sensor molecule serves directly as the primer for rolling circle amplification as illustrated in FIG. 53 . Immobilization makes it possible to confine the signal generated through the rolling circle reaction to a specific spatial location, enabling the development of arrays in which each element in the array is composed of a different target-activated nucleic acid sensor molecules. In another embodiment, an immobilized primer is used for rolling circle extension, also leading to a spatially localized signal. Preferably, the primer is at least 10 nucleotides long and it hybridizes to a unique site on the circular template.
Rolling circle amplification may proceed using either a DNA-directed or RNA-directed polymerase, depending upon the nature of the circular template generated by the target-activated nucleic acid sensor molecules. Concatamers generated from primarily DNA templates can be generated by an enzyme preferably from the following group: Taq DNA polymerase, Tth DNA polymerase, Klenow fragment of E. coli DNA polymerase, bacteriophage O29 DNA Polymerase, or Bst DNA polymerase. More preferably, the polymerase enzyme is Bst DNA Polymerase. Concatamers generated from primarily RNA templates can be generated by an enzyme preferably from the following group: AMV reverse transcriptase, MMLV reverse transcriptase, or Q-beta replicase. More preferably, the polymerase enzyme is MMLV reverse transcriptase.
The rolling circle amplification reaction requires a supply of nucleotide triphosphates for incorporation to generate the nucleic acid product. Quantification of the rolling circle amplification reaction may be facilitated by using nucleotides containing fluorescent or radioactive labels or affinity tags as described below.
The rolling circle amplification reaction may be made to proceed exponentially by the addition of a linear oligonucleotide primer containing all or part of the circular template sequence (FIG. 54 ). The uncircularized form of the ligase substrate can perform this function. As such, in the preferred embodiment, the detection reaction is carried out with excess oligonucleotide substrate.
Detection
The rolling circle amplification reaction generates single- and double-stranded DNA. The amount of the rolling circle amplification product generated can be determined by the variety of methods outlined below. The signal measured by each method can be directly related to a corresponding analyte concentration by constructing a standard curve in which a range of known concentrations of the analyte are analyzed in parallel.
Fluorescent detection. Products of the rolling circle amplification reaction may be detected fluorescently by the following methods:
Fluorescent detection. Products of the rolling circle amplification reaction may be detected fluorescently by the following methods:
-
- a. Intercalating dyes. The fluorescence intensity of several dyes is known to increase upon their binding to DNA. The yield from the rolling circle amplification reaction may be measured by including one of these dyes during the reaction and using a fluorimeter to monitor the change in fluorescence intensity as the reaction proceeds. For this, a variety of nucleic acid stains is readily available (see Handbook of Fluorescent Probes and Research Products,
Chapter 8, Molecular Probes, OR). - b. Labeled nucleotides. Fluorescent labels may be attached to the nucleotides that serve as substrates for the rolling circle amplification reaction. Fluorescent nucleotides incorporated into the newly synthesized DNA can be detected by two different mechanisms:
- Homogeneous assays: nucleotides with appropriate fluorescence donor and acceptor pairs may be combined such that their sequential incorporation into a polynucleotide increases their spatial proximity and, correspondingly, the efficiency of fluorescence resonance energy transfer (FRET) (
FIG. 55 ). The resulting FRET signal may be read using a fluorimeter. The strength of this signal may be maximized by appropriate design of the ligase substrate such that its sequence contains many acceptor-donor dinucleotides. A similar process using a fluorescent UTP and a biotin-CTP derivative, followed by addition of an fluorescence-acceptor streptavidin conjugate has been described for labeling of RNA (Alpha-Bazin et al. Anal. Biochem. (2000) 286, 17–25). - Heterogeneous assays: unincorporated nucleotides may be physically removed by covalently or non-covalently capturing the rolling circle amplification reaction product (e.g. by pre-immobilization of the rolling circle amplification primer or by hybridization to an immobilized capture probe) and followed by washing. Fluorescent nucleotides retained with the immobilized nucleic acid product can be detected and quantified (e.g. using a confocal scanner) to obtain an estimate of the extent of the rolling circle amplification reaction.
- Homogeneous assays: nucleotides with appropriate fluorescence donor and acceptor pairs may be combined such that their sequential incorporation into a polynucleotide increases their spatial proximity and, correspondingly, the efficiency of fluorescence resonance energy transfer (FRET) (
- a. Intercalating dyes. The fluorescence intensity of several dyes is known to increase upon their binding to DNA. The yield from the rolling circle amplification reaction may be measured by including one of these dyes during the reaction and using a fluorimeter to monitor the change in fluorescence intensity as the reaction proceeds. For this, a variety of nucleic acid stains is readily available (see Handbook of Fluorescent Probes and Research Products,
- Sequence-specificfluorescent hybridization probes. Hybridization of a complementary, fluorescently labeled probe with the rolling circle amplification reaction product is used in a variety of ways to generate a fluorescent signal. Strategies include (1) physical retention of a fluorescent probe by captured/immobilized RCA product, (2) co-immobilization of a fluorophore acceptor-donor oligonucleotide pair (FRET), (3) 5′-nuclease induced cleavage of a fluorophore-quencher oligonucleotide (Taqman™) and (4) conformational changes in a fluorescent probe induced by hybridization which change its fluorescent properties. In a related aspect, the fluorescent probe may be attached to the primer that is used, leading to a conformational change during transcription (e.g. Amplifluor™, Intergen, NY)
- Proximity Assays: In addition to the aforementioned methods that rely on inducing physical proximity of two fluorophores through hybridization of probes with rolling circle amplification products (e.g., FRET, molecular beacons, Taqman™ etc.), other proximity-based assays may be used. This includes, but is not limited to, luminescence-based assays such as Amplified Luminescent Proximity Homogeneous Assay (AlphaScreen, Packard BioScience, CT) and Bioluminescence Resonance Energy Transfer (BRET, Packard BioScience, CT). Radiometric read-out. By using appropriate radioactively labeled nucleotides in the rolling circle amplification reaction (e.g. alpha-P32 -ATP), the resulting rolling circle amplification product becomes radioactive and may be quantified using instrumentation that detects radioisotope decay (e.g. phosphorimagers, x-ray film, scintillation counters). In the preferred embodiment, nucleotides provided for the rolling circle amplification reaction are labeled with tritium and the primer for the rolling circle amplification reaction is immobilized on a solid support that contains a scintillant. Co-localization of the radioactively-labeled RCA product on the scintillant surface generates the signal readily detected by a scintillation counter (scintillation proximity assay, SPA).
- Surface Plasmon Resonance (SPR). The primer used to initiate the rolling circle amplification reaction is immobilized on the gold surface of a detection element in an SPR detector (e.g. Biacore). As the rolling circle amplification reaction proceeds, the effective mass of the primer increases, generating a signal that can be detected due to the change in surface plasmon resonance.
- Coagulation: Microspheres bearing a hybridization probe complementary to the rolling circle amplification product or the primers for the rolling circle amplification reaction can lead to coagulation as the reaction progresses. Coagulation can be readily detected by means that include measurement of changes in refractive index or turbidity.
- Others. Rolling circle amplification is capable of generating very long polynucleotides that are very likely to lead to significant changes in the sample's physical properties. Examples include, but are not limited to, changes in viscosity, refractive index, turbidity, and electrophysical properties such as conductivity. In general, any kind of method that can detect these chances can likely be used to monitor the rolling circle amplification reaction.
High Throughput Screening (HTS) Assay using G Protein Nucleic Acid Sensor Molecules
Activated Gα-protein dependent nucleic acid sensor molecules are used in vitro to test the efficacy of the agonists and inverse agonists for any GPCR. Gia-protein cDNA can be obtained (Guthrie cDNA resource Center) and expressed in E. coli as His-tagged protein (Lee, Linder et al. 1994). GDP or GTP-γS are added during the purification to avoid degradation. GDP-complex Giα-protein and GTP-complex Giα-protein are used to generate nucleic acid sensor molecules.
GTP-complex Giα-protein (activated-Giα-protein)-dependent nucleic acid sensor molecules are tested in a target modulation assay to screen the selected nucleic acid sensor molecules with desirable properties. For example, membrane fraction of C6 glioma cells in 12-well plates are loaded for 16 h in the presence and the absence of adrenaline. Cell lysate can be tested for activated Giα-protein-dependent nucleic acid sensor molecule response. Alternatively, the competitive modulation by for adenylyl cyclase is tested following the inhibition of adenylyl cyclase activity by activated Giα-protein in the presence of nucleic acid sensor molecules by a modified assay based on a previously described assay (Burt, Sauté et al. 1998).
Adenylyl cyclase activity is measured as described in the presence and the absence of nucleic acid sensor molecules (Kozasa and Gilman 1995). Cell membranes from HeLa cells transfected with human cloned 5-HT1A receptors resuspended in buffer are used to screen compounds. The membranes are incubated with 30 M GDP and decreasing concentrations of test drugs (from 100 pM to 0.1 nM) or decreasing concentrations of 5-HT, from 100 M to 0.1 nM (reference curve) for 20 min at 30° C. in a final volume of about 0.5 mL (Stanton and Beer 1997). Then samples are added with GTPS and the nucleic acid sensor molecules and then incubated for a further 30 min at 30° C.
Alternatively, nucleic acid sensor molecules are generated that depend on the presence of Gβ-protein uncomplexed with Gα-protein. There are four known classes of Gβ-protein. Gβ-protein complex with Gγ-protein can also play important roles in the signal transduction. After dissociation from alpha subunit, this complex is known to regulate various target protein, such as GRKs, Raf kinase, adenylyl cyclase, PLCs and ion channels. Producing nucleic acid sensor molecules that block the complex keep the GPCR's from activating their effectors.
Cell-based Assays Using GPCR Nucleic Acid Sensor Molecules
GPCR nucleic acid sensor molecules are used in cell-based assay using modifications of previously described GPCR assays (Hun, Ellington et al. 2001). For example, β-adrenergic receptor can be expressed in CHO cells. CHO cells are grown in multiwell tissue culture plates in Dulbecco's modified Eagle media (DMEM) with 10% fetal bovine serum. On the day of assay, medium is replaced with 0.2 mL treatment medium containing DMEM media containing 250 M IBMX (isobutyl-1-methylxantine) plus 1 mM ascorbic acid with test compound dissolved in DMSO. Test compounds are added at a desired concentration range (e.g. 10−9 to 10−4 M). Isoproterenol (10−5 M) is used as an internal standard for comparison of activity. Cells were incubated at 37° C. on a rocker for 15–30 min. Then cells are lysed and the level of the activated Gα-protein is measured by the nucleic acid sensor molecule. The antagonist is screened in the same format in the presence of the known agonist by detecting the decreasing amount of the activated Gα-protein.
Alternatively, the agonism and the antagonism of compounds for specific or general GPCR is measured using the nucleic acid sensor molecule. For example, evaluation of compounds for antagonism can be performed using Sprague Dawley rats. The aorta from animal is isolated and freed of adhering connective tissue. Desmethylimipramine (0.1 M) and corticosterone (1 M) to block neuronal and extraneuronal uptake of noradrenaline, (±)-propranolol (1M) to block β-receptors, and yohimbine (0.1 M) to block γ-receptors are added. Aortic strips are incubated with various concentration of compounds in the presence and the absence of 10 M noradrenaline. Then the cell extract is prepared and the activated Giα-protein level in the cell is measured with the nucleic acid sensor molecules (Barlocco, Cignarella et al. 2001).
In Vitro Assay for GPCR Activation by Following Liberation of Gα-protein with Gα-protein Dependent Nucleic Acid Sensor Molecules.
Nucleic acid sensor molecules generated against Gα-protein subunits are used to test the efficacy of agonists and inverse agonists for any GPCR in vitro using activated G-protein. For example, Giα-protien cDNA can be obtained (Guthrie cDNA resource Center) and expressed in E coli as His-tagged protein (Lee, Linder et al. 1994). GDP or GTP-γS are added during the purification to avoid degradation. GDP-complex Giα-protein and GTP-complex Giα-protein are used to generate nucleic acid sensor molecules. GTP-complex Giα-protein (activated-Giα-protein)-dependent nucleic acid sensor molecule can be tested for the binding assay to screen the selected nucleic acid sensor molecules with desirable properties. For example, membrane fraction of C6 glioma cells in 12-well plates were loaded for 16 h in the presence and the absence of adrenaline. Cell lysate can be tested for activated Giα-protein-dependent nucleic acid sensor molecule response. Alternatively, the competitive binding for adenylyl cyclase can be tested following the inhibition of adenylyl cyclase activity by activated Giα-protein in the presence of nucleic acid sensor molecules by a modified assay based on a previously described assay (Burt, Sautel et al. 1998).
Adenylyl cyclase activity can be measured as described in the presence and the absence of nucleic acid sensor molecules (Kozasa and Gilman 1995). Cell membranes from HeLa cells transfected with human cloned 5-hydroxytryptamine 1A (5-HT1A) receptors resuspended in buffer can be used to screen compounds. The membranes are incubated with 30 mM GDP and decreasing concentrations of test drugs or decreasing concentrations of 5-HT, from 100 M to 0.1 nM (reference curve) for 20 min at 30° C. in a final volume of about 0.5 mL (Stanton and Beer 1997). Then samples are added with GTPS and the nucleic acid sensor molecules and then incubated for a further 30 min at 30° C.
Nucleic acid sensor molecules can also be generated that depend on the presence of Gβ-protein uncomplexed with G60-protein. There are four known class of Gβ-protein. Gβ-protein complex with Gγ-protein can also play important roles in the signal transduction. After dissociation from alpha subunit, this complex is known to regulate various target protein, such as GRKs, Raf kinase, adenylyl cyclase, PLCs and ion channels. Producing nucleic acid sensor molecules that block the complex keep the GPCR's from activating their effectors.
Multiplex Assay for Gα Proteins
Nucleic acid sensor molecules are also generated whose activity is dependent on multiple activated G-proteins. Human G-protein cDNAs are obtained from publicly available databases or are cloned by RT-PCR from polka-RNA pool of appropriate source. They can be expressed as described above and use to select nucleic acid sensor molecules. The readouts for multiplex assay system are discussed above.
Nucleic Acid Sensor Molecules Activated by Native Lysozyme.
Lysozyme activated nucleic acid sensor molecules lys.L1.A, B, and C are disclosed in FIG. 26 . Stems above the ligation junction varied in length from 2, 5 and 10 base pairs. The unimolecular NASMs were generated by PCR of the original lysozyme NASM with 5′ primer (TCTAATACGACTCACTATAGGACCTCGGCGAAAGC) (SEQ ID NO:296) and the following 3′ primers: A ACTCTCGCTAACCTCTCTAGTCATA (SEQ ID NO:297), (B) AGTGCTCTCGCACCTAACCTCTCTAGT (SEQ ID NO:298) or (C) AGTGCGAGCCTCTCGGCTCGCACCTAACCTCTCTAGT (SEQ ID NO:299) using Taq polymerase (Invitrogen) following the manufacturer's protocol. RNAs were generated with Ampliscribe T7 transcription kits following the manufacturer's protocol. RNA was heated in water for 3 min at 70° C. and then brought to room temperature before adding 5×buffer (5×buffer: 150 mM Tris, 50 mM MgCl2, pH 7.5) and lysozyme (1 uM or absent). Ligations were performed at room temperature for one hour then quenched with stop dye [formamide, 0.1% bromophenol blue, xylene cyanol] and anaylzed on a 6% acrylamide gel. Self-ligation was increased in the presence of lysozyme for constructs B and C. No ligation was observed for construct A, suggesting that the stem length above the ligation junction is critical.
This circularization can be detected using PCR across the ligation site as shown in FIG. 27 . Activation of (clone B is shown in FIG. 28 . Protocols from the supplier were followed for Superscript RT and recombinant Taq Polymerase (Invitrogen). All RNA samples were reverse transcribed and PCR amplified separately with two different sets of primers. The first set was designed to amplify the total NASM RNA that was used as input into in vitro (TCTAATACGACTCACTATAGGACCTCGGCGAAAGC (SEQ ID NO:300) and AGTGCTCTCGCACCTAACCTCTCTAGT (SEQ ID NO:301)). The second set of primers was designed to selectively amplify the RNAs that circularized (GTTGCTACAAATGATATGAC (SEQ ID NO:302)and ATGGCAATTTAGCCATGAGA (SEQ ID NO:303)). Following amplification with RT/PCR the circularized species display a ladder like pattern as a result of strand displacement. The ladder can be avoided by the use of a reverse transcriptase with RNase H activity. The gel shows in FIG. 28 that after 25 cycles of PCR, a circularization signal appears. This signal allows for quantitation of the degree of activation of ligase in response to their target molecules.
Ligase nucleic acid sensor molecules are also able to detect their targets in cell extracts. In FIG. 29 , (clone B is combined with lysozyme, and increasing amounts of HeLa cell extracts. Experiments were carried at as described for FIG. 28 with HeLa cell extract added in place of water. Even at the highest HeLa cell extract concentration, activation of clone B by lysozyme is still detectable.
Lysosyme-dependent ligase (lys11–2 from Nature Biotechnology 19, 650–655 (2001)) incubated in the presence of effector oligonucleotide 18.90a (ibid.), substrate S28A (ibid.), optionally 10% cellular lysate (HeLa cells or reticulocyte lysate) and various concentrations of lysozyme at 25° C. for 1 hour, as shown in FIG. 50 . Ligation is observable at 100 nM and is ˜30% at 1 μM. Ligation yield is unaffected by the presence of 10% reticulocyte lysate or 10% HeLa lysate.
Ligase nucleic acid sensor molecules are also able to detect their targets in vivo. Mammalian cells were electroporated with 1, 5, 10 and 25 μg RNA. The RNA was brought to a total volume of 30 ul in the presence of 20 ug salmon sperm DNA. Cells were trypsinized, counted, pelleted and resuspended in 250 ul of media. The ligase biosensor/Salmon sperm DNA mixture was added to the cells, mixed gently and incubated at room temperature for 5 minutes. The cells were electroporated and diluted in pre-warmed media and incubated at ambient temperature for 5 minutes. Subsequently, the cells were plated and transferred to a 37° C. incubator and allowed to recover for 6 hours. Following recovery, the cells were trypsinized, pelleted, washed with PBS and pelleted again. Cells were resuspended in an ice cold mixture of 150 mM NaCl, 1 μl of 10% NP-40 and 6 μl 10% SDS, 28 μ10 mM Tris-HCl, pH 8.0 solution and added to a mixture of 40 Proteinase K (20 mg/ml). The lysate was passed through a 1 ml 26G ⅝ syringe 20 times. Lysates were incubated at 37° C. for 2 hours. Following the incubation the slurry was phenol/chloroform/isoamyl alcohol extracted two times, the aqueous phase was removed and ethanol precipitated RT-PCR reactions were carried as described for FIG. 30 . Extent of ligation and circularization was determined by RT-PCR as shown in FIG. 30B , the cells that were cotransfected with lysozyme showed an increased circularization.
RT-PCR Analysis of Ligase Nucleic Acid Sensor Molecules/amplicon-dependent Nucleic Acid Amplification.
RT-PCR is a quantitative method that can be used to measure the activity of a ligase nucleic acid sensor molecule. As shown in FIG. 46 , PCR primers are used that hybridize to sequences of the ligase nucleic acid sensor molecule that are only joined after self-ligation. After ligation occurs the nucleic acid sensor molecule can be amplified, and the PCR product can be detected on an agarose gel, using ethidium bromide or other nucleic acid staining techniques. Alternatively, the progress of the PCR reaction can be monitored using real-time detection techniques including, but not limited to, Taqman (Applied Biosystems, Foster City, Calif.), SYBR Green (Molecular Probes, Eugene, Ore. and Applied Biosystems, Foster City, Calif.), Scorpion (Eurogentec, Liege, Belgium), Amplifluor (Serologicals, Norcross, Ga.) or related systems.
A specific example of a lysozyme-dependent ligase nucleic acid sensor molecule is as follows:
The ligase RNA has the sequence 5′GGACCUCGGCGAAAGCUAACGUCUCAUGGCUAAAUUGCCAUGUUGCUACAAAU GAUAUGACUAGAGAGGUUAGGUGCAUCUUCAUGUCCAGUCGCUUGCAAUGCCC (SEQ ID NO:304) and is prepared through transcription off a double-stranded DNA template using T7 polymerase (Ambion MegaShortscript kit, Ambion, Austin, Tex.). For the ligation reaction, 200 nM nucleic acid sensor molecule RNA,1 ,μM DNA RT primer 5′GGGCATTGCAAGCGACTGGACAT (SEQ ID NO:305) and 1 μM substrate oligo 5′ACTGAACCTGACCGTACAAAGATgcacu (SEQ ID NO:306) (DNA: upper case; RNA: lower case) are incubated with 1 nM-10 μM hen egg white lysozyme in reaction buffer (50 mM Tris pH 7.4, 100 mM KCl, 10 mM MgCl2) as previously described (Robertson M P & Ellington A D, Nature Biotechnol. 2001, 19, 650–655). After 15 min at room temperature, the reaction is stopped by diluting 300-fold with 1 mM EDTA. Of this, 5 μL are transferred into 25 μL of a RT-PCR reaction mix (Applied Biosystems, Foster City, Calif.) that contains 300 nM DNA forward primer 5′ACTGAACCTGACCGTACAAAGA (SEQ ID NO:307) and DNA reverse primer 5′TTTGTAGCAACATGGCAATTTA (SEQ ID NO:308) plus 350 nM Taqman probe 5′6FAM-CGGCGAAAGCTAACGTCTCATGG-TAMRA (SEQ ID NO:309) (Applied Biosystems, Foster City, Calif.). Reverse transcription is performed through incubation for 30 min at 48° C. The sample is then denatured for 10 min at 95° C. followed by 40 PCR cycles (15 sec at 95° C., 1 min at 60° C.). The amplification process is monitored using a ABI 7000 instrument (Applied Biosystems, Foster City, Calif.), and threshold cycle values are calculated using the instrument software. Plotting the Ct against the logarithm of the lysozyme concentration reveals a largely linear relationship (FIG. 48 ). The linear dynamic range spans about three orders of magnitude from ˜1 nM to ˜1 μM. A control reaction without the addition of lysozyme gives a threshold cycle values of ˜24.5. This value defines the upper limit for threshold cycle values, and is due to the small amount of product that is inevitably generated through the background ligation. On the opposite end, the lower plateau of threshold cycle values is reached with lysozyme >-1 PM. This concentration is close to the apparent Kd (1.5 μM), and the nucleic acid sensor molecule target modulation domain is beginning to be saturated by lysozyme, triggering a reaction at maximum catalytic rate. Another specific example describes the use of the SYBR Green RT-PCR amplification detection system (Applied Biosystems, Foster City, Calif.). Ligation reactions are run as described above, and analysis is done through transferring 5 μL of the reaction into 25 μL of a SYBR-Green RT-PCR reaction mix (Applied Biosystems, Foster City, Calif.) that contains 100 nM DNA forward primer 5′ACTGAACCTGACCGTACAAAGA (SEQ ID NO:310) and DNA reverse primer 5′TTTGTAGCAACATGGCAATTTA (SEQ ID NO:311). Reverse transcription is performed through incubation for 30 min at 48° C. The sample is then denatured for 10 min at 95° C. followed by 40 PCR cycles (15 sec at 95° C., 1 min at 60° C.). The amplification process is monitored using a ABI 7000 instrument(Applied Biosystems, Foster City, Calif.), and threshold cycle values are calculated using the instrument software as above (FIG. 49 ). The threshold cycle values are directly proportional to the logarithm of the lysozyme concentration between ˜1 nM to ˜1 μM. A melting profile confirms that a uniform amplification product was obtained, without the appearance of artifacts such as primer-dimers.
Ligation Reactions in 3 or 2 Piece Systems.
Ligation reactions with varying volumes depending on the application type were performed in buffer 1, [30 mM Tris-HCl, pH 7.5, 10 mM MgCl2, 50 μg/mL tRNA type X (Sigma)], or buffer 2 [20 mM HEPES, pH 7.4, 10% glycerol, 150 mM KCl, 10 mM MgCl2, 1 mM EDTA, 1 mM DTT, 0.5 mg/ml tRNA, 2 U/μL RNaseOUT™ (Invitrogen)]. Ligation reactions performed in the presence or absence of crude cell lysates contained 200 nM or 50 nM ligase RNA, respectively. Ligase RNA was pre-annealed with a 2-fold molar excess of effector oligonucleotide by incubation for 3 min at 70° C., followed by the addition of 5×reaction buffer at 25° C. The appropriate concentration of protein and/or cell lysate was added to the RNA and incubated for an additional 15 min at room temperature. Ligation reactions were then initiated by the addition of this mixture to a 10×solution of the substrate oligonucleotide TK.04.82.C ACGTAGCATAGCATCGATAGCTGTTGugcacu (SEQ ID NO:357) (small letters correspond to RNA nucleotides) final concentration=1 μM). The reactions were incubated at 25° C., and small aliquots (2–10 μL) of reaction mix were quenched by dilution in EDTA.
Transfection of Ligase Biosensors into Mammalian Cells by Electroporation.
HEK 293, 3T3 or HeLa cells were grown in DMEM medium containing 10% fetal bovine serum to 85–90% confluency, and harvested by trypsinization. Aliquots of approximately 250,000 cells were pelleted by centrifugation (3 min at 2000 rpm), resuspended in 250 μL of growth medium, and gently mixed with 30 μL of nucleic acid mix containing 20 ,μg of salmon sperm DNA (carrier) and 1, 5, 10 or 25 μg nucleic acid sensor molecule ligase RNA. This mixture was incubated at room temperature for exactly 5 minutes without agitation, and transferred to electroporator cuvettes. An electric field pulse was applied to the cells at ambient temperature using a Gene Pulser II power supply (BioRad; settings: 250V, 0.975 μF high capacitance). The cells were plated in pre-warmed growth medium, incubated at 37° C. for varying periods, and harvested. Cells were washed with PBS, pelleted, and immediately subjected to total, cytoplasmic, or nuclear RNA isolation procedures or flash-frozen in liquid nitrogen and stored at −80° C. for further analysis.
Purification of total RNA from mammalian cells Pelleted cells were resuspended in ice old buffer (150 mM NaCl, 10 mM Tris HCl, pH 8.0) and added to 40 μl of 10% SDS, 28 μl of 10% NP40 and 6 μl of Proteinase K (20 μg/ ml). The mixture was drawn into a 1 ml syringe and passed through a 26 gauge needle at least 20 times, and then incubated at 37° C. for 2 hours. Following incubation, the slurry phenol/chloroform/isoamyl alcohol extracted two-times, the aqueous phase was removed and ethanol precipitated. The sample was 70% ethanol washed, and dried. The RNA pellets were resuspended and the yield was quantified based on OD 260. The cleanliness of the prep was assessed based on 260/280 ratio. All RNA samples were stored at −80° C.
Analysis of Ligation and/or Circularization by RT/PCR:
Protocols from the supplier were followed for reverse transcription and PCR. Either Superscript RT or AMV RT, and recombinant Taq Polymerase (Invitrogen) were used.
In order to avoid any occurrence of ligation in the detection phase of experiments, all reverse transcriptions were performed at 48° C. All RNA samples were reverse transcribed and PCR amplified separately with two different sets of primers. First set was designed to amplify the total RNA that was used as input into in vitro or ex vivo assays. The second set of primers were designed to selectively amplify the RNAs that were ligated to the substrate oligo (resulting in a higher molecular weight) or were ligated to their 5′ end and became circularized without molecular weight change. two and three-piece ligase platforms give rise to higher molecular weight products as a result of target dependent ligation. One piece ligase platform circularize as a result of target dependent ligation. When observed directly with gel based assays the circularized form has a different mobility than the linear RNA. Following amplification with RT/PCR the circularized species display a ladder like pattern as a result of strand displacement that happens in the reverse transcription phase. The ladder like pattern can be avoided by the use of a reverse transcriptase with RNase H+ activity.
Preparation of Extracts from Mammalian Cell Cultures:
After stimulation with the reagent that regulates target levels, mammalian cells were rinsed briefly in cold TBS and then lysed in TBS lysis buffer (137 mM NaCl, 20 mM Tris, pH 8.0, 1% vol/vol NP-40, and 10% vol/vol glycerol; Knusel et al. 1994) or Brij Lysis buffer (150 mM NaCl, 10 mM Tris, pH 7.5, 2 mM EDTA, 0.125% vol/vol NP-40, 0.875% vol/vol Brij and 10% vol/vol glycerol). Lysis buffers were supplemented with Mini Complete protease inhibitor cocktail (Boehringer Mannheim Corp.) and 1.5 mM sodium vanadate. Lysates were scraped into Eppendorf tubes and rocked for 30 min at 4° C. Samples were then cleared by centrifugation at 10,000 ×g fro 10 min at 4° C. Protein concentration was determined by the BCA assay (Pierce Chemical Co.) using BSA as a standard.
Intron-based Catalytic NASMs
The thymidylate synthase (“td”) intron (Construct 41)(SEQ ID NO:358) -TAATTGAGGCCTGAGTATAAGGTGACTTATACTTGTAATCTATCTAAACGGG GAACCTCTCTAGTAGACAATCCCGTGCTAAATTGTAGGACTGCCCGGGTTCTACATAAATGC CTAACGACTATCCCTTTGGGGAGTAGGGTCAAGTGACTCGAAACGATAGACAACTT GCTTTAACAAGTTGGAGATATAGTCTGCTCTGCATGGTGACATGCAGCTGGATATAA TTCCGGGGTAAGATTAACGACCTTATCTGAACATAATG—is a group I intron sequence of 265 nucleotides in length. Other lengths and their sequences are known in the art and can used as described herein in lieu of SEQ ID NO:358 above.
An example of an intron-derived optical NASM that is modulated by target recognition is the theophylline dependent td group I intron which splices itself out of a thymidylate synthase gene. The intron sequence of this optical NASM is as follows:
TAATTGAGGCCTGAGTATAAGGTGACTTATACTTGTAATCTATCTAAACGGGG AACCTCTCTAGTAGACAATCCCGTGCTAAATTGATACCAGCATCGTCTTGATGCCC TTGGCAGCATAAATGCCTAACGACTATCCCTTTGGGGAGTAGGGTCAAGTGACTCG AAACGATAGACAACTTGCTTTAACAAGTTGGAGATATAGTCTGCTCTGCATGGTGAC ATGCAGCTGGATATAATTCCGGGGTAAGATTAACGACCTTATCTGAACATAATG (construct 42)(SEQ ID NO:359) wherein the bolded nucleotides represent a target modulation domain that recognizes theophylline.
The complete optical NASM comprises the intron sequence described above and the 5′ and 3′ exons attached thereto. Exon 1, the 5′-exon - TTTCTTGGGT (construct 43)(SEQ ID NO:360)—is designed to contain a first fluorescent donor molecule, such as Cy3 (Amersham Biosciences) coupled to a nucleotide in the vicinity (i.e., within no more than about 15 nucleotides) of the 3′ terminus of the 5′ exon. The 5′-exon length can vary with a minimum of 6 nucleotides of complementarity to P10. Exon 2, the 3′-exon—CTACCGTTTA (construct 43)(SEQ ID NO:361)—is designed to contain a second fluorescent molecule, such as Cy5 (Amersham Biosciences) coupled to a nucleotide in the vicinity (i.e., no more than about 15 nucleotides) of the 5′ terminus of the 3′ exon. The 3′-exon length can vary with a minimum of 2 nucleotides of complementarity to P10.
Intron Splicing conditions are as follows: the intron (500 nM) is heated in H 20 to 70° C. for 3 minutes then put on ice for 1 minute. Splicing buffer (20 mM Tris-HCl, pH 7.5, 100 mM KCl, 3 mM MgCl2), is added and the reaction is incubated on ice for an additional 15 minutes. At this time a 4.5 μl aliquot is removed for a time zero point and quenched with 5 μl stop dye (95% formamide, 20 mM EDTA, 0.5% xylene cyanol, and 0.5% bromophenol blue). GTP (50 μM) is added to the remaining reaction (4.5 μl) to start the splicing reaction. The reaction is incubated at 37° C. for 1 hour and then terminated with stop dye (5 μl). The reactions are heated to 70° C. for 3 minutes. Splicing of full length RNA transcripts is detected by gel analysis of labeled RNA.
The theophylline-dependent optical NASM splices in vitro under the same conditions as described for the intron splicing reaction, but with theophylline added to a final concentration 1.5 mM in the splicing buffer. The theophylline-dependent optical NASM (500 nM) is heated in H 20 to 70° C. for 3 minutes then put on ice for 1 minute. Splicing buffer (20 mM Tris-HCl, pH 7.5, 100 mM KCl, 3 mM MgCl2) and theophylline (1.5 mM) are added and the reaction is incubated on ice for an additional 15 minutes. At this time a 4.5 μl aliquot is removed for a time zero point and quenched with 5 μl stop dye (95% formamide, 20 mM EDTA, 0.5% xylene cyanol, and 0.5% bromophenol blue) (95% formamide, 20 mM EDTA, 0.5% xylene cyanol, and 0.5% bromophenol blue). GTP (50 μM) is added to the remaining reaction (4.5 μl) to start the splicing reaction. The reaction is incubated at 37° C. for 1 hour.
Target dependent modulation of the intron-derived optical NASM is followed by fluorescence measurement as described herein.
Solid-phase Nucleic Acid Sensor Array for Assays with Fluorescent Detection-FRET Chip
This example describes a general method for implementing a FRET-based (fluorescence resonance energy transfer) assay utilizing nucleic acid sensor molecules. (in this case, cGMP-dependent hammerhead nucleic acid sensor molecule) wherein the nucleic acid sensor molecule is immobilized on a solid substrate, e.g., within a microtiter plate well, on a membrane, on a glass or plastic microscope slide, etc.
In the specific embodiment described here, a first oligonucleotide of the nucleotide sensor molecule is 3′-labeled with an acceptor or quencher fluorophore, such as TAMRA, AlexaFluor 568, or DABCYL, via specific periodate oxidation (see Example 34. for specific protocol). A second oligonucleotide of the nucleic acid sensor molecule, complementary to at least part of the first oligo portion of the NASM, is labeled with a 3′ biotin and a 5′ donor fluorophore, such as fluorescein (FAM, FITC, etc.). These two nucleic oligonucleotides are heat-denatured in solution and allowed to anneal/hybridize during cooling to room temperature. After hybridization, the NASM solution is applied to a surface which has been coated with some type of avidin (streptavidin, neutravidin, avidin, etc.). This surface could include a microtiter plate well, a streptavidin-impregnated membrane, a glass or plastic microscope slide, etc. In any case, the ribozyme-oligo complex is specifically immobilized via the 3′ biotin on the donor oligo, leaving the binding domain free to interact with the target effector molecule.
As shown in FIG. 62 (lower panel), the donor and acceptor fluorophores form an efficient FRET-pair; that is, upon excitation of the donor fluorophore near its spectral absorption maxima, the incident electromagnetic energy is efficiently transferred (nonradiatively) via resonant electric dipole coupling from the donor fluorophore to the acceptor fluorophore. The efficiency of this resonant energy transfer is strongly dependent on the separation between the donor and acceptor fluorophores, the transfer rate being proportional to 1/R6, where R is the intermolecular separation. Therefore, when the donor and acceptor are in close proximity, i.e., a few bond-lengths or roughly 10–50 Angstroms, the fluorescent emission from donor species will be reduced relative to its output in an isolated configuration, while the emission from the acceptor species, through indirect excitation by the donor, will be detectable. Upon separation of the donor and acceptor, the donor fluorescence emission signal will increase strongly, while the acceptor emission signal will show a commensurate decrease in intensity. These effects are shown in FIG. 63 (upper panel) for the cGMP-dependent NASM system (SEQ ID: NO. 102).
The black arrow shown in the uppermost panel of FIG. 63 indicates the site of phosphodiester bond cleavage, which occurs upon modulation fo the target modulation domain (TMD) by a cGMP, to the TMD. The melting temperature, Tm, of the remaining 5-base pair sequence (GGUCU in the figure) is ˜25° C. Thus, after effector-mediated cleavage at room temperature, the 5-base pair cleavage fragment will rapidly dissociate from the ribozyme body and diffuse away into solution, as shown in the upper panel of FIG. 63 .
This target-activated nucleic acid sensor molecule system constitutes a highly sensitive real-time sensor for detecting and quantitating the concentration of the target molecule present in an unknown sample solution. The ultimate limit of detection (LOD) for this system is determined by the switch factor, defined as the ratio of the catalytic rate (in this example, the rate of cleavage) of the ribozyme sensor in the presence of its target to that of the ribozyme in the absence of its target. The dynamic range of the ribozyme sensor will be determined by the dissociation constant, Kd, for the interaction of the ribozyme binding domain with the target molecule. In theory, the effective dynamic range over which the rate-response of the NASM is linear in the target concentration has Kd as an upper bound. The lower panel of FIG. 63 shows experimental data from the surface-immobilized cGMP-activated NASM. The data shown in the figure represents the FRET signal from the donor fluorophore with the sensor exposed to concentrations of 0, 100 uM, and 600 uM cGMP. The upper panel of FIG. 64 shows both donor and acceptor fluorescence signals for the FRET system in the presence of 200 uM cGMP. Note that the experimental data exhibits the behavior expected, as shown in the lower panel of FIG. 63 . The lower panel of FIG. 64 shows the donor signal form the plot in the upper panel fitted to a pseudo-first order rate equation. As shown by the closeness of the data fit, the kinetic response of this sensor system closely approximates a pseudo-first order reaction.
The measured dissociation constant for this cGMP-activated NASM with cGMP is approximately 200–500 uM. In practice, concentration measurements up to 1 mM are possible with this sensor in solution-phase measurements. The absolute precision of measurements made with this NASM will depend on the amount of background catalytic activity (i.e., in the absence of target) and baseline drift of the fluorescence signals from both sample and controls due to physical factors, such as liquid handling errors, reagent adhesion, evaporation, or mixing. After some optimization, run-to-run CVs of a few percent are possible with similar FRET-based NASMs measured in solution. Immobilization of the NASM does not degrade its catalytic activity, although it may limit the effective availability of the target-binding domain for interaction with target molecules. The locally high concentration of surface-immobilized NASM will tend to offset this effect by driving the equilibrium for the association (and subsequent catalytic) reactions toward formation of ribozyme-target complex. The net result is a reduction in the observed catalytic rate of approximately 4-fold at Kd (200–500 uM) for the surface-immobilized cGMP-dependent hammerhead NASM, relative to the observed rate for the same sensor system in solution. This effect is shown in the experimental data presented in FIG. 65A , which shows linear (Panel A) and logarithmic (Panel B) plots of the observed catalytic rate constant versus cGMP concentration for the cGMP-dependent hammerhead NASM in both solution and surface-immobilized (‘solid’) configurations. The upper panel plots the observed rate as a function of target (cGMP) concentration on linear axes, while the lower plot plots the same rate data on log-log axes. The observed rate constant (at a given concentration) for the immobilized solid-phase sensor is roughly 10-fold lower than that for the solution-phase sensor. The practical effect of this is that, while the solution-phase sensor's linear dynamic range is limited to about 0–600 uM, the solid-phase sensor's linear dynamic range is at least 2 mM. FIGS. 65C , 65D, and 65E shows how this general NASM strategy could be extended to accomplish multiplexed detection of multiple analytes in a sample simultaneously, by using NASMs labeled with fluorophores having different emission wavelengths. Squares are NASMs immobilized on a solid. Circles are NASMs in solution. In this case, the sensors were immobilized in neutravidin-coated microtiter plate wells (96 well plate, volume of 50 uL). Detection of the fluorescent signals was accomplished in this case by a microplate fluorescence reader equipped with the appropriate lamps, optics, filters, and optical detectors (PMT) manufactured by Packard Instrument Co.
This cGMP-dependent hammerhead NASM system was immobilized on streptavidin-impregnated membranes, and target-activated FRET activity observed. The generalization of this application of surface-immobilized NASM with FRET detection to a micro- or macro-arrayed format on an extended substrate such as glass or plastic is easily envisioned. Such a sensor array could be used to detect and quantify the presence of an arbitrary target molecule in a complex solution, e.g., crude cell extract or biological fluid, in real time. In addition, this general NASM strategy could be extended to accomplish multiplexed detection of multiple analytes in a sample simultaneously, by using NASMs labeled with fluorophores having different emission wavelengths. Experimental data for multiplexed detection using solution-phase cGMP and cAMP FRET sensors is shown in FIG. 66B . This NASM, and further extensions of it to include large numbers of unique analyte-sensors, could be used for high throughput screening (HTS) in drug discovery or clonal analysis. In all of these scenarios, optical detection of the FRET signals could be accomplished using a commercially available microarray imager or scanning fluorescence microscope.
The following example contains a sample protocol for the complete process of performing the solid-phase FRET assay described above, including reagent preparation, DNA amplification, RNA transcription, RNA labeling, substrate and instrument set-up, and, finally, assay data acquisition.
Protocol for Micotiter Plate-based Solid-phase FRET Assay:
The nucleic acid sensor molecules used in the assays described in Example 33. for the case of the cGMP NASM system were prepared as follows:
The appropriate sequence construct was synthesized and amplified via PCR. This was accomplished using the appropriate DNA template molecule(s) and the corresponding primers:
| cGMP PCR template: | MK.08.92.A | (SEQ ID NO:333) |
| 5′GCTTGCAAGCCCTTAGACCCTGATGAGCCTTGCGATGCAAAAAGGTGC | |
| TGACGACACAT CGAAACGGTGAAAGCCGTAGGTCT | |
| Primer 1: | MK.08.66.B | (SEQ ID:334) |
| 5′AGACCTACGGCTTTCACCGTTTCG | |
| Primer 2: | MK.08.130.B | (SEQ ID:335) |
| 5′ATACGACTCACTATAGGATGTCCAGTCGCTTGCAATGCCCTTTTAGAC | |
| CCTGATGAG |
A trace amount (˜100 ng) of template dsDNA was combined with 10–100 picomoles of each primer, e.g., 1 uL each of 100 uM stocks. Using taq DNA polymerase, run 15 cycles of PCR using a typical (95–55–75° C.) temperature-step profile was run. The PCR products were cleaned up using a desalting/size separation column, such as a Qiagen Qiaquick PCR cleanup kit. The resuspended volume of cleaned up PCR products was ˜35 uL. The products can be further concentrated, or added directly to a transcription reaction.
After synthesis and amplification of the appropriate sensor construct via PCR, the dsDNA was converted to RNA via in vitro transcription. This was typically accomplished using T7 RNA polymerase and pre-mixed NTPs and buffer, such as are provided in the Epicentre High Yield Transcription Kit. The transcription reaction, consisting of ˜16–20 uL of cleaned up PCR products in a 40–50 uL total reaction volume, was typically run at 37° C. for ˜8–12 hrs. Following the transcription reaction, the products were usually purified via PAGE or using a desalting/size separation column, such as a Centrisep column (Princeton Separations).
Following production and purification of the RNA NASMs, the fluorescent acceptor labels were attached to the sensor molecules. The fluorescent donor label (in this case a FAM label) was attached to the 5′-biotinylated capture oligo during solid-phase synthesis on a commercial DNA synthesizer, via standard phosphoramidite chemistry. The labeling procedure was accomplished by a specific oxidation of the 3′ terminus of the RNA using 20 mM NaIO4, followed by reaction with a hydrazide-conjugated fluorescent label. The resulting covalent bond is extremely stable under the assay conditions. For the oxidation reaction, one typically 15 μL RNA (˜200–400 pmoles in reaction), 15 μL 0.3 M NaOAc pH 5.4, and 30 μL 20 mM stock NaIO4 in a were combined 1.5 mL reaction tube, which was then placed on ice in the dark for ˜1 hr. After the oxidation reaction, the reaction products were run through a Centrisep desalting column. Alternatively the sample can be ethanol precipitated and resuspended in the original volume.
The oxidized RNA uses then reacted with the dye-(in this example, AlexaFluor 568)-hydrazide conjugate. A typical reaction includes 60 μL oxidized RNA (resuspended in H2O), 60 μL 0.3 M NaOAc pH 5.4, and 10 μL 20 mM stock AlexaFluor 568 hydrazide (made fresh in DMSO). This 130 uL reaction was incubated at room temperature for 2 hrs. After the labeling reaction, the sample was ethanol precipitated, resuspended, gel purified (8% PAGE), and quantitated to determine concentration (using the absorbance at 260 nm). Finally, a 1 uM stock solution of the labeled NASM is prepared in water or buffer.
The substrate and plate-reader/detection system were then prepared for the assay reaction. A typical substrate was a 96 well Pierce Black Neutravidin Plate and a typical plate reader was the Packard Fusion microplate reader (Packard/Perkin-Elmer). Typical settings for this instrument and this assay (as entered in the user interface menus in the instrument control software) are as follows:
-
- 2-channel fluorescence assay (ex:FAM*/em:FAM & TAMRA**)
- emission detection set to top-read
- integration time/well: 1 sec (1 read/well)
- 25 serial reads of each well, 1 min delay between reads
- lamp intensity: 10/20
- PMT voltage: 950/1100 V
- PMT gain: 1.0/200
- *FAM excitation/emission filters: 485 nm/535 nm
- **TAMRA/or AlexaFluor 568 emission filters: 590 nm
The following reaction mixture of NASM+ biotinylated capture oligo was prepared in a 1.5 mL tube:
| Reagent | Stock conc. | Final conc. |
| 1 ul FAM- |
5 |
500 nM |
| 1.2 ul Alexa 568 |
5 |
600 nM |
| 7.8 uL dH2O | ||
| 10.0 uL (total volume = 10 uL × # of wells) | ||
The mixture was heat annealed to ˜85° C. in 1× annealing buffer (30 mM Tris, 50 mM NaCl), and then cooled to room temperature. The assay reactions were run in the presence/absence of target.
To run a solid-phase FRET assay in a standard 96-well microplate, coated with neutravidin, the following procedure was used:
First, neutravidin plate surfaces were pre-blocked to prevent nonspecific adsorption of sensor molecules:
-
-
pipet 30 ul of PBS preblocking buffer (0.05% tRNA+0.025% Tween-20/1×PBS) into wells - cover and shake for 15 min at room temperature on thermomixer
- rinse wells with PBS from squirt bottle
- invert plate and tap wells dry on absorbent surface
-
Next assay reagents were added to each well with multichannel pipet to pre-immobilized sensor molecules in plate wells:
-
-
pipet 10 ul of annealed RNA+biotinylated probe into wells -
pipet 30 ul of PBS preblocking buffer (0.05% tRNA+0.025% Tween-20/1×PBS) into wells & -mix by serial pipetting ˜4× - cover and shake for 15 min at room temperature on thermomixer
- rinse wells with PBS from squirt bottle
- invert plate and tap wells dry on absorbent surface
-
Next assay reaction buffers were added:
-
- 1×HH buffer: 50 mM Tris pH 7.5, 20 mM MgCl2, 0.1 mM EDTA Finally, assay reactions were initiated and the plate was loaded into reader/detector:
- start all reactions simultaneously by adding 50 ul of cGMP in IX HH Buffer p1 shake on thermomixer for ˜3 sec & load directly into microplate reader
Kinetic assay data is assigned as (target-dependent) cleavage reaction proceeds. In the case of the Packard Fusion reader described above, data points were plotted on-screen as they were acquired, giving a real-time readout as the assay proceeds.
Real-time Solid-phase Nucleic Acid Sensor Array for Assays with Surface Plasmon Resonance (SPR) Detection—SPR chip:
Surface plasmon resonance (SPR) can be used to detect target-activated ligation/cleavage events of nucleic acid sensor molecules. In SPR, a light beam is directed, via a prism or grating, onto the back surface of a thin metallic layer (typically ˜50–100 nm of gold) that has been deposited onto a glass or plastic (dielectric) substrate. The incident beam is s-polarized and directed at an angle of incidence which satisfies the condition for total internal reflection (TIR) at the metal/dielectric interface. At certain angles near the TIR critical angle, electromagnetic energy is coupled from the incident beam into surface plasmon excitation modes in the metallic layer. For a fixed excitation wavelength, the precise angular position of the primary surface plasmon resonance depends very strongly on the index of refraction of the medium (typically a liquid) in contact with the front surface of the metallic layer. By monitoring the intensity of the 25 TIR-reflected incident beam as a finction of angle, the angular position of the primary surface plasmon resonance can be found. The adsorption or desorption of molecular species from the front surface of the metallic layer (the SPR sensor surface) will modify the refractive index of the medium in its immediate vicinity (i.e., within ˜100 nm); this will result in a measurable angular shift in the position of the surface plasmon resonance. SPR is thus a sensitive technique for detecting the binding (including hybridization, etc.) and/or release of molecular species from a surface. Measurements can be performed in real time, allowing the kinetic characterization of binding events, as shown in FIG. 67 panels C+D. A system utilizing a large collimated incident beam and an area detector (such as a CCD detector) could be used to generate SPR images of two-dimensional arrays of surface-immobilized species, such as nucleic acid sensor molecules.
The demonstration of an SPR assay format utilizing nucleic acid sensor molecules was accomplished by coupling hammerhead (HH) nucleic acid sensor molecules (FIG. 67 , Panel B) to the native gold surface of a commercially available integrated single-channel (i.e., non-imaging) SPR module, called SPReeta (see FIG. 67 , Panel A). The SPReeta modules are manufactured by Texas Instruments, Inc., and marketed by Nomadics, Inc. (Stillwater, Okla.). The SPReeta is an integrated package comprised of an optical plastic housing, within which is embedded a light emitting diode (LED) with a polarizer, two reflecting surfaces, i.e., the SPR surface and a mirror, and a linear diode array detector, where the mirror directs the TIR-reflected beam onto diode array. The entire package is built onto a printed circuit board (PCB), with standard dual inline pins which allow the sensor module to be plugged directly into another PCB containing preamplifier and signal processing circuits. The real-time processed data is sent to a computer (PC) via a standard serial port connector. A software application logs, analyzes, and displays the data to the user.
Numerous immobilization schemes for nucleic acid sensor molecules are possible on the gold SPR surface substrate: (1) direct attachment to the gold SPR surface of a construct with a closed stem I, and extended 3′ and 5′ termini on an open stem III, via a terminal 5′ gamma-thiol GTP incorporated during transcription (see FIG. 68 ); (2) direct attachment to a passively adsorbed neutravidin-on-gold layer on the SPR surface using constructs with a truncated, open stem I, and a closed stem III, post-transcriptionally modified by specific periodate oxidation of the 3′ terminus, followed by subsequent reaction with biotin-XX-hydrazide to produce a 3′ biotinylated hammerhead nucleic acid sensor molecule (see FIG. 69 ); (3) indirect attachment to the gold SPR surface via hybridization of a nucleic acid sensor molecule to a thiol-modified capture oligo via a 3′ terminal extension on an open stem I, with stem III closed (see FIG. 70 ). The latter two strategies are flexible in terms of application, allowing easy thermal or chemical stripping and recharging of the sensor surface with nucleic acid sensor molecules in situ, whereas direct attachment of the nucleic acid sensor molecules via incorporated thiol-groups would limit the sensor surface to a single use, or require the use of extremely harsh stripping agents.
All of the above nucleic acid sensor molecule constructs were synthesized and/or amplified from existing PCR products. Synthetic DNA templates were prepared by standard solid-phase methods and were purified by denaturing (8 M urea) polyacrylamide gel electrophoresis (PAGE). RNAs were generated by in vitro transcription of the appropriate DNA templates that were generated by PCR.
Standard in vitro transcription reactions were conducted in a total volume of 50 μl containing ˜20 pmol template DNA, 50 mM Tris-HCl (pH 7.5 at 23° C.), 10 mM MgCl2, 50 mM dithiothreitol (DTT), 20 mM spermidine, 2 mM each of the four ribonucleoside 5′-triphosphates (NTPs), and 35 units/μl T7 RNA polymerase (T7 RNAP) by incubation at 37° C. for 2 h. 5′-thiol-modified RNA was prepared by in vitro transcription wherein GTP was replaced by guanosine 5′-O-(3-thiotriphosphate) (Sigma Chemical Co., St. Louis, Mo.). 3′-biotinylatedRNA was prepared by post-transcriptionally modification by specific periodate oxidation of the 3′ terminus, followed by subsequent reaction with biotin-XX-hydrazide. The resulting RNA products were purified by denaturing 10% PAGE and isolated from the gel by elution with 10 mM Tris-HCl (pH 7.5 at 23° C.), 200 mM NaCl, and 1 mM ethylenediamine tetraacetic acid (EDTA). The recovered RNA was precipitated with ethanol, resuspended in deionized water (dH2O), and stored at −20° C. until use. In addition, the thiol-modified DNA capture oligo was synthesized and purified.
Initial surface immobilization experiments using a kinased (5′ 32P-labeled) sample of the thiol-modified DNA capture oligo were conducted on Au/Cr coated microscope slides in order to optimize the thiol-gold coupling procedure. Initial results indicated that blocking of the surface with mercaptohexanol (MCH) and control of pH during the surface coupling reaction were critical. Good surface coupling and binding capacities were observed.
The passive adsorption of neutravidin to the gold sensor surface (via cysteine residues) was investigated, prior to subsequent attachment of a biotinylated hammerhead nucleic acid sensor molecule. Purified neutravidin (Pierce, Rockford, Ill.) was acquired and flowed over the SPReeta sensor surface at a concentration of 50–100 ug/mL. The adsorption of the neutravidin was monitored in real time. cGMP and cAMP hammerhead nucleic acid sensor molecules were generated, amplified, and transcribed with a truncated, open stem I, and a closed stem III. The constructs were then post-transcriptionally modified by specific periodate oxidation of the 3′ terminus, followed by subsequent reaction with biotin-XX-hydrazide. These constructs allowed for a maximal cleavage fragment (˜65 nt=21.5 kD), and thus maximal dynamic range in the observed SPR signals , with only 5 nt retained on the surface. As with the capture oligo and direct-attachment thiol constructs, the melting temperature, Tm, of the base-paired region retaining the ribozyme body after cleavage is only ˜25° C., facilitating rapid dissociation and removal from the SPR sensor surface upon effector-induced cleavage.
After characterizing the SPR signature and kinetic parameters for neutravidin adsorption, the surface immobilization of 3′-biotinylated cGMP nucleic acid sensor molecules (see FIG. 71 , Panel A). Initial experiments showed a significant reduction in RIUs upon introduction of excess (1 mM) effector solution was introduced into the flow cell (see FIG. 71 , Panel B). For a 65 nt mass change, the maximum expected signal change (i.e., for complete cleavage of all surface-immobilized nucleic acid sensor molecules) was ˜2145 RIU; the observed signal change was ˜1487 RIU, with a signal to noise ration (SNR)>100. Subsequent negative control experiments (using cAMP) confirmed the effector-dependent origin of the observed signal. The cleavage The cleavage/dissociation time course was fitted to a pseudo-first order rate fimction (correlation coefficient=0.9977), with an observed rate constant of ˜1 per minute.
The usual scheme for attachment of the nucleic acid sensor molecule to the capture oligo and subsequent target-induced activity is shown in Panel C of FIG. 71 . In order to verify the generality of the surface attachment strategy, as well as the catalytic activity of surface-immobilized nucleic acid sensor molecules, the 3′-biotinylated cGMP-dependent hammerhead was immobilized via neutravidin to a SPREETA sensor chip surface. The cGMP HH Riboreporter surface was then exposed to a range of concentrations of cGMP (0–1 mM) and varying Mg2+ concentration in the ambient buffer (2–20 mM). Target-modulated cleavage was observed for Mg2+ concentrations>10 mM, and cGMP concentrations greater than ˜10 uM. The time-course for a portion of this type of experiment is shown in FIG. 72 . This data was generated using a single surface-adsorption step with neutravidin, followed by sequential addition of increasing concentrations of cGMP, with buffer flushes and/or active buffer pumping (peristaltic) in between each cGMP addition. All sample fluids were injected at volumes of ˜25–40 uL, while buffer washes were ˜100 uL of 1×buffer. For active pumping, volume exchange was ˜500 uL of 1×buffer.
Solid-phase Nucleic Acid Sensor Array for Assays with Fluorescent Detection—Ligase Chip
Nucleic acid sensors can be tethered to solid supports while still maintaining their activity, as shown in FIG. 66 . The plot in Panel B of FIG. 66 shows the fraction of this endonuclease-based nucleic acid sensor molecule that is released by self-cleavage over time in presence of its analyte. When exposed to its target analyte, the solid-phase nucleic acid sensor molecule increased in activity. In the case of ligase based NASMs, the sensor molecule ligated itself to a labeled oligonucleotide in the presence of target, and the detected signal increase. In the case of the endonucleolytic nucleic acid sensor, the molecule cleave a labeled oligonucleotide from itself, resulting in a decrease in the deleted signal.
These ligase based nucleic acid sensor molecules can be used in solid-state scintillation proximity assays, membrane assays, chip-based assays with fluorescent detection chip based assays with electrochemical detection, and in assays using intrinsic (non labeled detection such as, surface plasmon resonance. FIG. 74 presents the two principal solid-phase array (chip) formats used for ligase-based nucleic acid sensors. (a) In the capture format, the ligation reaction in the presence of target is performed in vitro, followed by an optional amplification step, hybridization of the reaction products (amplified or not) to a capture oligo array, and finally washing and detection/readout of the array. Here, each capture tag oligonucleotide is a unique sequence address, allowing spatial multiplexing of the assay over numerous different NASM/target combinations. (b) In the in situ format, the ligase sensors are pre-immobilized on the chip via unique capture tags; the ligation reaction in the presence of target is performed in situ on the chip surface, followed by washing and detection/readout of the array. Under ordinary solution-phase reaction conditions for ligase-based nucleic acid sensors, a external effector oligo (the non-immobilized analog of the capture oligo used to immobilize the sensor to a surface) is typically present. In order for the capture chip assay format (i.e., in vitro reaction followed by on-chip capture and readout, as shown in FIG. 74A ) to be a viable the case where no isothermal amplification step is performed prior to hybridization, it is necessary either to (a) exclude such a effector oligo form the in vitro reaction, so that the appropriate portion of the sensor sequence would be free to hybridize to the surface-immobilized capture oligo in the subsequent capture step; or (b) to include some form of effector oligonucleotide that could be easily separated or competitively displaced from the sensor molecule after the in vitro reaction, allowing hybridization to the surface-immobilized capture oligo in the subsequent capture step. Both strategies were shown to be viable. In particular, FIG. 73 shows an example, of an ERK-dependent ligase-based nucleic acid sensor system ligase-based NASMs can function effectively in solution-based assays without the presence of a effector oligonucleotide. The ligation signals from 2 separate reactions that were run in the presence of target (ERK) and the presence and absence of an external effector oligonucleotide, respectively; showed i.e., that the reaction products amplified equally in the same number of PCR cycles, that the sensor functions equally well in the presence or absence of a capture effector oligonucleotides. A parallel result is shown for the case of the reactions run in the absence of target (ERK) and the presence and absence of an external passivating capture oligo, respectively. The results, which have been shown to be valid for all ligase-based sensor systems studied (>10 different ligase sensor systems), is that the ligase-based sensors function in solution-based reactions equally well in the presence or absence of a effector oligo. The in vitro reaction steps for all capture chip data shown and referred to in the following examples were all conducted in the absence of a effector oligo.
For chip-based assays, the activity of the nucleic acid sensor molecules can be detected using many methods shown schematically in FIG. 14 . In one embodiment of the invention, the nucleic acid sensor molecule has a self cleaving activity. These nucleic acid sensors can be attached to a solid substrate in such a way that cleavage results in the release into solution of a nucleic acid fragment of known size. This fragment can then be detected through the use of agarose gels using stains that bind to nucleic acids, including ethidium bromide. The activity of the nucleic acid sensor molecule with self-cleaving activity could also be detected through attaching a fluorophore and a quencher group to either side of the cleavage site, as detailed above, and in FIG. 62 . In another embodiment of the invention, the nucleic acid sensor molecule has ligation activity. The components of a ligase-based nucleic acid sensor molecule immobilized to a chip surface are shown in FIG. 73 . The activity of this sensor in the presence of target molecules can be detected through fluorescence, chemiluminescence, radioactivity, or electrochemical means. The labeling of the sensor can be accomplished either during the assay reaction, during a subsequent amplification reaction (e.g., via RT), or after the sensor (as a component of the assay reaction products) has been captured to a microarray chip for read out, as shown in FIG. 74 .
Highly multiplexed in vitro or in situ assays can then be performed, using the specific hybridization of each sensor's unique capture oligo to address its signal to a feature spot whose position on the array is known. The presence or relative concentration of a given analyte can then be determined by the presence/absence of a signal in the expected array position, and the relative concentration determined by comparison of the relative signal intensity to that of other sensor spots in the array.
Listed below are selected DNA template sequences that can be used to generate ligase-based nucleic acid sensor molecules via PCR, as described above:
| Synthetic DNA universal templates for 2- & 3-piece | |
| ligase constructs (underlined regions = primer | |
| annealing regions) | |
| ERK.A.LIG.TMPLT | SEQ ID NO: 109 | ||
| (DG.20.58A): |
| 5′CTATAGGACTTCGGCGAAAGCCGTTCGACCACGCTAAGGAGGATTTCC | |
| GAAAGCGGCTACGGTCCGCCAGTGTCTTAGACAGGAGGTTAGGTGC | |
| ERK.E.LIG.TMPLT | SEQ ID NO: 111 | ||
| (DG.20.58E): |
| 5′-CTATAGGACTTCGGCGAAAGCCGTTCGACCAGCTAAGGAGGATTTCC | |
| GAAAGCGGCTACGGTCCGCCAGCTCTTAGACAGGAGGTTAGGTGC | |
| LYS.LIG.TMPLT.L1- | SEQ ID NO: 336 | ||
| 11.2: |
| 5′CTATAGGACTTCGGCGAAAGCTAACGTCTCATGGCTAAATTGCCATGT | |
| TGCTACAAATGATATGACTAGAGAGGTTAGGTGC | |
| FMN.LIG.TMPLT.L1- | SEQ ID: 337 | ||
| R7C13: |
| 5′CTATAGGACTTCGGTCCAGTGCTCGTGCACTAGGCCGTTCGACCTTCA | |
| GGATATGCTTCGGCAGAAGGGAACTTAGACAGGAGGTTAGGTGC3′ | |
| THEO.LIG.TMPLT.L1- | SEQ ID: 338 | ||
| D1: |
| 5′CTATAGGACTTCGGTCCAGTGCTCGTGCACTAGGCCGTTCGACCATGA | |
| TACCAGCATCGTCTTGATGCCCTTGGCAGCATCTTAGACAGGAGGTTAGG | |
| TGC | |
| For 3-piece system: |
| 5′-primer: | TK.16.32.A | SEQ ID: 339 |
| 5′-TTCTAATACGACTCACTATAGGACTTC | |
| 3′-primer (5 nt sub): | TK.16.32.B | SEQ ID: 340 |
| 5′-ATTCGAGATGTCCTTGGACCAAAGCCGCACCTAACCTC | |
| 3′-primer (15 nt sub): | TK.16.32.15NT | SEQ ID NO: 341 |
| 5′-ATTCGAGATGTCCTTGGACCAAAGCCTCCATCGTGCGCACCTAACCT | |
| C | |
| Substrate (5 nt): | TK.04.82.A | SEQ ID NO: 342 |
| 5′-Biotin/Fluor-CATGCGACCTTACGATCAGATGACCTugcacu | |
| Substrate (15 nt): | MK.08.125A | SEQ ID NO: 343 |
| 5′-Biotin-TCCATCGTGCGCACu | |
| For 2-piece system: |
| 5′ primer: | TK16.32A | SEQ ID NO: 344 |
| 5′-TTCTAATACGACTCACTATAGGACTTC | |
| 3′ primer: | MK.08.125B | SEQ ID NO: 345 |
| 5′-TCCATCGTGCGCACCTAACCTC | |
| Substrate: | MK.08.125A | SEQ ID NO: 346 |
| 5′-Biotin-TCCATCGTGCGCACu |
Conversion of Nucleic Acid Sensor Molecules into Unimolecular Ligase NASMs
The Erk and pERK dependent nucleic acid sensor molecules can be converted to unimolecular ligase NASMs. The engineered NASM ERK B, ERK CW45-33-C08 and ERK CW45-33-D09 were converted by PCR as described for FIG. 28 with primers GGACTTCGGCGAAAGC and AGTGCTCTCGCACCTAACCTCCTGTCT (SEQ ID NO:363). NASMs pERK CW45-33-C04, CW45-33-D05 and CW45-33-H03 were all converted with primers GGACTTCGGCGAAAGC (SEQ ID NO:364) and AGTGCTCTCGCACCTAACCTCCTGTCT (SEQ ID NO:365). Circularization can be detected by RTPCR for ERK B (GCTACGGTCCGCCAGTTCTT) (SEQ ID NO:366) and CGCTTTCGGAAATCCTCCTT) (SEQ ID NO:367), ERK CW45-33-C08 (GCTACGGTCCGCCAGGGGCT (SEQ ID NO:368) and CGCTTTCGGAAATCCTCCTT (SEQ ID NO:369)), ERK CW45-33-D09 (GCTACGGTCCGCCAAAAGCT (SEQ ID NO:370) and CGCTTTCGGAAATCCTCCTT (SEQ ID NO:371)) and pERK CW45-33-C04, CW45-33-D05 and CW45-33-H03 (AAGGGGAAAGCGTTATTAAG (SEQ ID NO:372) and TCGAGGAACCAATTCGCTAG (SEQ ID NO:373)).
- Andersson, K. E., H. Gemalmaz, et al. (1999). “The effect of sildenafil on apomorphine-evoked increases in intracavernous pressure in the awake rat.” J Urol 161(5): 1707–12.
- Arora, A. S., P. C. de Groen, et al. (1996). “Hepatocellular carcinoma cells resist necrosis during anoxia by preventing phospholipase-mediated calpain activation.” J Cell Physiol 167(3): 434–42.
- Asher, et al.,
PCT 98/08974 (1996) - Ballard, S. A., C. J. Gingell, et al. (1998). “Effects of sildenafil on the relaxation of human corpus cavernosum tissue in vitro and on the activities of cyclic nucleotide phosphodiesterase isozymes.” J Urol 159(6): 2164–71.
- Barlocco, D., G. Cignarella, et al. (2001). “Phenylpiperazinylalkylamino substituted pyridazinones as potent alpha(1) adrenoceptor antagonists.” J Med Chem 44(15): 2403–10.
- Basararsky, T. et al., “Overview of a Microarray Scanner: Design Essentials for an Integrated Acquisition and Analysis Platform”, in Microarray Biochip Technology, ed. by M. Schena, Eaton Publishing Co., 2000, Natick, MA, pp. 265–284.
- Beaudet L. et al., “Homogeneous Assays for Single-Nucleotide Polymorphism Typing Using AlphaScreen”, Genome Res. 11:600 (2001).
- Bell, et al., J. Biol. Chem. 273: 14309 (1998).
- Berzal-Herranz A; Joseph S; Burke J M. In vitro selection of active hairpin ribozymes by sequential RNA-catalyzed cleavage and ligation reactions. Genes and Development, 1992 January, 6(1):129–34.
- Berzas Nevado, J. J., J. Rodriguez Flores, et al. (2001). “Micellar electrokinetic capillary chromatography for the determination of Viagra and its metabolite (UK- 103,320) in human serum.” Electrophoresis 22(10): 2004–9.
- Bianchini, M., M. Radrizzani, et al. (2001). “Specific oligobodies against ERK-2 that recognize both the native and the denatured state of the protein.” J Immunol Methods 252(1–2): 191–7.
- Bloom, T. J. and J. A. Beavo (1996). “Identification and tissue-specific expression of PDE7 phosphodiesterase splice variants.” Proc Natl Acad Sci U S A 93(24): 14188–92.
- Bock, et al., Nature, 355(6360): 564–6 (1992).
- Bolger, G. B., S. Erdogan, et al. (1997). “Characterization of five different proteins produced by alternatively spliced mRNAs from the human cAMP-specific phosphodiesterase PDE4D gene.” Biochem J 328(Pt 2): 539–48.
- Breaker,. PCT WO 98/43993 (1998)
- Breaker, PCT WO 98/27104 (1998)
- Bruchez, M. et al., “Semiconductor Nanocrystals as Fluorescent labels”, Science 281, 2013 (1998).
- Burt, A. R., M. Sautel, et al. (1998). “Agonist occupation of an alpha2A-adrenoreceptor-Gi1alpha fusion protein results in activation of both receptor-linked and endogenous Gi proteins. Comparisons of their contributions to GTPase activity and signal transduction and analysis of receptor-G protein activation stoichiometry.” J Biol Chem 273(17): 10367–75.
- Caceci, et al., Byte 9: 340–362 (1984).
- Chan, V. et al., Effect of Hydrophobocity and Electrostatics on Adsorption and Surface Diffusion of DNA Oligonucleotides at Liquid/Solid Interfaces”, J. Colloid and Interface Sci. 203:197 (1998).
- Chan, W.C.W and Nie, S., “Quantum Dot Bioconjugates for Ultrasensitive Nonisotopic Detection”, Science 281: 2016 (1998).
- Coleman, D. E. and S. R. Sprang (1998). “Crystal structures of the G
protein Gi alpha 1 complexed with GDP and Mg2+: a crystallographic titration experiment.” Biochemistry 37(41): 14376–85. - Ciesiolka et al., Methods in Enzvmology 267: 3 15–335 (1996).
- Conti, M. (2000). “Phosphodiesterases and cyclic nucleotide signaling in endocrine cells.” Mol Endocrinol 14(9): 1317–27.
- Cook, N.D. et al., “SPA: a revolutionary new technique for drug screening”, Pharmaceutical Manufacturing International, 1992, pp. 49–53.
- Cooper, et al., Biochemistry 29: 926 1–9268 (1990).
- Cotten, et al., Nuc. Acid Res. 19: 2629–2635 (1991).
- Cox J C; Rudolph P; Ellington A D. Automated RNA selection. Biotechnology Progress, 1998 November-December, 14(6):845–50.
- DeRisi et al., Science 278: 680–686 (1997).
- Ellington and Szostak, Nature 346(6287): 818–822 (1990).
- Fehrentz, J. A. et al., Biochem. Biophys. Res. Commun. 188:865 (1992).
- Froehler, et al., Nucleic Acids Research 14: 53 99–5467 (1986a).
- Froehler, Tet. Lett. 27: 5575–5578 (1986b).
- Franke, B., J. W. Akkerman, et al. (1997). “Rapid Ca2+-mediated activation of Rap1 in human platelets.” Embo J 16(2): 252–9.
- Gold, et al., Annual Review of Biochemistry 64: 763–797 (1995).
- Gold, et al., Proc. Natl. Acad. Sci. 94: 59–64 (1997).
- Griffiths, et al. EMBO. J 13: 3245–3260 (1994).
- Goueli, S. A., K. Hsiao, et al. (2001). “Assaying activity of individual protein kinases in crude tissue or cellular extracts.” Methods Enzymol 333: 16–27.
- Green R; Szostak J W. Selection of a ribozyme that fuictions as a superior template in a self-copying reaction. Science, 1992
Dec 18, 258(5090):1910–15. - Guatelli, et al., Proc. Nati. Acad. Sci. 87: 1874 (1990).
- Hamaguchi, N. et al., “Aptamer Beacons for the Direct Detection of Proteins”, Anal. Biochem. 294: 126 (2001).
- Han, M. et al., “Quantum-dot-tagged microbeads for multiplexed optical coding of biomolecules”, Nature Biotechnol. 19, 631 (2001).
- Heath, R. et al., “cAMP [125I] scintillation proximity assay (SPA)—a homogeneous radioimmunoassay for cAMP”, in Cell Signalling: Experimental Strategies, ed. Reid, E., Cook, G. M. W., and Luzio, J. R., 1992, pp. 193–194.
- Heller and Morrison, in Rapid Detection and Identflcation of Infections Agents, Academic Press, Inc., San Diego, Calif., pages 245–256 (1985).
- Heller, R. A. et al., “Gene Chips and microarrays: applications in disease profiles, drug target discovery, drug action and toxicity”, in DNA Microarrays: A Practical Approach, ed. by M. Schena, Oxford University Press, 1999, Oxford, pp. 187–202.
- Hirose, et al., Tet. Lett. 28: 2449 (1978).
- Hobbs, et al., Biochemistry 12: 5138–5145 (1973).
- Hu, B., J. Ellingboe, et al. (2001). “(4-Piperidin-1-yl)phenyl amides: potent and selective human beta(3) agonists.” J Med Chem 44(9): 1456–66.
- Jameson, D. M. and Sawyer, W. H., “Fluorescence Anisotropy Applied to Biomolecular Interactions”, Methods in Enzymology 246:283 (1995).
- Jameson, D. M. and Seifried, S. E., “Quantificatin of Protein-Protein Interactions Using Fluorescence Polarization”, METHODS 19:222 (1999).
- Jellinek, et al., Biochemistry 34: 11363–11372 (1995).
- Jenne A; Hartig J S; Piganeau N; Tauer A; Samarsky D A; Green M R; Davies J; Famulok M. Rapid identification and characterization of hammerhead-ribozyme inhibitors using fluorescence-based technology. Nature Biotechnology, 2001 Jan, 19(1):56–61.
- Jeremy, J. Y., S. A. Ballard, et al. (1997). “Effects of sildenafil, a type-5 cGMP phosphodiesterase inhibitor, and papaverine on cyclic GMP and cyclic AMP levels in the rabbit corpus cavernosum in vitro.” Br J Urol 79(6): 958–63.
- Jhaveri, et al. J. Am. Chem. Soc. 122: 2469–2473 (2000).
- Jenison, et al. Science, 263(5 152): 1425–9 (1994).
- Jolley, M., “Fluorescence Polarization: an analytical tool for immunoassay and drug discovery”, Comb. Chem. High Throughput Screen. 2(4):177 (1999).
- Joyce, in Molecular Biology of RNA: UCLA Symposia on Molecular and Cellular Biology, T. R.Cech (ed.), Liss, N.Y., 1989, pp. 361–371.
- Koizumi, M., G. A. Soukup, et al. (1999). “Allosteric selection of ribozymes that respond to the second messengers cGMP and cAMP.” Nat Struct Biol 6(11): 1062–71.
- Koizumi, M., J. N. Kerr, et al. (1999). “Allosteric ribozymes sensitive to the second messengers cAMP and cGMP.” Nucleic Acids Symp Ser 42: 275–6.
- Kozasa, T. and A. G. Gilman (1995). “Purification of recombinant G proteins from Sf9 cells by hexahistidine tagging of associated subunits. Characterization of
alpha 12 and inhibition of adenylyl cyclase by alpha z.” J Biol Chem 270(4): 1734–41. - Kraus, et al., Journal of Immunology 160: 5209–52 12 (1998).
- Krishnan, et al., Science 282(53 88): 484–7 (1998).
- Kwoh, et al., Proc. Natl. Acad. Sci. 86: 1173 (1989).
- Kubik, et al., Nucleic Acids Res. 22(13): 2619–26 (1994).
- Lakowicz, J. R. and Berndt, K., “Lifetime-selective fluorescence imaging using an rf phase-sensitive camera”, Rev. Sci. Instr. 62(7):1727 (1991).
- Lakowicz, J. R., Principles of Fluorescence Spectroscopy, Second Edition, 1999. Kluwer Academic/Plenum Publishers, New York.
- Lee, E., M. E. Linder, et al. (1994). “Expression of G-protein alpha subunits in Escherichia coli.” Methods Enzymol 237: 146–64.
- Li, Y., P. M. Stemweis, et al. (1998). “Sites for Galpha binding on the G protein beta subunit overlap with sites for regulation of phospholipase Cbeta and adenylyl cyclase.” J Biol Chem 273(26): 16265–72.
- Lin, et al. Nucleic Acids Research 22: 5229–5234 (1994).
- Liu, X. and Tan, W., “A fiberoptic evanescent wave DNA biosensor based on novel molecular beacons”, Anal. Chem. 71:5054 (1999).
- Lockhart, et al., Science, 274(5287): 6 10–4 (1996).
- Mace, M. L. et al., “Novel Microarray Printing and Detection Technologies”, in Microarray Biochip Technology, ed. by M. Schena, Eaton Publishing Co., 2000, Natick, MA, pp. 39–64.
- Morrison, in Nonisotopic DNA Probe Techniques, Kricka, ed., Academic Press, Inc., San Diego, Calif., chapter 13 (1992).
- Mansour, S. J., J. M. Candia, et al. (1996). “Interdependent domains controlling the enzymatic activity of mitogen-activated
protein kinase kinase 1.” Biochemistry 35(48): 15529–36. - Min, K., N. N. Kim, et al. (2000). “Sildenafil augments pelvic nerve-mediated female genital sexual arousal in the anesthetized rabbit.” Int
J Impot Res 12 Suppl 3: S32–9. - Moreland, R. B., I. Goldstein, et al. (1998). “Sildenafil, a novel inhibitor of
phosphodiesterase type 5 in human corpus cavemosum smooth muscle cells.” Life Sci 62(20): 309–18. - Morrison, et al., Anal. Biochem 183: 23 1–244 (1989).
- Muller, T., P. Engels, et al. (1996). “Subtypes of the
type 4 cAMP phosphodiesterases: structure, regulation and selective inhibition.” Trends Pharmacol Sci 17(8): 294–8. - Nagaoka, T., T. Shirakawa, et al. (1998). “
Cyclic nucleotide phosphodiesterase 3 expression in vivo: evidence for tissue-specific expression of phosphodiesterase 3A or 3B mRNA and activity in the aorta and adipose tissue of atherosclerosis-prone insulin-resistant rats.” Diabetes 47(7): 1135–44. - Obata, T., M. B. Yaffe, et al. (2000). “Peptide and protein library screening defines optimal substrate motifs for AKT/PKB.” J Biol Chem 275(46): 36108–15.
- Obemolte, R., J. Ratzliff, et al. (1997). “Multiple splice variants of phosphodiesterase PDE4C cloned from human lung and testis.” Biochim Biolphys Acta 1353(3): 287–97.
- O'Shaughnessy, D. J., “Hydrazido-derivatized supports in affinity chromatography”, J. Chromatography, 510:13 (1990).
- Owicki, J. C. et al., “Application of Fluorescence Polarization Assays in High-Throughput Screening”, Genetic Engineering News 17(19), 1997.
- Pagratis, et al., Nat Biotechnol 15: 68–73 (1997).
- Pieken, et al., Science 253: 314–3 17 (1991).
- Pillai, R., K. Kytle, et al. (1993). “Use of a yeast expression system for the isolation and analysis of drug-resistant mutants of a mammalian phosphodiesterase.” Proc Natl Acad Sci U S A 90(24): 11970–4.
- Potyrailo, et al. Anal Chem, 70(16): 34 19–25 (1998).
- Proudnikov, D. and Mirzabekov, A., “Chemical Methods of DNA and RNA fluorescent labeling”, Nucleic Acids Res. 24(22):4535 (1996).
- Richter, W., T. Hermsdorf, et al. (2000). “Refolding, purification, and characterization of human recombinant PDE4A constructs expressed in Escherichia coli.” Protein Expr Purif 19(3): 375–83.
- Robertson, D. and Davidson, N., “Covalent coupling of ribonucleic acid to agarose”, Biochemistry 11(4):533 (1972).
- Robertson D L; Joyce G F. Selection in vitro of an RNA enzyme that specifically cleaves single-stranded DNA. Nature, 1990
Mar 29, 344(6265):467–8. - Robertson, M. P. and Ellington, A. D., “Design and optimization of effector-activated ribozyme ligases”, Nucleic Acids Res. 28(8):1751 (2000).
- Ruhn, P. F. et al., “Development of dihydrazide-activated silica supports for high-performance affinity chromatography”, J. Chromatographv A 669:9 (1994).
- Saiki, et al., Science 230: 1350–54 (1985).
- Saiki, et al., Science 239: 487–49 1 (1988).
- Sako, Y. et al., “Single-molecule imaging of EGFR signaling on the surface of living cells”, Nature Cell Bio. 2:168 (2000).
- Schena, M. and Davis, R. W, “Technology Standards for Microarray Research”, in Microarray Biochip Technology, ed. by M. Schena, Eaton Publishing Co., 2000, Natick, MA, pp1–18.
- Schermer, M. J., “Confocal scanning microscopy in microarray detection”, in DNA Microarrays: A Practical Approach, ed. by M. Schena, Oxford University Press, 1999, Oxford, pp. 17–42.
- Schluep, T. and Cooney, C. L., “Immobilization of oligonucleotides on a large pore support for plasmid purification by triplex affinity interaction”, Bioseparation 7:317 (1999).
- Seelig B; Jaschke A. A small catalytic RNA motif with Diels-Alderase activity. Chemistry and Biology, 1999 Mar, 6(3):167–76.
- Seetherman, S., et al., “Immobilized RNA switches for the analysis of complex and biological mixtures”, Nature Biotech. 19:336 (2001).
- Serivce, “Coming soon: the pocket DNA sequencer.” Science 282, 399–401
- Seiwert, S. D., T. Stines Nahreini, et al. (2000). “RNA aptamers as pathway-specific MAP kinase inhibitors.” Chem Biol 7(11): 833–43.
- Simone, et al. Trends Genet 14(7): 272–6 (1998).
- Singh, K. K. et al., “Rapid kinetic characterization of hammerhead ribozymes by real-time monitoring of fluorescence resonance energy transfer (FRET)”, RNA 5:1348 (1999).
- Singh, K. K., et al., “Fluorescence Polarization for Monitoring Ribozyme Reactions in Real Time”, BioTechniques 29:344 (2000).
- Sirinarumitr, T., P. S. Paul, et al. (1997). “Rapid in situ hybridization technique for the detection of ribonucleic acids in tissues using radiolabelled and fluorescein-labelled riboprobes.” Mol Cell Probes 11(4): 273–80.
- Sokol, et al., Proc. Natl. Acad. Sci. 95(20): 11538–43 (1998).
- Sood, et al., Nuci. Acid Res. 4:2557 (1977).
- Soukup, et al. Journal of Molecular Biology 298: 623–632 (2000).
- Sproat, et al., Nucl. Acid Res. 19:733-.738 (1991).
- Soukup, G., et al., “Generating new ligand-binding RNAs by affinity maturation and disintegration of allosteric ribozymes”, RNA 7:524 (2001).
- Stanton, M., Hamaguchi, N., and Ellington, A. Poster Presentation at the National Cancer Institute Innovative Molecular Analysis Technologies P1 Meeting, July 6–8, Chantilly, Virginia (2000)
- Stanton, J. A. and M. S. Beer (1997). “Characterisation of a cloned human 5-HT1A receptor cell line using [35S]GTP gamma S binding.” Eur J Pharmacol 320(2–3): 267–75.
- Tasset, et al. J Mol Biol, 272(5): 688–98 (1997).
- Truskey, G. A. et al., “Total internal reflection fluorescence microscopy (TIRFM): Topographical mapping of relative cell/substratum separation distances”, J. Cell Science 103:491 (1992).
- Tuerk and Gold, Science 249: 505(1990)
- Taylor, S. J., R. J. Resnick, et al. (2001). “Nonradioactive determination of Ras-GTP levels using activated ras interaction assay.” Methods Enzymol 333: 333–42.
- Tyagi, et al., Nature Biotechnology 14: 303–308 (1996).
- Usman, N. and L. M. Blatt (2000). “Nuclease-resistant synthetic ribozymes: developing a new class of therapeutics.” J Clin Invest 106(10): 1197–202.
- Walter, N. G. and Burke, J. M., “Real-time monitoring of hairpin ribozyme kinetics through base-specific quenching of fluorescein-labeled substrates”, RNA 3:392 (1997).
- Walter, N. G. et al., “Tertiary structure formation in the hairpin ribozyme monitored by fluorescence resonance energy transfer”, The EMBO Journal 17(8):2378 (1998).
- Wang, P., J. G. Myers, et al. (1997). “Expression, purification, and characterization of human cAMP-specific phosphodiesterase (PDE4) subtypes A, B, C, and D.” Biochem Biophys Res Commun 234(2): 320–4.
- Wenzel-Seifert, K. and R. Seifert (2000). “Molecular analysis of beta(2)-adrenoceptor coupling to G(s)-, G(i)-, and G(q)-proteins.” Mol Pharmacol 58(5): 954–66.
- Williams K P; Imahori H; Fujimoto D N; Inoue T. Selection of novel forms of a functional domain within the Tetrahymena ribozyme. Nucleic Acids Research, 1994
Jun 11, 22(11):2003–9. - Wilson C; Szostak JW. In vitro evolution of a self-alkylating ribozyme. Nature,
1995Apr 27, 374(6525):777–82. - Wu, P. and Brand, L., “Resonance Energy Transfer: Methods and Applications”, Anal. Biochem. 218:1(1994)
- Wu, T. P. et al., “A fluorescent-labeling method for sequencing small RNA on polyacrylamide gel”, Nucleic Acids Res. 24(17):3472 (1996).
- Zammatteo, N. et al., “Comparison between Different Strategies of Covalent Attachment of DNA to Glass Surfaces to Build DNA Microarrays”, Anal. Biochem. 280:143 (2000).
- Zhang B; Cech T R. Peptide bond formation by in vitro selected ribozymes. Nature, 1997
Nov 6, 390(6655):96–100. - Bassi, G. S., de Oliveira, D. M., White, M. F. and Weeks, K. M. (2002) Proc Natl
Acad Sci USA 99, 128–33. - Chang, L. and Karin, M. (2001)
Nature 410, 37–40. - Doudna, J. A. and Cech, T. R. (2002)
Nature 418, 222–8. - English, J. M. and Cobb, M. H. (2002) Trends Pharm. Sci. 23, 40–45.
- Koizumi, M., Soukup, G. A., Kerr, J. Q. and Breaker, R. R. (1999) Nat. Struct. Biol. 6, 1062–71.
- Myers, C. A., Kuhla, B., Cusack, S. and Lambowitz, A. M. (2002) Proc Natl
Acad Sci USA 99, 2630–5. - Pan, T. (1995) Biochemistry 34, 902–9.
- Robertson, M. P. and Ellington, A. D. (1999) Nat. Biotech. 17, 62–66.
- Robertson, M. P. and Ellington, A. D. (2000) Nucleic Acids Res. 28, 1751–9.
- Russell R. and Herschlag, D. (1999) J. Mol. Biol. 291, 1155–67.
- Sassanfar and Szostak (1993) Nature 363, 550–553.
- Soukup, G. A. and Breaker, R. R. (1999) Proc Natl
Acad Sci USA 96, 3584–9. - Soukup, G. A., DeRose, E. C., Koizumi, M. and Breaker, R. R. (2001)
RNA 7, 524–36. - Tang, J. and Breaker, R. R. (1997) Chem. Biol. 4, 453–9.
- Walter, N. G., Harris, D. A., Pereira, M. J. and Rueda D. (2001–2) Biopolymers 61, 224–42.
- Knusel, B., Rabin, S. J., Hefti, F., Kaplan, D. R. 1994. Regulated neurotrophin receptor responsiveness during neuronal migration and early differentiation. J. Neurosci 14:1542
- Fox, T., Coll, J. T., Xie, Xiaoling, Ford, P. J., Germann, U. A., Porter, M. D., Pazhanisamy, S., Fleming, M. A., Galullo, V., Su, M. S. and Wilson, K. P. (1998). “A single amino acid substitution makes ERK2 susceptible to pyridinyl imidazole inhibitors of p38 MAP kinase”. Protein Science 7: 2249–55.
- Meggio, F., Donella, D. A., Ruzzene, M., Brunati, A. M., Cesaro, L., Guerra, B., Meyer, T., Mett, H., Fabbro, D., Furet, P., et al. (1995). “Different susceptibility of protein kinases to staurosporine inhibition”. Eur J Biochem 234: 317–22.
Variations, modifications, and other implementations of what is described herein will occur to those of ordinary skill in the art without departing from the spirit and scope as claimed. Accordingly, the invention is to be defined not by the preceding illustrative description but instead by the spirit and scope of the following claims.
Claims (54)
1. A nucleic acid sensor molecule comprising
(a) a target modulation domain, wherein said target modulation domain recognizes a target molecule;
(b) a linker domain; and
(c) a catalytic domain wherein said catalytic domain comprises a cis-endonucleolytic ribozyme,
wherein said nucleic acid sensor molecule comprises an optical signal generating unit.
2. The nucleic acid sensor molecule of claim 1 , wherein said optical signal generating unit includes at least one signaling moiety.
3. The nucleic acid sensor molecule of claim 1 , wherein said optical signal generating unit comprises at least a first signaling moiety and a second signaling moiety.
4. The nucleic acid sensor molecule of claim 3 , wherein said first and second signaling moieties change proximity to each other upon recognition of a target by the target modulation domain.
5. The nucleic acid sensor molecule of claim 4 , wherein said first and second signaling moieties comprise a fluorescent donor and a fluorescent quencher, and recognition of a target by the target modulation domain results in an increase in detectable fluorescence of said fluorescent donor.
6. The nucleic acid sensor molecule of claim 4 , wherein said first signaling moiety and said second signaling moiety comprise fluorescent energy transfer (FRET) donor and acceptor groups, and recognition of a target by the target modulation domain results in a change in distance between said donor and acceptor groups, thereby changing optical properties of said molecule.
7. The nucleic acid sensor molecule of claim 1 , wherein said optical signal generating unit consists essentially of a first signaling moiety, wherein said first signaling moiety changes conformation upon recognition of a target by the target modulation domain, thereby resulting in a detectable optical signal.
8. The nucleic acid sensor molecule of claim 1 , wherein said nucleic acid sensor molecule includes at least one modified nucleic acid.
9. The nucleic acid sensor molecule of claim 1 , wherein said endonucleolytic ribozyme is a hammerhead ribozyme.
10. The nucleic acid sensor molecule of claim 1 , wherein said target recognition domain recognizes a small molecule.
11. The nucleic acid sensor molecule of claim 1 , wherein said nucleic acid sensor molecule comprises RNA, DNA, or both RNA and DNA.
12. A composition comprising the nucleic acid sensor molecule of any one of claims 1 –8, 9, 10, or 11 and a buffer.
13. A composition comprising the nucleic acid sensor molecule of any one of claims 1 –8, 9, 10, or 11 and a tissue extract, a cell extract or an in vitro cell culture.
14. The composition of claim 12 , further comprising an RNase inhibitor.
15. The composition of claim 14 , wherein said RNase inhibitor is selected from the group consisting of Va-riboside, vanadyl, tRNA, polyU, RNaseIn and RNaseOut.
16. The composition of claim 12 , wherein said composition is substantially RNase-free.
17. A composition comprising at least one nucleic acid sensor molecule according to any one of claims 1 –8 or 9, affixed to a substrate.
18. The composition of claim 17 , wherein said substrate is glass, gold or other metal, silicon or other semiconductor material, nitrocellulose, nylon, or plastic.
19. The composition of claim 17 , wherein the nucleic acid sensor molecule is covalently attached to said substrate.
20. The composition of claim 17 , wherein the nucleic acid sensor molecule is non-covalently attached to said substrate.
21. The composition of claim 17 , wherein the nucleic acid sensor molecule is immobilized to the substrate via hybridization of a terminal portion of the nucleic acid sensor molecule to an oligonucleotide that is bound to the surface of the substrate.
22. The composition of claim 17 , wherein said composition comprises a plurality of nucleic acid sensor molecules immobilized to the substrate via hybridization of a terminal portion of the nucleic acid sensor molecule to an array of oligonucleotides bound to the substrate at spatially discrete regions.
23. The composition of claim 17 , wherein at least two members of said plurality each recognize different target molecules.
24. The composition of claim 17 , wherein said substrate comprises at least 50 nucleic acid sensor molecules.
25. The composition of claim 17 , wherein said substrate comprises at least 250 nucleic acid sensor molecules.
26. The composition of claim 17 , wherein said substrate comprises at least 500 nucleic acid sensor molecules.
27. The composition of claim 17 , wherein said substrate comprises at least 5000 nucleic acid sensor molecules.
28. A system for detecting a target molecule comprising a composition according to claim 17 , and a detector in optical communication with said composition, wherein said detector detects changes in the optical properties of said composition.
29. The system of claim 28 , further comprising a light source in optical communication with said composition.
30. The system of claim 29 , further comprising a processor for processing optical signals detected by the detector.
31. The system of claim 28 , wherein said system comprises a plurality of nucleic acid sensor molecules, wherein at least two of said biosensor molecules each recognize different target molecules.
32. A method of identifying or detecting a target molecule in a sample, the method comprising:
contacting a sample suspected of containing a target molecule with a nucleic acid sensor molecule according to any one of claims 1 –8, 9, 10, or 11, wherein a change in the signal generated by the optical signal generating unit indicates the presence of said target in said sample.
33. The method of claim 32 further comprising quantifying the change signal generated by the optical signal generating unit to quantify the amount of target molecule in the sample.
34. The method of claim 32 wherein the sample is selected from the group consisting of: environmental samples, biohazard materials, organic samples, drugs and toxins, flavors and fragrances, and biological samples.
35. The method of claim 32 wherein the sample is a biological sample, including cells, cell extracts or lysates, tissues or tissue extracts, bodily fluids, serum, blood and blood products.
36. The method of claim 32 wherein the target is selected from the group consisting of proteins, post-translationally modified forms of proteins, peptides, nucleic acids, oligosaccharides, nucleotides, metabolites, drugs, toxins, biohazards, ions, carbohydrates, polysaccharides, hormones, receptors, antigens, antibodies, viruses, metabolites, co-factors, drugs, dyes, nutrients, and growth factors.
37. The method of claim 32 wherein the target is selected from the group consisting of proteins and post-translationally modified forms of proteins.
38. The method of claim 37 , wherein said target is a post-translationally modified protein, and wherein the post-translation modifications are selected from the group consisting of: phosphorylation, prenylation, glycosylation, methionine removal, N-acetylation, acylation, acylation of cysteines, myristoylation, alkylation, ubiquitinylation, prolyl-4-hydroxylation, carboxylation of glutaminyl residues, advanced glycosylation, deamination of glutamine and asparagine, addition of glycophosphatidylinositol, disulfide bond formation, hydroxylation, and lipidation.
39. The method of claim 32 wherein the target is a protein kinase.
40. The method of claim 32 wherein said target is a phosphorylated protein kinase.
41. A diagnostic system for identifying or detecting a target molecule, the diagnostic system comprising
a nucleic acid sensor molecule according to any one of claims 1 –8, 9, 10, or 11; and
a detector in communication with said nucleic acid sensor molecule, wherein said detector detects changes in the signal generated by the optical signal generating unit of said nucleic acid sensor.
42. The diagnostic system of claim 41 , further comprising a processor for processing signals detected by the detector.
43. A method of identifying or detecting a protein kinase in a sample, the method comprising:
contacting a sample suspected of containing a protein kinase with a nucleic acid sensor molecule according to claim 1 , wherein said nucleic acid sensor molecule has a target recognition domain that recognizes a protein kinase,
wherein a change in the signal generated by the optical signal generating unit indicates the presence of protein kinase in said sample.
44. The method of claim 43 , further comprising quantifying the amount of signal generated by the optical signal generating unit to quantify the amount of protein kinase in the sample.
45. The composition of claim 13 , further comprising an RNase inhibitor.
46. The composition of claim 45 , wherein said RNase inhibitor is selected from the group consisting of Va-riboside, vanadyl, tRNA, polyU, RNaseIn and RNaseOut.
47. The composition of claim 13 , wherein said composition is substantially RNase-free.
48. The method of claim 33 wherein the sample is selected from the group consisting of: environmental samples, biohazard materials, organic samples, drugs and toxins, flavors and fragrances, and biological samples.
49. The method of claim 33 wherein the sample is a biological sample, including cells, cell extracts or lysates, tissues or tissue extracts, bodily fluids, serum, blood and blood products.
50. The method of claim 33 wherein the target is selected from the group consisting of proteins, post-translationally modified forms of proteins, peptides, nucleic acids, oligosaccharides, nucleotides, metabolites, drugs, toxins, biohazards, ions, carbohydrates, polysaccharides, hormones, receptors, antigens, antibodies, viruses, metabolites, co-factors, drugs, dyes, nutrients, and growth factors.
51. The method of claim 33 wherein the target is selected from the group consisting of proteins and post-translationally modified forms of proteins.
52. The method of claim 51 , wherein said target is a post-translationally modified protein, and wherein the post-translation modifications are selected from the group consisting of: phosphorylation, prenylation, glycosylation, methionine removal, N-acetylation, acylation, acylation of cysteines, myristoylation, alkylation, ubiquitinylation, prolyl-4-hydroxylation, carboxylation of glutaminyl residues, advanced glycosylation, deamination of glutamine and asparagine, addition of glycophosphatidylinositol, disulfide bond formation, hydroxylation, and lipidation.
53. The method of claim 33 wherein the target is a protein kinase.
54. The method of claim 33 , wherein said target is a phosphorylated protein kinase.
Priority Applications (1)
| Application Number | Priority Date | Filing Date | Title |
|---|---|---|---|
| US10/215,982 US7125660B2 (en) | 2000-09-13 | 2002-08-09 | Nucleic acid sensor molecules and methods of using same |
Applications Claiming Priority (12)
| Application Number | Priority Date | Filing Date | Title |
|---|---|---|---|
| US23245400P | 2000-09-13 | 2000-09-13 | |
| US31137801P | 2001-08-09 | 2001-08-09 | |
| US31393201P | 2001-08-21 | 2001-08-21 | |
| US09/952,680 US20030087239A1 (en) | 2000-09-13 | 2001-09-13 | Target activated nucleic acid biosensor and methods of using same |
| US33818601P | 2001-11-13 | 2001-11-13 | |
| US34995902P | 2002-01-18 | 2002-01-18 | |
| US36448602P | 2002-03-13 | 2002-03-13 | |
| US36799102P | 2002-03-25 | 2002-03-25 | |
| US36988702P | 2002-04-04 | 2002-04-04 | |
| US37674402P | 2002-05-01 | 2002-05-01 | |
| US38509702P | 2002-05-31 | 2002-05-31 | |
| US10/215,982 US7125660B2 (en) | 2000-09-13 | 2002-08-09 | Nucleic acid sensor molecules and methods of using same |
Related Parent Applications (1)
| Application Number | Title | Priority Date | Filing Date |
|---|---|---|---|
| US09/952,680 Continuation-In-Part US20030087239A1 (en) | 2000-09-13 | 2001-09-13 | Target activated nucleic acid biosensor and methods of using same |
Publications (2)
| Publication Number | Publication Date |
|---|---|
| US20040219523A1 US20040219523A1 (en) | 2004-11-04 |
| US7125660B2 true US7125660B2 (en) | 2006-10-24 |
Family
ID=33314655
Family Applications (1)
| Application Number | Title | Priority Date | Filing Date |
|---|---|---|---|
| US10/215,982 Expired - Fee Related US7125660B2 (en) | 2000-09-13 | 2002-08-09 | Nucleic acid sensor molecules and methods of using same |
Country Status (1)
| Country | Link |
|---|---|
| US (1) | US7125660B2 (en) |
Cited By (35)
| Publication number | Priority date | Publication date | Assignee | Title |
|---|---|---|---|---|
| WO2003084471A2 (en) * | 2002-04-03 | 2003-10-16 | Archemix Corp. | Compositions selective for adenosine diphosphate and methods of using same |
| US20040112529A1 (en) * | 2002-10-09 | 2004-06-17 | Cellectricon Ab | Methods for interfacing macroscale components to microscale devices |
| US20040265912A1 (en) * | 2003-05-23 | 2004-12-30 | Board Of Regents, The University Of Texas System | Structure based and combinatorially selected oligonucleoside phosphorothioate and phosphorodithioate aptamer targeting AP-1 transcription factors |
| US20050214772A1 (en) * | 1998-10-26 | 2005-09-29 | Board Of Regents, The University Of Texas System | Thio modified aptamer synthetic methods and compositions |
| US20070105108A1 (en) * | 2003-06-25 | 2007-05-10 | Somagenics, Inc. | Polynucleotides capable of target-depedent circularization and topological linkage |
| US20070116786A1 (en) * | 2005-07-26 | 2007-05-24 | Naturex | A lipidic extract from lepidium meynii and its effect on the libido |
| US20080131952A1 (en) * | 2006-12-05 | 2008-06-05 | Weidong Wu | Labeled nucleotides and nucleosides and methods for their use in DNA sequencing |
| US20080132692A1 (en) * | 2006-12-05 | 2008-06-05 | Weidong Wu | Photocleavable labeled nucleotides and nucleosides and methods for their use in DNA sequencing |
| US20080200340A1 (en) * | 2001-11-15 | 2008-08-21 | Board Of Regents, The University Of Texas System | Bead Bound Combinatorial Oligonucleoside Phosphorothioate And Phosphorodithioate Aptamer Libraries |
| US20080221722A1 (en) * | 2007-03-08 | 2008-09-11 | Popp Shane M | Methods of interfacing nanomaterials for the monitoring and execution of pharmaceutical manufacturing processes |
| US20090075834A1 (en) * | 2003-09-04 | 2009-03-19 | The Regents Of The University Of California | Aptamers and methods for their in vitro selection and uses thereof |
| US7549338B1 (en) * | 2006-09-28 | 2009-06-23 | The United States Of America As Represented By The Administrator Of The National Aeronautics And Space Administration | Nanostructure sensor of presence and concentration of a target molecule |
| US20100297654A1 (en) * | 2005-06-15 | 2010-11-25 | Saint Louis University | Three-component biosensors for detecting macromolecules and other analytes |
| US20120046642A1 (en) * | 2003-04-25 | 2012-02-23 | Medtronic, Inc. | Optical detector for use in therapy |
| US8148503B2 (en) | 2008-06-11 | 2012-04-03 | Lasergen, Inc. | Nucleotides and nucleosides and methods for their use in DNA sequencing |
| US8236570B2 (en) | 2009-11-03 | 2012-08-07 | Infoscitex | Methods for identifying nucleic acid ligands |
| US8592202B2 (en) | 2003-12-12 | 2013-11-26 | Saint Louis University | Biosensors for detecting macromolecules and other analytes |
| US20140018639A1 (en) * | 2012-07-16 | 2014-01-16 | Diagnostic Biochips Llc | In Vivo Biosensor |
| US20140030787A1 (en) * | 2012-07-24 | 2014-01-30 | Jack Coleman | Multisignal reagents for labeling analytes |
| US8841429B2 (en) | 2009-11-03 | 2014-09-23 | Vivonics, Inc. | Nucleic acid ligands against infectious prions |
| US8889860B2 (en) | 2011-09-13 | 2014-11-18 | Lasergen, Inc. | 3′-OH unblocked, fast photocleavable terminating nucleotides and methods for nucleic acid sequencing |
| US8945840B2 (en) | 2005-06-10 | 2015-02-03 | Saint Louis University | Methods for the selection of aptamers |
| US20150037876A1 (en) * | 2013-07-31 | 2015-02-05 | Samsung Electronics Co., Ltd. | Multi-channel fluorescence detecting module and nucleic acid analysis system having the same |
| US8956857B2 (en) | 2005-06-06 | 2015-02-17 | Mediomics, Llc | Three-component biosensors for detecting macromolecules and other analytes |
| US20150051105A1 (en) * | 2012-04-12 | 2015-02-19 | The University Of Tokyo | Nucleic acid detection method, detection probe, detection probe set, and nucleic acid quantification method |
| US8993245B2 (en) | 2008-11-21 | 2015-03-31 | Mediomics, Llc | Biosensor for detecting multiple epitopes on a target |
| US9040287B2 (en) | 2010-02-12 | 2015-05-26 | Mediomics, Llc | Molecular biosensors capable of signal amplification |
| US20160370355A1 (en) * | 2013-09-04 | 2016-12-22 | National Centre For Biological Sciences (Ncbs-Tifr) | Nucleotide sequences, nucleic acid sensors and methods thereof |
| US9664676B2 (en) | 2013-09-06 | 2017-05-30 | Cornell University | RNA sequences that induce fluorescence of small molecule fluorophores |
| US9696298B2 (en) | 2003-04-03 | 2017-07-04 | Enzo Life Sciences, Inc. | Multisignal reagents for labeling analytes |
| US10274484B2 (en) | 2014-09-12 | 2019-04-30 | Mediomics Llc | Molecular biosensors with a modular design |
| US10316000B2 (en) | 2009-02-18 | 2019-06-11 | Cornell University | Coupled recognition/detection system for in vivo and in vitro use |
| WO2019118837A1 (en) * | 2017-12-15 | 2019-06-20 | The Regents Of The University Of Colorado, A Body Corporate | Synthetic fluorescent protein biosensors and use thereof in drug screening methods |
| US10444224B2 (en) | 2011-07-27 | 2019-10-15 | Cornell University | Method for RNA detection and quantification |
| US10849540B2 (en) | 2013-03-11 | 2020-12-01 | The University Of Toledo | Biosensor device to target analytes in situ, in vivo, and/or in real time, and methods of making and using the same |
Families Citing this family (64)
| Publication number | Priority date | Publication date | Assignee | Title |
|---|---|---|---|---|
| US20030198966A1 (en) * | 2002-04-19 | 2003-10-23 | Stojanovic Milan N. | Displacement assay for detection of small molecules |
| EP1546170A4 (en) | 2002-09-20 | 2007-08-29 | Univ Yale | Riboswitches, methods for their use, and compositions for use with riboswitches |
| US20040191801A1 (en) * | 2003-03-25 | 2004-09-30 | Heeger Alan J. | Reagentless, reusable bioelectronic detectors and their use as authentication devices |
| US8003374B2 (en) * | 2003-03-25 | 2011-08-23 | The Regents Of The University Of California | Reagentless, reusable, bioelectronic detectors |
| US20040203007A1 (en) * | 2003-04-14 | 2004-10-14 | Stojanovic Milan N. | Cross reactive arrays of three-way junction sensors for steroid determination |
| US7470516B2 (en) * | 2003-04-14 | 2008-12-30 | The Trustees Of Columbia University In The City Of New York | Cross reactive arrays of three-way junction sensors for steroid determination |
| US20050059166A1 (en) * | 2003-09-11 | 2005-03-17 | Robert Markes | Sampling instrument |
| CA2520670A1 (en) * | 2004-09-23 | 2006-03-23 | National Research Council Of Canada | Nanocrystal coated surfaces |
| US20070259356A1 (en) * | 2004-11-04 | 2007-11-08 | Applera Corporation | Concatameric Ligation Products: Compositions, Methods and Kits for Same |
| JP2008518630A (en) * | 2004-11-08 | 2008-06-05 | イェール ユニバーシティ | Riboswitch, structure-based compound design by riboswitch, and method of using riboswitch and composition with riboswitch |
| US20120053068A1 (en) * | 2004-11-18 | 2012-03-01 | Eppendorf Array Technologies | Real-time pcr of targets on a micro-array |
| JP2008522638A (en) * | 2004-12-13 | 2008-07-03 | オウトジエノミクス・インコーポレーテツド | Compositions and methods for nucleic acid analysis of sequences with insertions or deletions |
| US7811809B2 (en) * | 2005-06-15 | 2010-10-12 | Saint Louis University | Molecular biosensors for use in competition assays |
| US7791728B2 (en) * | 2005-08-11 | 2010-09-07 | Hewlett-Packard Development Company, L.P. | System for optically analyzing a substance with a selected single-wavelength |
| US7803542B2 (en) * | 2005-11-29 | 2010-09-28 | The Regents Of The University Of California | Signal-on architecture for electronic, oligonucleotide-based detectors |
| JP2009524411A (en) | 2005-12-21 | 2009-07-02 | イェール ユニバーシティー | Methods and compositions related to the regulation of riboswitches |
| US20100279422A1 (en) * | 2006-08-21 | 2010-11-04 | Cmed Technologies Ltd. | Method of surface plasmon resonance (spr) technology to detect genomic disorders for prenatal diagnosis |
| WO2008036465A2 (en) * | 2006-09-18 | 2008-03-27 | CMED Technologies Ltd. Office of Walkers Limited | A method to assess cancer susceptibility and differential diagnosis of metastases of unknown primary tumors |
| WO2008036470A2 (en) * | 2006-09-19 | 2008-03-27 | Cmed Technologies Ltd. | A method for screening of infectious agents in blood |
| US20100021971A1 (en) * | 2006-09-21 | 2010-01-28 | Cmed Technologies Ltd. | Method to remove repetitive sequences from human dna |
| US20100047815A1 (en) * | 2006-09-21 | 2010-02-25 | Cmed Technologies Ltd. | Method to detect tumor markers and diagnosis of undifferentiated tumors |
| US8119350B2 (en) * | 2006-09-25 | 2012-02-21 | Cmed Technologies Ltd | Method of surface plasmon resonance (SPR) to detect genomic aberrations in patients with multiple myeloma |
| US20100041018A1 (en) * | 2006-09-25 | 2010-02-18 | Cmed Technologies Ltd. | Method to detect virus related immunological markers for the diagnosis of hepatitis c virus infection |
| US20090311699A1 (en) * | 2006-09-25 | 2009-12-17 | Cmed Technologies Ltd. | Method of surface plasmon resonance (spr) to detect genomic aberrations in patients with chronic lymphocytic leukemia |
| WO2008085554A2 (en) * | 2006-09-25 | 2008-07-17 | Cmed Technologies Ltd. | A method to detect virus related immunologigal markers for the diagnosis of hepatitis b virus infection |
| WO2008070227A2 (en) * | 2006-09-25 | 2008-06-12 | Cmed Technologies Ltd. | A method for the identification of human immunodeficiency virus related antibodies in blood |
| US20100047789A1 (en) * | 2006-09-25 | 2010-02-25 | Cmed Technologies Ltd. | Method of surface plasmon resonance (spr) to detect genomic disorders for postnatal diagnosis |
| WO2008066996A2 (en) * | 2006-09-27 | 2008-06-05 | Cmed Technologies Ltd. | A method to detect treponema pallidum immunological markers for the diagnosis of syphilis |
| WO2008066994A2 (en) * | 2006-09-27 | 2008-06-05 | Cmed Technologies Ltd. | Application of surface plasmon resonance technology to maternal serum screening for congenital birth defects |
| WO2008067008A2 (en) * | 2006-09-27 | 2008-06-05 | Cmed Technologies Ltd. | A method for the quantitative evaluation of sex hormones in a serum sample |
| WO2008067003A2 (en) * | 2006-09-27 | 2008-06-05 | Cmed Technologies Ltd. | A method to detect virus related immunological markers for the diagnosis of respiratory tract infections |
| WO2008070241A2 (en) * | 2006-09-27 | 2008-06-12 | Cmed Technologies Ltd. | A method to measure serum biomarkers for the diagnosis of liver fibrosis |
| WO2008066997A2 (en) * | 2006-09-27 | 2008-06-05 | Cmed Technologies Ltd. | A method for quantitative measurement of cardiac biochemical markers |
| US8158440B2 (en) * | 2006-09-28 | 2012-04-17 | Cmed Technologies Ltd. | Method for quantitative measurement of thyroid related antibodies or antigens in a serum sample |
| GB2456690B (en) * | 2006-09-28 | 2012-01-25 | Cytotrend Biotech Engineering Ltd Usa Inc | A method for quantitative detection of diabetes related immunological markers |
| WO2008127382A2 (en) * | 2006-10-19 | 2008-10-23 | Yale University | Computational design of ribozymes |
| US20100134286A1 (en) * | 2008-12-01 | 2010-06-03 | General Electric Company | Radio frequency based sensors employing analyte recognition element |
| US9658178B2 (en) | 2012-09-28 | 2017-05-23 | General Electric Company | Sensor systems for measuring an interface level in a multi-phase fluid composition |
| US9589686B2 (en) | 2006-11-16 | 2017-03-07 | General Electric Company | Apparatus for detecting contaminants in a liquid and a system for use thereof |
| US9538657B2 (en) | 2012-06-29 | 2017-01-03 | General Electric Company | Resonant sensor and an associated sensing method |
| US10914698B2 (en) | 2006-11-16 | 2021-02-09 | General Electric Company | Sensing method and system |
| US9536122B2 (en) | 2014-11-04 | 2017-01-03 | General Electric Company | Disposable multivariable sensing devices having radio frequency based sensors |
| JP4751302B2 (en) | 2006-11-21 | 2011-08-17 | 株式会社日立製作所 | Potential difference sensor and analytical element |
| WO2008122960A2 (en) * | 2007-04-10 | 2008-10-16 | Microvacuum Ltd. | Label-free optical detection method |
| US20110229415A1 (en) * | 2007-08-06 | 2011-09-22 | Sylvia Daunert | Semi-synthetic antibodies as recognition elements |
| US8168379B2 (en) | 2007-10-04 | 2012-05-01 | Cmed Technologies Ltd. | Application of surface plasmon resonance technology for detecting and genotyping HPV |
| WO2009064424A1 (en) * | 2007-11-13 | 2009-05-22 | Rational Affinity Devices, L.L.C. | Tunable affinity ligands for the separation and detection of target substances |
| US20090162845A1 (en) | 2007-12-20 | 2009-06-25 | Elazar Rabbani | Affinity tag nucleic acid and protein compositions, and processes for using same |
| WO2010047797A2 (en) * | 2008-10-21 | 2010-04-29 | Research Foundation Of The City University Of New York | Single quantum-dot-based aptameric sensors |
| WO2011130346A1 (en) * | 2010-04-13 | 2011-10-20 | Sigma-Aldrich Co. | Methods for generating endogenously tagged protein |
| US9512444B2 (en) | 2010-07-23 | 2016-12-06 | Sigma-Aldrich Co. Llc | Genome editing using targeting endonucleases and single-stranded nucleic acids |
| WO2012034094A2 (en) | 2010-09-09 | 2012-03-15 | The Regents Of The University Of California | Integrated microfluidic radioassay and imaging platform for small sample analysis |
| US8542023B2 (en) | 2010-11-09 | 2013-09-24 | General Electric Company | Highly selective chemical and biological sensors |
| CA2818556A1 (en) * | 2010-11-24 | 2012-05-31 | The Regents Of The University Of California | Nucleotide-based probes and methods for the detection and quantification of macromolecules and other analytes |
| US8753309B2 (en) | 2011-06-24 | 2014-06-17 | The Invention Science Fund I, Llc | Device, system, and method including micro-patterned cell treatment array |
| EP2870475B1 (en) * | 2012-07-06 | 2017-06-07 | Innovative Technologies in Biological Systems S.L. | Fluorescent fusion polypeptide, biosensor comprising said polypeptide and uses thereof |
| DE112013004129T5 (en) | 2012-08-22 | 2015-05-21 | General Electric Company | Wireless system and method for measuring an operating condition of a machine |
| US10598650B2 (en) | 2012-08-22 | 2020-03-24 | General Electric Company | System and method for measuring an operative condition of a machine |
| US10684268B2 (en) | 2012-09-28 | 2020-06-16 | Bl Technologies, Inc. | Sensor systems for measuring an interface level in a multi-phase fluid composition |
| US10443089B2 (en) | 2013-02-26 | 2019-10-15 | National Centre For Biological Sciences (Ncbs-Tifr) | Methods of multiplexing DNA sensors and localizing DNA sensor |
| US11738995B2 (en) * | 2019-06-21 | 2023-08-29 | International Business Machines Corporation | Manipulation of a molecule using dipole moments |
| US20220113307A1 (en) * | 2020-10-09 | 2022-04-14 | Detect, Inc. | Rapid diagnostic tests utilizing trap regions |
| CN113281514B (en) * | 2021-04-26 | 2023-10-20 | 重庆医科大学 | SPRi biosensor for detecting liver cancer cell exosomes and preparation and application thereof |
| CN117024557B (en) * | 2023-10-10 | 2024-01-30 | 天津外泌体科技有限公司 | Application of 14-3-3 protein theta isomer as extracellular vesicle scaffold protein and extracellular vesicle |
Citations (80)
| Publication number | Priority date | Publication date | Assignee | Title |
|---|---|---|---|---|
| US4577109A (en) | 1980-10-06 | 1986-03-18 | Regents Of The University Of California | Remote multi-position information gathering system and method |
| US4594319A (en) | 1984-03-19 | 1986-06-10 | The University Of Tennessee Research Corp. | Protein kinase enzyme AUT-PK 500 and a radioimmunoassay for detection of neoplasia |
| US4762799A (en) | 1985-09-13 | 1988-08-09 | Fisher Scientific Company | Method and device for fluorescence determination of alkali metal cations |
| US4822746A (en) | 1986-06-25 | 1989-04-18 | Trustees Of Tufts College | Radiative and non-radiative energy transfer and absorbance modulated fluorescence detection methods and sensors |
| US4929561A (en) | 1985-08-08 | 1990-05-29 | Regents Of The University Of California | Absorption-emission optrode and methods of use thereof |
| US5037615A (en) | 1987-10-30 | 1991-08-06 | Cordis Corporation | Tethered pair fluorescence energy transfer indicators, chemical sensors, and method of making such sensors |
| WO1994029452A2 (en) | 1993-06-09 | 1994-12-22 | Ribozyme Pharmaceuticals, Inc. | Enzymatic rna molecules and their application in the treatment of fibrosis and fibrous tissue disease |
| WO1995006731A2 (en) | 1993-09-02 | 1995-03-09 | Ribozyme Pharmaceuticals, Inc. | Non-nucleotide containing enzymatic nucleic acid |
| WO1995011304A1 (en) | 1993-10-18 | 1995-04-27 | Ribozyme Pharmaceuticals, Inc. | Catalytic dna |
| WO1995013379A1 (en) | 1993-11-12 | 1995-05-18 | Ribozyme Pharmaceuticals, Inc. | Alteration of sequence of a target molecule |
| WO1995013380A2 (en) | 1993-11-12 | 1995-05-18 | Ribozyme Pharmaceuticals, Inc. | Method and reagent for treatment of arthritic conditions |
| WO1995013378A1 (en) | 1993-11-08 | 1995-05-18 | Ribozyme Pharmaceuticals, Inc. | Base-modified enzymatic nucleic acid |
| US5437840A (en) | 1994-04-15 | 1995-08-01 | Hewlett-Packard Company | Apparatus for intracavity sensing of macroscopic properties of chemicals |
| WO1995023225A2 (en) | 1994-02-23 | 1995-08-31 | Ribozyme Pharmaceuticals, Inc. | Method and reagent for inhibiting the expression of disease related genes |
| US5491063A (en) | 1994-09-01 | 1996-02-13 | Hoffmann-La Roche Inc. | Methods for in-solution quenching of fluorescently labeled oligonucleotide probes |
| US5496698A (en) | 1992-08-26 | 1996-03-05 | Ribozyme Pharmaceuticals, Inc. | Method of isolating ribozyme targets |
| WO1996009392A1 (en) | 1994-09-23 | 1996-03-28 | Ribozyme Pharmaceuticals, Inc. | RIBOZYME TREATMENT OF DISEASES OR CONDITIONS RELATED TO LEVELS OF PLASMA LIPOPROTEIN (a) [Lp(a)] BY INHIBITING APOLIPOPROTEIN (a) [APO(a)] |
| US5525468A (en) | 1992-05-14 | 1996-06-11 | Ribozyme Pharmaceuticals, Inc. | Assay for Ribozyme target site |
| WO1996018736A2 (en) | 1994-12-13 | 1996-06-20 | Ribozyme Pharmaceuticals, Inc. | Method and reagent for treatment of arthritic conditions, induction of graft tolerance and reversal of immune responses |
| WO1996027026A1 (en) | 1995-02-27 | 1996-09-06 | Intelligene Ltd. | Detection of biomolecules |
| US5583020A (en) | 1992-11-24 | 1996-12-10 | Ribozyme Pharmaceuticals, Inc. | Permeability enhancers for negatively charged polynucleotides |
| US5585245A (en) | 1994-04-22 | 1996-12-17 | California Institute Of Technology | Ubiquitin-based split protein sensor |
| US5587293A (en) | 1994-01-06 | 1996-12-24 | Terrapin Technologies, Inc. | Method to identify binding partners |
| US5589332A (en) | 1992-12-04 | 1996-12-31 | Innovir Laboratories, Inc. | Ribozyme amplified diagnostics |
| US5610052A (en) | 1992-08-26 | 1997-03-11 | Ribozyme Pharmaceuticals Inc. | Enzymatic RNA with activity to ras |
| WO1997010328A2 (en) | 1995-07-13 | 1997-03-20 | Ribozyme Pharmaceuticals, Inc. | Compositions and method for modulation of gene expression in plants |
| US5616490A (en) | 1992-12-07 | 1997-04-01 | Ribozyme Pharmaceuticals, Inc. | Ribozymes targeted to TNF-α RNA |
| US5616488A (en) | 1992-12-07 | 1997-04-01 | Ribozyme Pharmaceuticals, Inc. | IL-5 targeted ribozymes |
| WO1997015662A2 (en) | 1995-10-26 | 1997-05-01 | Ribozyme Pharmaceuticals, Inc. | Method and reagent for the treatment of diseases or conditions related to levels of vascular endothelial growth factor receptor |
| US5627053A (en) | 1994-03-29 | 1997-05-06 | Ribozyme Pharmaceuticals, Inc. | 2'deoxy-2'-alkylnucleotide containing nucleic acid |
| US5631360A (en) | 1992-05-14 | 1997-05-20 | Ribozyme Pharmaceuticals, Inc. | N-phthaloyl-protected 2'-amino-nucleoside phosphoramdites |
| US5631359A (en) | 1994-10-11 | 1997-05-20 | Ribozyme Pharmaceuticals, Inc. | Hairpin ribozymes |
| US5639647A (en) | 1994-03-29 | 1997-06-17 | Ribozyme Pharmaceuticals, Inc. | 2'-deoxy-2'alkylnucleotide containing nucleic acid |
| US5646020A (en) | 1992-05-14 | 1997-07-08 | Ribozyme Pharmaceuticals, Inc. | Hammerhead ribozymes for preferred targets |
| US5648269A (en) | 1991-05-03 | 1997-07-15 | Joseph R. Lakowicz | pH and pCO2 sensing by luminescent lifetimes and energy transfer |
| WO1997026270A2 (en) | 1996-01-16 | 1997-07-24 | Ribozyme Pharmaceuticals, Inc. | Synthesis of methoxy nucleosides and enzymatic nucleic acid molecules |
| US5672511A (en) | 1992-10-15 | 1997-09-30 | Ribozyme Pharmaceuticals, Inc. | Base-modified enzymatic nucleic acid |
| US5672501A (en) | 1994-12-23 | 1997-09-30 | Ribozyme Pharmaceuticals, Inc. | Base-modified enzymatic nucleic acid |
| US5686599A (en) | 1992-05-14 | 1997-11-11 | Ribozyme Pharmaceuticals, Inc. | Synthesis, deprotection, analysis and purification of RNA and ribozymes |
| US5700923A (en) | 1994-09-29 | 1997-12-23 | Hybridon, Inc. | Finderons and methods of their preparation and use |
| US5716824A (en) | 1995-04-20 | 1998-02-10 | Ribozyme Pharmaceuticals, Inc. | 2'-O-alkylthioalkyl and 2-C-alkylthioalkyl-containing enzymatic nucleic acids (ribozymes) |
| WO1998008974A2 (en) | 1996-08-26 | 1998-03-05 | Intelligene Ltd. | Catalytic nucleic acid and its medical use |
| US5741462A (en) | 1995-04-25 | 1998-04-21 | Irori | Remotely programmable matrices with memories |
| US5750390A (en) | 1992-08-26 | 1998-05-12 | Ribozyme Pharmaceuticals, Inc. | Method and reagent for treatment of diseases caused by expression of the bcl-2 gene |
| US5756291A (en) | 1992-08-21 | 1998-05-26 | Gilead Sciences, Inc. | Aptamers specific for biomolecules and methods of making |
| US5763175A (en) | 1995-11-17 | 1998-06-09 | Lynx Therapeutics, Inc. | Simultaneous sequencing of tagged polynucleotides |
| US5763263A (en) | 1995-11-27 | 1998-06-09 | Dehlinger; Peter J. | Method and apparatus for producing position addressable combinatorial libraries |
| WO1998024913A2 (en) | 1996-12-03 | 1998-06-11 | Ribozyme Pharmaceuticals, Inc. | Method and reagent for the treatment of a disease associated with interleukin-2 receptor gamma-chain expression |
| US5776782A (en) | 1994-02-16 | 1998-07-07 | Hamamatsu Photonics K.K. | Method for measuring fluorescence resonance energy transfer |
| US5780272A (en) | 1993-09-10 | 1998-07-14 | President And Fellows Of Harvard College | Intron-mediated recombinant techniques and reagents |
| US5783425A (en) | 1993-10-27 | 1998-07-21 | Ribozyme Pharmaceuticals, Inc. | Amino and peptido modified enzymatic nucleic acid |
| US5811300A (en) | 1992-12-07 | 1998-09-22 | Ribozyme Pharmaceuticals, Inc. | TNF-α ribozymes |
| US5834186A (en) | 1992-12-04 | 1998-11-10 | Innovir Laboratories, Inc. | Regulatable RNA molecule |
| US5843658A (en) | 1995-03-10 | 1998-12-01 | Hamamatsu Photonics K.K. | Method of measuring oligonucleotide decomposing activity |
| US5866348A (en) | 1993-02-10 | 1999-02-02 | Parkard Instrument Company, Inc. | Bioluminescence measurement system |
| US5902880A (en) | 1994-08-19 | 1999-05-11 | Ribozyme Pharmaceuticals, Inc. | RNA polymerase III-based expression of therapeutic RNAs |
| US5962675A (en) | 1996-02-13 | 1999-10-05 | Ribozyme Pharmaceuticals, Inc. | Chemical syntheses of 2'-O-methoxy purine nucleosides |
| US5977343A (en) | 1992-05-14 | 1999-11-02 | Ribozyme Pharmaceuticals, Inc. | Synthesis, deprotection, analysis and purification of RNA and ribozymes |
| US5998203A (en) | 1996-04-16 | 1999-12-07 | Ribozyme Pharmaceuticals, Inc. | Enzymatic nucleic acids containing 5'-and/or 3'-cap structures |
| US6016195A (en) | 1997-06-15 | 2000-01-18 | Alv-Laser Vertriebsgesellschaft Mbh | Fiber optic device for detecting the scattered light or fluorescent light from a suspension |
| US6046165A (en) | 1997-06-23 | 2000-04-04 | Ophidian Pharmaceuticals, Inc. | Compositions and methods for identifying and testing TGF-β pathway agonists and antagonists |
| US6048709A (en) | 1996-02-16 | 2000-04-11 | Millennium Pharmaceuticals Inc. | Compositions and methods for the treatment and diagnosis of cardiovascular disease |
| US6051380A (en) | 1993-11-01 | 2000-04-18 | Nanogen, Inc. | Methods and procedures for molecular biological analysis and diagnostics |
| US6054558A (en) | 1995-02-10 | 2000-04-25 | Millennium Pharmaceuticals, Inc. | Compositions and methods for the treatment and diagnosis of cardiovascular disease using rchd534 as a target |
| US6060252A (en) | 1999-04-12 | 2000-05-09 | Becton Dickinson And Company | Amplification and detection of shigella spp. and enteroinvasive strains of Escherichia coli |
| US6063566A (en) | 1994-05-13 | 2000-05-16 | The Scripps Research Institute | Catalytic RNA molecules |
| US6103890A (en) | 1994-05-18 | 2000-08-15 | Ribozyme Pharmaceuticals, Inc. | Enzymatic nucleic acids that cleave C-fos |
| US6127535A (en) | 1997-11-05 | 2000-10-03 | Ribozyme Pharmaceuticals, Inc. | Nucleoside triphosphates and their incorporation into oligonucleotides |
| US6127173A (en) | 1997-09-22 | 2000-10-03 | Ribozyme Pharmaceuticals, Inc. | Nucleic acid catalysts with endonuclease activity |
| US6140491A (en) | 1992-01-31 | 2000-10-31 | Ribozyme Pharmaceuticals, Inc. | Nucleozymes |
| US6146886A (en) | 1994-08-19 | 2000-11-14 | Ribozyme Pharmaceuticals, Inc. | RNA polymerase III-based expression of therapeutic RNAs |
| US6159951A (en) | 1997-02-13 | 2000-12-12 | Ribozyme Pharmaceuticals Inc. | 2'-O-amino-containing nucleoside analogs and polynucleotides |
| US6183959B1 (en) | 1997-07-03 | 2001-02-06 | Ribozyme Pharmaceuticals, Inc. | Method for target site selection and discovery |
| US6194150B1 (en) | 1995-07-07 | 2001-02-27 | Ribozyme Pharmaceuticals, Inc. | Nucleic acid based inhibition of CD40 |
| US6201113B1 (en) | 1998-03-05 | 2001-03-13 | Alison V. Todd | Zymogenic nucleic acid molecules |
| US6248878B1 (en) | 1996-12-24 | 2001-06-19 | Ribozyme Pharmaceuticals, Inc. | Nucleoside analogs |
| US6251666B1 (en) | 1997-03-31 | 2001-06-26 | Ribozyme Pharmaceuticals, Inc. | Nucleic acid catalysts comprising L-nucleotide analogs |
| US6300483B1 (en) | 1997-06-19 | 2001-10-09 | Ribozyme Pharmaceuticals, Inc. | Compositions inducing cleavage of RNA motifs |
| US6316612B1 (en) | 1997-08-22 | 2001-11-13 | Ribozyme Pharmaceuticals, Inc. | Xylofuranosly-containing nucleoside phosphoramidites and polynucleotides |
| US6395713B1 (en) | 1997-07-23 | 2002-05-28 | Ribozyme Pharmaceuticals, Inc. | Compositions for the delivery of negatively charged molecules |
Family Cites Families (1)
| Publication number | Priority date | Publication date | Assignee | Title |
|---|---|---|---|---|
| US5998200A (en) * | 1985-06-14 | 1999-12-07 | Duke University | Anti-fouling methods using enzyme coatings |
-
2002
- 2002-08-09 US US10/215,982 patent/US7125660B2/en not_active Expired - Fee Related
Patent Citations (99)
| Publication number | Priority date | Publication date | Assignee | Title |
|---|---|---|---|---|
| US4577109A (en) | 1980-10-06 | 1986-03-18 | Regents Of The University Of California | Remote multi-position information gathering system and method |
| US4594319A (en) | 1984-03-19 | 1986-06-10 | The University Of Tennessee Research Corp. | Protein kinase enzyme AUT-PK 500 and a radioimmunoassay for detection of neoplasia |
| US4929561A (en) | 1985-08-08 | 1990-05-29 | Regents Of The University Of California | Absorption-emission optrode and methods of use thereof |
| US4762799A (en) | 1985-09-13 | 1988-08-09 | Fisher Scientific Company | Method and device for fluorescence determination of alkali metal cations |
| US4822746A (en) | 1986-06-25 | 1989-04-18 | Trustees Of Tufts College | Radiative and non-radiative energy transfer and absorbance modulated fluorescence detection methods and sensors |
| US5037615A (en) | 1987-10-30 | 1991-08-06 | Cordis Corporation | Tethered pair fluorescence energy transfer indicators, chemical sensors, and method of making such sensors |
| US5648269A (en) | 1991-05-03 | 1997-07-15 | Joseph R. Lakowicz | pH and pCO2 sensing by luminescent lifetimes and energy transfer |
| US6140491A (en) | 1992-01-31 | 2000-10-31 | Ribozyme Pharmaceuticals, Inc. | Nucleozymes |
| US5631360A (en) | 1992-05-14 | 1997-05-20 | Ribozyme Pharmaceuticals, Inc. | N-phthaloyl-protected 2'-amino-nucleoside phosphoramdites |
| US5977343A (en) | 1992-05-14 | 1999-11-02 | Ribozyme Pharmaceuticals, Inc. | Synthesis, deprotection, analysis and purification of RNA and ribozymes |
| US5831071A (en) | 1992-05-14 | 1998-11-03 | Ribozyme Pharmaceuticals, Inc. | Synthesis deprotection analysis and purification of RNA and ribozymes |
| US5686599A (en) | 1992-05-14 | 1997-11-11 | Ribozyme Pharmaceuticals, Inc. | Synthesis, deprotection, analysis and purification of RNA and ribozymes |
| US5646020A (en) | 1992-05-14 | 1997-07-08 | Ribozyme Pharmaceuticals, Inc. | Hammerhead ribozymes for preferred targets |
| US5525468A (en) | 1992-05-14 | 1996-06-11 | Ribozyme Pharmaceuticals, Inc. | Assay for Ribozyme target site |
| US6353098B1 (en) | 1992-05-14 | 2002-03-05 | Ribozyme Pharmaceuticals, Inc. | Synthesis, deprotection, analysis and purification of RNA and ribozymes |
| US5756291A (en) | 1992-08-21 | 1998-05-26 | Gilead Sciences, Inc. | Aptamers specific for biomolecules and methods of making |
| US5801158A (en) | 1992-08-26 | 1998-09-01 | Ribozyme Pharmaceuticals, Inc. | Enzymatic RNA with activity to RAS |
| US5750390A (en) | 1992-08-26 | 1998-05-12 | Ribozyme Pharmaceuticals, Inc. | Method and reagent for treatment of diseases caused by expression of the bcl-2 gene |
| US5496698A (en) | 1992-08-26 | 1996-03-05 | Ribozyme Pharmaceuticals, Inc. | Method of isolating ribozyme targets |
| US5610052A (en) | 1992-08-26 | 1997-03-11 | Ribozyme Pharmaceuticals Inc. | Enzymatic RNA with activity to ras |
| US5891684A (en) | 1992-10-15 | 1999-04-06 | Ribozyme Pharmaceuticals, Inc. | Base-modified enzymatic nucleic acid |
| US5672511A (en) | 1992-10-15 | 1997-09-30 | Ribozyme Pharmaceuticals, Inc. | Base-modified enzymatic nucleic acid |
| US5767263A (en) | 1992-10-15 | 1998-06-16 | Ribozyme Pharmaceuticals, Inc. | Base-modified enzymatic nucleic acid |
| US5879938A (en) | 1992-10-15 | 1999-03-09 | Ribozyme Pharmaceuticals, Inc. | Base-modified enzymatic nucleic acid |
| US5583020A (en) | 1992-11-24 | 1996-12-10 | Ribozyme Pharmaceuticals, Inc. | Permeability enhancers for negatively charged polynucleotides |
| US5589332A (en) | 1992-12-04 | 1996-12-31 | Innovir Laboratories, Inc. | Ribozyme amplified diagnostics |
| US5834186A (en) | 1992-12-04 | 1998-11-10 | Innovir Laboratories, Inc. | Regulatable RNA molecule |
| US5811300A (en) | 1992-12-07 | 1998-09-22 | Ribozyme Pharmaceuticals, Inc. | TNF-α ribozymes |
| US5616490A (en) | 1992-12-07 | 1997-04-01 | Ribozyme Pharmaceuticals, Inc. | Ribozymes targeted to TNF-α RNA |
| US5616488A (en) | 1992-12-07 | 1997-04-01 | Ribozyme Pharmaceuticals, Inc. | IL-5 targeted ribozymes |
| US5866348A (en) | 1993-02-10 | 1999-02-02 | Parkard Instrument Company, Inc. | Bioluminescence measurement system |
| WO1994029452A2 (en) | 1993-06-09 | 1994-12-22 | Ribozyme Pharmaceuticals, Inc. | Enzymatic rna molecules and their application in the treatment of fibrosis and fibrous tissue disease |
| US6362323B1 (en) | 1993-09-02 | 2002-03-26 | Ribozyme Pharmaceuticals, Inc. | Non-nucleotide containing nucleic acid |
| US6117657A (en) | 1993-09-02 | 2000-09-12 | Ribozyme Pharmaceuticals, Inc. | Non-nucleotide containing enzymatic nucleic acid |
| WO1995006731A2 (en) | 1993-09-02 | 1995-03-09 | Ribozyme Pharmaceuticals, Inc. | Non-nucleotide containing enzymatic nucleic acid |
| US5891683A (en) | 1993-09-02 | 1999-04-06 | Ribozyme Pharmaceuticals, Inc. | Non-nucleotide containing enzymatic nucleic acid |
| US5780272A (en) | 1993-09-10 | 1998-07-14 | President And Fellows Of Harvard College | Intron-mediated recombinant techniques and reagents |
| US5861288A (en) | 1993-10-18 | 1999-01-19 | Ribozyme Pharmaceuticals, Inc. | Catalytic DNA |
| WO1995011304A1 (en) | 1993-10-18 | 1995-04-27 | Ribozyme Pharmaceuticals, Inc. | Catalytic dna |
| US6379954B1 (en) | 1993-10-27 | 2002-04-30 | Ribozyme Pharmaceuticals, Incorporated | Amido and peptido modified catalytic oligonucleotides |
| US6093555A (en) | 1993-10-27 | 2000-07-25 | Ribozyme Pharmaceuticals, Inc. | Amido and peptido modified enzymatic nucleic acid molecules |
| US5783425A (en) | 1993-10-27 | 1998-07-21 | Ribozyme Pharmaceuticals, Inc. | Amino and peptido modified enzymatic nucleic acid |
| US6051380A (en) | 1993-11-01 | 2000-04-18 | Nanogen, Inc. | Methods and procedures for molecular biological analysis and diagnostics |
| WO1995013378A1 (en) | 1993-11-08 | 1995-05-18 | Ribozyme Pharmaceuticals, Inc. | Base-modified enzymatic nucleic acid |
| WO1995013380A2 (en) | 1993-11-12 | 1995-05-18 | Ribozyme Pharmaceuticals, Inc. | Method and reagent for treatment of arthritic conditions |
| WO1995013379A1 (en) | 1993-11-12 | 1995-05-18 | Ribozyme Pharmaceuticals, Inc. | Alteration of sequence of a target molecule |
| US5587293A (en) | 1994-01-06 | 1996-12-24 | Terrapin Technologies, Inc. | Method to identify binding partners |
| US5776782A (en) | 1994-02-16 | 1998-07-07 | Hamamatsu Photonics K.K. | Method for measuring fluorescence resonance energy transfer |
| WO1995023225A2 (en) | 1994-02-23 | 1995-08-31 | Ribozyme Pharmaceuticals, Inc. | Method and reagent for inhibiting the expression of disease related genes |
| US5639647A (en) | 1994-03-29 | 1997-06-17 | Ribozyme Pharmaceuticals, Inc. | 2'-deoxy-2'alkylnucleotide containing nucleic acid |
| US6365374B1 (en) | 1994-03-29 | 2002-04-02 | Ribozyme Pharmaceuticals, Inc. | 2′-deoxy-2′-alkylnucleotide containing nucleic acid |
| US5985621A (en) | 1994-03-29 | 1999-11-16 | Ribozyme Pharmaceuticals, Inc. | 2'-deoxy-2'-alkylnucleotide containing nucleic acid |
| US5627053A (en) | 1994-03-29 | 1997-05-06 | Ribozyme Pharmaceuticals, Inc. | 2'deoxy-2'-alkylnucleotide containing nucleic acid |
| US5437840A (en) | 1994-04-15 | 1995-08-01 | Hewlett-Packard Company | Apparatus for intracavity sensing of macroscopic properties of chemicals |
| US5585245A (en) | 1994-04-22 | 1996-12-17 | California Institute Of Technology | Ubiquitin-based split protein sensor |
| US6063566A (en) | 1994-05-13 | 2000-05-16 | The Scripps Research Institute | Catalytic RNA molecules |
| US6103890A (en) | 1994-05-18 | 2000-08-15 | Ribozyme Pharmaceuticals, Inc. | Enzymatic nucleic acids that cleave C-fos |
| US6146886A (en) | 1994-08-19 | 2000-11-14 | Ribozyme Pharmaceuticals, Inc. | RNA polymerase III-based expression of therapeutic RNAs |
| US5902880A (en) | 1994-08-19 | 1999-05-11 | Ribozyme Pharmaceuticals, Inc. | RNA polymerase III-based expression of therapeutic RNAs |
| US5491063A (en) | 1994-09-01 | 1996-02-13 | Hoffmann-La Roche Inc. | Methods for in-solution quenching of fluorescently labeled oligonucleotide probes |
| WO1996009392A1 (en) | 1994-09-23 | 1996-03-28 | Ribozyme Pharmaceuticals, Inc. | RIBOZYME TREATMENT OF DISEASES OR CONDITIONS RELATED TO LEVELS OF PLASMA LIPOPROTEIN (a) [Lp(a)] BY INHIBITING APOLIPOPROTEIN (a) [APO(a)] |
| US5877022A (en) | 1994-09-23 | 1999-03-02 | Ribozyme Pharmaceuticals, Inc | Ribozymes targeted to APO(a) RNA |
| US5700923A (en) | 1994-09-29 | 1997-12-23 | Hybridon, Inc. | Finderons and methods of their preparation and use |
| US5631359A (en) | 1994-10-11 | 1997-05-20 | Ribozyme Pharmaceuticals, Inc. | Hairpin ribozymes |
| WO1996018736A2 (en) | 1994-12-13 | 1996-06-20 | Ribozyme Pharmaceuticals, Inc. | Method and reagent for treatment of arthritic conditions, induction of graft tolerance and reversal of immune responses |
| US5672501A (en) | 1994-12-23 | 1997-09-30 | Ribozyme Pharmaceuticals, Inc. | Base-modified enzymatic nucleic acid |
| US6054558A (en) | 1995-02-10 | 2000-04-25 | Millennium Pharmaceuticals, Inc. | Compositions and methods for the treatment and diagnosis of cardiovascular disease using rchd534 as a target |
| WO1996027026A1 (en) | 1995-02-27 | 1996-09-06 | Intelligene Ltd. | Detection of biomolecules |
| US5843658A (en) | 1995-03-10 | 1998-12-01 | Hamamatsu Photonics K.K. | Method of measuring oligonucleotide decomposing activity |
| US5840876A (en) | 1995-04-20 | 1998-11-24 | Ribozyme Pharmaceuticals, Inc. | 2'-O-alkylthioalkyl and 2'-C-alkylthioalkyl-containing nucleic acids |
| US5716824A (en) | 1995-04-20 | 1998-02-10 | Ribozyme Pharmaceuticals, Inc. | 2'-O-alkylthioalkyl and 2-C-alkylthioalkyl-containing enzymatic nucleic acids (ribozymes) |
| US5741462A (en) | 1995-04-25 | 1998-04-21 | Irori | Remotely programmable matrices with memories |
| US6194150B1 (en) | 1995-07-07 | 2001-02-27 | Ribozyme Pharmaceuticals, Inc. | Nucleic acid based inhibition of CD40 |
| WO1997010328A2 (en) | 1995-07-13 | 1997-03-20 | Ribozyme Pharmaceuticals, Inc. | Compositions and method for modulation of gene expression in plants |
| US6346398B1 (en) | 1995-10-26 | 2002-02-12 | Ribozyme Pharmaceuticals, Inc. | Method and reagent for the treatment of diseases or conditions related to levels of vascular endothelial growth factor receptor |
| WO1997015662A2 (en) | 1995-10-26 | 1997-05-01 | Ribozyme Pharmaceuticals, Inc. | Method and reagent for the treatment of diseases or conditions related to levels of vascular endothelial growth factor receptor |
| US5763175A (en) | 1995-11-17 | 1998-06-09 | Lynx Therapeutics, Inc. | Simultaneous sequencing of tagged polynucleotides |
| US5763263A (en) | 1995-11-27 | 1998-06-09 | Dehlinger; Peter J. | Method and apparatus for producing position addressable combinatorial libraries |
| WO1997026270A2 (en) | 1996-01-16 | 1997-07-24 | Ribozyme Pharmaceuticals, Inc. | Synthesis of methoxy nucleosides and enzymatic nucleic acid molecules |
| US5962675A (en) | 1996-02-13 | 1999-10-05 | Ribozyme Pharmaceuticals, Inc. | Chemical syntheses of 2'-O-methoxy purine nucleosides |
| US6087477A (en) | 1996-02-16 | 2000-07-11 | Millennium Pharmaceuticals, Inc. | Compositions and methods for the treatment and diagnosis of cardiovascular disease |
| US6048709A (en) | 1996-02-16 | 2000-04-11 | Millennium Pharmaceuticals Inc. | Compositions and methods for the treatment and diagnosis of cardiovascular disease |
| US5998203A (en) | 1996-04-16 | 1999-12-07 | Ribozyme Pharmaceuticals, Inc. | Enzymatic nucleic acids containing 5'-and/or 3'-cap structures |
| WO1998008974A2 (en) | 1996-08-26 | 1998-03-05 | Intelligene Ltd. | Catalytic nucleic acid and its medical use |
| WO1998024913A2 (en) | 1996-12-03 | 1998-06-11 | Ribozyme Pharmaceuticals, Inc. | Method and reagent for the treatment of a disease associated with interleukin-2 receptor gamma-chain expression |
| US5807743A (en) | 1996-12-03 | 1998-09-15 | Ribozyme Pharmaceuticals, Inc. | Interleukin-2 receptor gamma-chain ribozymes |
| US6248878B1 (en) | 1996-12-24 | 2001-06-19 | Ribozyme Pharmaceuticals, Inc. | Nucleoside analogs |
| US6159951A (en) | 1997-02-13 | 2000-12-12 | Ribozyme Pharmaceuticals Inc. | 2'-O-amino-containing nucleoside analogs and polynucleotides |
| US6251666B1 (en) | 1997-03-31 | 2001-06-26 | Ribozyme Pharmaceuticals, Inc. | Nucleic acid catalysts comprising L-nucleotide analogs |
| US6016195A (en) | 1997-06-15 | 2000-01-18 | Alv-Laser Vertriebsgesellschaft Mbh | Fiber optic device for detecting the scattered light or fluorescent light from a suspension |
| US6300483B1 (en) | 1997-06-19 | 2001-10-09 | Ribozyme Pharmaceuticals, Inc. | Compositions inducing cleavage of RNA motifs |
| US6046165A (en) | 1997-06-23 | 2000-04-04 | Ophidian Pharmaceuticals, Inc. | Compositions and methods for identifying and testing TGF-β pathway agonists and antagonists |
| US6183959B1 (en) | 1997-07-03 | 2001-02-06 | Ribozyme Pharmaceuticals, Inc. | Method for target site selection and discovery |
| US6395713B1 (en) | 1997-07-23 | 2002-05-28 | Ribozyme Pharmaceuticals, Inc. | Compositions for the delivery of negatively charged molecules |
| US6316612B1 (en) | 1997-08-22 | 2001-11-13 | Ribozyme Pharmaceuticals, Inc. | Xylofuranosly-containing nucleoside phosphoramidites and polynucleotides |
| US6127173A (en) | 1997-09-22 | 2000-10-03 | Ribozyme Pharmaceuticals, Inc. | Nucleic acid catalysts with endonuclease activity |
| US6127535A (en) | 1997-11-05 | 2000-10-03 | Ribozyme Pharmaceuticals, Inc. | Nucleoside triphosphates and their incorporation into oligonucleotides |
| US6201113B1 (en) | 1998-03-05 | 2001-03-13 | Alison V. Todd | Zymogenic nucleic acid molecules |
| US6060252A (en) | 1999-04-12 | 2000-05-09 | Becton Dickinson And Company | Amplification and detection of shigella spp. and enteroinvasive strains of Escherichia coli |
Non-Patent Citations (99)
| Title |
|---|
| Andersson et al. J. Urol., 161(5):1707-1712 (1999). |
| Arora et al. J. Cell. Physiol., 167(3):434-442 (1996). |
| Ballard et al. J. Urol., 159(6):2164-2171 (1998). |
| Barlocco et al. J. Med. Chem., 44(15):2403-2410 (2001). |
| Basararsky, et al., in Microarray Biochip Technology, ed. by M. Schena, Eaton Publishing Co., 2000, Natick, MA, pp. 265-284. |
| Beaudet et al., Genome Res. 11: 600-608 (2001). |
| Bell, et al., J Biol Chem 273: 14309-14314 (1998). |
| Berzal-Herranz, et al., Genes and Development, 6(1):129-134 (1992). |
| Berzas-Nevado et al. Electrophoresis, 22(10):2004-2009 (2001). |
| Bianchini, et al., J Immunol Methods 252: 191-197 (2001). |
| Bloom, and Beavo, Proc. Natl. Acad. Sci. U S A 93: 14188-14192 (1996). |
| Bock, et al., Nature 355: 564-566 (1992). |
| Bolger, et al., Biochem J. 328: 539-548 (1997). |
| Breaker R.R. Chem. Rev., 97:371-390 (1997). |
| Breaker R.R. Curr. Opin. Biotech., 13:31-39 (2002). |
| Breaker R.R. Curr. Opin. Biotech., 7:442-448 (1996). |
| Breaker R.R. Curr. Opin. Chem. Biol., 1:26-31 (1997). |
| Breaker R.R. Intracellular Ribozyme Applications in Principles and Protocols, pp. 1-19; Horizon Scientific Press, Wymondham UK, Rossi and Couture, eds., (1999). |
| Breaker R.R. Nat. Biotech., 15:427-131 (1997). |
| Bruchez et al. Science, 281:2013-2016 (1998). |
| Burns et al. Science, 282:484-487 (1998). |
| Burns, et al., Science 282: 484-487 (1998). |
| Burt et al. J. Biol. Chem., 273(17):10367-10375 (1998). |
| Caceci et al. BYTE, 9(5):340-362 (1984). |
| Carmi et al. Chem. & Biol., 3:1039-1046 (1996). |
| Chan et al. Science, 281:2016-2018 (1998). |
| Chan, et al., J. Colloid and Interface Sci. 203:197-207 (1998). |
| Chee et al. Science, 274:610-614 (1996). |
| Chee, et al., Science, 274: 610-614 (1996). |
| Coleman, et al., Biochemistry 37(41): 14376-14385 (1998). |
| Cooper, et al., Biochemistry 29: 9261-9268 (1990). |
| Cox, et al. Biotechnology Progress, Nov.-Dec., 1998 14: 845-850. |
| DeRisi, et al., Science 278: 680-686 (1997). |
| Ellington, and Szostak, Nature 346: 818-822 (1990). |
| Fehrentz, et al., Biochem. Biophys. Res. Commun. 188: 865-872 (1992). |
| Fitzwater and Polisky., Methods in Enzymology. 267: 275-301 (1996). |
| Gold, et al., Annual Review of Biochemistry 64: 763-797 (1995). |
| Gold, et al., Proc. Natl. Acad. Sci. 94: 59-64 (1997). |
| Golden, et al., Journal of Biotechnology. 81(2-3): 167-178 (2000). |
| Goueli, et al., Methods Enzymol 333: 16-27(2001). |
| Green, and Szostak, Science, Dec. 18, 1992 258(5090):1910-1915. |
| Griffiths, et al., EMBO. J 13: 3245-3260 (1994). |
| Hamaguchi, N. et al., Anal. Biochem. 294: 126-131 (2001). |
| Haseloff and Gerlach (1988). Nature 334: 585-591. |
| Heath, et al., in Cell Signalling: Experimental Strategies, ed. Reid, E., Cook, G.M.W., and Luzio, J.R.,: 193-194 (1999). |
| Heller and Morrison, in Rapid Detection and Identflcation of Infections Agents, Academic ress, Inc., San Diego, Calif.,: 245-256 (1985). |
| Heller, et al., in DNA Microarrays: A Practical Approach, ed. by M. Schena, Oxford University Press, Oxford : 187-202 (1999). |
| International Search Report for PCT/US 02/25319, mailed Jul. 17, 2003. |
| International Search Report for PCT/US01/28835. Mailed on Jan. 13, 2003. |
| Jellinek, et al., Biochemistry 34: 11363-11372 (1995). |
| Jenison, et al., Science, 263: 1425-1429 (1994). |
| Jenne, et al., Nature Biotechnology, 19(1): 56-61 (2001). |
| Joyce, in Molecular Biology of RNA: UCLA Symposia on Molecular and Cellular Biology, ed. T. R.Cech , Liss, N.Y.:361-371 (1989). |
| Koizumi, et al., Nat Struct Biol 6(11): 1-10 (1999). |
| Koizumi, et al., Nucleic Acids Symp Ser 42: 275-276 (1999). |
| Kraus, et al., Journal of Immunology 160: 5209-5212 (1998). |
| Kubik, et al., Nucleic Acids Res. 22(13): 2619-2626 (1994). |
| Lin, et al. Nucleic Acids Res. 22: 5229-5234 (1994). |
| Liu, and Tan, Anal. Chem. 71: 5054-5059 (1999). |
| Morrison, in Nonisotopic DNA Probe Techniques, Kricka, ed., Academic Press, Inc., San Diego, CA, chapter 13 (1992). |
| Obata, et al., J Biol Chem 275(46): 36108-36115 (2000). |
| Pagratis, et al., Nat. Biotechnol. 15: 68-73 (1997). |
| Pieken, et al., Science 253: 314-317 (1991). |
| Pillai, et al., Proc Natl Acad Sci USA 90: 11970-11974 (1993). |
| Potyrailo, et al., Anal Chem, 70(16): 3419-3425 (1998). |
| Ringquist, et al., Cytometry. 33(4): 394-405 (1998). |
| Robertson, and Ellington, Nucleic Acids Res. 28(8):1751-1759 (2000). |
| Robertson, and Joyce, Nature 344(6265):467-468 (1990). |
| Schena, and Davis, in Microarray Biochip Technology, ed. by M. Schena, Eaton Publishing Co., Natick, MA: 1-18: (2000). |
| Schermer, in DNA Microarrays: A Practical Approach, ed. by M. Schena, Oxford University Press, Oxford, 17-42: (1999). |
| Schluep, and Cooney, Bioseparation 7: 317-326 (1999). |
| Seelig , and Jaschke, Chemistry and Biology, 6(3): 167-76 (1999). |
| Seetherman, et al., Nature Biotech. 19:336-341 (2001). |
| Seiwert, et al., Chem Biol 7(11): 833-843 (2000). |
| Service, Science 282: 399-401 (1998). |
| Simone, et al., Trends Genet 14(7): 272-276 (1998). |
| Singh, et al., BioTechniques 29: 344-351 (2000). |
| Singh, et al., RNA 5: 1348-1356 (1999). |
| Sirinarumitr, et al., Mol Cell Probes 11: 273-280 (1997). |
| Sokol, et al., Proc. Natl. Acad. Sci. 95: 11538-11543 (1998). |
| Soukup, and Breaker, Proc. Natl. Acad. Sci. USA 96: 3584-3589 (1999). |
| Soukup, et al., Journal of Molecular Biology 298: 623-632 (2000). |
| Soukup, et al., RNA 7: 524-536 (2001). |
| Sproat, et al., Nuci. Acid Res. 19: 733-.738 (1991). |
| Tang, and Breaker, Chemistry & Biology 4(6): 453-459 (1997). |
| Tasset, et al., J Mol Biol, 272: 688-698 (1997). |
| Taylor, et al., Methods Enzymol. 333: 333-342 (2001). |
| Tuerk, and Gold, Science 249: 505-510 (1990). |
| Tuschl, et al. (1994). Science 266: 785-789. |
| Tyagi, et al., Nature Biotechnology 14: 303-308 (1996). |
| Wallace, et al., European Biophysics Journal. 29(4-5): 254 (2000). |
| Walter, and Burke, RNA 3: 392-402 (1997). |
| Walter, et al., The EMBO Journal 17: 2378-2391 (1998). |
| Weeks, et al., Current Opinion in Structural Biology 7(3): 336-342 (1997). |
| Williams, et al., Nucleic Acids Research, 22(11): 2003-2009 (1994). |
| Wilson, and Szostak, Nature 374: 777-782 (1995). |
| Yamamoto, et al., Genes to Cells. 5(5): 389-396 (2000). |
| Zammatteo, et al., Anal. Biochem. 280:143-150 (2000). |
| Zhang, et al., Nature 390: 96-100 (1997). |
Cited By (80)
| Publication number | Priority date | Publication date | Assignee | Title |
|---|---|---|---|---|
| US20050214772A1 (en) * | 1998-10-26 | 2005-09-29 | Board Of Regents, The University Of Texas System | Thio modified aptamer synthetic methods and compositions |
| US20080200340A1 (en) * | 2001-11-15 | 2008-08-21 | Board Of Regents, The University Of Texas System | Bead Bound Combinatorial Oligonucleoside Phosphorothioate And Phosphorodithioate Aptamer Libraries |
| US20080255005A1 (en) * | 2001-11-15 | 2008-10-16 | Board Of Regents, The University Of Texas System | Bead Bound Combinatorial Oligonucleoside Phosphorothioate And Phosphorodithioate Aptamer Libraries |
| WO2003084471A2 (en) * | 2002-04-03 | 2003-10-16 | Archemix Corp. | Compositions selective for adenosine diphosphate and methods of using same |
| WO2003084471A3 (en) * | 2002-04-03 | 2007-05-24 | Archemix Corp | Compositions selective for adenosine diphosphate and methods of using same |
| US20040112529A1 (en) * | 2002-10-09 | 2004-06-17 | Cellectricon Ab | Methods for interfacing macroscale components to microscale devices |
| US20090123922A1 (en) * | 2002-10-16 | 2009-05-14 | Board Of Regents, The University Of Texas System | Bead Bound Combinatorial Oligonucleoside Phosphorothioate And Phosphorodithioate Aptamer Libraries |
| US11073512B2 (en) | 2003-04-03 | 2021-07-27 | Enzo Life Sciences, Inc. | Multisignal reagents for labeling analytes |
| US9696298B2 (en) | 2003-04-03 | 2017-07-04 | Enzo Life Sciences, Inc. | Multisignal reagents for labeling analytes |
| US10184934B2 (en) | 2003-04-03 | 2019-01-22 | Enzo Life Sciences, Inc. | Multisignal reagents for labeling analytes |
| US8940522B2 (en) * | 2003-04-25 | 2015-01-27 | Medtronic, Inc. | Optical detector for use in therapy |
| US20120046642A1 (en) * | 2003-04-25 | 2012-02-23 | Medtronic, Inc. | Optical detector for use in therapy |
| US9567579B2 (en) | 2003-05-23 | 2017-02-14 | Board Of Regents, The University Of Texas System | Structure based and combinatorially selected oligonucleoside phosphorothioate and phosphorodithioate aptamer targeting AP-1 transcription factors |
| US20110212843A1 (en) * | 2003-05-23 | 2011-09-01 | Board Of Regents, The University Of Texas System | Structure based and combinatorially selected oligonucleoside phosphorothioate and phosphorodithioate aptamer targeting ap-1 transcription factors |
| US20040265912A1 (en) * | 2003-05-23 | 2004-12-30 | Board Of Regents, The University Of Texas System | Structure based and combinatorially selected oligonucleoside phosphorothioate and phosphorodithioate aptamer targeting AP-1 transcription factors |
| US7910523B2 (en) | 2003-05-23 | 2011-03-22 | Board Of Regents, The University Of Texas System | Structure based and combinatorially selected oligonucleoside phosphorothioate and phosphorodithioate aptamer targeting AP-1 transcription factors |
| US20070105108A1 (en) * | 2003-06-25 | 2007-05-10 | Somagenics, Inc. | Polynucleotides capable of target-depedent circularization and topological linkage |
| US8105982B2 (en) * | 2003-09-04 | 2012-01-31 | The Regents Of The University Of California | Aptamers and methods for their in vitro selection and uses thereof |
| US20090075834A1 (en) * | 2003-09-04 | 2009-03-19 | The Regents Of The University Of California | Aptamers and methods for their in vitro selection and uses thereof |
| US8592202B2 (en) | 2003-12-12 | 2013-11-26 | Saint Louis University | Biosensors for detecting macromolecules and other analytes |
| US8956857B2 (en) | 2005-06-06 | 2015-02-17 | Mediomics, Llc | Three-component biosensors for detecting macromolecules and other analytes |
| US8945840B2 (en) | 2005-06-10 | 2015-02-03 | Saint Louis University | Methods for the selection of aptamers |
| US9951376B2 (en) | 2005-06-10 | 2018-04-24 | Saint Louis University | Methods for the selection of aptamers |
| US20100297654A1 (en) * | 2005-06-15 | 2010-11-25 | Saint Louis University | Three-component biosensors for detecting macromolecules and other analytes |
| US9618505B2 (en) | 2005-06-15 | 2017-04-11 | Mediomics, Llc | Biosensors for detecting macromolecules and other analytes |
| US8431388B2 (en) | 2005-06-15 | 2013-04-30 | Saint Louis University | Three-component biosensors for detecting macromolecules and other analytes |
| US20070116786A1 (en) * | 2005-07-26 | 2007-05-24 | Naturex | A lipidic extract from lepidium meynii and its effect on the libido |
| US7549338B1 (en) * | 2006-09-28 | 2009-06-23 | The United States Of America As Represented By The Administrator Of The National Aeronautics And Space Administration | Nanostructure sensor of presence and concentration of a target molecule |
| US7897737B2 (en) | 2006-12-05 | 2011-03-01 | Lasergen, Inc. | 3′-OH unblocked, nucleotides and nucleosides, base modified with photocleavable, terminating groups and methods for their use in DNA sequencing |
| US20110200988A1 (en) * | 2006-12-05 | 2011-08-18 | Weidong Wu | 3'-OH unblocked uncleotides and nucleosides base modified with non-cleavable, terminating groups and methods for their use in DNA squencing |
| US20090081686A1 (en) * | 2006-12-05 | 2009-03-26 | Weidong Wu | Photocleavable labeled nucleotides and nucleosides and methods for their use in dna sequencing |
| US8969535B2 (en) | 2006-12-05 | 2015-03-03 | Lasergen, Inc. | Photocleavable labeled nucleotides and nucleosides and methods for their use in DNA sequencing |
| US8198029B2 (en) | 2006-12-05 | 2012-06-12 | Lasergen, Inc | 3'-OH unblocked nucleotides and nucleosides base modified with non-cleavable, terminating groups and methods for their use in DNA sequencing |
| US8361727B2 (en) | 2006-12-05 | 2013-01-29 | Lasergen, Inc. | 3′OH-unblocked, nucleotides and nucleosides base modified with labels and photocleavable, terminating groups and methods for their use in DNA sequencing |
| US7893227B2 (en) | 2006-12-05 | 2011-02-22 | Lasergen, Inc. | 3′-OH unblocked nucleotides and nucleosides base modified with non-cleavable, terminating groups and methods for their use in DNA sequencing |
| US7964352B2 (en) | 2006-12-05 | 2011-06-21 | Lasergen, Inc. | 3′-OH unblocked nucleotides and nucleosides, base modified with labels and photocleavable, terminating groups and methods for their use in DNA sequencing |
| US20080131952A1 (en) * | 2006-12-05 | 2008-06-05 | Weidong Wu | Labeled nucleotides and nucleosides and methods for their use in DNA sequencing |
| US20080132692A1 (en) * | 2006-12-05 | 2008-06-05 | Weidong Wu | Photocleavable labeled nucleotides and nucleosides and methods for their use in DNA sequencing |
| US20080221722A1 (en) * | 2007-03-08 | 2008-09-11 | Popp Shane M | Methods of interfacing nanomaterials for the monitoring and execution of pharmaceutical manufacturing processes |
| US7680553B2 (en) | 2007-03-08 | 2010-03-16 | Smp Logic Systems Llc | Methods of interfacing nanomaterials for the monitoring and execution of pharmaceutical manufacturing processes |
| US9200319B2 (en) | 2008-06-11 | 2015-12-01 | Lasergen, Inc. | Nucleotides and nucleosides and methods for their use in DNA sequencing |
| US8877905B2 (en) | 2008-06-11 | 2014-11-04 | Lasergen, Inc. | Nucleotides and nucleosides and methods for their use in DNA sequencing |
| US8148503B2 (en) | 2008-06-11 | 2012-04-03 | Lasergen, Inc. | Nucleotides and nucleosides and methods for their use in DNA sequencing |
| US8497360B2 (en) | 2008-06-11 | 2013-07-30 | Lasergen, Inc. | Nucleotides and nucleosides and methods for their use in DNA sequencing |
| US8993245B2 (en) | 2008-11-21 | 2015-03-31 | Mediomics, Llc | Biosensor for detecting multiple epitopes on a target |
| US10416157B2 (en) | 2008-11-21 | 2019-09-17 | Saint Louis University | Biosensor for detecting multiple epitopes on a target |
| US9671403B2 (en) | 2008-11-21 | 2017-06-06 | Mediomics, Llc | Biosensor for detecting multiple epitopes on a target |
| US11629131B2 (en) | 2009-02-18 | 2023-04-18 | Cornell University | Coupled recognition/detection system for in vivo and in vitro use |
| US10316000B2 (en) | 2009-02-18 | 2019-06-11 | Cornell University | Coupled recognition/detection system for in vivo and in vitro use |
| US9085773B2 (en) | 2009-11-03 | 2015-07-21 | Vivonics, Inc. | Methods for identifying nucleic acid ligands |
| US8236570B2 (en) | 2009-11-03 | 2012-08-07 | Infoscitex | Methods for identifying nucleic acid ligands |
| US8841429B2 (en) | 2009-11-03 | 2014-09-23 | Vivonics, Inc. | Nucleic acid ligands against infectious prions |
| US9040287B2 (en) | 2010-02-12 | 2015-05-26 | Mediomics, Llc | Molecular biosensors capable of signal amplification |
| US10416154B2 (en) | 2010-02-12 | 2019-09-17 | Mediomics Llc | Molecular biosensors capable of signal amplification |
| US9797892B2 (en) | 2010-02-12 | 2017-10-24 | Saint Louis University | Molecular biosensors capable of signal amplification |
| US10444224B2 (en) | 2011-07-27 | 2019-10-15 | Cornell University | Method for RNA detection and quantification |
| US11453646B2 (en) | 2011-07-27 | 2022-09-27 | Cornell University | Methods for RNA detection and quantification |
| US9399798B2 (en) | 2011-09-13 | 2016-07-26 | Lasergen, Inc. | 3′-OH unblocked, fast photocleavable terminating nucleotides and methods for nucleic acid sequencing |
| US9689035B2 (en) | 2011-09-13 | 2017-06-27 | Lasergen, Inc. | 3′-OH unblocked, fast photocleavable terminating nucleotides and methods for nucleic acid sequencing |
| US11001886B2 (en) | 2011-09-13 | 2021-05-11 | Agilent Technologies, Inc. | 3′-OH unblocked, fast photocleavable terminating nucleotides and methods for nucleic acid sequencing |
| US10041115B2 (en) | 2011-09-13 | 2018-08-07 | Lasergen, Inc. | 3′-OH unblocked, fast photocleavable terminating nucleotides and methods for nucleic acid sequencing |
| US8889860B2 (en) | 2011-09-13 | 2014-11-18 | Lasergen, Inc. | 3′-OH unblocked, fast photocleavable terminating nucleotides and methods for nucleic acid sequencing |
| US20150051105A1 (en) * | 2012-04-12 | 2015-02-19 | The University Of Tokyo | Nucleic acid detection method, detection probe, detection probe set, and nucleic acid quantification method |
| US9850535B2 (en) * | 2012-04-12 | 2017-12-26 | The University Of Tokyo | Nucleic acid detection method, detection probe, detection probe set, and nucleic acid quantification method |
| US20140018639A1 (en) * | 2012-07-16 | 2014-01-16 | Diagnostic Biochips Llc | In Vivo Biosensor |
| US9883826B2 (en) * | 2012-07-16 | 2018-02-06 | Diagnostic Biochips, Inc. | In vivo biosensor |
| US20150164397A1 (en) * | 2012-07-16 | 2015-06-18 | Diagnostic Biochips, Inc. | In Vivo Biosensor |
| US10302633B2 (en) | 2012-07-24 | 2019-05-28 | Enzo Life Sciences, Inc. | Multisignal reagents for labeling analytes |
| US10060910B2 (en) * | 2012-07-24 | 2018-08-28 | Enzo Life Sciences, Inc. | Multisignal reagents for labeling analytes |
| US10627397B2 (en) | 2012-07-24 | 2020-04-21 | Enzo Life Sciences, Inc. | Multisignal reagents for labeling analytes |
| US11162939B2 (en) | 2012-07-24 | 2021-11-02 | Enzo Life Sciences, Inc. | Multisignal reagents for labeling analytes |
| US20140030787A1 (en) * | 2012-07-24 | 2014-01-30 | Jack Coleman | Multisignal reagents for labeling analytes |
| US10849540B2 (en) | 2013-03-11 | 2020-12-01 | The University Of Toledo | Biosensor device to target analytes in situ, in vivo, and/or in real time, and methods of making and using the same |
| US9244014B2 (en) * | 2013-07-31 | 2016-01-26 | Samsung Electronics Co., Ltd. | Multi-channel fluorescence detecting module and nucleic acid analysis system having the same |
| US20150037876A1 (en) * | 2013-07-31 | 2015-02-05 | Samsung Electronics Co., Ltd. | Multi-channel fluorescence detecting module and nucleic acid analysis system having the same |
| US20160370355A1 (en) * | 2013-09-04 | 2016-12-22 | National Centre For Biological Sciences (Ncbs-Tifr) | Nucleotide sequences, nucleic acid sensors and methods thereof |
| US10175232B2 (en) * | 2013-09-04 | 2019-01-08 | National Centre For Biological Sciences (Ncbs-Tifr) | Nucleotide sequences, nucleic acid sensors and methods thereof |
| US9664676B2 (en) | 2013-09-06 | 2017-05-30 | Cornell University | RNA sequences that induce fluorescence of small molecule fluorophores |
| US10274484B2 (en) | 2014-09-12 | 2019-04-30 | Mediomics Llc | Molecular biosensors with a modular design |
| WO2019118837A1 (en) * | 2017-12-15 | 2019-06-20 | The Regents Of The University Of Colorado, A Body Corporate | Synthetic fluorescent protein biosensors and use thereof in drug screening methods |
Also Published As
| Publication number | Publication date |
|---|---|
| US20040219523A1 (en) | 2004-11-04 |
Similar Documents
| Publication | Publication Date | Title |
|---|---|---|
| US7125660B2 (en) | Nucleic acid sensor molecules and methods of using same | |
| US20030087239A1 (en) | Target activated nucleic acid biosensor and methods of using same | |
| US20030228603A1 (en) | Compositions selective for caffeine or aspartame and methods of using same | |
| Hesselberth et al. | In vitro selection of nucleic acids for diagnostic applications | |
| Barrett et al. | Microarrays: the use of oligonucleotides and cDNA for the analysis of gene expression | |
| WO2003084471A2 (en) | Compositions selective for adenosine diphosphate and methods of using same | |
| US6582908B2 (en) | Oligonucleotides | |
| CA2452819C (en) | High throughput assay system | |
| US7060431B2 (en) | Method of making and decoding of array sensors with microspheres | |
| Meisner et al. | mRNA openers and closers: modulating AU‐rich element‐controlled mRNA stability by a molecular switch in mRNA secondary structure | |
| JP5049395B2 (en) | High-throughput assay system | |
| Ma et al. | Chemical microarray: a new tool for drug screening and discovery | |
| KR20020011443A (en) | High Throughput Assay System | |
| US6316608B1 (en) | Combined polynucleotide sequence as discrete assay endpoints | |
| WO2003014375A2 (en) | Nucleic acid sensor molecules and methods of using same | |
| US20100105572A1 (en) | High throughput assay system | |
| He et al. | Ligand discovery using small molecule microarrays | |
| WO2000037684A9 (en) | High throughput assay system using mass spectrometry | |
| JP2010524459A (en) | Nucleic acid chip for generating binding profile of unknown biomolecule and single-stranded nucleic acid, method for producing nucleic acid chip, and method for analyzing unknown biomolecule using nucleic acid chip | |
| WO2005080592A1 (en) | Method of immobilizing nucleic acid aptamers | |
| US20040096840A1 (en) | Validated design for microarrays | |
| KR100923048B1 (en) | Nucleic Acid Chip for Obtaining Bind Profile of Single Strand Nucleic Acid and Unknown Biomolecule, Manufacturing Method Thereof, and Analysis Method of Unknown Biomolecule Using Nucleic Acid Chip | |
| US20030039967A1 (en) | High throughput assay system using mass spectrometry | |
| US20090054250A1 (en) | Methods to create fluorescent biosensors using aptamers with fluorescent base analogs | |
| JP2005501237A (en) | Method and apparatus for trilabel microarray |
Legal Events
| Date | Code | Title | Description |
|---|---|---|---|
| AS | Assignment |
Owner name: ARCHEMIX CORPORATION, MASSACHUSETTS Free format text: ASSIGNMENT OF ASSIGNORS INTEREST;ASSIGNORS:STANTON, MARTY;EPSTEIN, DAVID;HAMAGUCHI, NOBUKO;AND OTHERS;REEL/FRAME:013469/0673;SIGNING DATES FROM 20021007 TO 20021010 |
|
| REMI | Maintenance fee reminder mailed | ||
| LAPS | Lapse for failure to pay maintenance fees | ||
| STCH | Information on status: patent discontinuation |
Free format text: PATENT EXPIRED DUE TO NONPAYMENT OF MAINTENANCE FEES UNDER 37 CFR 1.362 |
|
| FP | Lapsed due to failure to pay maintenance fee |
Effective date: 20101024 |