US7013285B1 - System and method for data collection, evaluation, information generation, and presentation - Google Patents
System and method for data collection, evaluation, information generation, and presentation Download PDFInfo
- Publication number
- US7013285B1 US7013285B1 US09/538,570 US53857000A US7013285B1 US 7013285 B1 US7013285 B1 US 7013285B1 US 53857000 A US53857000 A US 53857000A US 7013285 B1 US7013285 B1 US 7013285B1
- Authority
- US
- United States
- Prior art keywords
- data
- module
- processing modules
- processing module
- computer systems
- Prior art date
- Legal status (The legal status is an assumption and is not a legal conclusion. Google has not performed a legal analysis and makes no representation as to the accuracy of the status listed.)
- Expired - Lifetime
Links
Images


Classifications
-
- G—PHYSICS
- G06—COMPUTING; CALCULATING OR COUNTING
- G06Q—INFORMATION AND COMMUNICATION TECHNOLOGY [ICT] SPECIALLY ADAPTED FOR ADMINISTRATIVE, COMMERCIAL, FINANCIAL, MANAGERIAL OR SUPERVISORY PURPOSES; SYSTEMS OR METHODS SPECIALLY ADAPTED FOR ADMINISTRATIVE, COMMERCIAL, FINANCIAL, MANAGERIAL OR SUPERVISORY PURPOSES, NOT OTHERWISE PROVIDED FOR
- G06Q30/00—Commerce
- G06Q30/02—Marketing; Price estimation or determination; Fundraising
- G06Q30/0201—Market modelling; Market analysis; Collecting market data
- G06Q30/0202—Market predictions or forecasting for commercial activities
-
- G—PHYSICS
- G06—COMPUTING; CALCULATING OR COUNTING
- G06Q—INFORMATION AND COMMUNICATION TECHNOLOGY [ICT] SPECIALLY ADAPTED FOR ADMINISTRATIVE, COMMERCIAL, FINANCIAL, MANAGERIAL OR SUPERVISORY PURPOSES; SYSTEMS OR METHODS SPECIALLY ADAPTED FOR ADMINISTRATIVE, COMMERCIAL, FINANCIAL, MANAGERIAL OR SUPERVISORY PURPOSES, NOT OTHERWISE PROVIDED FOR
- G06Q30/00—Commerce
- G06Q30/02—Marketing; Price estimation or determination; Fundraising
- G06Q30/0201—Market modelling; Market analysis; Collecting market data
- G06Q30/0203—Market surveys; Market polls
-
- Y—GENERAL TAGGING OF NEW TECHNOLOGICAL DEVELOPMENTS; GENERAL TAGGING OF CROSS-SECTIONAL TECHNOLOGIES SPANNING OVER SEVERAL SECTIONS OF THE IPC; TECHNICAL SUBJECTS COVERED BY FORMER USPC CROSS-REFERENCE ART COLLECTIONS [XRACs] AND DIGESTS
- Y10—TECHNICAL SUBJECTS COVERED BY FORMER USPC
- Y10S—TECHNICAL SUBJECTS COVERED BY FORMER USPC CROSS-REFERENCE ART COLLECTIONS [XRACs] AND DIGESTS
- Y10S707/00—Data processing: database and file management or data structures
- Y10S707/99931—Database or file accessing
Definitions
- the present invention relates to a system and method for data collection, evaluation, information generation, and presentation. More particularly the present invention relates to a system for collecting, evaluating, and presenting data, and generating information relating to electronic commerce.
- the system and methods of the present invention include one or more of the following: a module for stabilizing small or noisy samples of data; alarm modules that alert an event handler when data values cross specified thresholds; predictor modules that use recent historical data along with an estimated and/or available saturation population function as the basis for a differential equation that defines the growth of the population to a maximum attainable level; and a dynamic icon that conveys to users of a system levels of predefined activity occurring on the system.
- e-commerce means commercial transactions for goods or services, particularly wholesale or retail sales of products or services, or bartered exchange of the foregoing, over global computer networks, such as the Internet, or any smaller computer network that unites users and suppliers of goods or services.
- the Internet has been swiftly facilitating the growth of local and regional markets into national and international markets.
- This market expansion provides consumers with many new advantages and opportunities including better product pricing, product selection, product quality, and customer service.
- the market expansion also creates new advantages and opportunities for businesses, including a broader base of consumers and suppliers. With the advantages and opportunities come new challenges.
- the surveys are typically presented to consumers as paper questionnaires for the consumers to manually fill in. Such surveys may be costly to construct and print. Once printed, they cannot be modified. Consumers generally dislike filling out survey questionnaires, and therefore it may be difficult or time consuming for the survey sponsor to gather enough completed survey questionnaires to constitute a statistically significant sample size. Often, the completed survey questionnaires must be returned by mail; even if a consumer has filled out the survey questionnaire, the consumer may not take the trouble of dropping it in the mailbox.
- survey sponsors sometimes employ individuals to field survey responses from individuals. These individuals may be stationed in a store to verbally field answers to survey questions or they may telephone consumers after a transaction.
- the problem with using individuals to administer surveys is the cost of administering the survey and the intrusiveness of the process. The intrusiveness is such that consumers may be alienated from doing further business with a merchant. This is particularly a concern relative to telephone surveys. With intrusive survey methods, even if the consumer is inclined to answer questions by a survey taker, the consumer's answers may be skewed toward an unfavorable response, creating inaccurate results.
- the processing of completed survey questionnaires has its own set of disadvantages.
- the completed survey questionnaires usually must be read by data entry personnel and manually input by them into a data processing system. This not only adds to the cost of administering a survey, but it also results in delays between the time surveys are taken and the time the results are processed.
- the results may no longer be accurate.
- a business may have dropped prices in the interval between the responses to a survey and the processing and reporting of information. During such an interval, a business could lose significant sales and revenues because they have not reacted contemporaneously to competitors' price changes. If there is a decline in consumer service ratings that is not corrected quickly because of the interval between survey responses and reporting of results, a business may also lose consumer goodwill, and consequently sales and revenues.
- the system of the assignee overcomes disadvantages in the art by providing a system that electronically gathers data and transmits it directly into the data processing system.
- this system eliminates the need for manual entry of data on paper forms; the use of individuals to take and input survey data gathered from consumers; the delays that occur between data collection and input, and data input and processing; and the costs associated with such methodologies.
- this system has begun to address many disadvantages of traditional modes of surveying, processing, and evaluating survey data, the dynamics of the e-commerce marketplace demand faster and more accurate data gathering, processing, evaluation and reporting of data and information.
- the rate at which reports can be issued depends on how fast survey responses are returned and on the minimum sample size required. It is fundamental in statistical sciences that, when conventional modes of statistical analysis are employed, an inadequately small sample or a noisy sample will lead to inaccurate results. However, business and marketplace conditions may be changing faster than adequate sample sizes can be gathered for accurate results using conventional modes of statistical analysis and estimation theory. Such conventional modes include “moving window averages” (weighted and unweighted). Accordingly, businesses may be at risk if certain trends relating to the business or marketplace take shape before data is collected in sample sizes suitable for traditional modes of statistical analysis and estimation.
- the present invention relates to a system and method for data collection, information generation, evaluation, and presentation that overcomes the aforementioned problems in the prior art. More particularly the present invention relates to a system for collecting data, generating, evaluating, and presenting information relating to electronic commerce via the Internet.
- the system and methods of the present invention include one or more of the following: a module for stabilizing small or noisy samples of data; alarm modules that alert a handler when data values are anomalous or cross specified thresholds; predictor modules that use recent historical data along with an estimated and/or available saturation population function as the basis for a differential equation that predicts the future growth of the population to a maximum attainable level; and a dynamic measurement indicator that conveys to users of a system levels of predefined and ongoing activity occurring on another system.
- the fields of the invention include ecommerce; information retrieval/analysis; and planning and control.
- the period for gathering sufficient quantities of data to resolve a trend often exceeded the time required for a merchant to begin suffering lost sales or other harms because of an undetected incipient trend.
- the present invention provides a system for data collection, evaluation, information generation, and/or presentation comprising a data capture server capable of receiving data from a data source; one or more databases for receiving data from the data capture server; a plurality of processing modules in communication with each other and/or the one or more databases, each processing module performing a predefined operation on data stored in a database or received from a processing module, at least two processing modules being selected from the group consisting of: a statistical analysis processing module; a data stabilizer processing module; a saturation limited forecasting module; a dynamic activity-level icon module; and an alarm filter module; one or more databases in communication with one or more processing modules for storing processed data received from a selected processing module; and a presentation server in communication with one or more of the databases for receiving items of data stored therein and presenting selected items of data.
- any combination of processing modules may be selected.
- the foregoing embodiment may provide for the data capture server to be communication with a data source comprising one or more remote computer systems.
- the data capture server may be adapted to receive data from computer systems of consumers following an online e-commerce transaction.
- the present invention provides a system for data collection, evaluation, information generation, and/or presentation comprising a data capture server capable of receiving data from a data source over a computer network, the data source providing data related to a transaction between buyers and sellers; one or more databases for receiving data from the data capture server; a plurality of processing modules in communication with each other and/or one or more of the databases, each processing module performing a predefined operation on data stored in a database or received from a processing module, at least two processing modules being selected from the group consisting of: a statistical analysis processing module; a data stabilizer processing module; a saturation limited forecasting module; a dynamic activity-level icon module; and an alarm filter module; one or more databases in communication with one or more processing modules for storing processed data received from a selected processing module; and a presentation server in communication with one or more of the databases for receiving items of data stored therein and presenting selected items of data as data or information, data on the presentation server being accessible to remote computer systems via a network.
- a data capture server capable of receiving data
- the network over which the data source and data capture server communicate may be the Internet, and the presentation server may be accessible by remote computer systems via the Internet.
- the foregoing embodiments may further provide for a survey server that serves a survey questionnaire to a remote computer system comprising a data source so that a user of a remote computer system comprising the data source can complete the survey questionnaire, a completed survey questionnaire containing data supplied by the user being returnable to the data capture server over the Internet.
- the remote computer systems may be a plurality of consumer and/or merchant computer systems.
- a consumer may complete a survey questionnaire with data about an online transaction between the consumer and a merchant.
- the presentation server may serve data comprising ratings about online merchants, the ratings being based on data collected by the data capture server from consumer computer systems.
- the present invention provides a presentation server for serving web pages to a plurality of remote computer systems over a network; the web pages including ratings information for one or more merchants; the ratings information being derived from data captured from buyer computer systems and processed by a data stabilizer processing module.
- the web page may further include a link to the website of a rated merchant. It may also include a dynamic activity-level icon for showing the level of a predetermined activity at a rated merchant website.
- the web page may further include information about incentive programs offered to a user of a remote computer system.
- the present invention provides a presentation server for serving web pages via a network to a plurality of remote computer systems; one or more web pages including a dynamic activity-level icon for indicating a level of a predetermined activity at one or more predetermined websites.
- a web page may include at least two dynamic activity-level icons, each being for competitive merchants and the web page is accessible by remote computer systems of consumers.
- the network may be the Internet.
- the web page in the foregoing embodiment may include a reference dynamic activity-level icon.
- one or more dynamic activity-level icons on a web page may be each associated with a link to a corresponding merchant website.
- the ratings for a merchant may also be associated with the dynamic activity-level icon and the link to the merchant website.
- the present invention provides a presentation server for serving web pages via a network to a plurality of remote computer systems; one or more web pages including a dynamic activity-level icon for indicating a level of a predetermined activity for one or more products being sold by one or more merchants over a computer network.
- the presentation server may make the web pages accessible to consumer computer systems via a network comprising the Internet.
- the present invention provides a presentation server that includes and serves a dynamic activity-level applet via a network to a plurality of remote computer systems, the applet enabling a remote computer system to access a data source that communicates data representative of a predefined activity level, the applet implementing a dynamic activity-level icon on a display of the remote computer system based on and responsive to the data communicated to it.
- the presentation server may serve the applet to remote computer systems comprising consumer computer systems.
- the network may be the Internet.
- the presentation server provides a method for data collection, evaluation, information generation, and/or presentation comprising capturing data from a data source in a data capture server; transferring data from the data capture server to one or more databases for receiving data; transferring data from the one or more databases to one or more processing modules, each processing module capable of performing a predefined operation on transferred data, at least two processing modules being selected from the group consisting of: a statistical analysis processing module; a data stabilizer processing module; a saturation limited forecasting module; a dynamic activity-level icon module; and an alarm filter module, the processing module outputting processed data or information; presenting selected items of processed data or information via a presentation server.
- the data may be transferred to the data capture server by one or more remote computer systems via a network, which may be the Internet, for example.
- the captured data may relate e-commerce transactions.
- the online transactions may be consumer-merchant transactions and/or business to business transactions.
- the data may be transferred to the data capture server via consumer computer systems.
- the method may also include providing a survey server that serves a survey questionnaire to one or more remote computer systems comprising data sources so that a user of a remote computer system comprising the data source can complete the survey questionnaire, a completed survey questionnaire containing data supplied by the user being returnable to the data capture server over the Internet.
- the one or more remote computer systems may be a plurality of consumer and/or merchant computer systems and the completed survey questionnaire contain data about an online transaction between the consumer and a merchant.
- the presentation server may serve data comprising ratings about online merchants. The ratings may be derived from data collected by the data capture server from consumer computer systems.
- the present invention provides a method comprising deriving ratings for one or more merchants using a data stabilizer, and serving web pages to a plurality of remote networked computer systems, the web pages including the derived ratings information for one or more merchants.
- the served web pages may include a link to the website of a rated merchant.
- a web page may include a dynamic activity-level icon for showing the level of a predetermined activity at a rated merchant website.
- the web page may include information about incentive programs offered to a user.
- the method may include associating one or more dynamic activity-level icons for indicating a level of a predetermined activity at one or more predetermined websites with one or more web pages, and serving the one or more web pages via a network to a plurality of remote computer systems.
- a web page may include at least two dynamic activity-level icons, each being for competitive merchants and the web page is accessible by remote computer systems of consumers.
- a reference dynamic activity-level icon may also be included.
- One or more dynamic activity-level icons on a web page may be associated with a link to a corresponding merchant website.
- the ratings for a merchant may also be associated with the dynamic activity-level icon and/or the link to the merchant website.
- a web page may include at least two dynamic activity-level icons, one indicating the level of a predefined activity for a merchant website, the other being a reference icon for indicating a predetermined level of the predefined activity, the web page being accessible by a consumer remote computer system.
- the present invention provides a method comprising serving web pages via a network comprising the Internet to a plurality of remote consumer computer systems; one or more web pages including a dynamic activity-level icon for indicating a level of a predetermined activity for one or more products being sold by one or more merchants over a computer network.
- a web page may include at least two dynamic activity-level icons, each being for competitive merchants and the web page is accessible by remote computer systems of consumers.
- the dynamic activity-level icons may relate to relative buying activity at the merchant websites.
- the present invention provides a method comprising serving a dynamic activity-level applet via a network to a plurality of remote computer systems, the applet enabling a remote computer system to access a data source that communicates data representative of a predefined activity level, the applet implementing one or more dynamic activity-level icons on a display of the remote computer system based on and responsive to the data communicated to it.
- the presentation server serves the applet to remote computer systems comprising consumer computer systems.
- data is communicated to a consumer computer system with the applet for input into the applet, the applet implementing the dynamic activity-level icon in accordance to the input data.
- the communicated data may relate to activities at one or more merchant websites.
- the communicated data may relate to relative buying activities at competitive merchant websites.
- the communicated data may relate to activity levels for one or more of a product, product-type, and product category.
- the present invention provides a presentation server that includes web pages containing data or information that has been derived from at least two processing modules selected from the group consisting of a statistical analysis processing module; a data stabilizer processing module; a saturation limited forecasting module; a dynamic activity-level icon module; and an alarm filter module, the web pages being accessible to a plurality of remote merchant systems over a computer network, such as the Internet.
- the present invention provides a presentation server that includes web pages containing data or information that has been derived from at least two processing modules selected from the group consisting of a statistical analysis processing module; a data stabilizer processing module; a saturation limited forecasting module; a dynamic activity-level icon module; and an alarm filter module, the web pages being accessible to a plurality of remote consumer computer systems over a computer network, such as the Internet.
- the web pages may include, for example, evaluation information about merchant performance, the information being derived from data processed by a selected processing module.
- FIGS. 1 (a–g) is an example of a possible consumer survey questionnaire for rating an online merchant and collecting demographic information about a consumer.
- FIGS. 2 (a–b) is another example of a possible consumer survey questionnaire for rating an online merchant and collecting demographic information about a consumer.
- FIG. 3 is a schema of a system for processing and evaluating data relating to e-commerce, in accordance with one or more aspects of the present invention.
- FIG. 4 is a block diagram that generally illustrates some features of a computer system that may be used in the present invention.
- FIGS. 5 a–e show means of presenting certain kinds of information processed from data collected from an exemplary consumer survey questionnaire, the information being presented in tabular and graphical formats.
- FIGS. 6 a–b show means of presenting certain kinds of information processed from data collected from an exemplary consumer survey questionnaire, the information being presented in tabular and graphical format.
- FIG. 7 is a flow chart for a processing module that may be used in the system of FIG. 3 .
- FIG. 8 is a flow chart for steps performed by the processing module of FIG. 7 .
- FIG. 9 is a flow chart of an alarm filter system, according to the present invention, that activates an alarm under specified conditions.
- FIG. 10 is a flow chart for a processing module that may be used in the system of FIG. 3 .
- FIG. 11 is a schematic representation of functions related to the processing module of FIG. 10 .
- FIG. 12 is a graphical representation of functions related to the processing module of FIG. 10 .
- FIG. 13 graphically illustrates that the prime pull (saturation limit) P 0 draws and meters the growth of P 1 , in accordance with the principles of the processing module of FIG. 10 .
- FIG. 14 is an input array related to the processing module of FIG. 10 .
- FIG. 15 is a flow chart for a processing module that may be used in the system of FIG. 3 .
- FIG. 16 is an example web page from an infomediary website showing features of the present invention.
- FIG. 17 is an example web page from the infomediary website of FIG. 16 showing features of the present invention.
- FIG. 18 is an example web page from the infomediary website of FIG. 16 showing features of the present invention.
- FIGS. 19 a–b are an example web page from the infomediary site of FIG. 16 describing certain features in accordance with the present invention.
- FIG. 20 is an example third party web page that is linked to the infomediary web page of FIG. 18 , which is included to illustrate features of the present invention. (The applicant for patent claims no rights in the content of the third party web page shown, with all rights to such content remaining with the owner of that page.)
- FIG. 20 is an example web page from the infomediary website of FIG. 16 showing features of the present invention.
- FIG. 21 is an example web page from the infomediary website of FIG. 16 showing features of the present invention.
- FIG. 22 is an example web page from the infomediary website of FIG. 16 showing features of the present invention.
- FIG. 23 is an example web page from the infomediary website of FIG. 16 showing features of the present invention.
- the present invention is a novel system and method for processing and evaluating data, and generating information relating to networked information retrieval and analysis, planning and control; and particularly e-commerce.
- the system preferably uses data gathered from or about transactions that occur online.
- the data may be gathered from any number of sources. It may be directly gathered from providers of goods or services, e.g., merchants, and users of goods or services, e.g., consumers, or other participants in an online transaction.
- the data may also be gathered from third-party suppliers of previously collected data.
- the data may be evaluated with respect to transactions with particular merchants, a group of merchants, a group of consumers, or with respect to one or more categories of trade based on data gathered from one or more merchants, consumers, or third-party data sources in one or more trade categories.
- Products and services may be evaluated based on defined attributes.
- defined attributes could include: satisfaction with product quality, price, durability, longevity, safety, warranty, customer service; ease of assembly, use, maintenance or repair; cost of operation or repair; upgradability; compatibility, etc.
- Consumer survey questionnaires served at time of purchase or following a purchase could be used to collect attribute data.
- the data could be provided by expert non-consumers such as expert evaluators, as well as other conventional means.
- an intermediary data source could collect data about merchants or products.
- An intermediary would be a party that is not the manufacturer or seller of the thing being evaluated.
- an intermediary website could allow evaluators, such as consumers, to complete questionnaires for merchants, products, or services they wish to rate.
- the questionnaires could be provided on web pages served to consumers by the intermediary's web server.
- the website could offer incentives to motivate consumers to complete surveys.
- the intermediary could supply or provide the completed survey questionnaire data to or for the data capture systems of the present invention, as described below.
- FIGS. 1 show one possible embodiment of an online survey questionnaire.
- the Figures show screen shots of a consumer survey questionnaire for a retail online transaction.
- the survey questionnaire may be accessed through a direct link or a framed linked on a merchant's web page that connects to the survey questionnaire host server.
- the consumer may be invited to fill out an online survey questionnaire following an online purchase, for example.
- the invitation may be conveniently included on the invoice or order confirmation web page or email.
- the survey questionnaire 100 invites a consumer to rate a merchant relative to five attributes in ten dimensions (a 1–10 rating):
- This attribute relates to the convenience and speed of ordering from the merchant's website.
- This attribute relates to the breadth of products that the merchant has available, keeping in mind the merchant's stated area of focus.
- This attribute relates to the quality, quantity, and relevance of information provided for making a purchase decision an informed one.
- This attribute relates to the overall layout/organization, movement around the site; missing/non-functional links; speed; and how appropriately graphics were used to enhance the shopping experience.
- the survey questionnaire includes ten merchant rating fields 112 for each attribute. It also includes an “NA” (not applicable) field. A rating of 1–2 corresponds to “not at all” satisfied; 3–4, “a little” satisfied; 5–6 “somewhat” satisfied; 7–8 “quite a bit” satisfied; and 9–10 “highly” satisfied. Performance ratings are intended to give merchants an accurate and comprehensive understanding of how they are performing in the eyes of their consumers.
- the collected survey questionnaire data from a survey questionnaire 100 is communicated to a data capture server 14 where the data is parsed, stored, and communicated to storage, processing modules, etc. described herein.
- one or more post-purchase or “fulfillment” survey questionnaires 200 may be sent to a consumer that has filled out the survey questionnaire 100 and taken delivery of the purchased product at set intervals.
- the survey questionnaire may, for example, be sent by email and may include a hyperlink to a survey questionnaire server 14 where the collected survey questionnaire data is parsed, stored, and communicated to processing modules described herein. The consumer is asked to rate the merchant relative to five attributes in ten dimensions:
- This attribute relates to timeliness in the context of the promised delivery date.
- This attribute relates to how well the online product description and depiction compared to what was actually delivered.
- This attribute relates to how available and effective the merchant was in resolving any questions/complaints or problems that the consumer encountered. It also relates to any steps the merchant took to make sure that that the consumer was informed of order status and was happy with the transaction. (This is left blank if not applicable.)
- This attribute related to the security of credit card, personal, and transaction information.
- This attribute relates to the appropriateness and condition of product packaging.
- a merchant's fulfillment ratings may be expressed as a rating on a scale of 1–10 in fulfillment rating fields 212 .
- a rating of 1–2 corresponds to “not at all” satisfied; 3–4, “a little” satisfied; 5–6 “somewhat” satisfied; 7–8 “quite a bit” satisfied; and 9–10 “highly” satisfied.
- Performance ratings are intended to give merchants an accurate and comprehensive understanding of how they performed in the eyes of their consumers.
- survey questionnaires 100 and 200 are merely exemplary.
- the survey questionnaires may include more or less attributes than are shown, may be based on other quantitative rating scales, may be based on qualitative ratings, etc. In other words, the survey questionnaires may be customized to evaluate any matter of interest.
- a survey questionnaire may also include fields relating to a consumer's particular demographics, preferences, dollar amounts spent, expectations, comments, etc. as shown in survey questionnaires 100 and 200 .
- FIGS. 1 b – 1 f and 2 b are screenshots of survey questionnaires that query a consumer on such other information.
- the survey questionnaire may include data that is automatically attached to the survey questionnaire or otherwise associated with it by the merchant.
- This data may include an identifier for the purchased product (e.g., sku), product purchase price, number ordered, etc.
- the information can provide comprehensive measurement and benchmarking of buyer demographics, transactional behaviors, and shopping preferences because it has been continuously collecting point-of-sale data from online consumers.
- the foregoing survey questionnaires and other potentially obtainable data through such survey questionnaires or other means are examples of data relating to an e-commerce transaction between a consumer and a merchant.
- the information that may be extracted from the data helps merchants increase buyer conversion and build loyalty through understanding buyer preferences; and provides companies with the ability to ask custom survey questions directly from any demographic or online shopping category by appending those questions to a survey questionnaire such as survey questionnaire 100 or 200 .
- the data may also be developed into information that helps educate consumers about their options in the e-commerce marketplace.
- the captured data is entered into a survey data store and processed into information according to the methods described in more detail below.
- data means facts and beliefs about the real world
- information is data that has been processed and formatted to support decision making.
- FIG. 3 shows an overview of a through-flow system 10 , according to the present invention.
- the term “through-flow” generally means a system for gathering, transferring, processing, evaluating data, and/or generating information in a continual stream, as well as presenting and delivering such data and/or information in desired media to interested parties or other systems.
- the system 10 may be used to evaluate data from a variety of sources, as mentioned above. As indicated, for instance, it may receive and evaluate data from consumer satisfaction survey questionnaires, it may receive data from online merchants about their activities, or it may receive data from users or third parties who gather and provide data about electronic commerce.
- system 10 includes two or more networked computers.
- System 10 may be divided into a client or remote system 11 that is composed of one or more remote computer systems or terminals, e.g., 12 and 13 , and a server or local system 5 composed of one or more computer systems with one or more sets of system components that are physically located together or networked together over some distance.
- System 5 is the side of system 10 that collects, processes, and evaluates data, and generates and presents the resulting information.
- System 11 is the side of system 10 that may provide data to system 5 , or retrieve data from system 5 .
- FIG. 4 illustrates features that would typically be found in a computer system of system 10 .
- a “computer system” generally means a set of components that include one or more of the following: central processing unit (“CPU”) 4 .
- CPU central processing unit
- the computer system particularly computer systems in system 11 may also be in the form of a Personal Digital Assistant (PDA), a wireless computer system or device capable of network communications over the Internet or other network, or a computer terminal or Internet appliance capable of such network communications.
- PDA Personal Digital Assistant
- the local system 5 generally includes data capture server 14 that accepts data transfer from one or more data sources from remote system 11 computer systems or terminals. The data may also enter the data capture server by direct manual input or connection to storage medium such as a CD-ROM, disk drive, floppy drive, memory cards, ZIP drive cartridges, and the like.
- System 5 further includes database 16 , data conditioner 18 , database 20 for conditioned data, one or more data processing modules 22 , a display store 24 for storing processed data, and a presentation server 26 for presenting data or information to an end-user.
- These, and other possible software components of through-flow system 10 described herein, reside on one or more hardware components providing addressable memory for a computer system of local system 5 .
- Computer systems of system 10 may execute a conventional operating system, including, but not limited to, Microsoft Corporation's Window (sm) 3.x, 95, 98, 2000, NT or DOS operating systems; Linux operating systems; Sun Microsystems' Unix Solaris operating systems; IBM's AIX Solaris operating systems; SGI's IRIX Solaris operating systems or other operating systems, including, but not limited to Window's CE, Palm OS, etc. for PDAs, cellular devices, web devices, or other computing devices.
- Microsoft Corporation's Window (sm) 3.x, 95, 98, 2000, NT or DOS operating systems Linux operating systems
- Sun Microsystems' Unix Solaris operating systems IBM's AIX Solaris operating systems
- SGI's IRIX Solaris operating systems or other operating systems including, but not limited to Window's CE, Palm OS, etc. for PDAs, cellular devices, web devices, or other computing devices.
- the computer systems on system 10 may access and store data in any variety of data storage media, including, but not limited to, local hard drive, CD-ROM or other mass storage device, local area network servers, wide area network servers, Internet servers accessed via phone or cable, commercial consumer and business online services, distributed information sources such as any combination of the above, and local RAM if data is generated on demand or linked to other programs such as spreadsheet or database programs executing in RAM.
- data storage media including, but not limited to, local hard drive, CD-ROM or other mass storage device, local area network servers, wide area network servers, Internet servers accessed via phone or cable, commercial consumer and business online services, distributed information sources such as any combination of the above, and local RAM if data is generated on demand or linked to other programs such as spreadsheet or database programs executing in RAM.
- the components of computer systems of remote system 11 of the present invention may be disposed at various points of use including, but are not limited to, the home (such as on a stand-alone multi-media PC connected to an online service), office (such as on a workstation computer connected to a database on a WAN), kiosk used in-store, in hospitality services or training environments.
- the home such as on a stand-alone multi-media PC connected to an online service
- office such as on a workstation computer connected to a database on a WAN
- kiosk used in-store, in hospitality services or training environments.
- the data that enters data capture 14 may relate to an online commercial transaction such as the type discussed above relative to survey questionnaires 100 and 200 . Or it may be any other data type sought to be collected.
- a consumer making an online purchase of goods from a merchant's website may be invited to fill out a consumer satisfaction survey questionnaire 100 or 200 following the transaction.
- the merchant's website may be located on a web server which may be part of or separate from system 10 .
- the survey questionnaire may be provided to the consumer as HTML, XML, Java Script, ActiveX, Applet, or other well-known mechanisms or formats for querying a local computer system through a web browser. (Other servers in system 10 may use the same mechanisms or formats for interfacing with other computers.)
- the survey questionnaire could be served by a web server that is part of local system 5 .
- the web server could reside on data capture server 14 or presentation server 26 .
- data capture server 14 serves as a web server for capturing the data that a consumer inputs into consumer satisfaction survey questionnaire 100 .
- a web server is a computer system that runs software that enables access by remote computer systems or terminals via the Internet or other network transport to allow presentation of information, data storage and transfer, and other transactions.
- Suitable web server software is well known and includes Apache Software Foundation's Apache Server web server; Netscape's FASTTRACK series web server, Microsoft Corporation's IIS, and Sun Microsystems' JAVA WEB SERVER.
- the survey questionnaire may be presented to a consumer contemporaneously with a transaction or at some defined time after the transaction, or both.
- Email is another contemplated mode of communicating a survey questionnaire to a consumer.
- the email could contain a plain text based questionnaire that would be parsable by data capture server 14 .
- the email might contain a link to an address that could serve the survey questionnaire in HTML, XML, Java Script, ActiveX, Applet, or other well-known mechanisms or formats for querying a consumer through a web browser.
- the invitation to fill out survey questionnaire 100 is found on the receipt page that a consumer receives confirming an online order.
- the invitation includes a hyperlink to a web server, e.g., data capture server 14 , that presents survey questionnaire 100 via the browser of a consumer computer system 12 .
- the data collection process could be interactive.
- the data received for certain fields may prompt a web server or other component of system 10 to query the consumer, or other provider of data, with respect to new fields that are dependent on data values sent to the system server 14 .
- a survey taker might be asked to identify themselves as a male or female, with further survey questions being selected based on the answer.
- the survey questionnaire could contain defined fields for data values.
- survey questionnaire 100 could be designed to accept data values that represent a rating on a 1–10 scale of the consumer's perceptions about defined aspects of a transaction with a merchant, as described above relative to survey questionnaires 100 and 200 .
- the survey questionnaires could seek any other kind of information in which a survey administrator may be interested.
- information may include demographic information about a consumer (e.g., age, profession, education, etc.); the consumer's perceptions about, and experiences with, online shopping (not limited to the transaction conducted); the consumer's interest in other lines of goods and services; whether the consumer wishes to participate in newsgroups, future offerings, etc. relating to the purchased product or any other subject matter.
- the resulting survey data is fed to data capture server 14 and logged into a server log.
- the log records the collected data and may assign an identifier or key value to the data.
- the identifier could be an indicator of any number of things including the time of receipt, source (e.g., the particular merchant), etc.
- the logged data may then be parsed by a software program that assigns items of the raw data into predefined fields in a database 16 .
- the parsing program may be created through standard program techniques that are known or within the skill of persons in the art. The parsing program would be designed to map data from the survey questionnaire to database records that are predefined.
- Each record would be composed of one or more fields that correspond to the class of an item of data and/or the value of an item of data. Any field may be keyed to any one or more other fields.
- the database would contain tables that include a field for each particular attribute 102 – 110 .
- the numerical rating from each survey questionnaire, or average rating from a predefined group of survey questionnaires, would be listed as items under the relevant attribute 202 – 210 fields.
- Each table would typically include other fields such as survey identifier, time of receipt, source, etc.
- Database 16 may be based on any number of known database management systems (DBMS), including hierarchical databases, network databases, relational databases, and object oriented databases.
- DBMS database management systems
- Suitable DBMS are widely available and include Oracle, Sybase, Microsoft SQL Server, and DB2.
- One suitable database system is a relational database based on SQL language.
- a suitable SQL database would typically include a Data Definition Language (DDL) for creation of a new database and new objects within an existing database; a Data Manipulation Language (DML) for processing existing database objects; and a Data Control Language (DCL) for administering permissions and other security-related issues.
- DDL Data Definition Language
- DML Data Manipulation Language
- DCL Data Control Language
- the data processing is handled by a database engine database and can be accessed by various searching means, including Boolean logic evaluation, proximity calculations, and fuzzy logic evaluation.
- the databases of the present invention may also be custom designed, the design process and features being well within the skill of persons in the art.
- the data fielded into database 16 may be conditioned by a data conditioner 18 .
- the data conditioner 18 is one or more applications that perform some operation relative to the data.
- Data may be conditioned to clean, filter, or otherwise to process data.
- the data may be conditioned to supply imputed and/or default values to data items missing from a particular field or to eliminate anomalous data that does not meet predefined criteria in terms of class and/or value.
- the data may be conditioned to supply missing values; to eliminate data collected during holidays or other non-business days; to eliminate data based on demographic criteria; to check for anomalies; etc. Standard software programming skills may be used to develop desired data conditioning programs.
- Conditioned data may be stored in a database 20 for conditioned data.
- the data collected by the database 16 may be communicated to the data conditioner 18 , or other system components such as database 20 or processing module(s) 22 (discussed below), in a continuous stream, in batches at set intervals, or in batches. Communication of data could be made dependent on specified conditions.
- the specified conditions could include a set quantity of data having been received (e.g., after receipt of one hundred consumer responses to survey questionnaires); an elapsed period of time (e.g., after one hour of collecting responses to survey questionnaires), or other specified conditions or combinations of such conditions.
- Databases 16 , 20 , and 24 are not intended to be limiting examples of databases that are used in the present invention. Additional databases may be incorporated into system 10 besides those specifically indicated. These additional databases may be for the receipt of raw data, conditioned data, or processed data that flows through system 10 , or selected categories of such data. It should also be appreciated that the databases may reside on the same hardware components or different hardware components. The databases could also be operated under the same or different DBMS.
- One or more data channels 15 may be defined for the transmission of data between the components of system 10 .
- data channel means a logical event, not necessarily a physical channel, directing the flow of data into computer storage and/or processing systems. Data channels are determined by the structure of, for example, a survey questionnaire, or the way answers are coded into database fields, and the programs that are to operate on predefined categories or items of data. A data channel may also be a logical or computed combination of other data channels.
- one or more data channels 15 communicate parsed data from server 14 to assigned fields in database 16 . More specifically, there could be a data channel assigned to each attribute 102 – 110 for communicating the ratings from rating fields 112 into the field in the database that correspond to each attribute 102 – 110 . Similarly, one or more data channels 15 may communicate data from defined fields in database 16 to data conditioner 18 . For example, raw data from database 16 or conditioned data from database 20 , may be introduced into database 20 or directly into a processing module(s) 22 consisting of one or more processing modules that perform a predetermined operation on data. The processing modules may be in communication with each other or with other system components. As shown in FIG.
- processing module(s) 22 transfer processed data to a database 24 for storing processed data.
- Database 24 is in communication with a server 26 .
- Server 26 may be a web server for interfacing with remote computer systems in system 11 .
- Web server 26 may be used to present data from database 24 to remote computer systems 12 or 13 over a network 11 .
- presentation server 26 could present the data to a printer 34 or video display or computer system 36 , or through other means for displaying data.
- data includes data in the form of files or data representing information, unless otherwise noted or clear from the context.
- One or more data channels 15 may communicate data from database 20 to processing module(s) 22 . Although not illustrated in all cases, it will be understood that any other components of system 10 may communicate defined fields of data to another system component along a data channel assigned to a field(s) of data.
- data conditioner 18 is optional; although not illustrated, data may be directly introduced from database into a processing module 22 .
- Processing modules 22 may process data communicated to it to generate desired forms of information.
- the processing may include computation of ratings; indices; consumer demographic profiles; merchant or merchant category session volumes; dollar volumes; lists of consumers for target marketing; etc.
- data or information may be referred to as “e-commerce” data or information.
- Standard software for such processing is well known and available, or may be readily created by persons skilled in the art, and therefore is not discussed further herein.
- the processing module 22 could be programmed to compute ratings for each attribute 102 – 110 , and other standard statistical values based on the ratings data. Accordingly, a statistical analysis process module would be capable of computing one or more of the following:
- the software for statistical analysis could be designed using programming skills well within the skills of persons in the art.
- Well-known, off-the-shelf programs are also available.
- Such programs include the SPSS family of software products, including SPSS BASE PROFESSIONAL, v10.5 or v8.0, and Regression, Table, and/or AnswerType module from SPSS, Inc., Chicago, Ill.
- the processed data may then be transferred to a “display store” database 24 for storing processed data or information.
- Database 24 may be connected to a presentation server 26 .
- the presentation server 26 presents data that has been processed and evaluated by system 10 to an end-user, such as consumers or merchants 13 .
- the display store information may be accessible publicly or privately via computer systems in system 11 .
- Server 26 parses and sorts processed information into categories that are defined according to defined needs or interests of an end-user or group of end-users. The software for doing this must be coded according to the intended application of the user.
- the coding may be written in standard programming codes that are known to persons skilled in the art.
- the relevant information may be presented to the end-user in any known form of communicating information, including: printed reports, emailed reports; server-stored reports accessible to end-users over a public or private network, including website posted reports.
- the presentation server may serve web pages to remote computers systems through conventional TCP/IP protocols or other known protocols.
- the web pages may be presented through conventional web browsers such as INTERNET EXPLORER series of web browsers by Microsoft Corporation, or the NETSCAPE COMMUNICATOR series of web browsers by Netscape Communications Corporation.
- system 5 that is adapted to process data from survey questionnaires 100 or 200 from a sample of survey questionnaires from consumers that did business with online merchants.
- the survey questionnaires may be supplied to data capture server 14 at predefined intervals, in real time, or upon other specified condition.
- the present invention can allow daily or more frequent updates of usable information to end-users even though only small and/or noisy data samples are available. Accordingly, the present invention sets new standards for minimizing the “time late” for turning data into information.
- FIGS. 5 a–e show examples of information that may be derived from the ratings from a set of survey questionnaires 100 / 200 for a particular merchant for transactions occurring over set intervals (e.g., one day, one week, one month, etc.).
- a table contains the average numerical rating for each attribute 102 – 110 / 202 – 210 on a monthly basis over one quarter.
- FIGS. 5 b and 5 c show in graphical form the average ratings from FIG. 5 a .
- the graphs enable users to easily detect upward or downward trends for each attribute.
- FIG. 5 d shows a table with the average quarterly rating for each attribute shown in FIG. 5 a .
- FIG. 5 e is a graphical representation of the quarterly average ratings for each attribute from FIG. 5 d.
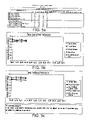
- FIGS. 6 a–b specific information about price attribute 108 from FIGS. 5 a–e is shown in table and graphical formats.
- the table shows five categories of ratings. A rating of 1–2 corresponds to “very low satisfaction”; 3–4, “low satisfaction”; 5–6 “moderate satisfaction” 7–8 “high satisfaction”; and 9–10 “very high satisfaction”.
- FIGS. 7–8 and equations 1–34 below relate to a novel application for estimating or smoothing variable data.
- the schema presented below is particularly useful for estimating values based on noisy and/or small data samples. It may also be used to predict missing observations.
- the schema may be incorporated into system 10 as a processing module 22 .
- the present invention offers notable advantages over traditional modes of statistical analysis, such as moving window averages (weighted and unweighted), which do not provide accurate information if data samples are small or noisy. Consequently, in conventional techniques, the conversion of data to useful information is prolonged by the time necessary to collect the larger required sample sizes.
- the schema of the present invention provides notable advantages over conventional methods used to evaluate data related to e-commerce.
- the schema is used to stabilize or filter consumer ratings data. While, for convenience, the following discussion is largely in terms of evaluation of ratings data, the present invention also contemplates use of the schema in evaluating other forms of data related to e-commerce. Accordingly, persons skilled in the art will appreciate that the present invention provides a substantial and patentable advance over prior methods of processing and evaluating such data, particularly in the area of business ratings, market research studies, consumer demographics, etc.
- EKF Extended Kalman Filter
- FIG. 8 A central component of the schema of FIG. 7 .
- the EKF is detailed in FIG. 8 .
- the EKF uses a computational (recursive) solution of the minimum variance Bayesian estimation method.
- the EKF is powerful in several aspects: it supports estimations of past, present, and even future states. It can do so even when the precise nature of the modeled system is unknown.
- the EKF also provides a method of weighting data values according to the recency or level of noise corruption of the data. This may be important because, for example, data collected in a later portion of a data collection interval (data window) is likely to be more indicative of present trends than is data collected at the earlier portion of the interval (older data).
- the present invention provides a sequential filter that outputs an optimal estimate of a “rating” for an attribute 102 – 110 from a set of responses to survey questionnaires of such rating from a given merchant.
- the following section describes how the true rating may be determined from noisy data/small sample sizes. (In this section, related Figures, and in subsequent sections, certain mathematical equations are identified by a number in bold and in brackets to the right of a given equation, which number should not be confused with unbracketed reference numerals for the accompanying Figures.)
- a true rating A is determined using an adaptation of an Extended Discrete Kalman filter. It is to be understood that the following embodiment is presented for purposes of illustration not limitation. Persons skilled in the art will appreciate that other adaptations of Kalman filters are within the scope and spirit of the present invention. In connection with the following discussion, reference may be made to FIGS. 7 and 8 , which help illustrate the principles being discussed.
- a processing module that can smooth noisy or variable data using a computational (recursive) solution of the minimum variance Bayesian estimation method is referred to as a Data Stabilizer or “DS” for short.
- the desired “true rating” is actually a slowly varying function of time, while the noisy (input) rating suffers from “sampling jitter” induced by often low response (small sample) and/or highly variable ratings for the input parameters from which the rating is computed.
- the true rating A is a scalar valued function of parameter vector y of dimension N.
- A f ( y ) [1] where y is a vector of sampled variables with mean ⁇ and possibly correlated dispersions covariance y .
- x _ [ c 0 , c 1 , c 2 ] T [ 3 ]
- c i are the components of x , the state vector of constants for the polynomial [2].
- T means “matrix transpose”, as is known in the art.)
- the estimator elaborated below is the discrete Kalman filter, as described for example, in 1 Brogan, W., Modem Control Theory , Prentice-Hall, 1985.
- the discrete Kalman filter is here adapted to the observed ratings process developed above.
- the subscript j/i denotes a parameter value at t j computed by input(s) available at t i .
- ⁇ ⁇ ( i , i - 1 ) [ 1 - ⁇ ⁇ ⁇ t . i - 1 ⁇ ⁇ ⁇ t i - 1 2 0 1 - 2 ⁇ ⁇ ⁇ ⁇ t i - 1 0 0 1 ] [ 26 ]
- FIG. 7 shows an implementation of the DS into system 5 as a processing module 221 .
- Observed ratings from a survey questionnaire 100 or 200 at a time t are stored in database 20 , as described above relative to FIG. 3 .
- a nominated response set is defined in step 221 . 6 of processing module 221 , which in FIG. 3 is represented as one of the processing modules 22 .
- the nominated response set for example, may be the set of individual ratings for a particular survey questionnaire attribute collected from a particular merchant over a defined interval, such as 24 hours.
- a control parameter database 221 . 16 is used to store process parameters for process module 221 .
- Step 221 . 8 calls on process 221 to make a decision relative to N for the nominated response set. For N greater than 0, the average value and variance for the set is computed in step 221 . 10 . The effective observed covariance W i for the values determined in step 221 . 10 are then determined in step 221 . 14 . W i is then introduced into the EKF steps 221 . 22 , described above, and shown in flow-chart form in FIG. 8 .
- EKF steps 221 . 22 then provide outputs to 221 .
- a data stabilizer may then be introduced into a stabilized values database 221 . 6 .
- This database may be the same as or different from database 24 in FIG. 3 .
- the data stabilizer A or other output of steps 221 . 22 and 221 . 24 also may be introduced into other computational processes, e.g., other process modules 22 and/or presentation means, such as presentation server 26 .
- Data stabilizers may be introduced into control parameters database 221 . 16 to update it. Averages and variances from process step 221 . 10 , and observed covariances from process step 221 . 14 may also be introduced into database 221 . 16 to update.
- control parameters namely R & W matrices, and specified innovation thresholds from database 221 . 16
- Output from step 221 . 18 may then be used to compute and reset the memory length control R i (the covariance of the state transfer function) for input to the EKF steps 221 . 22 .
- Extended Kalman Filter steps 221 . 22 may also directly access control parameters database 221 . 16 to obtain inputs to t i , t i-1 , state vector x i-1/i-1 and covariance P i-1/i-1 for computing the next state vector x i/i and the covariance of state P i/i .
- Steps 221 . 23 – 221 . 36 represent an observed process having a state x.
- the estimate of state x is imperfectly known.
- y * represents an average of a set of one or more noisy observations and w i is the observed covariance.
- the symbology used in FIG. 8 generally corresponds to that of Equations 1–34.
- Equations 1–34 may not directly correspond to FIG. 8 in terms of symbology, but any differences in light of the included legend will be understood by persons skilled in the art).
- the foregoing estimation model may be implemented in standard programming languages for mathematical functions. Below is one example of the DS model coded in MATLAB programming language. Persons skilled in the art will appreciate that other programming languages may also be used to implement the foregoing principles.
- the program is used to stabilize ratings from a consumer survey questionnaire:
- One or more alarm filter(s) 28 can be set to monitor data rates and send a signal based on deviations from desired thresholds from the normative rate.
- the normative rate may be based on any defined interval (the “synoptic response rate”).
- An alarm filter may check for deviations calculated from a sampling of data taken within the normative interval (the “topical response rate”).
- a historical or expected arrival rate is determined or set for one or more data channels.
- the standard deviation may also be determined or set for the arrival rate.
- a predetermined threshold may be set relative to a topical response rate. The threshold may be set by a system administrator or automatically determined through a selected correlation function. If the alarm filter determines that a threshold is crossed, it triggers an alarm that may be sent to an event handler.
- a normative interval may be set at one month as the period over which a consumer survey questionnaire is collected from a particular merchant's website.
- the response rate for a particular merchant's consumer survey questionnaire averages 300 per 30-day period. This average is the historical arrival rate. This gives an average of 30 surveys collected per day.
- An alarm filter could be set to monitor the number of surveys collected per day from a particular merchant.
- the system administrator could desire that if the daily collection of surveys for the merchant drops below 5 on a given day, an alert signal should be sent to the merchant or other party. This would allow the merchant to investigate the reason for the drop in response rate.
- the system 5 via event handler 32 or data monitoring system 30 could automatically send the merchant a signal such as an email to alert the merchant to the drop in rating.
- Alarm filters 28 may be associated with the processing modules 22 to give online merchants the ability to respond to changes in the marketplace at the earliest possible stage and to correct technical problems.
- the filters 28 are shown connected to one or more data channels 15 between server 14 and database 16 .
- An alarm filter 28 may be associated with any data channel or channels between two system components.
- the alarm filters 28 could also be associated with any other data channels 15 in system 5 .
- the alarm filter sends a signal to an event handler 32 when a specified condition is met.
- the event handler 32 could be a computer system, a display device, telecommunications device such as pager or phone, etc.
- the event handler 32 would inform a machine or person, such as a system administrator, end-user or other designated individual of the alarm.
- FIG. 9 shows a flow chart of one possible alarm filter for monitoring survey questionnaire response rates.
- the alarm process 28 . 1 is started with a data run in system 5 .
- decision step 28 . 2 the alarm system monitors a data channel for activity. If the system is not in an active data run, the alarm process ends in step 28 . 7 .
- step 28 . 3 synoptic response rates are calculated or input per a set interval of time.
- step 28 . 4 topical response rates are calculated or input per a set interval of time.
- the calculated values are compared with predetermined high thresholds in decision step 28 . 5 . If a response is above a high threshold, a signal is sent to event handler 32 .
- step 28 . 4 If the high threshold is not crossed, the values from step 28 . 4 are compared to a predefined low threshold in step 28 . 6 . If the low threshold is crossed, a signal is sent to event handler 28 . If neither a high or low threshold is crossed, the system returns to the start step 28 . 1 .
- MATLAB source code for one possible alarm filter process is as follows:
- the present invention also provides a saturation limited forecast model (hereinafter “SLF Model”) that forecasts the growth of a population from a set of early observations.
- SLF Model may be integrated into system 5 as a processing module 22 .
- the SLF Model may be used to predict various values of interest to businesses.
- the forecasting methodology for e-commerce measures and consumer behaviors may be advantageously based on the saturation limited forecasting model of the present invention.
- the model may be used to predict sales volumes for a category or categories of goods or services; number of females over the age of 18 participating in e-commerce; number of merchants offering a certain category of goods or services. Values for e-commerce measures and consumer behaviors, such as the foregoing may be referred to herein as “e-commerce populations.”
- An example of an SLF Model is more specifically shown in FIG. 10 as processing module 222 .
- the SLF processing module uses available recent historical data along with an estimated and/or available saturation “population” function as the basis for a differential equation that defines the growth of a “population” to a maximum attainable level.
- This differential equation actually embodies a family of realistic “penetration processes” that are found in nature and most areas of human activity. The results from this technical approach avoid the errors often encountered in conventional “constant percent rate” predictor models.
- the SLF Model embodies a non-linear mathematical programming solution to select the optimum set of process defining parameters from the defined inputs. Once the nominal penetration function is obtained, the differential equation can be solved for any arbitrary time point in the future to provide the synoptic or nominal value forecast. Depending on the nature of the historical data set, the SLF Model also can extract the cyclic (i.e. seasonal or topical) variations for the predicted population. Additionally, by entering a range of values for the inputs, the SLF Model will generate a “forecast funnel” that encompasses the confidence intervals of such input data.
- the growth of a population may be forecasted from a set of early observations.
- P 0 (t) or “pull function” which sets the saturation limit to growth.
- a primary SLF Model operating principle is that growth is generated by an underlying process and that the rate of growth at any time is proportional to the unsaturated or remaining population. The proportionality is specified by a time varying penetration function r(t) which characterizes the total “level of effort” process.
- a functional form usually, but not limited to, a polynomial with coefficient vector c , is then assumed for the penetration function giving r( c , t).
- the differential equation is then numerically integrated to generate the predicted population P( c ,t). If we have a set of observations ⁇ P i
- i 1, . . . , N ⁇ , then we can solve for the value of c * that makes P( c * , t) a best fit to these points in, say, a least squares manner.
- t 0 may be specified (along with t F ) or included in the optimized parameter set.
- bracketed numbers refer to the equations herein with the corresponding bracketed numbers
- a population is penetrated at a rate proportional to a residual population P r .
- the proportionality is determined by a penetration function r(t) which captures the level of effort expended in order to penetrate P r and, possibly, maintain the achieved penetration P(t).
- the ⁇ p bounds shown may be derived by stochastic sampling of the probability distributions characterizing the inputs or simply approximated from the solutions using the max and min ranges of the saturation function P 0 .
- the prime or top level pull (saturationlimit) P 0 draws and meters the growth of P 1 .
- FIG. 14 shows an example input array for SLF, including conjoined observations and predictions for all l and K l .
- the foregoing forecasting model may be implemented in standard programming languages for mathematical functions. Below is one example of the forecasting model coded in MATLAB programming language. The population being evaluated is a hypothetical Food & Wine commerce sector.
- the present invention also contemplates a processing module 22 that relates to the display of a dynamic icon that indicates to the user of a remote computer system some level of activity elsewhere in system 10 .
- the dynamic icon could convey graphic or text-based information or both, as described in more detail below.
- a dynamic icon or text is displayed through the web browser of a consumer's computer system or terminal that indicates to the consumer the level of activity by other visitors to a particular merchant's website.
- the dynamic icon indicates the current/recent level of buying activity for the merchant.
- the activity could be indicated on a real-time basis or on defined time intervals. It could also relate to all transactions taking place at the merchant's site or on subcategories of transactions.
- the dynamic icon is associated with ratings information about one or more merchants whose ratings are made accessible to consumers through presentation server 26 .
- the dynamic icon could also be associated directly with a merchant's own web server, via presentation server 26 of system 5 , for viewing by consumers as they visit the merchant's website.
- the relevant data is received into system 5 as a survey questionnaire 100 , for example. If survey questionnaires are served only to purchasing consumers, tracking the number of served questionnaires for a particular merchant, directly indicates the level of buying at a particular merchant. Alternatively, each survey questionnaire returned by a consumer could be correlated to buying activity (A correlation is necessary because not all purchasing consumers will complete and return a survey questionnaire.)
- the survey questionnaire contents may also be used to determine the activity level of other matters contained or associated with a survey. For example, the survey questionnaire may ask the purchaser to describe items purchase, quantities, prices, etc.
- electronic cookies may be used to follow consumers to certain categories of websites or to specific websites.
- the cookies could be received by data capture server 14 .
- the presentation server could let consumers and/or merchants know which websites are receiving the most traffic.
- the traffic could be reported, broken down by category of trade. For example, the online music store website with the most traffic. This should help consumers identify where there are special promotions or available products, etc. This should help merchants understand what their competitors are doing for market research purposes or for competitive response.
- FIG. 15 shows a flow chart for an activity module process 23 that receives data input from a data source, such as database 20 .
- a data source such as database 20 .
- the example is in terms of the level of sale transactions on a point-of-sale website.
- the point of sale (“POS”) data for a merchant is read from database 20 .
- the number of POS transactions for the merchant is calculated.
- the calculated value is returned to display database 24 .
- the calculated value is then accessible to presentation server 26 in step 23 . 4 .
- Presentation server 26 presents the calculated value as a dynamic icon accessible to remote computer systems through their web browser, for example.
- an activity-level applet is received and stored by a consumer's computer. This is reflected in FIG. 15 at step 23 . 5 .
- the applet generates a dynamic icon in the form of a flashing dot, for example.
- the icon flashes in proportion to the level of activity on a particular merchant site.
- the consumer's computer is informed of the activity level by accessing a data source that communicates data representative of the activity level. This is reflected in step 23 . 6 of FIG. 15 .
- the data is input into the activity-level applet that creates an output in the dot flashing at a rate proportionate to the level of buying at the merchant's site.
- the present invention contemplates that a plurality of dynamic icons may be associated or arrayed with each other.
- one or more icons may serve as reference points of activity relative to one or more other icons.
- at least two icons are simultaneously displayed, each icon representing activity levels for a different merchant.
- the merchants provide competitive goods or services.
- the dynamic icons are displayed on a consumer's computer and are associated with hyperlinks to the merchants' websites.
- the present invention also contemplates simultaneous display of multiple groups of competitive merchants. It also contemplates that the activity level may represent a variety of things, and is not limited to level of point-of-sale activity. For example, it could indicate level of traffic at the site; types of products or services being sold or offered; numbers of a product or service type or category being sold; inventory levels; special promotions or discounts; buyer demographical attributes, etc.
- Consumers could investigate websites based on their interest in a level of indicated by a dynamic icon. For example, a relatively high rate of activity could mean exceptional prices, special offerings, good reputation, etc. This gives consumers (or merchants) a basis for comparing the level of activity between merchants. It also helps promote consumer confidence in e-commerce.
- a Poisson random number generator may be used to generate a sequence of numbers that represents arrival rates.
- the number of survey questionnaires served or the number of completed surveys received, for a predetermined interval, could be the basis for the input of the mean rate into the Poisson random number generator.
- the mean arrival rate would then be sent from a presentation server or communicated to a consumer's computer, for example, as input into the activity-level applet implementing the Poisson random number generator on a consumer's computer.
- the dynamic icon is not limited to a flashing dot. It could be any number of things, including a numerical value; textual description of activity; a graphic image that connotes a level of activity, such as a flashing colored, say, red dot; an audio-based icon that verbally or connotatively describes some level of activity, etc.
- the presentation server 26 is a web server that hosts an “infomediary website” (as described by Hagel, John III and Singer, Marc in Net Worth ; Boston, Mass.; Harvard Business School Press 1999) that consumers may access through computer systems via the Internet or other network.
- the website includes web pages having a list or table of merchant websites.
- the list or table could categorize merchants in any way, including by sector, by size, by how long they have been in engaged in e-commerce, by geography, by customer satisfaction ratings, by specials offered, etc.
- a displayed list of one or more merchants may be displayed to a consumer by the consumer selecting desired categories from a menu on a web page. Alternatively, the displayed list may be generated based on search criteria entered by a consumer and presentation of results by a search engine. Each merchant displayed could be associated with a dynamic icon showing selling activity, for example.
- the consumer may access a displayed merchant's website through hyperlinks in the list or table.
- the list or table includes ratings for each displayed website, to help consumers evaluate the website for relevant attributes, such as those of survey questionnaires 100 and 200 .
- Other information about the merchant could also be displayed or accessed through associated hyperlinks. Ratings and other information could be based on data processed through the DS, SLF, or any other module of the present invention.
- the list or table also may include icons or information denoting merchant websites that participate in consumer rebate programs.
- the infomediary website may also be linked a merchant's website for access to data about availability of products or services, pricing, etc.
- the foregoing has been in terms of a web page showing a listing or table of merchants. The foregoing discussion would also apply to a web page with a listing of goods or services by category. Listed goods or services products could be associated with merchants selling the desired goods or services.
- proximity searching means may be presented to the consumer for finding nearest neighbors to a displayed item on the infomediary website relative to specified attributes of an item.
- U.S. Pat. No. 5,983,220 entitled “Supporting Intuitive Decision In Complex Multi-Attribute Domains Using Fuzzy, Hierarchical Expert Models”, commonly owned by the assignee of the present invention, is hereby expressly incorporated by reference for all that is taught therein.
- a membership program may be used on the infomediary website, allowing registered members preferred access to information, automated notifications about subject matter within their scope of interest, or other preferential treatment.
- a registered member would be someone providing predetermined categories of information called for by the infomediary website, such as personal data, shopping preferences, participation fees, etc.
- the infomediary website could notify a registered member of discounted prices for goods or service in which they have expressed an interest.
- the infomediary website could also arrange for incentive programs for its members such as special discounts, rebates, frequent buyer programs, etc. could be offered by or through the infomediary. For example, registered members purchasing from a participating merchant could receive a rebate according to predefined terms of a rebate program.
- FIGS. 17–23 show web pages illustrating features in accordance with the foregoing discussion.
- the web pages could be served by presentation server 26 in earlier Figures.
- FIG. 16 is an example of a home page for an infomediary web site.
- the page describes a number of products and services that may be browsed or searched by a consumer visiting the web site.
- the page also announces incentive programs and special offer programs.
- the names, descriptions, and symbols on the web pages of FIGS. 17 to 23 may be presented in the form of links to other pages inside or outside the infomediary website.
- the web page also has means to allow a consumer to search for products or services via categories listed on a pull down menu.
- a search prompt is presented by selecting a category from the pull down menu and clicking on the go button.
- the web page of FIG. 16 also presents certain popular products in the left margin of the page.
- FIG. 17 is a web page from the infomediary web site of FIG. 16 .
- This page represents the “Computer Hardware & Software” category from the page of FIG. 16 , and may be reached by clicking on that category name in the web page of FIG. 16 .
- the page lists subcategories of products.
- the page also includes a search prompt for searching by product identifiers, such as SKU numbers. There are additional pull-down menus to produce search prompts to search or find other categories or merchants. Incentive programs and special offers may also may be presented or accessed through the web page.
- FIG. 18 is a web page from the infomediary web site of FIG. 16 .
- This page represents the “PDAs” category shown on the Computer Hardware & Software category web page of FIG. 17 .
- the “PDAs” web page of FIG. 18 may be reached by clicking on that category name on web page in FIG. 17 .
- the Web page of FIG. 18 lists merchants carrying PDA products.
- the merchant names are associated with overall ratings in the form of 1–5 stars. The ratings may also be distinguished as to merchants that participate in a customer ratings program.
- a consumer visiting the infomediary site may learn details of such a program by a linked web page describing the program, e.g. the web page of FIGS. 19 a–b .
- Merchants that allow post-purchase surveys of consumers are indicated with gold rating stars and non-participating merchants with silver stars, as described in FIGS. 19 a–b.
- a consumer can learn more about a merchant listed on the web page of FIG. 18 by clicking on the merchants' name.
- the merchant name may, for example, link to further ratings information or provide comments or reviews by consumers or others.
- the web pages with such information may be on or off the website of the infomediary.
- Special offers such as rebates are also associated with a listed merchant, as seen in FIG. 18 .
- An “on time” rating attribute is also associated with a listed merchant.
- the ratings and other information presented on the web page may be derived from one or more of the processing modules of discussed above, including the DS and SLF processing modules.
- Other attributes, such as described for surveys 100 and 200 of the earlier Figures may be associated with a listed merchant.
- searching and sorting features may also be included on the web page to search or sort for desired rating attributes, product pricing, product characteristics, product availability, etc.
- a dynamic activity-level icon may also be associated with merchants listed on the web page of FIG. 18 .
- it is a dot of varying size, the larger the dot the higher the activity level.
- Consumers may select to browse or shop at a merchant's website by clicking on the “GO SHOP” icon seen of the web page.
- the icon provides a direct link to the merchant's website.
- the link is to a web page on the merchant's website that includes the product of interest.
- FIG. 20 represents the web page of the merchant named “eCost.com”.
- the web page shows price and product information for a PDA.
- the web page of FIG. 18 also lists in the right hand margin a number of PDA products considered to be top picks according to selected criteria believed to be relevant to consumers. Clicking on a product may take the consumer to a list of one or more merchants offering the product.
- the web page of FIG. 18 page also includes search and sort prompts for searching by merchant ratings, product identifiers or characteristics, such as manufacturer or keywords. There are additional pull down menus to produce search prompts to search or find other categories or merchants. Incentive programs and special offers may also may be presented or accessed through the web page.
- An example referral incentive program offered on the infomediary web site is described on the web page of FIG. 21 .
Abstract
Description
-
- How do you get consumers to fill out such surveys?
- Is the sample size of responses large enough to produce accurate reports?
- How do you input and process the data?
- Has the data been processed in a timely manner?
- How are results to be timely reported to businesses?
- What do the results mean to the business?
- What steps should the business take in view of the results?
- What has been the effect of any remedial action?
-
- Means using real numbers
- Mean scores using factors (useful for rating scales)
- Standard deviation
- Standard error
- Error variance
- Z-tests (four tests for the difference between proportions)
- T-tests (two tests for the difference between means)
- P-values (a test of the probability that an event was chance)
- Significance net difference test (on pairs of columns)
- Least significant difference test (on means)
- Paired preference test (on pairs of rows)
- Chi-squared tests (one or two dimensional and single classification types)
- Proportions tests (four types)
- Friedman's two-way analysis of variance
- Kolmogorov-Smirnov test (on differences between two samples)
- McNemar's test of the significance of changes
- F-test for testing differences between a set of means
- One-way analysis of variance (ANOVA)
- Significance levels
- Regression analysis
- Trend analysis
- Correlations
- Covariances
A=f (y) [1]
where y is a vector of sampled variables with mean ŷ and possibly correlated dispersions covariance y. Once A is determined, it could be reported as one of the attribute ratings shown in
ci are the components of x, the state vector of constants for the polynomial [2]. A higher order polynomial for A(t) can be used if warranted by the underlying process modeled. (T means “matrix transpose”, as is known in the art.)
Ã(t i)=h[x (t i)] [4]
with
à is termed the pseudo observable; it is a function of actual observations. In what follows, the time index i may be used to denote the value of a time indexed variable at ti. {tilde over (y)} is the observed parameter vector which itself may be computed from captured survey questionnaire responses.
x i =[c 0,i , c 1,i , c 2,i]T [6]
with covariance Pi=cov x i[7]. It is noted that ti+1=t1+Δti for all i and arbitrary Δti>0.
x i+1 =Ix i +r i [8]
where I is the identity matrix and r i is “state noise” such that E (r i)=0 and Ri=cov r i[9]. It may be further assumed that Δti are large enough so that E(r i Trj)=0 for i≠j, i.e. that the noise is uncorrelated over time (explicitly E(r i r j T=Riδij)).
à i =m i T x i +w i [10]
where the pseudo-observation or measurement vector m i is given by
m i=[1, t i , t i 2]T [11]
and the measurement noise is
E(w i=0 and E(w i w j)=Wi δij for all i, j. [12]
It is noted that the observation covariance Wi is identically the error induced in à by the errors propagating from the actual observed parameters {tilde over (y)} given in [5]. Therefore we set
K i =P i1/i-1 m i [m i T P i/i-1 m i =W i]−1 [14]
where the state noise propagates as captured by the covariance matrix
P=cov(x) over Δti-1 as
P i/i-1 =P i-1/i-1 +R i-1. [15]
P i/i =C i P i/i-1 c T −K i W i K T [17]
With these preliminaries, we write the estimate of state for ti now as
{circumflex over (x)} i ={circumflex over (x)} i-1 +K i [Ã i −A i/i-1] [18]
(this represents the main equation for Kalman filtering), noting that Ai/i-1=Ai({circumflex over (x)} i-1)=m i T {circumflex over (x)} i-l [18.1] is the predicted rating. (We use the single subscripts in [18] and elsewhere for simplicity due to the constancy of state evolution as indicated in [8] above.)
= m 1 T P i/i m 1 [20]
Φ(i,i+1). This is derived as follows:
A(t)=[1, t, t 2 ]x i-1 [21]
Now if we shift the time origin by Δti-1 to ti, then the new coefficient vector x i must satisfy
A(t)=[1, t−Δt i-1, (t−Δt i-1)2]x i [22]
Equating the corresponding time shifted coefficients then gives
which may be written as
x i-l=Φ(i, i−1)x i [25]
where Φ(i, i−1) is now the system transfer function retrodicting state from ti backwards to ti-1.
Invertible system transfer functions have the property that Φ(i−1,i)=Φ−1(i, −1) [Brogan, p. 291] which we require since we want to go from x i-1 to x i. Therefore,
which gives us the desired state transition and lets us rewrite [8] as
x i+1/i =Φ i x i/i +r i [28]
m=[1 0 0]T [29]
since we are “observing” only ci,o at ti=0.
P i/i-1=Φ1 P i-1/i-1Φi T +R 1 [30]
which changes filter gain [14] to
K i=[Φi P i-1/i-1Φi T +R i ]m[m T(Φi P i-1/i-1Φi T +R i) m+W i]−1 [31]
And since ti=0 at all estimation points, we have the output of data stabilizer [19] as
à i ={circumflex over (x)} 1,i =ĉ 0,i [32]
with variance from [20] reducing to
σi 2(Â)=(P 1 1)i/i [33]
where Ãi is obtained from the current estimate of state now given by
| clear all |
| % read and parse data array |
| load daily_aval_d | % daily_aval_d = (value, variance, julian date) |
| nmax = size(daily_aval_d,1); | % number of data points |
| At = daily_aval_d(:,1); |
| W = daily_aval_d(:,2); |
| wmin = 6; | % minimum allowed observation noise |
| wmax = 30; | % maximum allowed observation noise |
| W(W>wmax) = wmax; |
| W(W<wmin) = wmin; |
| t = daily_aval_d(:,4); |
| % initialize filter |
| %xlast = [At(1) 0 0]′; % initial state (quadratic coeffs) |
| xlast = [6.5 0 0]′; |
| %Plast = [1.5 0 0 |
| % | 0 .01 0 | |
| % | 0 0 .001]; | % covar of initial state |
| Plast = [0.795 | 0.0082 0 | |
| 0.0082 0.0001 0 | ||
| 0 0 0]; | ||
| m = [1 0 0]; | % measurement vector |
| xsigs = [1e-4 1e-5 1e-4]; | % coeff DAILY transition sigmas |
| R = diag(xsigs.*xsigs,0); | % constant DAILY state transition covariance |
| I = eye(3); |
| % Output array initialization |
| StabilizedRatingsout = zeros(nmax,4); |
| StabilizedRatingsout(1,1) = xlast(1); % initialized input value |
| StabilizedRatingsout(1,2) = sqrt(Plast(1,1)); | % sigma of input value |
| StabilizedRatingsout(1,3) = t(1); | % time value |
| % run main loop and generate output array |
| for i = 2:nmax |
| dt = t(i)−t(i−1); | % current time increment (should be 1) |
| U = [1 dt dt{circumflex over ( )}2 |
| 0 1 2*dt |
| 0 0 1]; | % state transition matrix |
| if At(i)==99 | % then extrapolate from last estimated state |
| StabilizedRatingsout(i,1) = [1 dt dt*dt]*xlast; | % extrapolated estimate of value |
| Pnow = U*Plast*U′ + R; % extrapolated state covariance | |
| xnow = U*xlast; % extrapolated state |
| else % run filter with current observation |
| w = W(i); | % pseudo-observation variance |
| Pnext = U*Plast*U′ + R; | % predicted state covariance |
| temp1 = Pnext*m′; |
| K = temp1/(m*temp1 + w); | % filter gain |
| C = I − K*m; |
| Pnow = C*Pnext; | % current cov of estimated state | |
| xnext = U*xlast; | % predicted state |
| innov = At(i) − xnext(1); | % innovation | |
| xnow = xnext + K*innov; | % current estimate of state |
| StabilizedRatingsout(i,4) = innov; |
| end % conditional extrapolate or filter calcs | |
| % hard limit c0 to max allowed value of rating | |
| if xnow(1)> 10 |
| xnow(1)= 10; |
| end |
| xlast = xnow; |
| Plast = Pnow; | |
| % fill output array | |
| StabilizedRatingsout(i,1) = xnow(1); | |
| StabilizedRatingsout(i,2) = sqrt(Pnow(1,1)); |
| end | % main observation/time loop |
| % compute 25% level At Risk Threshold ART array |
| tART = 6.5; | % the selected rating threshold |
| pART = 0.9995; | % the probability that actual rating < tART |
| limART = norminv(pART,0,1); |
| rART = StabilizedRatingsout(:,1) + limART*StabilizedRatingsout(:,2); |
| ART = tART*(rART<tART); | % array of threshold violations |
| % output results plot. |
| At(At>10) = 0; W(W>10)=0.5; |
| figure(1) |
| clf |
| hold on |
| tstart = 245; % full range 245 to 638 |
| tend = 638; |
| istart = find(t==tstart); | iend = find(t==tend); |
| indexART = find(ART>0 & t>=tstart & t<=tend); |
| plot(t(istart:iend),At(istart:iend),‘gx’, |
| t(istart:iend),StabilizedRatingsout((istart:iend),1),‘b’, |
| t(istart:iend),StabilizedRatingsout((istart:iend),2),‘b--’) |
| plot(t(indexART),ART(indexART), ‘r*’, |
| t(istart:iend),0.1*StabilizedRatingsout((istart:iend),4),‘c.’ ) |
| grid |
| hold off |
| Copyright in the foregoing code is claimed by BIZRATE.COM. |
| @ |
| % ‘rrmonitorHIGH.m’ Response Rate Monitor computes response |
| % number thresholds for high (resps/day >= 30) arrival rates. |
| % Copyright Bizrate.com |
| clear all |
| % low arrival rate |
| M = 100; | % length of data run (number of days) |
| lam = 500; % mean arrival rate (responses per day) |
| sqrtlam = sqrt(lam); |
| R = poissrnd(lam,1,M); % responses data array |
| Phigh = 0.9; | Plow = 0.1; % high/low prob thresholds |
| nhigh0 = norminv(Phigh,lam,sqrtlam); | % high number threshold |
| nlow0 = norminv(Plow,lam,sqrtlam); | % low number threshold |
| N = 30; % length of data window for computing lam |
| figure(1) |
| clf |
| hold on |
| plot(R) |
| plot([0,M],[nhigh0,nhigh0],‘r’) |
| plot([0,M],[nlow0,nlow0],‘r’) |
| errorcount = 0; |
| for i = N:M−1 | % cycle through the data run |
| lastN = R(1,i−N+1:i); | |
| lam = sum(lastN)/N; % average of last N data points | |
| sqrtlam = sqrt(lam); |
| nhigh = norminv(Phigh,lam,sqrtlam); | % upper threshold |
| nlow = norminv(Plow,lam,sqrtlam); | % lower threshold |
| plot(i+1,nhigh,‘b.’) | |
| plot(i+1,nlow,‘b.’) |
| if R(i+1) >=nhigh | % test for issuing ‘high alert’ |
| if R(i+1) >= nhigh0 |
| plot(i+1,R(i+1),‘go’) |
| else |
| plot(i+1,R(i+1),‘ro’) | % erroneous alert |
| errorcount = errorcount + 1; |
| end |
| elseif R(i+1)<=nlow % test for issuing ‘low alert’ |
| if R(i+1)<= nlow0 |
| plot(i+1,R(i+1),‘go’) |
| else |
| plot(i+1,R(i+1),‘ro’) | % erroneous alert |
| errorcount = errorcount + 1; |
| end |
| end |
| end |
| grid |
| hold off |
| errorcount |
| % ‘rrmonitorLOW.m’ Response Rate Monitor computes response |
| % number thresholds for low (resps/day < 15) arrival rates. |
| clear all |
| % low arrival rate |
| M = 100; | % length of data run (number of days) |
| lam = 3; | % mean arrival rate (responses per day) |
| R = poissrnd(lam,1,M); % responses data array |
| Phigh = 0.9; | Plow = 0.1; % high/low prob thresholds |
| nhigh0 = poissinv(Phigh,lam)+1; | % high number threshold |
| nlow0 = poissinv(Plow,lam); | % low number threshold |
| N = 15; % length of data window for computing lam |
| figure(1) |
| clf |
| hold on |
| plot(R) |
| plot([0,M],[nhigh0,nhigh0],‘r’) |
| plot([0,M],[nlow0,nlow0],‘r’) |
| errorcount = 0; |
| for i = N:M−1 | % cycle through the data run |
| lastN = R(1,i−N+1:i); |
| lam = sum(lastN)/N; | % average of last N data points |
| nhigh = poissinv(Phigh,lam)+1; | % upper threshold |
| nlow = poissinv(Plow,lam); | % lower threshold |
| if R(i+1) >=nhigh | % test for issuing ‘high alert’ |
| if R(i+1) >= nhigh0 |
| plot(i+1,R(i+1),‘go’) |
| else |
| plot(i+1,R(i+1),‘ro’) | % erroneous alert |
| errorcount = errorcount + 1; |
| end |
| elseif R(i+1) <=nlow % test for issuing ‘low alert’ |
| if R(i+1) <= nlow0 |
| plot(i+1,R(i+1),‘go’) |
| else |
| plot(i+1,R(i+1),‘ro’) | % erroneous alert |
| errorcount = errorcount + 1; |
| end |
| end |
| end |
| grid |
| hold off |
| errorcount |
| Copyright in the foregoing code is claimed by BIZRATE.COM. |
where t0 may be specified (along with tF) or included in the optimized parameter set.
P r(t)=P 0(t)−P(t) [1]
giving the penetration rate as
which then defines
to yield an analytic expression as a function of some parameter vector such as c. For a given c we can obtain P(c,t) only by numerical solution of the differential equation. This suggests the core computational scheme for {circumflex over (P)}(t) (SLF 222) shown in
with forecast horizon t0,k0. The prime or top level pull (saturationlimit) P0 draws and meters the growth of P1. These concepts are graphically shown in
P′ l, k <P l-1(t l, k)∀l, k
| % Saturation Constrained Forecast Diff Eqn test solver |
| % Quadratic penetration, free birth time t0, weighted observations |
| clear all |
| global CONST OBS NOBS TINT W |
| % Prime Saturation (‘Pull’) Pop function constants |
| p = 16096; q = 199; |
| % Penetration Function constants r = a+bt+ct{circumflex over ( )}2 and birth time. |
| a = .00001; b = 0; c = 0; t0 = 0; |
| CONST = [p q a b c t0]; |
| % Master time interval |
| tmin = 0; tmax = 30; |
| TINT = [tmin tmax]; |
| % observed pop levels |
| tobs = [9 10 11 12 13]; |
| Pobs = [20 40 87 210 385]; |
| W = [10 1 1 1 1]; % observation relative weights |
| %W = [1000 10 30 50 100]; % observation relative weights |
| W = W/sum(W); % normalized weights |
| % cyclic compensation inputs |
| nforecasts = 6; | % nforecasts <= tmax − max(tobs) |
| Ncycle = 4; | % length of cycle >= NOBS |
| fcomp = .8; | % correction factor to compensations |
| NOBS = size(tobs,2); |
| OBS = [tobs; Pobs]; |
| % compute Pen (J) Funct constants |
| X0 = [a b c t0]; | % initial X value |
| ub = [.01 .01 .01 min(tobs)−1]; | % upper bound on X |
| lb = [−0.01 −0.01 −0.01 −10]; | % lower bound on X |
| options = optimset(‘MaxFunEvals‘,2000); |
| [X,J] = fmincon(‘Jfun33’,X0,[ ], . . . |
| [ ],[ ],[ ],lb,ub,[ ],options); |
| % compute the optimal P function from P(TINT(1))=0 |
| [T,P] = ode45(‘dP33’,[X(4) TINT(2)],0); |
| P0 = CONST(1) + CONST(2)*T; |
| % compute cyclically compensated forecasts |
| mindif = T − OBS(1,1); |
| maxdif = T − OBS(1,NOBS); |
| imin = find(abs(mindif) == min(abs(mindif)))−1; |
| imax = find(abs(maxdif) == min(abs(maxdif)))+1; |
| c = polyfit(T(imin:imax),P(imin:imax),3); |
| obsComps = OBS(2,:)./polyval(c,OBS(1,:))−1; |
| nstart = max(tobs)+1; |
| foreTimes = [nstart:nstart+nforecasts−1]; |
| nomforecasts = polyval(c,foreTimes); |
| compfore = zeros(1,nforecasts); |
| iOffset = mod(NOBS,Ncycle); % index offset in Obs array |
| for i = 1:nforecasts |
| compfore(i) = |
| nomforecasts(i)*(1+obsComps(iOffset+max(mod(i,Ncycle),(mod(i,Ncycle)==0)*Ncycle))*fcomp); |
| %compfore(i) = nomforecasts(i); |
| end |
| % generate figure |
| figure(1) |
| clf |
| hold on |
| Forecasts = compfore; Measured = Pobs; |
| NomGrowth = P; |
| plot(tobs,Measured,‘rx’,foreTimes,Forecasts,‘go’) |
| plot(T,NomGrowth,‘-’,T,P0,‘--’) |
| axis([0 tmax 0 NomGrowth(foreTimes(size(Forecasts,2)))]) |
| %axis([0 20 0 800]) |
| set(gca, ‘XTick’, [0:1:tmax]) |
| title(‘SLF Food&Wine’) |
| xlabel(‘Qtrs − 95Q4=0’) |
| ylabel(‘Online Sales $M’) |
| legend(‘Measured’,‘Forecasts’,‘NomGrowth’) |
| grid on |
| hold off |
| function J = Jfun33(X) |
| % criterion function for SALIMx, gjr 7apr99/27apr99 |
| global CONST OBS NOBS TINT W |
| % solve DE and compute Saturation Level array |
| CONST(3) = X(1); CONST(4) = X(2); |
| CONST(5) = X(3); CONST(6) = X(4); |
| [T,P] = ode45(‘dP33’,[X(4) 1.1*OBS(1,NOBS)],0); |
| % fit solution poly P(t) over observation interval |
| mindif = T − OBS(1,1); |
| maxdif = T − OBS(1,NOBS); |
| imin = find(abs(mindif) == min(abs(mindif))); |
| imax = find(abs(maxdif) == min(abs(maxdif)))+1; |
| c = polyfit(T(imin:imax),P(imin:imax),3); |
| Ppoly = polyval(c,OBS(1,:)); |
| %compute criterion function |
| jcomps = Ppoly − OBS(2,:); |
| jcomps = (jcomps.*jcomps)*W′; |
| J = sum(jcomps); |
| function dy = dP33(t,y) |
| global CONST OBS NOBS TINT W |
| P0 = CONST(1) + CONST(2)*t; |
| dy = (CONST(3)+CONST(4)*t+CONST(5)*t*t)*(P0 − y); |
| if dy<0 |
| dy = 0; |
| end |
| Copyright in the foregoing code is claimed by BIZRATE.COM. |
| @ |
Claims (51)
Priority Applications (1)
| Application Number | Priority Date | Filing Date | Title |
|---|---|---|---|
| US09/538,570 US7013285B1 (en) | 2000-03-29 | 2000-03-29 | System and method for data collection, evaluation, information generation, and presentation |
Applications Claiming Priority (1)
| Application Number | Priority Date | Filing Date | Title |
|---|---|---|---|
| US09/538,570 US7013285B1 (en) | 2000-03-29 | 2000-03-29 | System and method for data collection, evaluation, information generation, and presentation |
Publications (1)
| Publication Number | Publication Date |
|---|---|
| US7013285B1 true US7013285B1 (en) | 2006-03-14 |
Family
ID=35998891
Family Applications (1)
| Application Number | Title | Priority Date | Filing Date |
|---|---|---|---|
| US09/538,570 Expired - Lifetime US7013285B1 (en) | 2000-03-29 | 2000-03-29 | System and method for data collection, evaluation, information generation, and presentation |
Country Status (1)
| Country | Link |
|---|---|
| US (1) | US7013285B1 (en) |
Cited By (105)
| Publication number | Priority date | Publication date | Assignee | Title |
|---|---|---|---|---|
| US20020059221A1 (en) * | 2000-10-19 | 2002-05-16 | Whitehead Anthony David | Method and device for classifying internet objects and objects stored on computer-readable media |
| US20020198782A1 (en) * | 2001-06-22 | 2002-12-26 | Shorter Gary T. | System and method for reducing customer turnover |
| US20040138933A1 (en) * | 2003-01-09 | 2004-07-15 | Lacomb Christina A. | Development of a model for integration into a business intelligence system |
| US20040138935A1 (en) * | 2003-01-09 | 2004-07-15 | Johnson Christopher D. | Visualizing business analysis results |
| US20040138932A1 (en) * | 2003-01-09 | 2004-07-15 | Johnson Christopher D. | Generating business analysis results in advance of a request for the results |
| US20040138908A1 (en) * | 2000-03-29 | 2004-07-15 | Victor Lowe | Method for analyzing warranty claim data |
| US20040138936A1 (en) * | 2003-01-09 | 2004-07-15 | Johnson Christopher D. | Performing what-if forecasts using a business information and decisioning control system |
| US20040138934A1 (en) * | 2003-01-09 | 2004-07-15 | General Electric Company | Controlling a business using a business information and decisioning control system |
| US20040153331A1 (en) * | 2003-02-05 | 2004-08-05 | Zhang Alex X. | Extracting an implied value of a component associated with a plurality of product packages |
| US20050033680A1 (en) * | 2003-06-13 | 2005-02-10 | Seiko Epson Corporation | Technique relating to commodity trading management device |
| US20050038861A1 (en) * | 2003-08-14 | 2005-02-17 | Scott Lynn | Method and system for dynamically generating electronic communications |
| US20050050551A1 (en) * | 2003-09-03 | 2005-03-03 | Electronic Data Systems Corporation | System, method, and computer program product for effort estimation |
| US20050055257A1 (en) * | 2003-09-04 | 2005-03-10 | Deniz Senturk | Techniques for performing business analysis based on incomplete and/or stage-based data |
| US20050131781A1 (en) * | 2003-12-10 | 2005-06-16 | Ford Motor Company | System and method for auditing |
| US20050209907A1 (en) * | 2004-03-17 | 2005-09-22 | Williams Gary A | 3-D customer demand rating method and apparatus |
| US20050240903A1 (en) * | 2004-04-21 | 2005-10-27 | International Business Machines Corporation | Estimating software project requirements for resolving defect backlogs |
| US20060004622A1 (en) * | 2004-06-30 | 2006-01-05 | Experian Marketing Solutions, Inc. | System, method, software and data structure for independent prediction of attitudinal and message responsiveness, and preferences for communication media, channel, timing, frequency, and sequences of communications, using an integrated data repository |
| US20060010194A1 (en) * | 2004-07-06 | 2006-01-12 | Fujitsu Limited | Document data managing apparatus, document data management method, and computer product |
| US20060031108A1 (en) * | 1999-11-15 | 2006-02-09 | H Three, Inc. | Method and apparatus for facilitating and tracking personal referrals |
| US20060036608A1 (en) * | 2004-08-11 | 2006-02-16 | Adknowledge, Inc. | Method and system for generating and distributing electronic communications |
| US20060122883A1 (en) * | 2004-08-11 | 2006-06-08 | Lynn Scott W | Method and system for generating and distributing electronic communications for maximum revenue |
| US20060224729A1 (en) * | 2005-03-29 | 2006-10-05 | H Three, Inc. | Referral tracking |
| US20060224721A1 (en) * | 2005-03-29 | 2006-10-05 | H Three, Inc. | Referral Tracking |
| US20060259465A1 (en) * | 2005-05-10 | 2006-11-16 | Microsoft Corporation | Binding for multi-part identifiers |
| US20070011185A1 (en) * | 2003-08-29 | 2007-01-11 | Robinson John | Apparatus and method for data analysis |
| US20070038607A1 (en) * | 2005-04-05 | 2007-02-15 | Herman Mark Ii | Method for rating of web sites and retrieval of rated web sites |
| US20070050237A1 (en) * | 2005-08-30 | 2007-03-01 | Microsoft Corporation | Visual designer for multi-dimensional business logic |
| US20070112607A1 (en) * | 2005-11-16 | 2007-05-17 | Microsoft Corporation | Score-based alerting in business logic |
| US20070143174A1 (en) * | 2005-12-21 | 2007-06-21 | Microsoft Corporation | Repeated inheritance of heterogeneous business metrics |
| US20070143175A1 (en) * | 2005-12-21 | 2007-06-21 | Microsoft Corporation | Centralized model for coordinating update of multiple reports |
| US20070143161A1 (en) * | 2005-12-21 | 2007-06-21 | Microsoft Corporation | Application independent rendering of scorecard metrics |
| US20070192463A1 (en) * | 2001-03-28 | 2007-08-16 | Kaplan Craig A | System and method for forecasting information using collective intelligence from diverse sources |
| US20070204169A1 (en) * | 2006-02-28 | 2007-08-30 | International Business Machines Corporation | Enabling automatic business processes using state transfer diagram and abstraction |
| US20070255681A1 (en) * | 2006-04-27 | 2007-11-01 | Microsoft Corporation | Automated determination of relevant slice in multidimensional data sources |
| US20070260605A1 (en) * | 2006-03-31 | 2007-11-08 | H Three, Inc. | Multiple-Listing Referral-Tracking System |
| US20070265863A1 (en) * | 2006-04-27 | 2007-11-15 | Microsoft Corporation | Multidimensional scorecard header definition |
| US20080027835A1 (en) * | 2006-07-31 | 2008-01-31 | Caterpillar Inc. | Methods for maintaining inventory records between audit periods |
| US20080027833A1 (en) * | 2006-07-31 | 2008-01-31 | Caterpillar Inc. | Method for optimizing sample size for inventory management processes |
| US20080046344A1 (en) * | 2006-07-31 | 2008-02-21 | Caterpillar Inc. | System and method for managing inventory control processes |
| WO2008045619A2 (en) * | 2006-10-12 | 2008-04-17 | H Three, Inc. | Multiple-listing referral-tracking system |
| US20080091510A1 (en) * | 2006-10-12 | 2008-04-17 | Joshua Scott Crandall | Computer systems and methods for surveying a population |
| US20080114783A1 (en) * | 2006-11-15 | 2008-05-15 | Nguyen Tien M | Method, system, and program product for managing a process and it interlock |
| US20080147702A1 (en) * | 2004-03-16 | 2008-06-19 | Michael Bernhard | Prediction Method and Device For Evaluating and Forecasting Stochastic Events |
| US20080172287A1 (en) * | 2007-01-17 | 2008-07-17 | Ian Tien | Automated Domain Determination in Business Logic Applications |
| US20080183564A1 (en) * | 2007-01-30 | 2008-07-31 | Microsoft Corporation | Untethered Interaction With Aggregated Metrics |
| US20080189724A1 (en) * | 2007-02-02 | 2008-08-07 | Microsoft Corporation | Real Time Collaboration Using Embedded Data Visualizations |
| US20080243646A1 (en) * | 2007-03-30 | 2008-10-02 | Andrew Christopher Stein | Methods for proactively reconciling bin denials in inventory management environments |
| US20080295006A1 (en) * | 2007-05-22 | 2008-11-27 | Luvogt Christopher | Dynamic layout for a search engine results page based of implicit user feedback |
| US20080300960A1 (en) * | 2007-05-31 | 2008-12-04 | W Ratings Corporation | Competitive advantage rating method and apparatus |
| US20090187471A1 (en) * | 2006-02-08 | 2009-07-23 | George Ramsay Beaton | Method and system for evaluating one or more attributes of an organization |
| US20090307296A1 (en) * | 2008-06-04 | 2009-12-10 | Samsung Electronics Co., Ltd. | Method for anonymous collaborative filtering using matrix factorization |
| US7716592B2 (en) | 2006-03-30 | 2010-05-11 | Microsoft Corporation | Automated generation of dashboards for scorecard metrics and subordinate reporting |
| US7840896B2 (en) | 2006-03-30 | 2010-11-23 | Microsoft Corporation | Definition and instantiation of metric based business logic reports |
| US20110004515A1 (en) * | 2003-06-16 | 2011-01-06 | Ewinwin, Inc. | Dynamic discount card tied to price curves & group discounts |
| US20110055104A1 (en) * | 2008-05-14 | 2011-03-03 | The Board Of Governors For Higher Education, State Of Rhode Island And Providence Plantations | Systems and methods for detecting unfair manipulations of on-line reputation systems |
| US20110076663A1 (en) * | 2003-08-18 | 2011-03-31 | Retail Optimization International | Systems and methods for selecting survey questions and available responses |
| US20110191141A1 (en) * | 2010-02-04 | 2011-08-04 | Thompson Michael L | Method for Conducting Consumer Research |
| US20110213653A1 (en) * | 1999-05-12 | 2011-09-01 | Ewinwin, Inc. | Hosted demand aggregation |
| USRE43113E1 (en) * | 2002-06-28 | 2012-01-17 | Openwave Systems Inc. | Domain-based management of distribution of digital content from multiple suppliers to multiple wireless services subscribers |
| US8190992B2 (en) | 2006-04-21 | 2012-05-29 | Microsoft Corporation | Grouping and display of logically defined reports |
| US8209222B2 (en) | 2005-10-12 | 2012-06-26 | Adknowledge, Inc. | Method and system for encrypting data delivered over a network |
| US20120203625A1 (en) * | 2007-11-02 | 2012-08-09 | Metamarkets Group Inc. | Advertising futures marketplace methods and systems |
| US8261181B2 (en) | 2006-03-30 | 2012-09-04 | Microsoft Corporation | Multidimensional metrics-based annotation |
| US20120245993A1 (en) * | 1999-05-12 | 2012-09-27 | Mesaros Gregory J | Discounted Pricing |
| US8321805B2 (en) | 2007-01-30 | 2012-11-27 | Microsoft Corporation | Service architecture based metric views |
| US20120311478A1 (en) * | 2008-03-04 | 2012-12-06 | Van Os Marcel | Methods and Graphical User Interfaces for Conducting Searches on a Portable Multifunction Device |
| US8330759B1 (en) | 2005-06-30 | 2012-12-11 | AudienceScience Inc. | Defining one or more used segments based upon extent of completion of a process |
| US8332294B1 (en) * | 2008-04-02 | 2012-12-11 | Capital One Financial Corporation | Method and system for collecting and managing feedback from account users via account statements |
| US20130132152A1 (en) * | 2011-07-18 | 2013-05-23 | Seema V. Srivastava | Methods and apparatus to determine media impressions |
| US20130254673A1 (en) * | 2012-03-20 | 2013-09-26 | Samsung Electronics Co. Ltd. | Agent service method, and electronic device, server, and computer-readable recording medium thereof |
| US8600790B1 (en) * | 2008-01-10 | 2013-12-03 | Usability Sciences Corporation | System and method for presenting an internet survey to pre-qualified vistors to a website |
| US20130325660A1 (en) * | 2012-05-30 | 2013-12-05 | Auto 100 Media, Inc. | Systems and methods for ranking entities based on aggregated web-based content |
| CN103441885A (en) * | 2013-09-10 | 2013-12-11 | 大唐移动通信设备有限公司 | Activity alarm processing method and equipment |
| US8645300B1 (en) * | 2011-07-20 | 2014-02-04 | Usability Sciences Corporation | System and method for intent data processing |
| US8739061B1 (en) * | 2003-09-29 | 2014-05-27 | Google Inc. | Method and apparatus for output of search results |
| US8738462B2 (en) | 1999-10-22 | 2014-05-27 | Ewinwin, Inc. | Systems and methods for searchable time-based offers |
| US20140156401A1 (en) * | 2003-09-22 | 2014-06-05 | Catalina Marketing Corporation | Assumed demographics, predicted behavior, and targeted incentives |
| US20140180857A1 (en) * | 2000-10-30 | 2014-06-26 | Fujitsu America, Inc. | Self-checkout method and apparatus |
| US8775269B2 (en) | 2002-08-28 | 2014-07-08 | Ewinwin, Inc. | Method and system for a hand-held device initiated search, purchase and delivery |
| WO2014127302A1 (en) * | 2013-02-15 | 2014-08-21 | Olesen Marie B V | System for providing consumer ratings |
| US8856015B2 (en) | 2002-06-18 | 2014-10-07 | Ewinwin, Inc. | Presenting offers to users of wireless devices |
| US8868639B2 (en) | 2012-03-10 | 2014-10-21 | Headwater Partners Ii Llc | Content broker assisting distribution of content |
| US8972287B1 (en) | 1991-06-03 | 2015-03-03 | Ewinwin, Inc. | Multiple criteria buying and selling model |
| US20150120613A1 (en) * | 2008-12-29 | 2015-04-30 | Fmr Llc | Real-time trade forecaster |
| US9058307B2 (en) | 2007-01-26 | 2015-06-16 | Microsoft Technology Licensing, Llc | Presentation generation using scorecard elements |
| US20150220948A1 (en) * | 2014-02-05 | 2015-08-06 | Ntn Buzztime, Inc. | On-site election method and apparatus |
| US9152624B1 (en) | 2003-12-04 | 2015-10-06 | Retail Optimization International, Inc. | Systems and methods for visual presentation and navigation of content using data-based image analysis |
| US9210217B2 (en) | 2012-03-10 | 2015-12-08 | Headwater Partners Ii Llc | Content broker that offers preloading opportunities |
| US9338233B2 (en) | 2012-03-10 | 2016-05-10 | Headwater Partners Ii Llc | Distributing content by generating and preloading queues of content |
| US9354811B2 (en) | 2009-03-16 | 2016-05-31 | Apple Inc. | Multifunction device with integrated search and application selection |
| US20160232461A1 (en) * | 2015-02-09 | 2016-08-11 | Oracle International Corporation | System and method for determining forecast errors for merchandise in retail |
| US9503510B2 (en) | 2012-03-10 | 2016-11-22 | Headwater Partners Ii Llc | Content distribution based on a value metric |
| US20170116622A1 (en) * | 2015-10-27 | 2017-04-27 | Sparks Exhibits Holding Corporation | System and method for event marketing measurement |
| US10019593B1 (en) | 2015-11-23 | 2018-07-10 | Experian Information Solutions, Inc. | Access control system for implementing access restrictions of regulated database records while identifying and providing indicators of regulated database records matching validation criteria |
| US20180285944A1 (en) * | 2017-03-30 | 2018-10-04 | Mastercard International Incorporated | Methods and Systems for Use in Providing Spend Profiles for Reviewers, in Response to Requests for Validation of Reviews Submitted by the Reviewers |
| US10120632B2 (en) * | 2014-06-16 | 2018-11-06 | Interactive Solutions Corp. | Display information management system |
| US10504146B2 (en) | 2005-07-21 | 2019-12-10 | Adknowledge, Inc. | Method and system for delivering electronic communications |
| US10678894B2 (en) | 2016-08-24 | 2020-06-09 | Experian Information Solutions, Inc. | Disambiguation and authentication of device users |
| US10832218B1 (en) * | 2016-04-05 | 2020-11-10 | Palantir Technologies Inc. | User interface for visualization of an attrition value |
| US10938822B2 (en) | 2013-02-15 | 2021-03-02 | Rpr Group Holdings, Llc | System and method for processing computer inputs over a data communication network |
| CN113014605A (en) * | 2021-04-14 | 2021-06-22 | 北京理工大学 | Quantitative control method for denial of service attack and disturbance |
| US11257117B1 (en) | 2014-06-25 | 2022-02-22 | Experian Information Solutions, Inc. | Mobile device sighting location analytics and profiling system |
| CN114091766A (en) * | 2021-11-24 | 2022-02-25 | 东北电力大学 | Space load prediction method based on CEEMDAN-LSTM |
| US20220180381A1 (en) * | 2013-04-11 | 2022-06-09 | Lucid Holdings, LLC | Method of correlating bid price to intrinsic value in a survey platform |
| US11682041B1 (en) | 2020-01-13 | 2023-06-20 | Experian Marketing Solutions, Llc | Systems and methods of a tracking analytics platform |
Citations (13)
| Publication number | Priority date | Publication date | Assignee | Title |
|---|---|---|---|---|
| US5893098A (en) | 1994-09-14 | 1999-04-06 | Dolphin Software Pty Ltd | System and method for obtaining and collating survey information from a plurality of computer users |
| US5915243A (en) | 1996-08-29 | 1999-06-22 | Smolen; Daniel T. | Method and apparatus for delivering consumer promotions |
| US5956709A (en) | 1997-07-28 | 1999-09-21 | Xue; Yansheng | Dynamic data assembling on internet client side |
| US5983220A (en) | 1995-11-15 | 1999-11-09 | Bizrate.Com | Supporting intuitive decision in complex multi-attributive domains using fuzzy, hierarchical expert models |
| US5991735A (en) | 1996-04-26 | 1999-11-23 | Be Free, Inc. | Computer program apparatus for determining behavioral profile of a computer user |
| US6128624A (en) * | 1997-11-12 | 2000-10-03 | Ncr Corporation | Collection and integration of internet and electronic commerce data in a database during web browsing |
| US6131085A (en) | 1993-05-21 | 2000-10-10 | Rossides; Michael T | Answer collection and retrieval system governed by a pay-off meter |
| EP1115073A2 (en) * | 2000-01-06 | 2001-07-11 | Hee Jeoung Park of Mido Apt. 302-1302 | Method and apparatus for conducting online survey |
| US20010014868A1 (en) | 1997-12-05 | 2001-08-16 | Frederick Herz | System for the automatic determination of customized prices and promotions |
| US6405174B1 (en) * | 1998-10-05 | 2002-06-11 | Walker Ditial, Llc | Method and apparatus for defining routing of customers between merchants |
| US6405175B1 (en) * | 1999-07-27 | 2002-06-11 | David Way Ng | Shopping scouts web site for rewarding customer referrals on product and price information with rewards scaled by the number of shoppers using the information |
| US20020072951A1 (en) * | 1999-03-03 | 2002-06-13 | Michael Lee | Marketing support database management method, system and program product |
| US20030033299A1 (en) * | 2000-01-20 | 2003-02-13 | Neelakantan Sundaresan | System and method for integrating off-line ratings of Businesses with search engines |
-
2000
- 2000-03-29 US US09/538,570 patent/US7013285B1/en not_active Expired - Lifetime
Patent Citations (13)
| Publication number | Priority date | Publication date | Assignee | Title |
|---|---|---|---|---|
| US6131085A (en) | 1993-05-21 | 2000-10-10 | Rossides; Michael T | Answer collection and retrieval system governed by a pay-off meter |
| US5893098A (en) | 1994-09-14 | 1999-04-06 | Dolphin Software Pty Ltd | System and method for obtaining and collating survey information from a plurality of computer users |
| US5983220A (en) | 1995-11-15 | 1999-11-09 | Bizrate.Com | Supporting intuitive decision in complex multi-attributive domains using fuzzy, hierarchical expert models |
| US5991735A (en) | 1996-04-26 | 1999-11-23 | Be Free, Inc. | Computer program apparatus for determining behavioral profile of a computer user |
| US5915243A (en) | 1996-08-29 | 1999-06-22 | Smolen; Daniel T. | Method and apparatus for delivering consumer promotions |
| US5956709A (en) | 1997-07-28 | 1999-09-21 | Xue; Yansheng | Dynamic data assembling on internet client side |
| US6128624A (en) * | 1997-11-12 | 2000-10-03 | Ncr Corporation | Collection and integration of internet and electronic commerce data in a database during web browsing |
| US20010014868A1 (en) | 1997-12-05 | 2001-08-16 | Frederick Herz | System for the automatic determination of customized prices and promotions |
| US6405174B1 (en) * | 1998-10-05 | 2002-06-11 | Walker Ditial, Llc | Method and apparatus for defining routing of customers between merchants |
| US20020072951A1 (en) * | 1999-03-03 | 2002-06-13 | Michael Lee | Marketing support database management method, system and program product |
| US6405175B1 (en) * | 1999-07-27 | 2002-06-11 | David Way Ng | Shopping scouts web site for rewarding customer referrals on product and price information with rewards scaled by the number of shoppers using the information |
| EP1115073A2 (en) * | 2000-01-06 | 2001-07-11 | Hee Jeoung Park of Mido Apt. 302-1302 | Method and apparatus for conducting online survey |
| US20030033299A1 (en) * | 2000-01-20 | 2003-02-13 | Neelakantan Sundaresan | System and method for integrating off-line ratings of Businesses with search engines |
Non-Patent Citations (1)
| Title |
|---|
| Hagel III, John and Singer, Marc; Net Worth; 1999; pp. 261-284; Harvard Business School Press; Boston, Massachusetts. |
Cited By (149)
| Publication number | Priority date | Publication date | Assignee | Title |
|---|---|---|---|---|
| US8972287B1 (en) | 1991-06-03 | 2015-03-03 | Ewinwin, Inc. | Multiple criteria buying and selling model |
| US20110213653A1 (en) * | 1999-05-12 | 2011-09-01 | Ewinwin, Inc. | Hosted demand aggregation |
| US20120245993A1 (en) * | 1999-05-12 | 2012-09-27 | Mesaros Gregory J | Discounted Pricing |
| US20120278157A1 (en) * | 1999-05-12 | 2012-11-01 | Mesaros Gregory J | Discounted Deal Pricing |
| US8732018B2 (en) | 1999-05-12 | 2014-05-20 | Ewinwin, Inc. | Real-time offers and dynamic price adjustments presented to mobile devices |
| US8738462B2 (en) | 1999-10-22 | 2014-05-27 | Ewinwin, Inc. | Systems and methods for searchable time-based offers |
| US20060031108A1 (en) * | 1999-11-15 | 2006-02-09 | H Three, Inc. | Method and apparatus for facilitating and tracking personal referrals |
| US20040138908A1 (en) * | 2000-03-29 | 2004-07-15 | Victor Lowe | Method for analyzing warranty claim data |
| US20020059221A1 (en) * | 2000-10-19 | 2002-05-16 | Whitehead Anthony David | Method and device for classifying internet objects and objects stored on computer-readable media |
| US7383282B2 (en) * | 2000-10-19 | 2008-06-03 | Anthony David Whitehead | Method and device for classifying internet objects and objects stored on computer-readable media |
| US9799023B2 (en) * | 2000-10-30 | 2017-10-24 | Fujitsu America, Inc. | Self-checkout method and apparatus |
| US20140180857A1 (en) * | 2000-10-30 | 2014-06-26 | Fujitsu America, Inc. | Self-checkout method and apparatus |
| US7627673B2 (en) * | 2001-03-28 | 2009-12-01 | Predictwallstreet, Llc | Information processing system and computer implemented method for forecasting information using collective intelligence from diverse sources |
| US20100185493A1 (en) * | 2001-03-28 | 2010-07-22 | Craig Andrew Kaplan | System and method for forecasting information using collective intelligence from diverse sources |
| US7962614B2 (en) | 2001-03-28 | 2011-06-14 | Predictwallstreet, Llc | System and method for forecasting information using collective intelligence from diverse sources |
| US20070192463A1 (en) * | 2001-03-28 | 2007-08-16 | Kaplan Craig A | System and method for forecasting information using collective intelligence from diverse sources |
| US20020198782A1 (en) * | 2001-06-22 | 2002-12-26 | Shorter Gary T. | System and method for reducing customer turnover |
| US8856015B2 (en) | 2002-06-18 | 2014-10-07 | Ewinwin, Inc. | Presenting offers to users of wireless devices |
| USRE43113E1 (en) * | 2002-06-28 | 2012-01-17 | Openwave Systems Inc. | Domain-based management of distribution of digital content from multiple suppliers to multiple wireless services subscribers |
| US8775269B2 (en) | 2002-08-28 | 2014-07-08 | Ewinwin, Inc. | Method and system for a hand-held device initiated search, purchase and delivery |
| US20040138934A1 (en) * | 2003-01-09 | 2004-07-15 | General Electric Company | Controlling a business using a business information and decisioning control system |
| US20040138936A1 (en) * | 2003-01-09 | 2004-07-15 | Johnson Christopher D. | Performing what-if forecasts using a business information and decisioning control system |
| US20040138932A1 (en) * | 2003-01-09 | 2004-07-15 | Johnson Christopher D. | Generating business analysis results in advance of a request for the results |
| US20040138935A1 (en) * | 2003-01-09 | 2004-07-15 | Johnson Christopher D. | Visualizing business analysis results |
| US20040138933A1 (en) * | 2003-01-09 | 2004-07-15 | Lacomb Christina A. | Development of a model for integration into a business intelligence system |
| US20040153331A1 (en) * | 2003-02-05 | 2004-08-05 | Zhang Alex X. | Extracting an implied value of a component associated with a plurality of product packages |
| US7624035B2 (en) * | 2003-02-05 | 2009-11-24 | Hewlett-Packard Development Company, L.P. | Extracting an implied value of a component associated with a plurality of product packages |
| US20050033680A1 (en) * | 2003-06-13 | 2005-02-10 | Seiko Epson Corporation | Technique relating to commodity trading management device |
| US8695877B2 (en) | 2003-06-16 | 2014-04-15 | Ewinwin, Inc. | Dynamic discount device |
| US20110004515A1 (en) * | 2003-06-16 | 2011-01-06 | Ewinwin, Inc. | Dynamic discount card tied to price curves & group discounts |
| US8626845B2 (en) | 2003-08-14 | 2014-01-07 | Adknowledge, Inc. | Method and system for dynamically generating electronic communications |
| US20050038861A1 (en) * | 2003-08-14 | 2005-02-17 | Scott Lynn | Method and system for dynamically generating electronic communications |
| US20110076663A1 (en) * | 2003-08-18 | 2011-03-31 | Retail Optimization International | Systems and methods for selecting survey questions and available responses |
| US20070011185A1 (en) * | 2003-08-29 | 2007-01-11 | Robinson John | Apparatus and method for data analysis |
| US20050050551A1 (en) * | 2003-09-03 | 2005-03-03 | Electronic Data Systems Corporation | System, method, and computer program product for effort estimation |
| US7350185B2 (en) * | 2003-09-03 | 2008-03-25 | Electronic Data Systems Corporation | System, method, and computer program product for effort estimation |
| US20050055257A1 (en) * | 2003-09-04 | 2005-03-10 | Deniz Senturk | Techniques for performing business analysis based on incomplete and/or stage-based data |
| US7676390B2 (en) * | 2003-09-04 | 2010-03-09 | General Electric Company | Techniques for performing business analysis based on incomplete and/or stage-based data |
| US20140156401A1 (en) * | 2003-09-22 | 2014-06-05 | Catalina Marketing Corporation | Assumed demographics, predicted behavior, and targeted incentives |
| US8739061B1 (en) * | 2003-09-29 | 2014-05-27 | Google Inc. | Method and apparatus for output of search results |
| US9152624B1 (en) | 2003-12-04 | 2015-10-06 | Retail Optimization International, Inc. | Systems and methods for visual presentation and navigation of content using data-based image analysis |
| US20050131781A1 (en) * | 2003-12-10 | 2005-06-16 | Ford Motor Company | System and method for auditing |
| US20080147702A1 (en) * | 2004-03-16 | 2008-06-19 | Michael Bernhard | Prediction Method and Device For Evaluating and Forecasting Stochastic Events |
| US20050209907A1 (en) * | 2004-03-17 | 2005-09-22 | Williams Gary A | 3-D customer demand rating method and apparatus |
| US20050240903A1 (en) * | 2004-04-21 | 2005-10-27 | International Business Machines Corporation | Estimating software project requirements for resolving defect backlogs |
| US7398510B2 (en) * | 2004-04-21 | 2008-07-08 | International Business Machines Corporation | Estimating software project requirements for resolving defect backlogs |
| US20180121940A1 (en) * | 2004-06-30 | 2018-05-03 | Experian Marketing Solutions, Inc. | System, method, software and data structure for independent prediction of attitudinal and message responsiveness, and preferences for communication media, channel, timing, frequency, and sequences of communications, using an integrated data repository |
| US20130339087A1 (en) * | 2004-06-30 | 2013-12-19 | Experian Marketing Solutions, Inc. | System, Method, Software and Data Structure for Independent Prediction of Attitudinal and Message Responsiveness, and Preferences For Communication Media, Channel, Timing, Frequency, and Sequences of Communications, Using an Integrated Data Repository |
| US9471928B2 (en) * | 2004-06-30 | 2016-10-18 | Experian Marketing Solutions, Inc. | System and method for generating targeted communications having different content and with preferences for communication media, channel, timing, frequency, and sequences of communications, using an integrated data repository |
| US8346593B2 (en) * | 2004-06-30 | 2013-01-01 | Experian Marketing Solutions, Inc. | System, method, and software for prediction of attitudinal and message responsiveness |
| US20060004622A1 (en) * | 2004-06-30 | 2006-01-05 | Experian Marketing Solutions, Inc. | System, method, software and data structure for independent prediction of attitudinal and message responsiveness, and preferences for communication media, channel, timing, frequency, and sequences of communications, using an integrated data repository |
| US10810605B2 (en) * | 2004-06-30 | 2020-10-20 | Experian Marketing Solutions, Llc | System, method, software and data structure for independent prediction of attitudinal and message responsiveness, and preferences for communication media, channel, timing, frequency, and sequences of communications, using an integrated data repository |
| US11657411B1 (en) * | 2004-06-30 | 2023-05-23 | Experian Marketing Solutions, Llc | System, method, software and data structure for independent prediction of attitudinal and message responsiveness, and preferences for communication media, channel, timing, frequency, and sequences of communications, using an integrated data repository |
| US20060010194A1 (en) * | 2004-07-06 | 2006-01-12 | Fujitsu Limited | Document data managing apparatus, document data management method, and computer product |
| US8429190B2 (en) | 2004-08-11 | 2013-04-23 | Adknowledge, Inc. | Method and system for generating and distributing electronic communications |
| US8249929B2 (en) | 2004-08-11 | 2012-08-21 | Adknowledge, Inc. | Method and system for generating and distributing electronic communications for maximum revenue |
| US20060036608A1 (en) * | 2004-08-11 | 2006-02-16 | Adknowledge, Inc. | Method and system for generating and distributing electronic communications |
| US20060122883A1 (en) * | 2004-08-11 | 2006-06-08 | Lynn Scott W | Method and system for generating and distributing electronic communications for maximum revenue |
| US20060224729A1 (en) * | 2005-03-29 | 2006-10-05 | H Three, Inc. | Referral tracking |
| US20060224721A1 (en) * | 2005-03-29 | 2006-10-05 | H Three, Inc. | Referral Tracking |
| US20070038607A1 (en) * | 2005-04-05 | 2007-02-15 | Herman Mark Ii | Method for rating of web sites and retrieval of rated web sites |
| US7580923B2 (en) * | 2005-05-10 | 2009-08-25 | Microsoft Corporation | Binding for multi-part identifiers |
| US20060259465A1 (en) * | 2005-05-10 | 2006-11-16 | Microsoft Corporation | Binding for multi-part identifiers |
| US8330759B1 (en) | 2005-06-30 | 2012-12-11 | AudienceScience Inc. | Defining one or more used segments based upon extent of completion of a process |
| US10504146B2 (en) | 2005-07-21 | 2019-12-10 | Adknowledge, Inc. | Method and system for delivering electronic communications |
| US20070050237A1 (en) * | 2005-08-30 | 2007-03-01 | Microsoft Corporation | Visual designer for multi-dimensional business logic |
| US8209222B2 (en) | 2005-10-12 | 2012-06-26 | Adknowledge, Inc. | Method and system for encrypting data delivered over a network |
| US9281939B2 (en) | 2005-10-12 | 2016-03-08 | Adknowledge, Inc. | Method and system for encrypting data delivered over a network |
| US20070112607A1 (en) * | 2005-11-16 | 2007-05-17 | Microsoft Corporation | Score-based alerting in business logic |
| US20070143174A1 (en) * | 2005-12-21 | 2007-06-21 | Microsoft Corporation | Repeated inheritance of heterogeneous business metrics |
| US20070143175A1 (en) * | 2005-12-21 | 2007-06-21 | Microsoft Corporation | Centralized model for coordinating update of multiple reports |
| US20070143161A1 (en) * | 2005-12-21 | 2007-06-21 | Microsoft Corporation | Application independent rendering of scorecard metrics |
| US20090187471A1 (en) * | 2006-02-08 | 2009-07-23 | George Ramsay Beaton | Method and system for evaluating one or more attributes of an organization |
| US20070204169A1 (en) * | 2006-02-28 | 2007-08-30 | International Business Machines Corporation | Enabling automatic business processes using state transfer diagram and abstraction |
| US8261181B2 (en) | 2006-03-30 | 2012-09-04 | Microsoft Corporation | Multidimensional metrics-based annotation |
| US7716592B2 (en) | 2006-03-30 | 2010-05-11 | Microsoft Corporation | Automated generation of dashboards for scorecard metrics and subordinate reporting |
| US7840896B2 (en) | 2006-03-30 | 2010-11-23 | Microsoft Corporation | Definition and instantiation of metric based business logic reports |
| US20070260605A1 (en) * | 2006-03-31 | 2007-11-08 | H Three, Inc. | Multiple-Listing Referral-Tracking System |
| US8190992B2 (en) | 2006-04-21 | 2012-05-29 | Microsoft Corporation | Grouping and display of logically defined reports |
| US7716571B2 (en) | 2006-04-27 | 2010-05-11 | Microsoft Corporation | Multidimensional scorecard header definition |
| US20070255681A1 (en) * | 2006-04-27 | 2007-11-01 | Microsoft Corporation | Automated determination of relevant slice in multidimensional data sources |
| US20070265863A1 (en) * | 2006-04-27 | 2007-11-15 | Microsoft Corporation | Multidimensional scorecard header definition |
| US20080027833A1 (en) * | 2006-07-31 | 2008-01-31 | Caterpillar Inc. | Method for optimizing sample size for inventory management processes |
| US20080027835A1 (en) * | 2006-07-31 | 2008-01-31 | Caterpillar Inc. | Methods for maintaining inventory records between audit periods |
| US20080046344A1 (en) * | 2006-07-31 | 2008-02-21 | Caterpillar Inc. | System and method for managing inventory control processes |
| WO2008045619A3 (en) * | 2006-10-12 | 2008-11-20 | Three Inc H | Multiple-listing referral-tracking system |
| WO2008045619A2 (en) * | 2006-10-12 | 2008-04-17 | H Three, Inc. | Multiple-listing referral-tracking system |
| US20080091510A1 (en) * | 2006-10-12 | 2008-04-17 | Joshua Scott Crandall | Computer systems and methods for surveying a population |
| US20080091820A1 (en) * | 2006-10-12 | 2008-04-17 | Norman John G | Multiple-listing referral tracking system |
| US20080114783A1 (en) * | 2006-11-15 | 2008-05-15 | Nguyen Tien M | Method, system, and program product for managing a process and it interlock |
| US20080172287A1 (en) * | 2007-01-17 | 2008-07-17 | Ian Tien | Automated Domain Determination in Business Logic Applications |
| US9058307B2 (en) | 2007-01-26 | 2015-06-16 | Microsoft Technology Licensing, Llc | Presentation generation using scorecard elements |
| US20080183564A1 (en) * | 2007-01-30 | 2008-07-31 | Microsoft Corporation | Untethered Interaction With Aggregated Metrics |
| US8321805B2 (en) | 2007-01-30 | 2012-11-27 | Microsoft Corporation | Service architecture based metric views |
| US9392026B2 (en) | 2007-02-02 | 2016-07-12 | Microsoft Technology Licensing, Llc | Real time collaboration using embedded data visualizations |
| US8495663B2 (en) | 2007-02-02 | 2013-07-23 | Microsoft Corporation | Real time collaboration using embedded data visualizations |
| US20080189724A1 (en) * | 2007-02-02 | 2008-08-07 | Microsoft Corporation | Real Time Collaboration Using Embedded Data Visualizations |
| US20080243646A1 (en) * | 2007-03-30 | 2008-10-02 | Andrew Christopher Stein | Methods for proactively reconciling bin denials in inventory management environments |
| US8015502B2 (en) * | 2007-05-22 | 2011-09-06 | Yahoo! Inc. | Dynamic layout for a search engine results page on implicit user feedback |
| US20080295006A1 (en) * | 2007-05-22 | 2008-11-27 | Luvogt Christopher | Dynamic layout for a search engine results page based of implicit user feedback |
| US20080300960A1 (en) * | 2007-05-31 | 2008-12-04 | W Ratings Corporation | Competitive advantage rating method and apparatus |
| US20120203625A1 (en) * | 2007-11-02 | 2012-08-09 | Metamarkets Group Inc. | Advertising futures marketplace methods and systems |
| US10915924B1 (en) | 2007-11-02 | 2021-02-09 | Snap Inc. | Advertising futures marketplace methods and systems |
| US10489821B2 (en) | 2007-11-02 | 2019-11-26 | Snap Inc. | Advertising futures marketplace methods and systems |
| US11676174B2 (en) | 2007-11-02 | 2023-06-13 | Snap Inc. | Advertising futures marketplace methods and systems |
| US8600790B1 (en) * | 2008-01-10 | 2013-12-03 | Usability Sciences Corporation | System and method for presenting an internet survey to pre-qualified vistors to a website |
| US10379728B2 (en) * | 2008-03-04 | 2019-08-13 | Apple Inc. | Methods and graphical user interfaces for conducting searches on a portable multifunction device |
| US20120311478A1 (en) * | 2008-03-04 | 2012-12-06 | Van Os Marcel | Methods and Graphical User Interfaces for Conducting Searches on a Portable Multifunction Device |
| US8332294B1 (en) * | 2008-04-02 | 2012-12-11 | Capital One Financial Corporation | Method and system for collecting and managing feedback from account users via account statements |
| US20110055104A1 (en) * | 2008-05-14 | 2011-03-03 | The Board Of Governors For Higher Education, State Of Rhode Island And Providence Plantations | Systems and methods for detecting unfair manipulations of on-line reputation systems |
| US20090307296A1 (en) * | 2008-06-04 | 2009-12-10 | Samsung Electronics Co., Ltd. | Method for anonymous collaborative filtering using matrix factorization |
| US7685232B2 (en) * | 2008-06-04 | 2010-03-23 | Samsung Electronics Co., Ltd. | Method for anonymous collaborative filtering using matrix factorization |
| US20150120613A1 (en) * | 2008-12-29 | 2015-04-30 | Fmr Llc | Real-time trade forecaster |
| US10042513B2 (en) | 2009-03-16 | 2018-08-07 | Apple Inc. | Multifunction device with integrated search and application selection |
| US11720584B2 (en) | 2009-03-16 | 2023-08-08 | Apple Inc. | Multifunction device with integrated search and application selection |
| US10067991B2 (en) | 2009-03-16 | 2018-09-04 | Apple Inc. | Multifunction device with integrated search and application selection |
| US9354811B2 (en) | 2009-03-16 | 2016-05-31 | Apple Inc. | Multifunction device with integrated search and application selection |
| US20110191141A1 (en) * | 2010-02-04 | 2011-08-04 | Thompson Michael L | Method for Conducting Consumer Research |
| US20130132152A1 (en) * | 2011-07-18 | 2013-05-23 | Seema V. Srivastava | Methods and apparatus to determine media impressions |
| US8645300B1 (en) * | 2011-07-20 | 2014-02-04 | Usability Sciences Corporation | System and method for intent data processing |
| US9338233B2 (en) | 2012-03-10 | 2016-05-10 | Headwater Partners Ii Llc | Distributing content by generating and preloading queues of content |
| US9210217B2 (en) | 2012-03-10 | 2015-12-08 | Headwater Partners Ii Llc | Content broker that offers preloading opportunities |
| US9503510B2 (en) | 2012-03-10 | 2016-11-22 | Headwater Partners Ii Llc | Content distribution based on a value metric |
| US10356199B2 (en) | 2012-03-10 | 2019-07-16 | Headwater Partners Ii Llc | Content distribution with a quality based on current network connection type |
| US8868639B2 (en) | 2012-03-10 | 2014-10-21 | Headwater Partners Ii Llc | Content broker assisting distribution of content |
| US20130254673A1 (en) * | 2012-03-20 | 2013-09-26 | Samsung Electronics Co. Ltd. | Agent service method, and electronic device, server, and computer-readable recording medium thereof |
| US20130325660A1 (en) * | 2012-05-30 | 2013-12-05 | Auto 100 Media, Inc. | Systems and methods for ranking entities based on aggregated web-based content |
| US10938822B2 (en) | 2013-02-15 | 2021-03-02 | Rpr Group Holdings, Llc | System and method for processing computer inputs over a data communication network |
| WO2014127302A1 (en) * | 2013-02-15 | 2014-08-21 | Olesen Marie B V | System for providing consumer ratings |
| US20220180381A1 (en) * | 2013-04-11 | 2022-06-09 | Lucid Holdings, LLC | Method of correlating bid price to intrinsic value in a survey platform |
| CN103441885A (en) * | 2013-09-10 | 2013-12-11 | 大唐移动通信设备有限公司 | Activity alarm processing method and equipment |
| US20150220948A1 (en) * | 2014-02-05 | 2015-08-06 | Ntn Buzztime, Inc. | On-site election method and apparatus |
| US10120632B2 (en) * | 2014-06-16 | 2018-11-06 | Interactive Solutions Corp. | Display information management system |
| US10606538B2 (en) | 2014-06-16 | 2020-03-31 | Interactive Solutions Corp. | Display information management system |
| US11257117B1 (en) | 2014-06-25 | 2022-02-22 | Experian Information Solutions, Inc. | Mobile device sighting location analytics and profiling system |
| US11620677B1 (en) | 2014-06-25 | 2023-04-04 | Experian Information Solutions, Inc. | Mobile device sighting location analytics and profiling system |
| US20160232461A1 (en) * | 2015-02-09 | 2016-08-11 | Oracle International Corporation | System and method for determining forecast errors for merchandise in retail |
| US20170116622A1 (en) * | 2015-10-27 | 2017-04-27 | Sparks Exhibits Holding Corporation | System and method for event marketing measurement |
| US10019593B1 (en) | 2015-11-23 | 2018-07-10 | Experian Information Solutions, Inc. | Access control system for implementing access restrictions of regulated database records while identifying and providing indicators of regulated database records matching validation criteria |
| US11748503B1 (en) | 2015-11-23 | 2023-09-05 | Experian Information Solutions, Inc. | Access control system for implementing access restrictions of regulated database records while identifying and providing indicators of regulated database records matching validation criteria |
| US10685133B1 (en) | 2015-11-23 | 2020-06-16 | Experian Information Solutions, Inc. | Access control system for implementing access restrictions of regulated database records while identifying and providing indicators of regulated database records matching validation criteria |
| US10832218B1 (en) * | 2016-04-05 | 2020-11-10 | Palantir Technologies Inc. | User interface for visualization of an attrition value |
| US10678894B2 (en) | 2016-08-24 | 2020-06-09 | Experian Information Solutions, Inc. | Disambiguation and authentication of device users |
| US11550886B2 (en) | 2016-08-24 | 2023-01-10 | Experian Information Solutions, Inc. | Disambiguation and authentication of device users |
| US20180285944A1 (en) * | 2017-03-30 | 2018-10-04 | Mastercard International Incorporated | Methods and Systems for Use in Providing Spend Profiles for Reviewers, in Response to Requests for Validation of Reviews Submitted by the Reviewers |
| US11682041B1 (en) | 2020-01-13 | 2023-06-20 | Experian Marketing Solutions, Llc | Systems and methods of a tracking analytics platform |
| CN113014605B (en) * | 2021-04-14 | 2021-12-28 | 北京理工大学 | Quantitative control method for denial of service attack and disturbance |
| CN113014605A (en) * | 2021-04-14 | 2021-06-22 | 北京理工大学 | Quantitative control method for denial of service attack and disturbance |
| CN114091766A (en) * | 2021-11-24 | 2022-02-25 | 东北电力大学 | Space load prediction method based on CEEMDAN-LSTM |
Similar Documents
| Publication | Publication Date | Title |
|---|---|---|
| US7013285B1 (en) | System and method for data collection, evaluation, information generation, and presentation | |
| US6711581B2 (en) | System and method for data collection, evaluation, information generation, and presentation | |
| US6662192B1 (en) | System and method for data collection, evaluation, information generation, and presentation | |
| US8224715B2 (en) | Computer-based analysis of affiliate site performance | |
| US8260682B2 (en) | Systems and methods for online selection of service providers and management of service accounts | |
| US20020052774A1 (en) | Collecting and analyzing survey data | |
| US7822632B2 (en) | System and method for conducting product configuration research over a computer-based network | |
| US20060106670A1 (en) | System and method for interactively and progressively determining customer satisfaction within a networked community | |
| Balcombe et al. | Information customization and food choice | |
| US20080073429A1 (en) | Method and system for post purchase monitoring | |
| US11216850B2 (en) | Predictive platform for determining incremental lift | |
| US10460359B1 (en) | Computer-implemented method for arranging hyperlinks on a graphical user-interface | |
| AU2002347914A1 (en) | System and method for conducting product configuration research over a computer-based network | |
| US7890387B2 (en) | System and method for conducting product configuration research over a computer-based network | |
| US8805715B1 (en) | Method for improving the performance of messages including internet splash pages | |
| Erdem et al. | Utility-based models of brand equity | |
| Raside et al. | Development of Online Bakery Shop Web Application (e-Bakery) | |
| Teltzrow | A Quantitative Analysis of E-Commerce: Channel Conflicts, Data Mining, and Consumer Privacy | |
| Teltzrow | A quantitative analysis of e-commerce | |
| Chokkannana et al. | A Study on Customer Review on Source Credibility and Review Quality Influence on E-purchase Decision (With Respect to Apparel Products) | |
| KR20010074198A (en) | Real time monitoring service system for internet |
Legal Events
| Date | Code | Title | Description |
|---|---|---|---|
| AS | Assignment |
Owner name: BIZRATE.COM, CALIFORNIA Free format text: ASSIGNMENT OF ASSIGNORS INTEREST;ASSIGNOR:REBANE, GEORGE J.;REEL/FRAME:010688/0909 Effective date: 20000329 |
|
| STCF | Information on status: patent grant |
Free format text: PATENTED CASE |
|
| AS | Assignment |
Owner name: SHOPZILLA, INC., CALIFORNIA Free format text: CHANGE OF NAME;ASSIGNOR:BIZRATE.COM;REEL/FRAME:022092/0125 Effective date: 20041115 Owner name: SHOPZILLA, INC.,CALIFORNIA Free format text: CHANGE OF NAME;ASSIGNOR:BIZRATE.COM;REEL/FRAME:022092/0125 Effective date: 20041115 |
|
| FPAY | Fee payment |
Year of fee payment: 4 |
|
| AS | Assignment |
Owner name: OBSIDIAN AGENCY SERVICES, INC., AS COLLATERAL AGEN Free format text: PATENT SECURITY AGREEMENT;ASSIGNORS:SHOPZILLA, INC.;SHOP HOLDING CORPORATION;REEL/FRAME:026377/0180 Effective date: 20110601 Owner name: WELLS FARGO CAPITAL FINANCE, LLC, AS AGENT, CALIFO Free format text: PATENT SECURITY AGREEMENT;ASSIGNORS:SHOP HOLDING CORPORATION;SHOPZILLA, INC.;REEL/FRAME:026376/0981 Effective date: 20110601 |
|
| FPAY | Fee payment |
Year of fee payment: 8 |
|
| AS | Assignment |
Owner name: LBC CREDIT PARTNERS III, L.P., AS AGENT, PENNSYLVA Free format text: SECURITY INTEREST;ASSIGNORS:CONNEXITY, INC.;BECOME, INC.;REEL/FRAME:034958/0942 Effective date: 20150213 |
|
| AS | Assignment |
Owner name: CONNEXITY, INC., F/K/A SHOPZILLA, INC., CALIFORNIA Free format text: RELEASE BY SECURED PARTY;ASSIGNOR:WELLS FARGO CAPITAL FINANCE, LLC, AS AGENT;REEL/FRAME:034967/0454 Effective date: 20150213 Owner name: SHOP HOLDING CORPORATION, CALIFORNIA Free format text: RELEASE BY SECURED PARTY;ASSIGNOR:WELLS FARGO CAPITAL FINANCE, LLC, AS AGENT;REEL/FRAME:034967/0454 Effective date: 20150213 Owner name: ZAPPLI, INC., CALIFORNIA Free format text: RELEASE BY SECURED PARTY;ASSIGNOR:WELLS FARGO CAPITAL FINANCE, LLC, AS AGENT;REEL/FRAME:034967/0454 Effective date: 20150213 Owner name: CONNEXITY, INC., CALIFORNIA Free format text: RELEASE BY SECURED PARTY;ASSIGNOR:WELLS FARGO CAPITAL FINANCE, LLC, AS AGENT;REEL/FRAME:034967/0454 Effective date: 20150213 |
|
| AS | Assignment |
Owner name: CONNEXITY, INC., CALIFORNIA Free format text: RELEASE BY SECURED PARTY;ASSIGNOR:OBSIDIAN AGENCY SERVICES, INC., AS COLLATERAL AGENT;REEL/FRAME:034973/0361 Effective date: 20150213 Owner name: CONNEXITY, INC., F/K/A SHOPZILLA, INC., CALIFORNIA Free format text: RELEASE BY SECURED PARTY;ASSIGNOR:OBSIDIAN AGENCY SERVICES, INC., AS COLLATERAL AGENT;REEL/FRAME:034973/0361 Effective date: 20150213 Owner name: SHOP HOLDING CORPORATION, CALIFORNIA Free format text: RELEASE BY SECURED PARTY;ASSIGNOR:OBSIDIAN AGENCY SERVICES, INC., AS COLLATERAL AGENT;REEL/FRAME:034973/0361 Effective date: 20150213 Owner name: ZAPPLI, INC., CALIFORNIA Free format text: RELEASE BY SECURED PARTY;ASSIGNOR:OBSIDIAN AGENCY SERVICES, INC., AS COLLATERAL AGENT;REEL/FRAME:034973/0361 Effective date: 20150213 |
|
| AS | Assignment |
Owner name: CONNEXITY, INC., CALIFORNIA Free format text: CHANGE OF NAME;ASSIGNOR:SHOPZILLA, INC.;REEL/FRAME:035112/0599 Effective date: 20140909 Owner name: BANK OF AMERICA, N.A., CALIFORNIA Free format text: SECURITY INTEREST;ASSIGNORS:CONNEXITY, INC.;BECOME, INC.;REEL/FRAME:035047/0271 Effective date: 20140909 Owner name: SHOPZILLA, INC., CALIFORNIA Free format text: MERGER;ASSIGNORS:SHOPZILLA, INC.;CONNEXITY, INC.;REEL/FRAME:035047/0109 Effective date: 20140909 |
|
| AS | Assignment |
Owner name: CONNEXITY, INC., CALIFORNIA Free format text: CHANGE OF NAME;ASSIGNOR:SHOPZILLA, INC.;REEL/FRAME:035414/0849 Effective date: 20140909 |
|
| AS | Assignment |
Owner name: CONNEXITY, LLC, CALIFORNIA Free format text: CONVERSION;ASSIGNOR:CONNEXITY, INC.;REEL/FRAME:039901/0071 Effective date: 20160901 Owner name: BIZINSIGHTS HOLDING CORPORATION, CALIFORNIA Free format text: INTELLECTUAL PROPERTY ASSIGNMENT AGREEMENT;ASSIGNOR:CONNEXITY, LLC;REEL/FRAME:039901/0173 Effective date: 20160901 |
|
| AS | Assignment |
Owner name: BIZINSIGHTS HOLDING CORPORATION, NEW YORK Free format text: ASSIGNMENT OF ASSIGNORS INTEREST;ASSIGNOR:CONNEXITY, LLC;REEL/FRAME:039877/0219 Effective date: 20160901 Owner name: CONNEXITY, LLC, CALIFORNIA Free format text: ENTITY CONVERSION;ASSIGNOR:CONNEXITY, INC.;REEL/FRAME:040100/0085 Effective date: 20160901 Owner name: BIZRATE INSIGHTS INC., NEW YORK Free format text: CHANGE OF NAME;ASSIGNOR:BIZINSIGHTS HOLDING CORPORATION;REEL/FRAME:040181/0271 Effective date: 20160906 |
|
| AS | Assignment |
Owner name: BECOME, INC., CALIFORNIA Free format text: RELEASE BY SECURED PARTY;ASSIGNOR:LBC CREDIT PARTNERS III, L.P.;REEL/FRAME:039935/0233 Effective date: 20160906 Owner name: CONNEXITY, INC., CALIFORNIA Free format text: RELEASE BY SECURED PARTY;ASSIGNOR:LBC CREDIT PARTNERS III, L.P.;REEL/FRAME:039934/0886 Effective date: 20160906 Owner name: BECOME, INC., CALIFORNIA Free format text: RELEASE BY SECURED PARTY;ASSIGNOR:LBC CREDIT PARTNERS III, L.P.;REEL/FRAME:039934/0886 Effective date: 20160906 Owner name: CONNEXITY, INC., CALIFORNIA Free format text: RELEASE BY SECURED PARTY;ASSIGNOR:LBC CREDIT PARTNERS III, L.P.;REEL/FRAME:039935/0233 Effective date: 20160906 Owner name: CONNEXITY, INC. (AS SUCCESSOR-IN-INTEREST TO SHOPZ Free format text: RELEASE OF SECURITY INTEREST IN SPECIFIED PATENTS;ASSIGNOR:BANK OF AMERICA, N.A.;REEL/FRAME:040223/0797 Effective date: 20160906 |
|
| AS | Assignment |
Owner name: CITIBANK, N.A., AS COLLATERAL AGENT, DELAWARE Free format text: SECURITY INTEREST;ASSIGNOR:BIZRATE INSIGHTS INC.;REEL/FRAME:039965/0059 Effective date: 20161005 |
|
| MAFP | Maintenance fee payment |
Free format text: PAYMENT OF MAINTENANCE FEE, 12TH YEAR, LARGE ENTITY (ORIGINAL EVENT CODE: M1553) Year of fee payment: 12 |
|
| AS | Assignment |
Owner name: BIZRATE INSIGHTS INC., NEW YORK Free format text: RELEASE BY SECURED PARTY;ASSIGNOR:CITIBANK, N.A.;REEL/FRAME:044790/0223 Effective date: 20180131 Owner name: ROYAL BANK OF CANADA, ONTARIO Free format text: SECURITY INTEREST;ASSIGNORS:MEREDITH CORPORATION;ALLRECIPES.COM, INC.;EATING WELL, INC.;AND OTHERS;REEL/FRAME:044792/0967 Effective date: 20180131 |
|
| AS | Assignment |
Owner name: BECOME, INC., CALIFORNIA Free format text: TERMINATION AND RELEASE OF TRADEMARK SECURITY AGREEMENT;ASSIGNOR:BANK OF AMERICA, N.A.;REEL/FRAME:057406/0330 Effective date: 20210901 Owner name: CONNEXITY, INC., CALIFORNIA Free format text: TERMINATION AND RELEASE OF TRADEMARK SECURITY AGREEMENT;ASSIGNOR:BANK OF AMERICA, N.A.;REEL/FRAME:057406/0330 Effective date: 20210901 |