US6850656B1 - Method and apparatus for measuring locally and superficially the scattering and absorption properties of turbid media - Google Patents
Method and apparatus for measuring locally and superficially the scattering and absorption properties of turbid media Download PDFInfo
- Publication number
- US6850656B1 US6850656B1 US09/806,831 US80683101A US6850656B1 US 6850656 B1 US6850656 B1 US 6850656B1 US 80683101 A US80683101 A US 80683101A US 6850656 B1 US6850656 B1 US 6850656B1
- Authority
- US
- United States
- Prior art keywords
- optical
- source
- detector
- turbid medium
- reflectance
- Prior art date
- Legal status (The legal status is an assumption and is not a legal conclusion. Google has not performed a legal analysis and makes no representation as to the accuracy of the status listed.)
- Expired - Fee Related
Links
Images


Classifications
-
- G—PHYSICS
- G01—MEASURING; TESTING
- G01N—INVESTIGATING OR ANALYSING MATERIALS BY DETERMINING THEIR CHEMICAL OR PHYSICAL PROPERTIES
- G01N21/00—Investigating or analysing materials by the use of optical means, i.e. using sub-millimetre waves, infrared, visible or ultraviolet light
- G01N21/17—Systems in which incident light is modified in accordance with the properties of the material investigated
- G01N21/47—Scattering, i.e. diffuse reflection
- G01N21/49—Scattering, i.e. diffuse reflection within a body or fluid
Definitions
- the present invention relates to a method and an apparatus to quantify the optical scattering and absorption properties of turbid media, that can be applied in the extended optical domain of electromagnetic waves from far infrared (up to the microwave domain) to the far UV domain, i.e. where the energies of the photons composing the electromagnetic waves range from a few milli-electron-Volt to more than ten electron-Volt. More precisely the present invention relates to a non-invasive measurement, over a small area of the sample surface. Local and superficial characterization of biological tissues in vivo is a major application of this invention.
- steady-state continuous source
- time-domain short pulsed source
- frequency domain amplitude modulated source
- the range of ⁇ values is an important point to consider, when comparing different methods based on the measurement of the reflectance.
- the probed volume of the turbid medium is related to the source-detector separation ⁇ .
- different mathematical processing must be used to obtain the optical properties from the raw data.
- At least two cases must be distinguished.
- the first case corresponds to source-detector separations larger than several transport mean free paths.
- this case corresponds to a source-detector separation larger than 2 mm.
- An analytical form of the reflectance can be obtained from the diffusion equation, if the absorption coefficient ⁇ a is sufficiently lower than the scattering coefficient ⁇ s (typically ten times).
- the relevant optical properties are the refractive index, the absorption coefficient and the reduced scattering coefficient.
- the average depth of probing is on the same order as the source-detector separation ⁇ .
- the second case corresponds to source-detector separations close to one transport mean free path.
- source-detector separations correspond typically to distances from 0.1 to 2 mm.
- the average depth probed is on the order of 1 mm.
- Such small source-detector separations enable the measurement of the optical properties of a small tissue volume.
- the present invention we present a method and apparatus for the measurement of the absorption coefficient, the reduced scattering coefficient and the said phase function parameter ⁇ , from the spatially-resolved reflectance data at short source detector separation.
- These three parameters which can be measured at different wavelengths, enable us to characterize turbid media, such as biological tissues.
- Our method is based on a theoretical study of the reflectance at short source-detector separations, that we performed with Monte Carlo simulations.
- FIG. 1 Description of the principle of spatially-resolved reflectance measurement.
- ⁇ denotes the source ⁇ detector distance
- ⁇ source and ⁇ detector are the solid angles of light acceptance determined by the Numerical Apertures (N.A.) of the optical fibers.
- FIG. 2 Probability density function of the mean depth of scattering events per detected photons.
- FIG. 4 Monte Carlo simulations and fits of the spatially resolved reflectance curves by mathematical expression in the form R( ⁇ ) ⁇ [A( ⁇ , ⁇ ′ s , ⁇ )+ ⁇ ′ s B( ⁇ a )] 2 .
- FIG. 5. a Basic description of the apparatus: Case of measurements with an optical fiber probe.
- the apparatus comprises a probe connected to a light source unit and a detection unit, both units being connected to a computer or signal processing unit.
- the optical fiber probe is constituted of one or more illuminating fibers, and one or more collecting fibers.
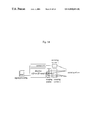
- FIG. 5. b Basic description of the apparatus: Particular embodiment where the probe is composed of n detecting fibers (typically 6) in parallel. A broadband or white light source is used for excitation and the retro-diffused light is collected by the n detecting fibers in parallel and dispersed in parallel in a spectrograph, before being detected on a 2D CCD camera and transmitted numerically to a PC for ⁇ , ⁇ s ′, ⁇ a determination at each wavelength ⁇ .
- n detecting fibers typically 6
- a broadband or white light source is used for excitation and the retro-diffused light is collected by the n detecting fibers in parallel and dispersed in parallel in a spectrograph, before being detected on a 2D CCD camera and transmitted numerically to a PC for ⁇ , ⁇ s ′, ⁇ a determination at each wavelength ⁇ .
- FIG. 5. c Basic description of the apparatus. Case of a measurement with sources and detectors directly in contact with the turbid medium.
- FIG. 5. d Basic description of the apparatus. Case of non-contact measurements with a 1D or 2D detector, coupled with an imaging device. Scanning systems 1 and 2 are optional, they may be distinct from one another or confounded in a single scanner.
- FIG. 5. e Basic description of the apparatus. Case of non-contact measurements with source and detection beams deflected by one or two scanning devices which may be distinct from one another or confounded.
- FIG. 6 Examples of the sample side of the fiber optical probe.
- Additional fibers F can be put in the center of the probe or around the probe for other light channels: collecting fibers for fluorescence or Raman scattering for example.
- FIG. 7 Example of a measurement of the spatially-resolved reflectance with the probe shown in FIG. 6. a .
- the measurement, performed on a microsphere suspension, is superimposed to a Monte Carlo simulation.
- the calibration was performed with a siloxane sample of known optical properties.
- ⁇ lnR( ⁇ 1 mm)
- FIG. 1 The concept of spatially resolved reflectance is illustrated in FIG. 1 .
- a collimated light beam impinging on a turbid medium through air or through a light guide, or even generated locally
- N.A. the Numerical Aperture of the illuminating fiber
- the spatially resolved reflectance R( ⁇ ) is defined by the backscattered light power in a given solid angle ⁇ detector , at a distance ⁇ from the source, per unit area and normalized by the source power.
- the collecting area of the detector or detecting fiber is A detector .
- the distance ⁇ is referred as the source-detector separation (also in the case when light guides or imaging devices are used for the illumination and for the collection of the backscattered light).
- R( ⁇ ) depends on the optical properties of the turbid medium, defined below. Note that R( ⁇ ) depends also on the source and detectors characteristics, i.e. numerical aperture and sizes. In a general situation, R( ⁇ ) is the result of the convolution of the corrected reflectance curve and the source irradiance and detector sensitivity over, respectively, the surfaces A source and A detector . When A source and A detector are smaller than the required spatial resolution, R( ⁇ ) is confounded with the corrected spatially resolved reflectance.
- the fundamental optical properties of a turbid medium is determined by the average index of refraction n of the medium, the absorption coefficient ⁇ a , the scattering coefficient ⁇ s , and the phase function p( ⁇ ) where ⁇ is the scattering angle.
- the absorption coefficient ⁇ a [mm ⁇ 1 ] is defined as the probability of absorption per unit infinitesimal pathlength.
- the scattering coefficient ⁇ s [mm ⁇ 1 ] is the scattering probability per unit infinitesimal pathlength.
- the phase function p( ⁇ ) is the density probability function for the scattering angle ⁇ .
- the phase function p( ⁇ ) is a continuous function of the scattering angle ⁇ and generally depends on the dielectric properties and on the material microstructure.
- ⁇ (1 ⁇ g 2 )/(1 ⁇ g 1 ) (1.7) All the parameters listed above are referred as optical properties. They are wavelength dependent, and can vary in space and time. In the following, ⁇ , g 1 and g 2 will be considered as parameters characterizing the turbid medium. 2. Reflectance Measurements at Distances Close to One Transport Mean Free Path
- the present invention can be complemented by large source-detector separation measurements, if the optical properties of both superficial and deep parts of a turbid medium must be determined.
- the spatially resolved reflectance R( ⁇ ), with short source-detector separations is more complex than in the case of large source-detector separations. Indeed, for small source detector-separation conditions, the inverse problem, i.e. calculating the localized absorption and reduced scattering coefficients, is sensitive to the scattering phase function. It is part of the present invention to have shown, from Monte Carlo simulations, that only the first and second moments of the phase function can be taken into account. Moreover, it was established that the influence of these two moments are not independent.
- Different reflectance curves, obtained from Monte Carlo simulations are shown in FIG. 3 .
- the parameter ⁇ depends on the characteristics of the set of scatterers inside the turbid medium: shape, distribution of sizes and refractive index.
- ⁇ is an important part of this invention, and has never been reported earlier.
- the determination of ⁇ can be related to the microscopic structure of the sample, since ⁇ is related to the sizes and refractive indexes of the scatterers.
- the average refractive indices n and the source and detectors characteristics are fixed and known. In such case, only three parameters are determined from measurements at short source-detector separation: ⁇ a , ⁇ s ′ and ⁇ .
- the parameter ⁇ cannot be estimated if large source detector separations are used. Indeed, the reflectance is only sensitive to ⁇ at short source-detector separation.
- Equ. (1.8) it is important for the description of the invention to evidence the fact that the function A depends on ⁇ , the scattering properties (i.e. ⁇ s ′ and ⁇ ) but not on ⁇ a .
- the function B depends on ⁇ a and ⁇ s ′ but neither on ⁇ nor ⁇ .
- Equ. (1.9) is shown in FIG. 4 .
- the apparatus can be divided in three parts, described in FIG. 5 a.
- the first part is the illuminating system.
- Any light source can be used.
- white sources such as halogen or xenon lights, metal halides or fluorescent or phosphorescent sources
- sources such as lasers, laser diodes, optical fiber lasers, light emitting diodes or superluminescent diodes
- the light power is conducted to the investigated sample by the probe, which is the second part of the apparatus.
- the probe is preferably made of optical fibers, to illuminate and to collect the backscattered light. But GRIN rods or other types of light pipes can also be used. Different possible arrangements of optical fibers are illustrated in FIG. 6 . Two different modes of measurements can be chosen. First, one fiber is used to illuminate the sample and at least two other fibers are used to collect the backscattered light at two different distances. Second, one fiber is used to collect the light and at least two other fibers, located at two different distances from the first one, are used to illuminate sequentially the sample.
- the arrangement of the different fibers can be replaced by any imaging system or image guide, such as multicore optical fibers, or optical fiber bundle.
- the light collected by the probe is analyzed by the detection unit, which is the third part of the apparatus.
- a spectrograph can be put between the probe and the detector to get wavelength dependence of the backscattered signal (either in the source or detection unit).
- Any type of detector can be used.
- photodiodes, avalanche photodiodes or photomultipliers can be assigned to each collecting fiber. Simultaneous detection of each collecting fiber can also be achieved using linear or two-dimensional detectors such as Charge-Coupled Detectors (1D or 2D), intensified CCD or array of photodiodes.
- the probe is composed of n detecting fibers (typically 6).
- a broadband or white light source is used for excitation and the retro-diffused light is collected by the n detecting fibers and dispersed in parallel in a spectrograph, before being detected by a 2D CCD camera and transmitted numerically to a PC for ⁇ , ⁇ s ′, ⁇ a determination at each wavelength ⁇ .
- This particular embodiment has the advantage of yielding the wavelength dependence of ⁇ , ⁇ s ′, ⁇ a from a single measurement.
- FIG. 5 c A second type of embodiment is presented in FIG. 5 c .
- the difference with embodiments presented in FIG. 5 a and FIG. 5 b is that optionally no optical fibers, light pipes or grin rods are used.
- the light source unit is directly in contact with the turbid medium, as well as the detector unit.
- Collimating optics, micro-optics or imaging optics DOE Diffractive Optical Elements for example
- the different type of sources and detectors cited in example for the first embodiment can be used for the second type of embodiments.
- Hybrid design, such as arrangements involving both direct contact sensors or detectors and fibers, light pipes or grin rods are also included in the present embodiment.
- the third embodiment is described in FIG. 5 d and FIG. 5 e .
- the only difference with the first and second embodiment is that non-contact measurements are performed.
- a collimating system allows for a point-like illumination on the turbid medium.
- An imaging system enables the measurement of the spatial distribution of the reflectance.
- the detectors can be either an array (1D or 2D) of detectors ( FIG. 5 d ) with optional scanning 1 and 2 which can operate separately or can be confounded in a single scanner, or a single detector ( FIG. 5 e ).
- an scanning device is used to obtain the spatially-resolved reflectance.
- a fiber bundle, multicore fiber or relay optics can be put between the focal point of the imaging system and the detector(s).
- the different type of sources and detectors cited in example for the first embodiment can be used for the third embodiment.
- Spatial images of the parameters ⁇ a , ⁇ s ′ and ⁇ can be obtained by a series of measurements at different locations, that we call multi-site measurements. Some mechanical or optical scanning device can be used for this purpose. The resolution of such images is on the order of the mean source-detector separation used for a single site measurement. All three embodiments can be expanded to perform multi-site measurements, by duplicating and/or multiplexing the illuminating or measuring devices. For example, the optical fiber probes shown in FIG. 6 , can be duplicated and put side by side. The scanning system described in the third embodiment can also be expanded to perform multi-site measurements.
- the differences of transmission between each fiber are corrected by performing a measurement on a turbid phantom illuminated uniformly.
- the background light measured with the light source turned off, must be subtracted from the signal.
- a calibration is performed on a turbid medium of known optical properties.
- a turbid medium of known optical properties examples include: 1) solid or liquid turbid medium which properties have been measured by other techniques, or reported in the literature, 2) water suspension of microsphere of known size distribution and refractive index.
- Absorbing dye may be added to the suspension.
- the scattering properties are calculated from Mie theory, and the absorption coefficient is assumed to be equal to the water absorption coefficient, if no absorbing dye is added. If an absorbing dye is used, the absorption coefficient can be measured by a spectrophotometer, before mixing the solution with any scattering materials.
- a Monte Carlo simulation is performed with the optical properties of the calibration sample. The simulation is then divided by the experimental reflectance performed on the calibration sample. The result, that must be independent of the source-detector separation, is defined as the calibration factor. Each new measurement is multiplied by the calibration factor.
- FIG. 7 An example of a measurement, after calibration, is shown in FIG. 7 .
- the measurement was performed with the apparatus described in the first embodiment, with a probe similar to the one described in FIG. 6 a .
- a prior calibration was performed on a solid turbid medium, which optical properties were measured by another technique (frequency domain measurement, cf. Welch, A. J.; van Gemert, M. J. C., Optical Thermal Response of Laser Irradiated Tissue; Plenum Publishing Corp., New York, 1995, and references therein).
- the sample was a water suspension of polystyrene microsphere of 1 ⁇ m diameter.
- the measurement is compared to a Monte Carlo simulation performed with the scattering properties calculated from Mie theory and absorption coefficient of water.
- FIG. 7 shows an excellent agreement between the measurement and the simulation, which confirm the validity of our simulation model, experimental measurement and calibration.
- Artifacts during a measurement can be detected by the following optional procedure.
- Two illuminating fibers are disposed symmetrically in regard to the collecting fibers (see FIG. 6 b ). If the sample is homogeneous, the reflectance curve should be identical with either illuminating fiber. Therefore, heterogeneity of the investigated region or obstructions beneath the fibers are detected by comparing the two curves. If the two curves are sufficiently close, the measurement is validated and the average of the two curves is calculated.
- the so-called “direct problem” consists in computing the spatially resolved reflectance R( ⁇ ) from the values of the optical coefficients n, ⁇ a , ⁇ s ′, ⁇ involved in a model of propagation of the light in turbid medium and whereby the said “model” incorporates a Legendre polynomial development to the second order of the said “phase function”, and whereby the said “phase parameter” ⁇ is introduced in the computation as an independent parameter.
- the so-called “inverse problem” consists in extracting the optical coefficients n, ⁇ a , ⁇ s ′, ⁇ from the spatially resolved reflectance data R( ⁇ ).
- ⁇ lnR( ⁇ 1 mm)
- the determination of ⁇ s ′ is only weakly influenced by ⁇ . Indeed in FIG. 8 . the errors induced by error in ⁇ are typically 10% for ⁇ s ′ around 1 mm ⁇ 1 . Second, although absolute determination of ⁇ a is not possible when ⁇ is not precisely known, relative absorption changes can be still evaluated. Third, the indetermination of the parameter ⁇ may be resoled by the values of R( ⁇ ) and/or
- This method described by the iteration of points 1) to 3) corresponds to finding a simulation that fit closely a measured curve R( ⁇ ). This can also be achieved by directly comparing the measured curve R( ⁇ ), with a set of simulations, and finding the simulation that minimize the square of the differences between the measured and simulated curves.
- ⁇ and ⁇ s ′ can be derived from the parameter ⁇ ⁇ ⁇ ⁇ R ⁇ ( ⁇ 1 , ⁇ s , ⁇ c , ⁇ ) , calculated from the experimental reflectance R( ⁇ ) (see section 5.2). Simultaneous determination of ⁇ and ⁇ s ′ require values of ⁇ ⁇ ⁇ ⁇ R ⁇ ( ⁇ , ⁇ s , ⁇ c , ⁇ ) at different distances ⁇ (at least two).
- the determination of the other one can be obtained from the value of ⁇ ⁇ ⁇ ⁇ R ⁇ ( ⁇ , ⁇ s , ⁇ c , ⁇ ) at a single distance.
- ⁇ a is calculated from the absolute value of R( ⁇ ), which highly depends on ⁇ a .
- R( ⁇ ) the dependence of reflectance on ⁇ a is obtained by Monte Carlo results.
- ⁇ a h[ ⁇ square root over (R( ⁇ , ⁇ ′ s , ⁇ a , ⁇ )) ⁇ ( ⁇ , ⁇ s ′)] (1.14) where and are functions given by Monte Carlo simulation. Particularly, they can be well approximated by polynomial functions.
Abstract
Description
-
- 1. See “Welch, A. J.; van Gemert, M. J. C. Optical Thermal Response of Laser Irradiated Tissue; Plenum publishing Corp., New York, 1995”, and references therein.
- 2. W. -F. Cheong, S. A. Prahl, and A. J. Welch, “A Review of the Optical Properties of Biological Tissues,” IEEE J. Quantum Electron. 26, 2166-2185 (1990).
for different γ values (1.0, 1.8, 2.5), different reduced albedo a′ (1, 0.95, 0.9) and for fixed ρ=1 mm. Mismatched refractive index n=1.4.
1=2π∫0 π p(θ) sin θdθ (1.1)
In turbid media and in biological tissues in particular, the phase function p(θ) is a continuous function of the scattering angle θ and generally depends on the dielectric properties and on the material microstructure. It can be approximated by a development in Legendre polynomials:
Where gn is the nth order moment of the phase function and Pn(θ) is the Legendre polynomial of order n:
g n=2π∫0 π P n(θ)p(θ) sin θdθ (1.3)
The first moment of the phase function is also called the anisotropy factor, and is often simply noted g (=g1). It represents the mean cosine of the scattering angle. The reduced scattering coefficient μs′ is defined as:
μs′=μs(1−g 1) (1.4)
The transport mean free path (or reduced mean free path) mfp′ of the photons, in a turbid medium, is defined as:
mfp′=(μs′+μa)−1 (1.5)
The reduced albedo a′ is the ratio:
a′=μ s′/(μs′+μa) (1.6)
As a result of the present invention described in more details in the next section, it is also necessary to define another phase function parameter called γ.
γ=(1−g 2)/(1−g 1) (1.7)
All the parameters listed above are referred as optical properties. They are wavelength dependent, and can vary in space and time. In the following, γ, g1 and g2 will be considered as parameters characterizing the turbid medium.
2. Reflectance Measurements at Distances Close to One Transport Mean Free Path
R(ρ)≅[A(ρ, μ′s, γ)+B(μa, μ′s)]2 (1.8)
In many cases, we found that Equ. (1.8) can also be written as:
R(ρ)≈[A(ρ, μ′s, γ)+μ′s B(μa)]2 (1.9)
it is important for the description of the invention to evidence the fact that the function A depends on ρ, the scattering properties (i.e. μs′ and γ) but not on μa. In contrast, the function B depends on μa and μs′ but neither on γ nor ρ. An example of Equ. (1.9) is shown in FIG. 4.
is also derived from this fit, using the following formula:
The slope of the square root of R(ρ) can also be derived (the use of these slopes are described below in section 5.3):
5.3. Inverse Problem
-
- (1) determination of μs′ and μa from R(ρ=1 mm) and |∂ρlnR(ρ=1 mm)| for a set of values γ. For example: γ=1.0, 1.1, 1.2, . . . , 2.5.
- (2) simulations with the different sets of μs′ and μa obtained from point 1).
- (3) comparison between the simulations and the reflectance profile for distances 0.3<ρ<2 mm.
This last step allows us to determine the correct values of γ, μs′ and μa.Points 1 to 3 can be done iteratively to evaluate γ more precisely, using a finer discrimination of γ values.
This property is confirmed in
evaluated at ρ=1 mm, is plotted as a function of μs′ for γ=1, 1.9 and 2.5 and reduced albedo a′=1, 0.95 and 0.9 (note that any other choice of ρ is possible, as long as ρ is of the order of 1 mfp′).
clearly depends on μs′ and γ. In contrast, the dependence on a′ is almost negligible.
calculated from the experimental reflectance R(ρ) (see section 5.2). Simultaneous determination of γ and μs′ require values of
at different distances ρ (at least two). If one of the parameters γ or μs′ is already known, the determination of the other one can be obtained from the value of
at a single distance.
can be obtained by fitting Monte Carlo results to polynomial functions. For example, in the case of fixed γ=1.9, we obtained:
μs′=0.9162−52.89x+1795x 2−18155x 3+65428x 4 (1.13)
where
at ρ=1 mm, x is expressed in [mm−2] and μs′ is expressed in [mm−1].
μa =h[√{square root over (R(ρ, μ′ s , μ a , γ))}−ƒ(γ, μ s′)] (1.14)
where and are functions given by Monte Carlo simulation. Particularly, they can be well approximated by polynomial functions. For example, for γ=1.9, probe refractive index of 1.5, sample refractive index of 1.4, optical fibers of diameter 200 μm, NA=0.37 (source and collection):
h=−0.002257−8.171y+268.8y 2 (1.15)
ƒ=0.01311+0.05184 μs′−0.01974 μs′2+0.003217 μs′3−0.0001992 μs′4 (1.16)
where y=[√{square root over (R(ρ, μ′s, μa, γ))}−ƒ] [mm−1], μa is expressed in [mm−1].
√{square root over (R(ρ, μ′s, μa0, γ))}−√{square root over (R(ρ, μ′s, μa, γ))}=B(μa0, μ′s)−B(μa, μ′s) (1.17)
This relation is illustrated in FIG. 10. in the case of μa0=0, ρ=1 mm, γ=1.0, 1.9 and 2.5, and for a′=1 to 0.83, confirms that the influence of γ is weak in the quantity √{square root over (Rρ, μ′s, μa0, γ))}−√{square root over (R(ρ, μ′s, μa, γ))}. For known μs′, the function B(a′) allows for the determination of a relative absorption change Δμa=μa−μa0. FIG. 10. illustrates the case μa0=0, but any other value of μa0 is possible. The interesting point is that B(a′) does not depend on the phase function.
Claims (21)
m1ρm
R(ρ)=m 1ρm
R(ρ)=m 1ρm
R(ρ)=(A(ρ, γ, μs′)+B(μa, μs′))2
μa =h[√{square root over (R(ρ, μ′ s , μ a , γ))}−ƒ(γ, μ′ s)]
Priority Applications (1)
| Application Number | Priority Date | Filing Date | Title |
|---|---|---|---|
| US09/806,831 US6850656B1 (en) | 1998-10-07 | 1999-10-07 | Method and apparatus for measuring locally and superficially the scattering and absorption properties of turbid media |
Applications Claiming Priority (3)
| Application Number | Priority Date | Filing Date | Title |
|---|---|---|---|
| US10355998P | 1998-10-07 | 1998-10-07 | |
| PCT/CH1999/000476 WO2000020843A1 (en) | 1998-10-07 | 1999-10-07 | Method and apparatus for measuring locally and superficially the scattering and absorption properties of turbid media |
| US09/806,831 US6850656B1 (en) | 1998-10-07 | 1999-10-07 | Method and apparatus for measuring locally and superficially the scattering and absorption properties of turbid media |
Publications (1)
| Publication Number | Publication Date |
|---|---|
| US6850656B1 true US6850656B1 (en) | 2005-02-01 |
Family
ID=34082565
Family Applications (1)
| Application Number | Title | Priority Date | Filing Date |
|---|---|---|---|
| US09/806,831 Expired - Fee Related US6850656B1 (en) | 1998-10-07 | 1999-10-07 | Method and apparatus for measuring locally and superficially the scattering and absorption properties of turbid media |
Country Status (1)
| Country | Link |
|---|---|
| US (1) | US6850656B1 (en) |
Cited By (24)
| Publication number | Priority date | Publication date | Assignee | Title |
|---|---|---|---|---|
| US20030023172A1 (en) * | 2001-07-27 | 2003-01-30 | Tromberg Bruce J. | Broadband absorption spectroscopy in turbid media by combined frequency-domain and steady state methodologies |
| US20070013911A1 (en) * | 2003-11-10 | 2007-01-18 | Baker Hughes Incorporated | Light source for a downhole spectrometer |
| US20070019199A1 (en) * | 2005-07-25 | 2007-01-25 | The Wisconsin Alumni Research Foundation | Methods, systems, and computer program products for optimization of probes for spectroscopic measurement in turbid media |
| WO2007060583A2 (en) * | 2005-11-28 | 2007-05-31 | Koninklijke Philips Electronics N.V. | Method and apparatus for determining concentrations of analytes in a turbid medium |
| US20070232932A1 (en) * | 2006-03-17 | 2007-10-04 | Duke University | Monte Carlo based model of fluorescence in turbid media and methods and systems for using same to determine intrinsic fluorescence of turbid media |
| FR2899972A1 (en) * | 2006-04-14 | 2007-10-19 | Centre Nat Machinisme Agricole | SPATIALLY RESOLVED SPECTROSCOPY BIOLOGICAL SAMPLE ANALYSIS DEVICE AND METHOD |
| EP1931969A1 (en) * | 2005-09-16 | 2008-06-18 | The Regents of the University of Michigan | Method and system for measuring sub-surface composition of a sample |
| US20080270091A1 (en) * | 2007-02-23 | 2008-10-30 | Nirmala Ramanujam | Scaling method for fast monte carlo simulation of diffuse reflectance spectra from multi-layered turbid media and methods and systems for using same to determine optical properties of multi-layered turbid medium from measured diffuse reflectance |
| US20090015826A1 (en) * | 2006-03-30 | 2009-01-15 | Duke University | Optical assay system for intraoperative assessment of tumor margins |
| WO2009037644A3 (en) * | 2007-09-20 | 2009-06-25 | Koninkl Philips Electronics Nv | Method and apparatus for estimating the content of an analyte in a multi-layer medium |
| US20100042005A1 (en) * | 2007-03-28 | 2010-02-18 | Trustees Of Boston University | Detecting optical properties of a turbid medium |
| US20100302537A1 (en) * | 2009-05-28 | 2010-12-02 | Indatech | Spectroscopy device and method for its implementation |
| US20110059016A1 (en) * | 2007-09-27 | 2011-03-10 | Nirmala Ramanujam | Optical assay system with a multi-probe imaging array |
| US20110105865A1 (en) * | 2008-04-24 | 2011-05-05 | Duke University | Diffuse reflectance spectroscopy device for quantifying tissue absorption and scattering |
| US20110112435A1 (en) * | 2007-09-28 | 2011-05-12 | Nirmala Ramanujam | Systems and methods for spectral analysis of a tissue mass using an instrument, an optical probe, and a monte carlo or a diffusion algorithm |
| DE112010002174T5 (en) | 2009-05-29 | 2012-10-04 | Cognex Technology And Investment Corp. | METHOD AND DEVICE FOR A PRACTICAL 3D SEEDING SYSTEM |
| CN103356170A (en) * | 2013-05-24 | 2013-10-23 | 天津大学 | Quick Monte Carlo imaging method for reconstructing optical parameter of tissue with heteroplasmon |
| US20140107951A1 (en) * | 2011-03-24 | 2014-04-17 | Erasmus University Medical Center Rotterdam | Method to determine the absorption coefficient in turbid media |
| CN103841875A (en) * | 2012-02-10 | 2014-06-04 | 奥林巴斯医疗株式会社 | Bio-optical measurement device and measurement probe |
| US9091637B2 (en) | 2009-12-04 | 2015-07-28 | Duke University | Smart fiber optic sensors systems and methods for quantitative optical spectroscopy |
| US20170357061A1 (en) * | 2016-06-13 | 2017-12-14 | Kabushiki Kaisha Toshiba | Photon detection device and a method of manufacturing a photon detection device |
| US20180011015A1 (en) * | 2014-11-13 | 2018-01-11 | Ricoh Company, Ltd. | Optical sensor, optical testing apparatus, and optical characteristics detection method |
| US11169314B2 (en) * | 2015-03-16 | 2021-11-09 | Digilens Inc. | Waveguide device incorporating a light pipe |
| WO2022170168A1 (en) * | 2021-02-08 | 2022-08-11 | Trustees Of Tufts College | Method and apparatus for spectrophotometry of turbid media |
Citations (8)
| Publication number | Priority date | Publication date | Assignee | Title |
|---|---|---|---|---|
| US5284137A (en) | 1988-07-26 | 1994-02-08 | Manfred Kessler | Process and device for the determination of local dye concentrations and of scattering parameters in animal and human tissues |
| US5353790A (en) * | 1992-01-17 | 1994-10-11 | Board Of Regents, The University Of Texas System | Method and apparatus for optical measurement of bilirubin in tissue |
| US5441054A (en) * | 1992-07-20 | 1995-08-15 | Hamamatsu Photonics K.K. | Apparatus for measuring absorption information in scattering medium and method therefor |
| US5452723A (en) * | 1992-07-24 | 1995-09-26 | Massachusetts Institute Of Technology | Calibrated spectrographic imaging |
| US5517987A (en) * | 1993-06-02 | 1996-05-21 | Hamamatsu Photonics K.K. | Method for measuring internal information in scattering medium and apparatus for the same |
| US5630423A (en) | 1996-01-31 | 1997-05-20 | Wang; Lihong | Method of measuring tissue optical properties using an optical beam of oblique incidence and uses thereof |
| US5645061A (en) | 1988-07-26 | 1997-07-08 | Kessler; Manfred | Process and device for the determination of local dye concentration and of scattering parameters in animal and human tissues |
| US5676142A (en) | 1994-11-07 | 1997-10-14 | Hamamatsu Photonics K.K. | Method and apparatus for measuring scattering property and absorption property in scattering medium |
-
1999
- 1999-10-07 US US09/806,831 patent/US6850656B1/en not_active Expired - Fee Related
Patent Citations (8)
| Publication number | Priority date | Publication date | Assignee | Title |
|---|---|---|---|---|
| US5284137A (en) | 1988-07-26 | 1994-02-08 | Manfred Kessler | Process and device for the determination of local dye concentrations and of scattering parameters in animal and human tissues |
| US5645061A (en) | 1988-07-26 | 1997-07-08 | Kessler; Manfred | Process and device for the determination of local dye concentration and of scattering parameters in animal and human tissues |
| US5353790A (en) * | 1992-01-17 | 1994-10-11 | Board Of Regents, The University Of Texas System | Method and apparatus for optical measurement of bilirubin in tissue |
| US5441054A (en) * | 1992-07-20 | 1995-08-15 | Hamamatsu Photonics K.K. | Apparatus for measuring absorption information in scattering medium and method therefor |
| US5452723A (en) * | 1992-07-24 | 1995-09-26 | Massachusetts Institute Of Technology | Calibrated spectrographic imaging |
| US5517987A (en) * | 1993-06-02 | 1996-05-21 | Hamamatsu Photonics K.K. | Method for measuring internal information in scattering medium and apparatus for the same |
| US5676142A (en) | 1994-11-07 | 1997-10-14 | Hamamatsu Photonics K.K. | Method and apparatus for measuring scattering property and absorption property in scattering medium |
| US5630423A (en) | 1996-01-31 | 1997-05-20 | Wang; Lihong | Method of measuring tissue optical properties using an optical beam of oblique incidence and uses thereof |
Non-Patent Citations (3)
| Title |
|---|
| Bevilacqua et al, "In vivo local determination of tissue optical properties", SPIE, European Biomedical Optics, Bios Europe 97, vol. 3194, 1997, pp. 262-268. |
| Marquet et al, "Determination of Reduced Scattering and Absorption Coefficients by a Single Charge-Coupled-Device Array Measurement. Part I: comparison between experiments and simulations", Optical Engineering, vol. 34, No. 7, Jul. 1995, pp. 2055-2063. |
| Wyman et al, "Similarity relations for the interaction parameters in radiation transport", Applied Optics, vol., 28, No. 24, Dec. 15, 1989, pp. 5243-5429. |
Cited By (48)
| Publication number | Priority date | Publication date | Assignee | Title |
|---|---|---|---|---|
| US7428434B2 (en) * | 2001-07-27 | 2008-09-23 | The Regents Of The Univeristy Of California | Quantitative broadband absorption and scattering spectroscopy in turbid media by combined frequency-domain and steady state methodologies |
| US20030023172A1 (en) * | 2001-07-27 | 2003-01-30 | Tromberg Bruce J. | Broadband absorption spectroscopy in turbid media by combined frequency-domain and steady state methodologies |
| US20070013911A1 (en) * | 2003-11-10 | 2007-01-18 | Baker Hughes Incorporated | Light source for a downhole spectrometer |
| US7511819B2 (en) * | 2003-11-10 | 2009-03-31 | Baker Hughes Incorporated | Light source for a downhole spectrometer |
| US20070019199A1 (en) * | 2005-07-25 | 2007-01-25 | The Wisconsin Alumni Research Foundation | Methods, systems, and computer program products for optimization of probes for spectroscopic measurement in turbid media |
| WO2007014188A2 (en) * | 2005-07-25 | 2007-02-01 | Duke University | Methods, systems, and computer program products for optimization of probes for spectroscopic measurement in turbid media |
| US7835786B2 (en) | 2005-07-25 | 2010-11-16 | Wisconsin Alumni Research Foundation | Methods, systems, and computer program products for optimization of probes for spectroscopic measurement in turbid media |
| WO2007014188A3 (en) * | 2005-07-25 | 2009-04-30 | Univ Duke | Methods, systems, and computer program products for optimization of probes for spectroscopic measurement in turbid media |
| EP1931969A1 (en) * | 2005-09-16 | 2008-06-18 | The Regents of the University of Michigan | Method and system for measuring sub-surface composition of a sample |
| US20090219523A1 (en) * | 2005-09-16 | 2009-09-03 | The Regents Of The University Of Michigan | Method and System for Measuring Sub-Surface Composition of a Sample |
| US8054463B2 (en) * | 2005-09-16 | 2011-11-08 | The Regents Of The University Of Michigan | Method and system for measuring sub-surface composition of a sample |
| WO2007060583A3 (en) * | 2005-11-28 | 2007-08-30 | Koninkl Philips Electronics Nv | Method and apparatus for determining concentrations of analytes in a turbid medium |
| WO2007060583A2 (en) * | 2005-11-28 | 2007-05-31 | Koninklijke Philips Electronics N.V. | Method and apparatus for determining concentrations of analytes in a turbid medium |
| US7818154B2 (en) | 2006-03-17 | 2010-10-19 | Duke University | Monte Carlo based model of fluorescence in turbid media and methods and systems for using same to determine intrinsic fluorescence of turbid media |
| US20070232932A1 (en) * | 2006-03-17 | 2007-10-04 | Duke University | Monte Carlo based model of fluorescence in turbid media and methods and systems for using same to determine intrinsic fluorescence of turbid media |
| US7952704B2 (en) | 2006-03-30 | 2011-05-31 | Duke University | Optical assay system for intraoperative assessment of tumor margins |
| US20090015826A1 (en) * | 2006-03-30 | 2009-01-15 | Duke University | Optical assay system for intraoperative assessment of tumor margins |
| US7751039B2 (en) | 2006-03-30 | 2010-07-06 | Duke University | Optical assay system for intraoperative assessment of tumor margins |
| US20100301229A1 (en) * | 2006-03-30 | 2010-12-02 | Nirmala Ramanujam | Optical assay system for intraoperative assessment of tumor margins |
| FR2899972A1 (en) * | 2006-04-14 | 2007-10-19 | Centre Nat Machinisme Agricole | SPATIALLY RESOLVED SPECTROSCOPY BIOLOGICAL SAMPLE ANALYSIS DEVICE AND METHOD |
| WO2007119005A3 (en) * | 2006-04-14 | 2007-12-13 | Ct Nat De Machinisme Agricole | Spectroscopy device |
| WO2007119005A2 (en) * | 2006-04-14 | 2007-10-25 | Centre National De Machinisme Agricole Du Genie Rural Des Eaux Et Des Forets, Cemagref | Spectroscopy device |
| US20080270091A1 (en) * | 2007-02-23 | 2008-10-30 | Nirmala Ramanujam | Scaling method for fast monte carlo simulation of diffuse reflectance spectra from multi-layered turbid media and methods and systems for using same to determine optical properties of multi-layered turbid medium from measured diffuse reflectance |
| US8406861B2 (en) * | 2007-03-28 | 2013-03-26 | Trustees Of Boston University | Detecting optical properties of a turbid medium |
| US20100042005A1 (en) * | 2007-03-28 | 2010-02-18 | Trustees Of Boston University | Detecting optical properties of a turbid medium |
| WO2009037644A3 (en) * | 2007-09-20 | 2009-06-25 | Koninkl Philips Electronics Nv | Method and apparatus for estimating the content of an analyte in a multi-layer medium |
| US20110059016A1 (en) * | 2007-09-27 | 2011-03-10 | Nirmala Ramanujam | Optical assay system with a multi-probe imaging array |
| US9820655B2 (en) | 2007-09-28 | 2017-11-21 | Duke University | Systems and methods for spectral analysis of a tissue mass using an instrument, an optical probe, and a Monte Carlo or a diffusion algorithm |
| US20110112435A1 (en) * | 2007-09-28 | 2011-05-12 | Nirmala Ramanujam | Systems and methods for spectral analysis of a tissue mass using an instrument, an optical probe, and a monte carlo or a diffusion algorithm |
| US20110105865A1 (en) * | 2008-04-24 | 2011-05-05 | Duke University | Diffuse reflectance spectroscopy device for quantifying tissue absorption and scattering |
| US20100302537A1 (en) * | 2009-05-28 | 2010-12-02 | Indatech | Spectroscopy device and method for its implementation |
| WO2010136728A1 (en) * | 2009-05-28 | 2010-12-02 | Indatech | Spectroscopy device and method for implementing same |
| FR2946144A1 (en) * | 2009-05-28 | 2010-12-03 | Ondalys | SPECTROSCOPY DEVICE AND METHOD FOR IMPLEMENTING SAID METHOD |
| DE112010002174T5 (en) | 2009-05-29 | 2012-10-04 | Cognex Technology And Investment Corp. | METHOD AND DEVICE FOR A PRACTICAL 3D SEEDING SYSTEM |
| US9091637B2 (en) | 2009-12-04 | 2015-07-28 | Duke University | Smart fiber optic sensors systems and methods for quantitative optical spectroscopy |
| US10139388B2 (en) * | 2011-03-24 | 2018-11-27 | Quaspec B.V. | Method to determine the absorption coefficient in turbid media |
| US20140107951A1 (en) * | 2011-03-24 | 2014-04-17 | Erasmus University Medical Center Rotterdam | Method to determine the absorption coefficient in turbid media |
| CN103841875A (en) * | 2012-02-10 | 2014-06-04 | 奥林巴斯医疗株式会社 | Bio-optical measurement device and measurement probe |
| EP2813171A4 (en) * | 2012-02-10 | 2015-10-21 | Olympus Medical Systems Corp | Bio-optical measurement device and measurement probe |
| US20140194752A1 (en) * | 2012-02-10 | 2014-07-10 | Olympus Medical Systems Corp. | Bio-optical measurement apparatus and measurement probe |
| CN103356170B (en) * | 2013-05-24 | 2015-02-18 | 天津大学 | Quick Monte Carlo imaging method for reconstructing optical parameter of tissue with heteroplasmon |
| CN103356170A (en) * | 2013-05-24 | 2013-10-23 | 天津大学 | Quick Monte Carlo imaging method for reconstructing optical parameter of tissue with heteroplasmon |
| US20180011015A1 (en) * | 2014-11-13 | 2018-01-11 | Ricoh Company, Ltd. | Optical sensor, optical testing apparatus, and optical characteristics detection method |
| US10175169B2 (en) * | 2014-11-13 | 2019-01-08 | Ricoh Company, Ltd. | Optical sensor, optical testing apparatus, and optical characteristics detection method |
| US11169314B2 (en) * | 2015-03-16 | 2021-11-09 | Digilens Inc. | Waveguide device incorporating a light pipe |
| US20220128754A1 (en) * | 2015-03-16 | 2022-04-28 | Digilens Inc. | Waveguide Device Incorporating a Light Pipe |
| US20170357061A1 (en) * | 2016-06-13 | 2017-12-14 | Kabushiki Kaisha Toshiba | Photon detection device and a method of manufacturing a photon detection device |
| WO2022170168A1 (en) * | 2021-02-08 | 2022-08-11 | Trustees Of Tufts College | Method and apparatus for spectrophotometry of turbid media |
Similar Documents
| Publication | Publication Date | Title |
|---|---|---|
| US6850656B1 (en) | Method and apparatus for measuring locally and superficially the scattering and absorption properties of turbid media | |
| US5813988A (en) | Time-resolved diffusion tomographic imaging in highly scattering turbid media | |
| JP4038179B2 (en) | Method and apparatus for the determination of light transport parameters and analytes in biological matrices | |
| US7440659B2 (en) | Depth-resolved reflectance instrument and method for its use | |
| EP1119763B1 (en) | Method for measuring locally and superficially the scattering and absorption properties of turbid media | |
| CN102144154B (en) | Methods and systems for optically characterizing a turbid material using a structured incident beam | |
| US5931789A (en) | Time-resolved diffusion tomographic 2D and 3D imaging in highly scattering turbid media | |
| US6678541B1 (en) | Optical fiber probe and methods for measuring optical properties | |
| JP3107927B2 (en) | Apparatus and method for measuring optical information of scattering medium | |
| EP0826958B1 (en) | Method and apparatus for obtaining information on the optical absorption of a scattering medium | |
| US7920252B2 (en) | Method and apparatus for spectrophotometric characterization of turbid materials | |
| EP0656536A1 (en) | Method and apparatus for measuring scattering medium | |
| CN102149314A (en) | Biological information imaging apparatus | |
| EP0806650A2 (en) | Method and apparatus for measuring internal property distribution | |
| EP0580414A2 (en) | Apparatus for measuring absorption information in scattering medium and method for the same | |
| KR20020027377A (en) | Methods and systems using field-based light scattering spectroscopy | |
| US7818154B2 (en) | Monte Carlo based model of fluorescence in turbid media and methods and systems for using same to determine intrinsic fluorescence of turbid media | |
| US20080218727A1 (en) | Method and apparatus for optical image reconstruction using contour determination | |
| CN101140222A (en) | Spectrometer system and method for measuring whole optical parameter including turbidity dielectric materials | |
| CN106932363A (en) | A kind of diamond purity detecting system and method | |
| US6660995B1 (en) | Particle size analysis in a turbid media with a single-fiber, optical probe while using a visible spectrometer | |
| Fawzi et al. | Determination of the optical properties of a two-layer tissue model by detecting photons migrating at progressively increasing depths | |
| EP1146811B1 (en) | Depth discrimination of hetorogeneities in turbid media | |
| JPH10246697A (en) | Optical inspection method and device | |
| Di Rocco et al. | CW laser transilluminance in turbid media with cylindrical inclusions |
Legal Events
| Date | Code | Title | Description |
|---|---|---|---|
| AS | Assignment |
Owner name: ECOLE POLYTECHNIQUE FEDERALE DE LAUSANNE, SWITZERL Free format text: ASSIGNMENT OF ASSIGNORS INTEREST;ASSIGNORS:BEVILACQUA, FREDERIC;DEPEURSINGE, CHRISTIAN;REEL/FRAME:011755/0347;SIGNING DATES FROM 20010323 TO 20010325 |
|
| FEPP | Fee payment procedure |
Free format text: PAYOR NUMBER ASSIGNED (ORIGINAL EVENT CODE: ASPN); ENTITY STATUS OF PATENT OWNER: SMALL ENTITY |
|
| FPAY | Fee payment |
Year of fee payment: 4 |
|
| FPAY | Fee payment |
Year of fee payment: 8 |
|
| REMI | Maintenance fee reminder mailed | ||
| LAPS | Lapse for failure to pay maintenance fees | ||
| STCH | Information on status: patent discontinuation |
Free format text: PATENT EXPIRED DUE TO NONPAYMENT OF MAINTENANCE FEES UNDER 37 CFR 1.362 |
|
| FP | Lapsed due to failure to pay maintenance fee |
Effective date: 20170201 |