US6748263B2 - Monitoring electrical activity - Google Patents
Monitoring electrical activity Download PDFInfo
- Publication number
- US6748263B2 US6748263B2 US10/203,954 US20395402A US6748263B2 US 6748263 B2 US6748263 B2 US 6748263B2 US 20395402 A US20395402 A US 20395402A US 6748263 B2 US6748263 B2 US 6748263B2
- Authority
- US
- United States
- Prior art keywords
- yule
- walker
- processor
- output signal
- autocorrelation
- Prior art date
- Legal status (The legal status is an assumption and is not a legal conclusion. Google has not performed a legal analysis and makes no representation as to the accuracy of the status listed.)
- Expired - Fee Related, expires
Links
Images


Classifications
-
- A—HUMAN NECESSITIES
- A61—MEDICAL OR VETERINARY SCIENCE; HYGIENE
- A61B—DIAGNOSIS; SURGERY; IDENTIFICATION
- A61B5/00—Measuring for diagnostic purposes; Identification of persons
- A61B5/48—Other medical applications
- A61B5/4821—Determining level or depth of anaesthesia
-
- A—HUMAN NECESSITIES
- A61—MEDICAL OR VETERINARY SCIENCE; HYGIENE
- A61B—DIAGNOSIS; SURGERY; IDENTIFICATION
- A61B5/00—Measuring for diagnostic purposes; Identification of persons
- A61B5/24—Detecting, measuring or recording bioelectric or biomagnetic signals of the body or parts thereof
- A61B5/316—Modalities, i.e. specific diagnostic methods
- A61B5/369—Electroencephalography [EEG]
- A61B5/372—Analysis of electroencephalograms
- A61B5/374—Detecting the frequency distribution of signals, e.g. detecting delta, theta, alpha, beta or gamma waves
-
- A—HUMAN NECESSITIES
- A61—MEDICAL OR VETERINARY SCIENCE; HYGIENE
- A61B—DIAGNOSIS; SURGERY; IDENTIFICATION
- A61B5/00—Measuring for diagnostic purposes; Identification of persons
- A61B5/24—Detecting, measuring or recording bioelectric or biomagnetic signals of the body or parts thereof
- A61B5/30—Input circuits therefor
- A61B5/301—Input circuits therefor providing electrical separation, e.g. by using isolating transformers or optocouplers
Definitions
- the present invention relates to a method of monitoring electrical activity in an animal, especially human brain waves, and apparatus for carrying out the method such as an electroencephalograph.
- the occurrence of new frequencies lower than the alpha band such as delta, induced by the anaesthetic agent can be used to detect the undesirable presence of true anaesthesia if the intention is to maintain a state of sedation.
- the present invention seeks to provide an apparatus and a method, of analysing brain waves which permits these rhythms to be detected when they are very weak. This then permits an indication of the anaesthesia or sedation level to be determined.
- the present invention is not limited to detection of alpha and lower rhythms and could be used to detect other components such as epileptic spikes in the brain wave signal.
- electrical activity is detected and produces a corresponding output signal
- the output signal is combined with a random noise signal to produce a modified signal
- the modified signal is analysed using an autocorrelation technique to detect the relative power density values at a plurality of different frequencies.
- the autocorrelation technique involves use of the Yule-Walker algorithm.
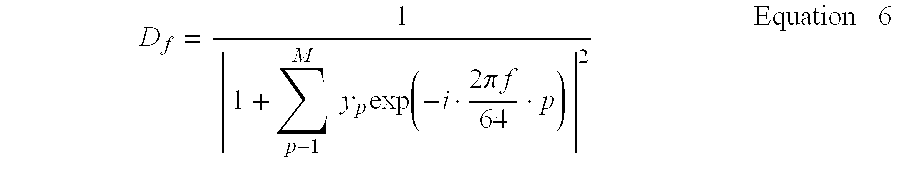
- the relative power density D f at various frequency f are derived using Equation 1 below, for a multiplicity of frequencies f.
- D f 1
- 1 + ⁇ p 1 M ⁇ ⁇ y p ⁇ exp ⁇ ( - i ⁇ a ⁇ f ⁇ p ) ⁇
- the ratio of the sum of one or more values of D f at or about the frequencies of the particular rhythms are compared with the sum of the values of D f over a wider range of values, and the changes in that ratio may be used to detect the emergence of these rhythms.
- the maximum frequency of the wider range will be at least approximately double that of the maximum frequencies of the rhythms under consideration.
- Yule-Walker methods from which the Yule-Walker coefficients referred to in Equation 1 above are obtained, are a known type of frequency analysis method.
- Yule-Walker methods reference may be made to the book “Digital Signal Processing” (second edition) by J G Proakis and D G Manolakis published by McMillan publishing company, New York.
- the present invention also consists in an electroencephalograph which monitors brain waves using the method discussed above, to indicate the emergence of specific rhythms, and also consists in a method of operation such as an electroencephalograph.
- the present invention further proposes that a series of autocorrelation products be derived from the brain wave signals. These autocorrelation products may then be used directly, to derive the Yule-Walker coefficients, but it is preferable that an averaging technique is applied to them. It would be possible to determine the autocorrelation direct over a relatively long time period, but it is preferable to use a shorter time period and average over those time periods. The advantage of this is that short bursts of noise are then not carried over from one period to the next. Averaging in this way has the disadvantage of slowing detection of trends, and therefore there is the need to compromise between these factors.
- an electroencephalograph preferably converts the brain wave signals to digital signals, to enable those signals to be analysed by a suitably programmed processor.
- the analysis of the relative power density values may then be used to generate a suitable display and/or audible signal, and/or a control signal for other equipment.
- the value corresponding to the comparison of relative power densities discussed above is converted to an index value which is a non-linear function of the initial value, to emphasise changes at low values of the specific rhythm.
- FIG. 1 shows an electroencephalograph being an embodiment of the present invention
- FIG. 2 shows part of the electroencephalograph of FIG. 1 .
- an electroencephalograph amplifier unit 10 generates electrical signals corresponding to the brain waves, and passes those signals to an analogue-to-digital converter 11 .
- the resulting digital signals are passed to a processor 12 , in which they are processed using a Yule-Walker method, as will be described in more detail later.
- Electrodes 20 for attachment to a person whose brain waves are to be investigated, are connected to an input protection circuitry unit 21 which protects other parts of the electroencephalograph from damage due to high voltage discharge.
- the input protection circuitry unit 21 may also act to protect the person to whom the electrodes 20 are connected from failures within the electroencephalograph.
- the input protection circuitry unit 21 is also connected to ground, so that it passes differential signals to an amplifier unit 22 . That amplifier unit removes common mode noise, and produces a single signal from the input thereto which is then passed to a gain and filter unit 23 .
- the gain and filter unit 23 removes high frequency and DC components from the signal, and further amplifies the signal before it is passed to an isolation amplifier unit 24 .
- That isolation amplifier unit 24 acts as a isolation barrier between the electroencephalograph amplifier 10 and the analogue to digital converter 11 .
- the processor 12 is powered from a power supply unit 13 , which may contain a mains connection and a battery back-up so that the power is uninterruptable.
- the program for controlling the processor 12 during operation is stored in a memory unit 14 .
- the processor 12 may be connected to a second electroencephalograph amplifier unit 15 , by the analogue digital converter 11 .
- That second electroencephalograph amplifier 15 may have the same structure as shown in FIG. 2 .
- Two auxiliary inputs 16 , 17 may be provided to allow digitisation of non-isolated inputs from a CAPNOGRAPH or similar equipment.
- FIG. 1 also shows that a signal is passed from the processor 12 to the electroencephalograph amplifiers 10 , 15 .
- This signal is an enabling signal which is passed via an opto-isolator unit 25 (see FIG. 2) to an impedance checker oscillator 26 of the electroencephalograph amplifier 10 , 15 .
- the opto-isolator unit 25 thus provides electrical safety isolation between the processor 12 and the electroencephalograph amplifier unit 10 , 15 , in a similar way to the isolation amplifier unit 24 .
- the impedance checker oscillator 26 When the impedance checker oscillator 26 is enabled by the signal from the processor 12 , it outputs a frequency signal of between e.g.
- the present invention makes use of a Yule-Walker method to derive relative power density values.
- theoretical frequency analysis using such methods normally assume steady state conditions, which do not apply to brain wave signals.
- the consistent frequencies of such signals are often strongly amplitude modulated. Irregular waxing and waning occurs for some or all of the frequencies with successive maxima intervals varying within a range of half a second to two seconds.
- eye movements of the person to whom the electrodes 20 are connected can cause large irregular voltage excursions, and it has also been found that there are other non-periodic components. There may also be low frequency or DC drift.
- the processor 12 makes use of practical compromises as discussed below.
- the processor 12 analyses the signals corresponding to the brain waves in a series of time periods (epochs).
- the length of time period need not be fixed, and indeed an electroencephalograph according to the present invention may permit the duration of the epochs to be varied. However, an epoch of about 1.5 s duration has been found to be suitable. Assuming that the sampling rate of the processor 12 was e.g. 128 Hz, this would result in 192 sample values. This can be generalised, however, to N sample values per epoch, being:
- a modified sampled value a′ k may be obtained, as follows.
- a k ′ a k + abs ⁇ ( a max 20000 ) ⁇ ( 500 - random ⁇ ( 1000 ) ) Equation ⁇ ⁇ 2
- a max is the numerically greatest sampled value in the epoch
- “random (1000)” is a random positive integer in the range of 0 to 1000. Such a random positive integer may be obtained from a pseudo-random program of the processor 12 .
- this DC component may include a drift component.
- the average value of a′ k over all the n values is subtracted from each value a′ k to derive a further modified value a′′ k . This process can be carried out for each epoch, and it should be noted that the addition of the random value discussed above does not introduce a further bias.
- p is the number of the autocorrelation product, varying between 0 and m.
- the values of x p are then a measure in the time domain of the periodic components of the brain wave signals.
- Equation 5 above can be solved in any satisfactory way, it has been found that the Levinson-Durbin solution algorithm may be used, as this enables the equation to be solved rapidly.
- D f 1
- a ratio ⁇ r can be derived from equation 7.
- the numerator represents the sum of the relative power density values within the 8 to 12 Hz frequency range in which alpha rhythms occur, whilst the denominator is a sum of the relative power density values over a frequency range of 0.5 to 24 Hz.
- ⁇ r gives a measure of the power density within the range corresponding to alpha rhythms, relative to a much wider frequency range encompassing the range of frequencies corresponding to the alpha rhythms.
- variations in a r represent variations in the power present in alpha rhythms.
- the processor may derive a value ⁇ i which is a non linear function of ⁇ r according to Equation 8.
- Equation 8 S is a sensitivity factor. If S equals 1, ⁇ i and ⁇ r would be the same. In practice, S equals 0.4 is a suitable value.
- ⁇ i may be used to control.
- a display which the operator of the encephalograph may use to detect the emergence of a rhythm.
- a signal may be passed to a LED display 30 which displays the current value of ⁇ i .
- ⁇ i may be presented as a vertical bar on an LCD screen 31 , to give a graphical indication of variations in that value.
- Information may also be passed via a printer port 32 either directly to a printer, or to a suitable computer for further analysis.
- the processor 12 is connected to a key board 33 which permits the operator to control the electroencephalograph, for example to input parameters such as the duration of each epoch.
- the processor 12 is also connected to a dram memory 34 which permits some data to be stored whilst the electroencephalograph is powered up.
- Equation 5 Equation 5
- Equation 7 it can be seen from Equation 7 that suitable selection of the ranges of the values k in the numerator and denominator of that equation will enable the power of other frequency components to be investigated.
- the present invention has been developed primarily to detect alpha rhythms occurring in the 8 to 12 Hz frequency range, the present invention may be applied to the analysis of other frequency components.
Abstract
Description


Claims (28)


Applications Claiming Priority (4)
| Application Number | Priority Date | Filing Date | Title |
|---|---|---|---|
| GB0003665 | 2000-02-17 | ||
| GB0003665A GB2359367B (en) | 2000-02-17 | 2000-02-17 | Monitoring electrical activity |
| GB0003665.7 | 2000-02-17 | ||
| PCT/GB2001/000629 WO2001060252A1 (en) | 2000-02-17 | 2001-02-16 | Monitoring electrical activity |
Publications (2)
| Publication Number | Publication Date |
|---|---|
| US20030109796A1 US20030109796A1 (en) | 2003-06-12 |
| US6748263B2 true US6748263B2 (en) | 2004-06-08 |
Family
ID=9885786
Family Applications (1)
| Application Number | Title | Priority Date | Filing Date |
|---|---|---|---|
| US10/203,954 Expired - Fee Related US6748263B2 (en) | 2000-02-17 | 2001-02-16 | Monitoring electrical activity |
Country Status (8)
| Country | Link |
|---|---|
| US (1) | US6748263B2 (en) |
| EP (1) | EP1255486B1 (en) |
| AT (1) | ATE322861T1 (en) |
| AU (1) | AU2001233857A1 (en) |
| CA (1) | CA2400348A1 (en) |
| DE (1) | DE60118705T2 (en) |
| GB (1) | GB2359367B (en) |
| WO (1) | WO2001060252A1 (en) |
Cited By (7)
| Publication number | Priority date | Publication date | Assignee | Title |
|---|---|---|---|---|
| US20080249431A1 (en) * | 2006-09-29 | 2008-10-09 | The Regents Of The University Of California | Burst suppression monitor for induced coma |
| US20080275316A1 (en) * | 2007-05-04 | 2008-11-06 | Reproductive Research Technologies, Lp | Skin impedance matching system and method for skin/electrode interface |
| US20110237972A1 (en) * | 2010-03-23 | 2011-09-29 | Robert Garfield | Noninvasive measurement of uterine emg propagation and power spectrum frequency to predict true preterm labor and delivery |
| US8386026B2 (en) * | 2010-04-12 | 2013-02-26 | Reproductive Research Technologies, L.P. | System and method for acquiring and displaying abdominal EMG signals |
| US8821397B2 (en) | 2010-09-28 | 2014-09-02 | Masimo Corporation | Depth of consciousness monitor including oximeter |
| US9775545B2 (en) | 2010-09-28 | 2017-10-03 | Masimo Corporation | Magnetic electrical connector for patient monitors |
| US10154815B2 (en) | 2014-10-07 | 2018-12-18 | Masimo Corporation | Modular physiological sensors |
Families Citing this family (1)
| Publication number | Priority date | Publication date | Assignee | Title |
|---|---|---|---|---|
| GB201209638D0 (en) | 2012-05-30 | 2012-07-11 | Isis Innovation | Perception loss detection |
Citations (9)
| Publication number | Priority date | Publication date | Assignee | Title |
|---|---|---|---|---|
| US4846190A (en) | 1983-08-23 | 1989-07-11 | John Erwin R | Electroencephalographic system data display |
| US5109863A (en) * | 1989-10-26 | 1992-05-05 | Rutgers, The State University Of New Jersey | Noninvasive diagnostic system for coronary artery disease |
| US5211179A (en) * | 1989-07-14 | 1993-05-18 | Ralph Haberl | System and method for analyzing selected signal components in electrocardiographic signals, particularly late potentials in electrocardiograms |
| US5299118A (en) | 1987-06-26 | 1994-03-29 | Nicolet Instrument Corporation | Method and system for analysis of long term physiological polygraphic recordings |
| US5458117A (en) | 1991-10-25 | 1995-10-17 | Aspect Medical Systems, Inc. | Cerebral biopotential analysis system and method |
| US5765128A (en) | 1994-12-21 | 1998-06-09 | Fujitsu Limited | Apparatus for synchronizing a voice coder and a voice decoder of a vector-coding type |
| US5938594A (en) * | 1996-05-14 | 1999-08-17 | Massachusetts Institute Of Technology | Method and apparatus for detecting nonlinearity and chaos in a dynamical system |
| US5940798A (en) * | 1997-12-31 | 1999-08-17 | Scientific Learning Corporation | Feedback modification for reducing stuttering |
| US6011990A (en) | 1995-10-19 | 2000-01-04 | Arthur Schultz | Method and device for evaluating an EEG carried out in the context of anaesthesia or intensive care |
Family Cites Families (3)
| Publication number | Priority date | Publication date | Assignee | Title |
|---|---|---|---|---|
| US4616659A (en) * | 1985-05-06 | 1986-10-14 | At&T Bell Laboratories | Heart rate detection utilizing autoregressive analysis |
| US4974162A (en) * | 1987-03-13 | 1990-11-27 | University Of Maryland | Advanced signal processing methodology for the detection, localization and quantification of acute myocardial ischemia |
| US5010891A (en) * | 1987-10-09 | 1991-04-30 | Biometrak Corporation | Cerebral biopotential analysis system and method |
-
2000
- 2000-02-17 GB GB0003665A patent/GB2359367B/en not_active Expired - Fee Related
-
2001
- 2001-02-16 AT AT01905887T patent/ATE322861T1/en not_active IP Right Cessation
- 2001-02-16 EP EP01905887A patent/EP1255486B1/en not_active Expired - Lifetime
- 2001-02-16 US US10/203,954 patent/US6748263B2/en not_active Expired - Fee Related
- 2001-02-16 DE DE60118705T patent/DE60118705T2/en not_active Expired - Lifetime
- 2001-02-16 WO PCT/GB2001/000629 patent/WO2001060252A1/en active IP Right Grant
- 2001-02-16 AU AU2001233857A patent/AU2001233857A1/en not_active Abandoned
- 2001-02-16 CA CA002400348A patent/CA2400348A1/en not_active Abandoned
Patent Citations (9)
| Publication number | Priority date | Publication date | Assignee | Title |
|---|---|---|---|---|
| US4846190A (en) | 1983-08-23 | 1989-07-11 | John Erwin R | Electroencephalographic system data display |
| US5299118A (en) | 1987-06-26 | 1994-03-29 | Nicolet Instrument Corporation | Method and system for analysis of long term physiological polygraphic recordings |
| US5211179A (en) * | 1989-07-14 | 1993-05-18 | Ralph Haberl | System and method for analyzing selected signal components in electrocardiographic signals, particularly late potentials in electrocardiograms |
| US5109863A (en) * | 1989-10-26 | 1992-05-05 | Rutgers, The State University Of New Jersey | Noninvasive diagnostic system for coronary artery disease |
| US5458117A (en) | 1991-10-25 | 1995-10-17 | Aspect Medical Systems, Inc. | Cerebral biopotential analysis system and method |
| US5765128A (en) | 1994-12-21 | 1998-06-09 | Fujitsu Limited | Apparatus for synchronizing a voice coder and a voice decoder of a vector-coding type |
| US6011990A (en) | 1995-10-19 | 2000-01-04 | Arthur Schultz | Method and device for evaluating an EEG carried out in the context of anaesthesia or intensive care |
| US5938594A (en) * | 1996-05-14 | 1999-08-17 | Massachusetts Institute Of Technology | Method and apparatus for detecting nonlinearity and chaos in a dynamical system |
| US5940798A (en) * | 1997-12-31 | 1999-08-17 | Scientific Learning Corporation | Feedback modification for reducing stuttering |
Cited By (17)
| Publication number | Priority date | Publication date | Assignee | Title |
|---|---|---|---|---|
| US9597006B2 (en) | 2006-09-29 | 2017-03-21 | The Regents Of The University Of California | Burst suppression monitor for induced coma |
| US8649855B2 (en) | 2006-09-29 | 2014-02-11 | The Regents Of The University Of California | Burst suppression monitor for induced coma |
| US20080249431A1 (en) * | 2006-09-29 | 2008-10-09 | The Regents Of The University Of California | Burst suppression monitor for induced coma |
| US20080275316A1 (en) * | 2007-05-04 | 2008-11-06 | Reproductive Research Technologies, Lp | Skin impedance matching system and method for skin/electrode interface |
| US8444559B2 (en) | 2007-05-04 | 2013-05-21 | Reproductive Research Technologies, Lp | Skin impedance matching system and method for skin/electrode interface |
| US20110237972A1 (en) * | 2010-03-23 | 2011-09-29 | Robert Garfield | Noninvasive measurement of uterine emg propagation and power spectrum frequency to predict true preterm labor and delivery |
| US8386026B2 (en) * | 2010-04-12 | 2013-02-26 | Reproductive Research Technologies, L.P. | System and method for acquiring and displaying abdominal EMG signals |
| EP2575609A2 (en) * | 2010-04-12 | 2013-04-10 | Reproductive Research Technologies, LP | System and method for acquiring and displaying abdominal emg signals |
| EP2575609A4 (en) * | 2010-04-12 | 2014-07-16 | Reproductive Res Technologies Lp | System and method for acquiring and displaying abdominal emg signals |
| US8821397B2 (en) | 2010-09-28 | 2014-09-02 | Masimo Corporation | Depth of consciousness monitor including oximeter |
| US9538949B2 (en) | 2010-09-28 | 2017-01-10 | Masimo Corporation | Depth of consciousness monitor including oximeter |
| US9775545B2 (en) | 2010-09-28 | 2017-10-03 | Masimo Corporation | Magnetic electrical connector for patient monitors |
| US10531811B2 (en) | 2010-09-28 | 2020-01-14 | Masimo Corporation | Depth of consciousness monitor including oximeter |
| US11717210B2 (en) | 2010-09-28 | 2023-08-08 | Masimo Corporation | Depth of consciousness monitor including oximeter |
| US10154815B2 (en) | 2014-10-07 | 2018-12-18 | Masimo Corporation | Modular physiological sensors |
| US10765367B2 (en) | 2014-10-07 | 2020-09-08 | Masimo Corporation | Modular physiological sensors |
| US11717218B2 (en) | 2014-10-07 | 2023-08-08 | Masimo Corporation | Modular physiological sensor |
Also Published As
| Publication number | Publication date |
|---|---|
| GB2359367B (en) | 2003-11-05 |
| US20030109796A1 (en) | 2003-06-12 |
| CA2400348A1 (en) | 2001-08-23 |
| GB0003665D0 (en) | 2000-04-05 |
| DE60118705D1 (en) | 2006-05-24 |
| EP1255486A1 (en) | 2002-11-13 |
| GB2359367A (en) | 2001-08-22 |
| AU2001233857A1 (en) | 2001-08-27 |
| EP1255486B1 (en) | 2006-04-12 |
| ATE322861T1 (en) | 2006-04-15 |
| DE60118705T2 (en) | 2007-04-12 |
| WO2001060252A1 (en) | 2001-08-23 |
Similar Documents
| Publication | Publication Date | Title |
|---|---|---|
| US6882166B2 (en) | System and method for measuring the validity of a bioelectric impedance measurement in the presence of interference | |
| US6934579B2 (en) | Anaesthesia control system | |
| Sigl et al. | An introduction to bispectral analysis for the electroencephalogram | |
| US4595018A (en) | Method of further developing the measuring of a neuro-muscular junction | |
| Weber et al. | A nonstationarity test for the spectral analysis of physiological time series with an application to respiratory sinus arrhythmia | |
| Christov et al. | Filtering of electromyogram artifacts from the electrocardiogram | |
| Rampil | A primer for EEG signal processing in anesthesia | |
| Tal et al. | Cleaning MEG artifacts using external cues | |
| AU2002327200A1 (en) | System and method for measuring bioelectric impedance in the presence of interference | |
| EP2962634A1 (en) | Method and apparatus for measuring anesthetic depth | |
| US6748263B2 (en) | Monitoring electrical activity | |
| RU95243U1 (en) | DEVICE FOR ANESTHESIA LEVEL CONTROL | |
| US6343229B1 (en) | Device for measurement and analysis of brain activity of both cerebral hemispheres in a patient | |
| Santopietro | The origin and characterization of the primary signal, noise, and interference sources in the high frequency electrocardiogram | |
| Dotsinsky et al. | Power-line interference cancellation in ECG signals | |
| Shahbazi et al. | Univariate normalization of bispectrum using Hölder's inequality | |
| Friston et al. | Transient phase‐locking and dynamic correlations: Are they the same thing? | |
| Arrufat‐Pié et al. | Comparison between traditional fast Fourier transform and marginal spectra using the Hilbert–Huang transform method for the broadband spectral analysis of the electroencephalogram in healthy humans | |
| Spasic et al. | Surrogate data modeling the relationship between high frequency amplitudes and Higuchi fractal dimension of EEG signals in anesthetized rats | |
| Huang et al. | A novel application of the S-transform in removing powerline interference from biomedical signals | |
| Dotsinsky et al. | Power-line interference removal from high sampled ECG signals using modified version of the subtraction procedure | |
| Govreen-Segal et al. | Real-time PC-based system for dynamic beat-to-beat QT-RR analysis | |
| Zalewska | Is so called “split alpha” in EEG spectral analysis a result of methodological and interpretation errors? | |
| Shafqat et al. | Empirical mode decomposition analysis of HRV data from patients undergoing local anaesthesia (brachial plexus block) | |
| Teich et al. | Spectral characteristics and synchrony in primary auditory-nerve fibers in response to pure-tone acoustic stimuli |
Legal Events
| Date | Code | Title | Description |
|---|---|---|---|
| AS | Assignment |
Owner name: BRISTOL, THE UNIVERSITY OF, UNITED KINGDOM Free format text: ASSIGNMENT OF ASSIGNORS INTEREST;ASSIGNORS:GRIFFITHS, MARKS;PREECE, ALAN;REEL/FRAME:013364/0267 Effective date: 20020809 |
|
| FPAY | Fee payment |
Year of fee payment: 4 |
|
| SULP | Surcharge for late payment | ||
| FEPP | Fee payment procedure |
Free format text: PAYOR NUMBER ASSIGNED (ORIGINAL EVENT CODE: ASPN); ENTITY STATUS OF PATENT OWNER: SMALL ENTITY |
|
| FEPP | Fee payment procedure |
Free format text: PAT HOLDER CLAIMS SMALL ENTITY STATUS, ENTITY STATUS SET TO SMALL (ORIGINAL EVENT CODE: LTOS); ENTITY STATUS OF PATENT OWNER: SMALL ENTITY |
|
| AS | Assignment |
Owner name: ALPHA-ACTIVE LIMITED, UNITED KINGDOM Free format text: ASSIGNMENT OF ASSIGNORS INTEREST;ASSIGNOR:THE UNIVERSITY OF BRISTOL;REEL/FRAME:027415/0905 Effective date: 20111208 |
|
| REMI | Maintenance fee reminder mailed | ||
| FPAY | Fee payment |
Year of fee payment: 8 |
|
| SULP | Surcharge for late payment |
Year of fee payment: 7 |
|
| REMI | Maintenance fee reminder mailed | ||
| LAPS | Lapse for failure to pay maintenance fees | ||
| STCH | Information on status: patent discontinuation |
Free format text: PATENT EXPIRED DUE TO NONPAYMENT OF MAINTENANCE FEES UNDER 37 CFR 1.362 |
|
| FP | Lapsed due to failure to pay maintenance fee |
Effective date: 20160608 |