US6581445B1 - Distributed fiber optic moisture intrusion sensing system - Google Patents
Distributed fiber optic moisture intrusion sensing system Download PDFInfo
- Publication number
- US6581445B1 US6581445B1 US09/608,334 US60833400A US6581445B1 US 6581445 B1 US6581445 B1 US 6581445B1 US 60833400 A US60833400 A US 60833400A US 6581445 B1 US6581445 B1 US 6581445B1
- Authority
- US
- United States
- Prior art keywords
- soil
- volume
- temperature
- linear element
- moisture
- Prior art date
- Legal status (The legal status is an assumption and is not a legal conclusion. Google has not performed a legal analysis and makes no representation as to the accuracy of the status listed.)
- Expired - Lifetime, expires
Links
- 239000000835 fiber Substances 0.000 title description 25
- 239000002689 soil Substances 0.000 claims abstract description 71
- 238000010438 heat treatment Methods 0.000 claims abstract description 18
- 238000000034 method Methods 0.000 claims abstract description 15
- WYTGDNHDOZPMIW-RCBQFDQVSA-N alstonine Natural products C1=CC2=C3C=CC=CC3=NC2=C2N1C[C@H]1[C@H](C)OC=C(C(=O)OC)[C@H]1C2 WYTGDNHDOZPMIW-RCBQFDQVSA-N 0.000 claims abstract description 7
- 239000013307 optical fiber Substances 0.000 claims description 20
- 230000005855 radiation Effects 0.000 claims description 13
- 238000001069 Raman spectroscopy Methods 0.000 claims description 6
- 230000001747 exhibiting effect Effects 0.000 claims description 2
- 230000004075 alteration Effects 0.000 claims 1
- 238000012512 characterization method Methods 0.000 claims 1
- 238000001514 detection method Methods 0.000 abstract description 6
- 238000012544 monitoring process Methods 0.000 abstract description 6
- 230000003287 optical effect Effects 0.000 abstract description 4
- 239000002901 radioactive waste Substances 0.000 abstract description 3
- 238000005067 remediation Methods 0.000 abstract description 3
- 239000002920 hazardous waste Substances 0.000 abstract description 2
- 238000002310 reflectometry Methods 0.000 abstract description 2
- 230000002285 radioactive effect Effects 0.000 abstract 1
- 239000004576 sand Substances 0.000 description 22
- 238000012360 testing method Methods 0.000 description 16
- 230000000694 effects Effects 0.000 description 12
- 229910001220 stainless steel Inorganic materials 0.000 description 11
- 239000010935 stainless steel Substances 0.000 description 11
- XLYOFNOQVPJJNP-UHFFFAOYSA-N water Substances O XLYOFNOQVPJJNP-UHFFFAOYSA-N 0.000 description 11
- 238000001816 cooling Methods 0.000 description 5
- 238000012545 processing Methods 0.000 description 5
- 238000009529 body temperature measurement Methods 0.000 description 4
- 238000011065 in-situ storage Methods 0.000 description 4
- 238000005259 measurement Methods 0.000 description 4
- 229920006395 saturated elastomer Polymers 0.000 description 4
- 239000002699 waste material Substances 0.000 description 4
- 244000035744 Hura crepitans Species 0.000 description 3
- 230000003466 anti-cipated effect Effects 0.000 description 2
- 230000004888 barrier function Effects 0.000 description 2
- 239000012530 fluid Substances 0.000 description 2
- 230000009467 reduction Effects 0.000 description 2
- 238000003303 reheating Methods 0.000 description 2
- 238000013459 approach Methods 0.000 description 1
- 230000005540 biological transmission Effects 0.000 description 1
- 230000000739 chaotic effect Effects 0.000 description 1
- 239000002894 chemical waste Substances 0.000 description 1
- 239000000470 constituent Substances 0.000 description 1
- 238000011109 contamination Methods 0.000 description 1
- 230000007613 environmental effect Effects 0.000 description 1
- 239000003673 groundwater Substances 0.000 description 1
- 231100001261 hazardous Toxicity 0.000 description 1
- 231100000206 health hazard Toxicity 0.000 description 1
- 230000007774 longterm Effects 0.000 description 1
- 239000002925 low-level radioactive waste Substances 0.000 description 1
- 239000000463 material Substances 0.000 description 1
- 239000010812 mixed waste Substances 0.000 description 1
- 238000012986 modification Methods 0.000 description 1
- 230000004048 modification Effects 0.000 description 1
- 238000001556 precipitation Methods 0.000 description 1
- 230000001681 protective effect Effects 0.000 description 1
- 230000001105 regulatory effect Effects 0.000 description 1
- 230000004044 response Effects 0.000 description 1
- 238000000926 separation method Methods 0.000 description 1
- 239000008399 tap water Substances 0.000 description 1
- 235000020679 tap water Nutrition 0.000 description 1
- 231100000331 toxic Toxicity 0.000 description 1
- 230000002588 toxic effect Effects 0.000 description 1
- 239000010891 toxic waste Substances 0.000 description 1
Images


Classifications
-
- G—PHYSICS
- G01—MEASURING; TESTING
- G01N—INVESTIGATING OR ANALYSING MATERIALS BY DETERMINING THEIR CHEMICAL OR PHYSICAL PROPERTIES
- G01N33/00—Investigating or analysing materials by specific methods not covered by groups G01N1/00 - G01N31/00
- G01N33/24—Earth materials
- G01N33/246—Earth materials for water content
-
- G—PHYSICS
- G01—MEASURING; TESTING
- G01N—INVESTIGATING OR ANALYSING MATERIALS BY DETERMINING THEIR CHEMICAL OR PHYSICAL PROPERTIES
- G01N21/00—Investigating or analysing materials by the use of optical means, i.e. using sub-millimetre waves, infrared, visible or ultraviolet light
- G01N21/62—Systems in which the material investigated is excited whereby it emits light or causes a change in wavelength of the incident light
- G01N21/63—Systems in which the material investigated is excited whereby it emits light or causes a change in wavelength of the incident light optically excited
- G01N21/65—Raman scattering
Definitions
- This invention pertains generally to moisture detection in soil, and more specifically to a method and apparatus using principles of thermal conductance to detect intrusion of moisture into soil and landfills containing toxic and/or radioactive waste.
- landfills exist across the U.S. which are operated by both government and private entities. Many such landfills contain chemical waste, low-level radioactive waste and/or mixed waste. Moisture intrusion into the soil comprising such landfills represents a problem in that wastes can be destabilized or even mobilized resulting in inadequate containment. Moisture, from precipitation (rain and snow, for example), or from overland runoff can mobilize waste resulting in contamination of ground water sources thereby creating a health hazard. Therefore, effective and economical monitoring of the presence and movement of moisture in landfills is often critical to environmental safety and remediation programs.
- the present invention aids in this understanding by providing a method and apparatus for monitoring fluid flow in situ.
- Yet another object is to provide a soil moisture sensing system that includes a linear element (such as a tube, cable or conduit) positioned in a volume of soil.
- a linear element such as a tube, cable or conduit
- Another related object is the provision of a distributed temperature sensing element associated with the linear element that permits identification of the regions having different thermal conductances mentioned above, especially when a heater is included, which, when actuated, heats the soil.
- Yet another object of the invention is to provide a method for detecting moisture intrusion in soil which includes positioning in soil a linear element that comprises a distributed temperature sensing element, and further includes heating at least a portion of the soil, and measuring temperatures in the soil. Using the invention in this way, it is possible to ascertain whether regions are present in the soil suggesting different thermal conductances and, therefore, possibly the presence of moisture.
- a linear element such as a cable, tube or conduit positioned in a serpentine fashion within a target area of soil.
- Optimal placement of the linear element assumes that it passes through a significant two-dimensional area and, preferably, also a significant three-dimensional volume within the target portion of the soil.
- the invention also includes using an optical fiber, that forms a component of a distributed temperature sensing system, and a heating element.
- the optical fiber serves as an optical conduit through which pulses of light pass, generating Raman scattered radiation within the target area.
- the scattered radiation is detected and analyzed using principles of optical time delay reflectometry (OTDR) to permit accurate and distributed temperature detection capability along the length of the fiber optic.
- OTDR optical time delay reflectometry
- the heating element which, in a primary embodiment disclosed here, is integrated with the cable or other linear element, is used to heat soil. Principles of the invention, though, would also be served using by an external heating apparatus.
- the heating causes regions of differing thermal conductance within the soil to become apparent and detectable by the distributed temperature detection system. According to the invention, those areas having relatively higher thermal conductance (possibly reflecting the presence of moisture) can thus be identified and located.
- FIG. 1 is a schematic perspective view of one embodiment of the invention illustrating positioning, within soil of a landfill, of a linear element including a distributed temperature sensing element.
- FIG. 2 a is a schematic depiction of various aspects of the invention according to one embodiment, those aspects including a cable that houses heating and sensing elements.
- FIG. 2 b is a schematic depiction of an apparatus according to the invention wherein coils comprising heating and temperature sensing elements are positioned within a volume of sand.
- FIGS. 3-26 and 28 - 31 are graphs showing temperature data illustrating the efficacy of the invention principles according to various apparatus configurations and under a variety of conditions.
- FIG. 27 is a schematic depiction of an apparatus according to the invention wherein a sensor within a stainless steel tube is positioned in soil.
- the temperature sensing component works by sending pulses of radiation down a fiber optic (at 1064 nm, in the case of the York system), in OTDR-like fashion, generating Raman scattered radiation throughout.
- the latter consists of two components, one with a wavelength slightly above 1064 nm and the other slightly below 1064 nm.
- the ratio of the anti-Stokes component to the Stokes component depends on temperature.
- the ratio of anti-Stokes to Stokes is K exp ( ⁇ 700/T), at the point of generation, where T is the absolute temperature and K is a coefficient that depends on the numerical aperture of the fiber and wavelengths raised to the fourth power.
- a distributed temperature sensing apparatus such as that just described is integrated with a cable, conduit or other similar linear element that can be positioned according to a serpentine arrangement in a target area within a volume of soil.
- target area includes not only a two-dimensional geometric area but also a three-dimensional volume.
- the linear element may be flexible or rigid, depending on a particular application or user's needs.
- One embodiment of the described linear element can include a cable that houses both the optical fiber as well as a heater wire.
- Other configurations are possible and considered within the scope of the invention and appended claims. Such other configurations include, but are not limited to, arrangements such as those employing a conduit in place of a conventional cable, and configurations wherein the heater wire is omitted, and another form of heater is used in its place.
- Alternative embodiments also include, for example, deploying a stainless steel tube housing the optical fiber as the heating element. This is described in slightly more detail, below.
- the heater need not necessarily even be integrated with the linear element, so long as the desired separation in temperature between moist and dry soil can be attained.
- FIG. 2 a illustrates schematically the experimental arrangement used in demonstrating operation of the invention.
- Approximately 14 meters of fiber 20 at the end of a long spool 22 and heater wire 25 were fed through shrink tubing 28 forming a cable and then laid out in a serpentine pattern 30 on a surface.
- Certain additional necessary components needed for the heater and DTS system to be operative are also shown in the figure. Those include an electrical lead 32 connecting the heater wire to an electric potential, in this case, provided by a variac 35 .
- the optical fiber 20 is likewise in operative association with a commercial DTS data acquisition and processing unit 40 which is capable of displaying temperature values measured at various locations along the length of the cable, according to the ODTR and DTS principles discussed above.
- FIGS. 3-26 illustrate graphs depicting temperature readings in degrees Celsius along various positions identified according to their distance (in meters) along the length of the cable.
- one set of measurements shown in FIGS. 3 - 6
- no sand was used, and towels saturated with tap water were applied to sections of the cable during various stages of heating.
- the next set of measurements pertain to tests where sand was used to at least partially cover the cable.
- the temperature distribution along the cable was measured using the DTS.
- FIG. 3 is a plot of results of a baseline test showing temperature variations along the fiber absent heating or localized cooling. Only mild variations in temperature are registered, and those are considered to be within expected degree of random variation.
- FIG. 4 shows the temperature data collected after wet towels were applied around three bends, and then heat was applied.
- Troughs ( 45 , 36 , 47 ) are apparent showing regions of lower temperature at positions of approximately 9, 11 and 14 meters, correlating to the bends where the wet towels were applied. (Note also that the figure shows another trough ( 48 ) in the region of the unheated lead-in portion of the cable.)
- FIG. 5 shows readings from the same test arrangement as illustrated in FIG. 4, but in this case it is after the heater was turned off. Troughs ( 45 ′, 46 ′, 47 ′) indicating positions of moisture are still apparent.
- FIG. 6 shows readings, again from the same test arrangement, after heat is reapplied. Again, troughs ( 45 ′′, 46 ′′, 47 ′′) indicating positions of moisture are apparent.
- FIG. 7 shows readings taken after the system was allowed to stabilize at room temperature. Then slightly cool sand was poured over regions roughly corresponding to where the wet towels were applied previously. The effect of the cool sand is apparent from the troughs ( 55 , 56 , 57 ) depicted in the plot.
- FIG. 8 shows readings taken after sand was applied as just described, and then water poured over the sand and heat applied. Troughs ( 55 ′, 56 ′, 57 ′) indicating where the moisture is present causing differential response to heating are clearly apparent.
- FIG. 9 shows temperature readings from the system after it is again allowed to cool. The effect of moisture is still apparent from the troughs ( 55 ′′, 56 ′′, 57 ′′).
- FIG. 10 shows readings after dry sand has been applied over almost the entire lengths of the cable. In this instance, heat is applied, but no moisture is added.
- the large peak 59 in the region of the 4-meter point on the cable shows that portion of the cable that was uncovered, preceded by a cool, unheated section of fiber. The slightly warmer section at around 14 meters is considered to probably be due to a fluctuation in the ambient temperature.
- FIG. 11 shows the same system, with the heater on, after water is poured over sand covering the section of cable at about the 10-meter position.
- a trough ( 60 ) is apparent indicating the location of the moisture.
- FIG. 12 shows the system after it has cooled almost to room temperature. The effect of moisture is still apparent from the presence of the trough ( 60 ′).
- FIG. 13 shows the system after reheating.
- the presence of the trough ( 60 ′′) demonstrates that the effect of moisture is reproducible.
- FIG. 14 shows the system, with heat still applied, with water poured over a second section.
- a second trough ( 61 ) is apparent at about 6 meters in addition to the previously identified trough ( 60 ) at about 11 meters. This indicates that moisture in separate regions of the volume of sand are independently identifiable using the invention.
- FIG. 15 shows the system after it has been allowed to cool.
- the effect of the moisture in the two regions is still apparent from the two troughs ( 60 *, 61 *). Also apparent from the plot is the insulating effect of the sand, which keeps covered sections slightly warmer than the uncovered lead-in.
- FIG. 16 shows, finally, the effect of reheating, and illustrates that the effect of moisture on the two sections is still apparent from the troughs ( 60 **, 61 **).
- the previously cooler lead-in is now warmer than the covered length of the cable. It is preceded by an unheated section of fiber.
- FIGS. 17-26 correspond to tests performed using the test configuration illustrated schematically in FIG. 2 b which shows an alternate experimental set up wherein stainless steel tubing was used to house the fiber optic.
- a hybrid cable similar to that used before and comprising both an optical fiber 20 and a heater wire 25 within tube 28 is used, however this time the cable is inserted into a coil of stainless steel tubing 29 positioned in a tray 41 .
- the heater wire 25 is connected to the variac 35 , directly at one end, and via an electrical lead 32 at the other, and the optical fiber 20 is in operative association with a commercial DTS data acquisition and processing unit 40 .
- a commercial DTS data acquisition and processing unit 40 Assume that, for purposes of the following description of the figures, when moisture was applied that it occurred in the region 42 shown.
- FIG. 17 shows readings for the cable inserted in the stainless steel tubing. Heat has been applied in the absence of water or sand. Random variations in temperature are apparent along the length of the fiber.
- FIG. 18 shows results when, with the heat still on (and no sand), a wet towel is applied directly to one section of tubing.
- the trough ( 70 ) at approximately 11 meters shows that thermal conductance of the tube has not significantly diffused the heat along it. Any “dead air” space in the tube has not produced a noticeable thermal barrier.
- FIG. 19 shows readings for the same configuration just described, but with another wet towel applied to a second spot.
- the trough ( 71 ) at approximately 5 meters indicates where the cooling effect of the second towel was registered by the DTS system.
- FIG. 20 shows the same system after it has nearly cooled to room temperature. The effect of the two wet regions is still evident from the two troughs.( 70 ′, 71 ′). The slight dip in the lead-in section is probably due to an ambient fluctuation.
- FIG. 21 shows the system after the towels are removed and sand is added in the region of about 7 meters.
- the system is heated, but no water is added.
- a trough ( 73 ) is apparent showing cooing associated with the application of the sand. This cooler region is due to the heat capacity of the sand.
- the residual effect of the towels is also apparent from the troughs ( 70 ′′, 71 ′′).
- FIG. 22 shows the system with the heat still on, after water was added over the sand at approximately 7 meters.
- the trough ( 73 ′) indicates enhanced cooling of that section of the cable.
- FIG. 23 shows results of a baseline measurement with the fiber and heater inside stainless steel tubing completely buried in a sandbox (with the exception that both end sections were left uncovered). In this test, the measurements were taken outside rather than inside the interior of a building, as was done for the previously discussed results. Temperature variations are apparent due to the unevenness of the plot, however the temperature variations are not surprising due to the less controlled environment. For this plot, neither heat nor water is applied.
- FIG. 24 shows results when heat is applied to the dry sand in the system configuration just described.
- An unheated portion of fiber optic precedes a peak ( 75 ) representing a hot section outside of the sand.
- FIG. 25 shows the results from the system with heat applied and water applied over one section of sand. Cooling is apparent from the trough ( 76 ) at approximately 15 meters.
- FIG. 26 illustrates results where more water is added over the same section. This forces water to contact two loops positioned below the loop closest to the top in the sandbox. As would be expected, the effect diminishes in strength and becomes more diffuse at lower levels indicated by troughs ( 77 , 78 ) correlating to those portions of the cable at about 11 meters and about 7 meters (but positioned, as noted, at a greater depth within the sandbox.
- FIG. 27 illustrates the basic arrangement for the test. It shows the DTS system 110 , inside of which is a so-called reference coil 112 maintained quite accurately in a chamber at 100 F. This 150-ft-long coil is necessary to convert raw signal to temperature according to principles known to those skilled in the art of distributed temperature sensing. Immediately outside the DTS system 110 is approximately 125 feet of optical fiber 120 connecting the DTS system 110 to the length of stainless-steel enclosed fiber 129 .
- the stainless-steel enclosed fiber is a length of optical fiber housed inside a stainless steel tube.
- the stainless-steel enclosed fiber 129 serves as the sensor element which runs in a serpentine fashion within a volume of soil 105 (viewed from above, in the Figure) about three feet under the soil surface. About half way along the sensor a short length 131 of the stainless steel tube emerges above the surface of the soil to serve as an electrically common point for the power supply 135 . At either end of the tube is also a short length 128 , 128 ′ above ground to allow for electrical connections.
- the entire length of optical fiber is about 750 feet. It should be noted that no attempt was made to achieve uniformity of the soil constituents nor uniformity of its moisture content. In fact, it had rained shortly before the test was conducted, and the test was begun only when the surface had dried out. Thus, for this test, the soil was basically uncontrolled.
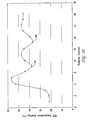
- FIG. 28 shows a temperature profile along the fiber before any heat was applied.
- the tubing enters the ground at about the 295-foot point and emerges at about the 745-foot point. At about the 515-foot point is the short loop mentioned earlier.
- the air temperature of about 65 F was higher than the typical underground temperature 81 .
- the spatial variations in temperature are not due to noise in the DTS system; they are real.
- the constancy of the DTS reference-coil temperature is evidence that when the temperature is held constant, the DTS so indicates.
- a coil of fiber was immersed in a water bath at constant temperature and the DTS system also indicated a constant temperature. Furthermore, these variations are not surprising in view of the uncontrolled nature of the soil.
- FIG. 29 shows the steady-state temperature profile with 151 volts applied.
- the constant reference coil 82 the lead-in 83 , and three hot spots. These are the sections of the tubing at either end 84 , 84 ′ and in the middle 85 that are in the air. Because they are not in contact with a large thermal mass, they are hotter than the fiber underground.
- FIG. 30 shows that the relationship between temperature rise and power at three points along the fiber (as indicated in FIG. 29) is, indeed, linear.
- the electrical resistance of the tubing was, incidentally, about 0.045 ohms/foot]
- the system is well behaved but depends in detail on the moisture content of the soil at a particular point.
- the figure also demonstrates that a considerable temperature rise is achievable using the tubing as a heater.
- FIG. 31 also shows that although the data collected is complex, they are interpretable and represent an ordered system. The system was allowed to cool nearly completely after 151 volts was applied. Then, 240 volts was applied and DTS temperature measurements were obtained at the same three points during its rise to apparent steady state and subsequent cooling, after the voltage was removed. All three curves are qualitatively similar; each can probably be characterized by its own time constant and peak temperature. Both parameters should be useful in inferring moisture content from the data.
- the steady-state temperature discussed here can only be a pseudo-steady state because the heating will eventually cause a reduction in moisture content.
- a true steady state is only achievable after all the moisture has disappeared.
- Such a state would yield no information of any value.
- the pseudo-steady state is both useful and long-lived.
Abstract
Description
Claims (15)
Priority Applications (1)
| Application Number | Priority Date | Filing Date | Title |
|---|---|---|---|
| US09/608,334 US6581445B1 (en) | 2000-06-29 | 2000-06-29 | Distributed fiber optic moisture intrusion sensing system |
Applications Claiming Priority (1)
| Application Number | Priority Date | Filing Date | Title |
|---|---|---|---|
| US09/608,334 US6581445B1 (en) | 2000-06-29 | 2000-06-29 | Distributed fiber optic moisture intrusion sensing system |
Publications (1)
| Publication Number | Publication Date |
|---|---|
| US6581445B1 true US6581445B1 (en) | 2003-06-24 |
Family
ID=24436013
Family Applications (1)
| Application Number | Title | Priority Date | Filing Date |
|---|---|---|---|
| US09/608,334 Expired - Lifetime US6581445B1 (en) | 2000-06-29 | 2000-06-29 | Distributed fiber optic moisture intrusion sensing system |
Country Status (1)
| Country | Link |
|---|---|
| US (1) | US6581445B1 (en) |
Cited By (22)
| Publication number | Priority date | Publication date | Assignee | Title |
|---|---|---|---|---|
| US20080073517A1 (en) * | 2006-09-13 | 2008-03-27 | Charles David Melville | Temperature adjustment in scanning beam devices |
| US20080165360A1 (en) * | 2007-01-10 | 2008-07-10 | University Of Washington | Scanning beam device calibration |
| US20080249369A1 (en) * | 2007-04-05 | 2008-10-09 | University Of Washington | Compact scanning fiber device |
| US20080281159A1 (en) * | 2007-05-08 | 2008-11-13 | University Of Washington | Coordinating image acquisition among multiple endoscopes |
| US20080281207A1 (en) * | 2007-05-08 | 2008-11-13 | University Of Washington | Image acquisition through filtering in multiple endoscope systems |
| US20080291597A1 (en) * | 2007-05-22 | 2008-11-27 | Seibel Eric J | Scanning beam device having different image acquisition modes |
| US20090026888A1 (en) * | 2007-07-25 | 2009-01-29 | University Of Washington | Actuating an optical fiber with a piezoelectric actuator and detecting voltages generated by the piezoelectric actuator |
| US20090103882A1 (en) * | 2006-12-15 | 2009-04-23 | Charles David Melville | Attaching optical fibers to actuator tubes with beads acting as spacers and adhesives |
| US7608842B2 (en) | 2007-04-26 | 2009-10-27 | University Of Washington | Driving scanning fiber devices with variable frequency drive signals |
| CN101858795A (en) * | 2010-05-10 | 2010-10-13 | 北京交通大学 | Method for testing temperature and humidity of concrete structure |
| US8411922B2 (en) | 2007-11-30 | 2013-04-02 | University Of Washington | Reducing noise in images acquired with a scanning beam device |
| US20140054021A1 (en) * | 2010-06-03 | 2014-02-27 | Lockheed Martin Corporation | Method and phase-change gain-fiber holder that control temperature rise and uniformity with minimal stress |
| US20150177107A1 (en) * | 2013-12-23 | 2015-06-25 | Exxonmobil Research And Engineering Company | Method and system for monitoring distillation tray performance |
| US9500554B2 (en) | 2013-03-28 | 2016-11-22 | Exxonmobil Research And Engineering Company | Method and system for detecting a leak in a pipeline |
| US9645002B2 (en) | 2013-03-28 | 2017-05-09 | Exxonmobil Research And Engineering Company | System and method for identifying levels or interfaces of media in a vessel |
| US9746434B2 (en) | 2013-03-28 | 2017-08-29 | Exxonmobil Research And Engineering Company | Method and system for determining flow distribution through a component |
| US9778115B2 (en) | 2013-03-28 | 2017-10-03 | Exxonmobil Research And Engineering Company | Method and system for detecting deposits in a vessel |
| US20180011002A1 (en) * | 2010-11-08 | 2018-01-11 | Silixa Ltd. | Fibre optic monitoring installation and method |
| US9880035B2 (en) | 2013-03-28 | 2018-01-30 | Exxonmobil Research And Engineering Company | Method and system for detecting coking growth and maldistribution in refinery equipment |
| CN110057854A (en) * | 2019-04-29 | 2019-07-26 | 河海大学 | A kind of test method of simulating drought desert Influence of Evaporation critical depth |
| US10634536B2 (en) | 2013-12-23 | 2020-04-28 | Exxonmobil Research And Engineering Company | Method and system for multi-phase flow measurement |
| CN112798475A (en) * | 2020-12-22 | 2021-05-14 | 西安科技大学 | Method, system and device for monitoring diffusion area of grouting slurry in rock-soil mass |
Citations (6)
| Publication number | Priority date | Publication date | Assignee | Title |
|---|---|---|---|---|
| US5005005A (en) * | 1986-03-10 | 1991-04-02 | Brossia Charles E | Fiber optic probe system |
| US5111525A (en) * | 1990-10-15 | 1992-05-05 | General Dynamics Corporation | Split-core fiber optic waveguide and sensor |
| US5287734A (en) * | 1992-02-13 | 1994-02-22 | Cuming Kenneth J | Thermal sensor |
| US5696863A (en) * | 1982-08-06 | 1997-12-09 | Kleinerman; Marcos Y. | Distributed fiber optic temperature sensors and systems |
| US5892176A (en) * | 1996-11-05 | 1999-04-06 | Phillip E. Pruett | Smooth surfaced fiber optic logging cable for well bores |
| US6167525A (en) * | 1997-02-26 | 2000-12-26 | Pirelli Cavi E Sistemi S.P.A. | Method and system for analysis of electric power transmission link status |
-
2000
- 2000-06-29 US US09/608,334 patent/US6581445B1/en not_active Expired - Lifetime
Patent Citations (6)
| Publication number | Priority date | Publication date | Assignee | Title |
|---|---|---|---|---|
| US5696863A (en) * | 1982-08-06 | 1997-12-09 | Kleinerman; Marcos Y. | Distributed fiber optic temperature sensors and systems |
| US5005005A (en) * | 1986-03-10 | 1991-04-02 | Brossia Charles E | Fiber optic probe system |
| US5111525A (en) * | 1990-10-15 | 1992-05-05 | General Dynamics Corporation | Split-core fiber optic waveguide and sensor |
| US5287734A (en) * | 1992-02-13 | 1994-02-22 | Cuming Kenneth J | Thermal sensor |
| US5892176A (en) * | 1996-11-05 | 1999-04-06 | Phillip E. Pruett | Smooth surfaced fiber optic logging cable for well bores |
| US6167525A (en) * | 1997-02-26 | 2000-12-26 | Pirelli Cavi E Sistemi S.P.A. | Method and system for analysis of electric power transmission link status |
Non-Patent Citations (5)
| Title |
|---|
| Distributed Temperature Sensing-DTS 800 Brochure by York Power Industry. |
| Distributed Temperature Sensing—DTS 800 Brochure by York Power Industry. |
| J. P. Dakin, Chapter 15-Distributed Optical Fiber Sensor Systems, Optical Fiber Sensors: Systems and Applications, edited by Brian Culshaw & John Dakin, vol. Two, Artech House, 1989 Pp. 575-587. |
| J. P. Dakin, Chapter 15—Distributed Optical Fiber Sensor Systems, Optical Fiber Sensors: Systems and Applications, edited by Brian Culshaw & John Dakin, vol. Two, Artech House, 1989 Pp. 575-587. |
| Technical Aspects of Optical Fibre Distributed Temperature Sensing, York Sensors Ltd. |
Cited By (33)
| Publication number | Priority date | Publication date | Assignee | Title |
|---|---|---|---|---|
| US7680373B2 (en) * | 2006-09-13 | 2010-03-16 | University Of Washington | Temperature adjustment in scanning beam devices |
| US20080073517A1 (en) * | 2006-09-13 | 2008-03-27 | Charles David Melville | Temperature adjustment in scanning beam devices |
| US7738762B2 (en) | 2006-12-15 | 2010-06-15 | University Of Washington | Attaching optical fibers to actuator tubes with beads acting as spacers and adhesives |
| US20090103882A1 (en) * | 2006-12-15 | 2009-04-23 | Charles David Melville | Attaching optical fibers to actuator tubes with beads acting as spacers and adhesives |
| US20080165360A1 (en) * | 2007-01-10 | 2008-07-10 | University Of Washington | Scanning beam device calibration |
| US8305432B2 (en) | 2007-01-10 | 2012-11-06 | University Of Washington | Scanning beam device calibration |
| US9066651B2 (en) | 2007-01-10 | 2015-06-30 | University Of Washington | Scanning beam device calibration |
| US9639934B2 (en) | 2007-01-10 | 2017-05-02 | University Of Washington | Scanning beam device calibration |
| US20080249369A1 (en) * | 2007-04-05 | 2008-10-09 | University Of Washington | Compact scanning fiber device |
| US7583872B2 (en) | 2007-04-05 | 2009-09-01 | University Of Washington | Compact scanning fiber device |
| US7608842B2 (en) | 2007-04-26 | 2009-10-27 | University Of Washington | Driving scanning fiber devices with variable frequency drive signals |
| US20080281207A1 (en) * | 2007-05-08 | 2008-11-13 | University Of Washington | Image acquisition through filtering in multiple endoscope systems |
| US20080281159A1 (en) * | 2007-05-08 | 2008-11-13 | University Of Washington | Coordinating image acquisition among multiple endoscopes |
| US20080291597A1 (en) * | 2007-05-22 | 2008-11-27 | Seibel Eric J | Scanning beam device having different image acquisition modes |
| US8212884B2 (en) | 2007-05-22 | 2012-07-03 | University Of Washington | Scanning beam device having different image acquisition modes |
| US8437587B2 (en) | 2007-07-25 | 2013-05-07 | University Of Washington | Actuating an optical fiber with a piezoelectric actuator and detecting voltages generated by the piezoelectric actuator |
| US20090026888A1 (en) * | 2007-07-25 | 2009-01-29 | University Of Washington | Actuating an optical fiber with a piezoelectric actuator and detecting voltages generated by the piezoelectric actuator |
| US8411922B2 (en) | 2007-11-30 | 2013-04-02 | University Of Washington | Reducing noise in images acquired with a scanning beam device |
| CN101858795A (en) * | 2010-05-10 | 2010-10-13 | 北京交通大学 | Method for testing temperature and humidity of concrete structure |
| US20140054021A1 (en) * | 2010-06-03 | 2014-02-27 | Lockheed Martin Corporation | Method and phase-change gain-fiber holder that control temperature rise and uniformity with minimal stress |
| US8923679B2 (en) * | 2010-06-03 | 2014-12-30 | Lockheed Martin Corporation | Method and phase-change gain-fiber holder that control temperature rise and uniformity with minimal stress |
| US20180011002A1 (en) * | 2010-11-08 | 2018-01-11 | Silixa Ltd. | Fibre optic monitoring installation and method |
| US10274417B2 (en) * | 2010-11-08 | 2019-04-30 | Silixa Ltd. | Fibre optic monitoring installation and method |
| US9880035B2 (en) | 2013-03-28 | 2018-01-30 | Exxonmobil Research And Engineering Company | Method and system for detecting coking growth and maldistribution in refinery equipment |
| US9746434B2 (en) | 2013-03-28 | 2017-08-29 | Exxonmobil Research And Engineering Company | Method and system for determining flow distribution through a component |
| US9778115B2 (en) | 2013-03-28 | 2017-10-03 | Exxonmobil Research And Engineering Company | Method and system for detecting deposits in a vessel |
| US9645002B2 (en) | 2013-03-28 | 2017-05-09 | Exxonmobil Research And Engineering Company | System and method for identifying levels or interfaces of media in a vessel |
| US9500554B2 (en) | 2013-03-28 | 2016-11-22 | Exxonmobil Research And Engineering Company | Method and system for detecting a leak in a pipeline |
| US9651415B2 (en) * | 2013-12-23 | 2017-05-16 | Exxonmobil Research And Engineering Company | Method and system for monitoring distillation tray performance |
| US20150177107A1 (en) * | 2013-12-23 | 2015-06-25 | Exxonmobil Research And Engineering Company | Method and system for monitoring distillation tray performance |
| US10634536B2 (en) | 2013-12-23 | 2020-04-28 | Exxonmobil Research And Engineering Company | Method and system for multi-phase flow measurement |
| CN110057854A (en) * | 2019-04-29 | 2019-07-26 | 河海大学 | A kind of test method of simulating drought desert Influence of Evaporation critical depth |
| CN112798475A (en) * | 2020-12-22 | 2021-05-14 | 西安科技大学 | Method, system and device for monitoring diffusion area of grouting slurry in rock-soil mass |
Similar Documents
| Publication | Publication Date | Title |
|---|---|---|
| US6581445B1 (en) | Distributed fiber optic moisture intrusion sensing system | |
| Gil-Rodríguez et al. | Application of active heat pulse method with fiber optic temperature sensing for estimation of wetting bulbs and water distribution in drip emitters | |
| He et al. | Distributed temperature sensing for soil physical measurements and its similarity to heat pulse method | |
| Weiss | Using fiber optics to detect moisture intrusion into a landfill cap consisting of a vegetative soil barrier | |
| US9500554B2 (en) | Method and system for detecting a leak in a pipeline | |
| CA2743846C (en) | High spatial resolution fiber optic temperature sensor | |
| EP1698890B1 (en) | System and method of downhole thermal property measurement | |
| EP3394584B1 (en) | Fibre optic temperature measurement | |
| Cao et al. | A distributed measurement method for in-situ soil moisture content by using carbon-fiber heated cable | |
| JP6816969B2 (en) | Methods and equipment for monitoring submarine cables | |
| WO2004094961A1 (en) | Fluid flow measurement using optical fibres | |
| GB2503498A (en) | Fibre optic sensing | |
| Cao et al. | Performance evaluation of two types of heated cables for distributed temperature sensing-based measurement of soil moisture content | |
| Agliata et al. | Non-invasive water content estimation in a tuff wall by DTS | |
| Leone | Advances in fiber optic sensors for soil moisture monitoring: A review | |
| US9651415B2 (en) | Method and system for monitoring distillation tray performance | |
| Liu et al. | In-situ soil dry density estimation using actively heated fiber-optic FBG method | |
| JP3416728B2 (en) | Long-distance geothermal property measurement device | |
| Saxena et al. | Studies on thermal profile measurement and fire detection in a power supply cable of a synchrotron radiation source by Raman optical fiber distributed temperature sensor system | |
| JPH0752126B2 (en) | Maximum temperature evaluation method for underground power cables | |
| JPH05107121A (en) | Measuring device | |
| JP4137524B2 (en) | Optical fiber freezing sensor | |
| Deans et al. | An analysis of a thermal imaging method for landmine detection using microwave heating | |
| JPH06214045A (en) | Fluid/flow sensor, and underground water investigating method using same | |
| Kasinathan et al. | Fiber optic sensors for nuclear power plant applications |
Legal Events
| Date | Code | Title | Description |
|---|---|---|---|
| AS | Assignment |
Owner name: SANDIA NATIONAL LABORATORIES, NEW MEXICO Free format text: ASSIGNMENT OF ASSIGNORS INTEREST;ASSIGNOR:WEISS, JONATHAN D.;REEL/FRAME:011399/0885 Effective date: 20000629 |
|
| AS | Assignment |
Owner name: ENERGY, U. S. DEPARTMENT OF, DISTRICT OF COLUMBIA Free format text: CONFIRMATORY LICENSE;ASSIGNOR:SANDIA CORPORATION;REEL/FRAME:012738/0180 Effective date: 20001212 |
|
| STCF | Information on status: patent grant |
Free format text: PATENTED CASE |
|
| FPAY | Fee payment |
Year of fee payment: 4 |
|
| FPAY | Fee payment |
Year of fee payment: 8 |
|
| FPAY | Fee payment |
Year of fee payment: 12 |
|
| AS | Assignment |
Owner name: NATIONAL TECHNOLOGY & ENGINEERING SOLUTIONS OF SAN Free format text: CHANGE OF NAME;ASSIGNOR:SANDIA CORPORATION;REEL/FRAME:044363/0108 Effective date: 20170501 |