US6301572B1 - Neural network based analysis system for vibration analysis and condition monitoring - Google Patents
Neural network based analysis system for vibration analysis and condition monitoring Download PDFInfo
- Publication number
- US6301572B1 US6301572B1 US09/204,334 US20433498A US6301572B1 US 6301572 B1 US6301572 B1 US 6301572B1 US 20433498 A US20433498 A US 20433498A US 6301572 B1 US6301572 B1 US 6301572B1
- Authority
- US
- United States
- Prior art keywords
- network
- circuitry
- information
- frequency domain
- vibration
- Prior art date
- Legal status (The legal status is an assumption and is not a legal conclusion. Google has not performed a legal analysis and makes no representation as to the accuracy of the status listed.)
- Expired - Lifetime
Links
Images


Classifications
-
- G—PHYSICS
- G01—MEASURING; TESTING
- G01H—MEASUREMENT OF MECHANICAL VIBRATIONS OR ULTRASONIC, SONIC OR INFRASONIC WAVES
- G01H1/00—Measuring characteristics of vibrations in solids by using direct conduction to the detector
-
- G—PHYSICS
- G01—MEASURING; TESTING
- G01H—MEASUREMENT OF MECHANICAL VIBRATIONS OR ULTRASONIC, SONIC OR INFRASONIC WAVES
- G01H1/00—Measuring characteristics of vibrations in solids by using direct conduction to the detector
- G01H1/003—Measuring characteristics of vibrations in solids by using direct conduction to the detector of rotating machines
Definitions
- the invention pertains to systems and methods of vibration analysis. More particularly, the invention pertains to such systems and methods which incorporate fuzzy adaptive resonance theory neural networks for distinguishing between normal and abnormal vibrations.
- Gas turbines engines and power generation such as the General Electric LM2500, are used in numerous marine applications and for power generation. This harsh environment demands early detection and analysis of impending turbine failure in order to prevent catastrophic failures which may endanger personnel as well as shipboard equipment.
- the current “state-of-the-art” monitoring equipment incorporates the Wigner-Ville Distribution (WVD).
- WVD Wigner-Ville Distribution
- the WVD monitors the once-per-rev vibration energy of the turbine components.
- the once-per-rev energy occurs at the frequency corresponding to the rotational velocity of the turbine.
- This type of system is being used by the US and Foreign navies to monitor the vibration of the LM2500 gas turbine.
- the existing system incorporates acceleration sensors that are mechanically connected to the turbine casing. These sensors provide an analog signals suitable for analysis. These signals are then fed into a data acquisition system to filter and digitize the signal.
- Sensor output signals are converted to the frequency domain.
- the conversion can be implemented using Fast Fourier Transform-type (FFT) processing.
- FFT Fast Fourier Transform-type
- the frequency domain representation can be processed by deleting those frequency components known to be of little or no interest.
- amplitudes of negative frequency components can be set to zero.
- Inverse FFT processing can then be carried out to produce a time domain signal having only frequencies of interest and no negative frequencies.
- the technique of isolating sections of the frequency domain signal to create only a few frequency components in the signal allows the WVD to be applied without any smoothing to reduce cross-term energy.
- the cross-term energy was controlled to occur in spectral locations that were not used in the analysis. This technique can be used in other analysis efforts with the WVD.
- the WVD thus provides a highly accurate measure of the turbine vibration amplitude at any instant. This has been used as an important feature in a condition-based monitoring application.
- the change can be recorded and used as a measure of turbine health. Steadily increasing vibration levels indicate deteriorating turbine health.
- the output of the WVD can be used with a thresholding algorithm to detect excessive once-per-rev (1X) vibration. Thresholding of the 1X vibration is used in many gas turbine installations. This allowed detection of deteriorating turbine condition. Ideally, the deterioration would be detected at an early enough stage to prevent catastrophic damage, and to schedule maintenance activities.
- the network uses a resonance concept that involves comparisons of new inputs to information that is already learned.
- Fuzzy ART is called an unsupervised neural network because the training set is presented to the network without information as to the desired classification. Instead, the network forms an internal representation of the data presented to it.
- a system and method for monitoring dynamic performance of an operating turbine utilizing at least one vibration sensor coupled to the turbine incorporate a pattern recognition subsystem.
- the output signals from the sensor can be transformed to a frequency domain using FFT-type processing. These frequency components can be used as inputs to a neural network.
- An inability to analyze a signal can be caused by the presence of noise or minor variations in signal or sensor data. These kinds of analysis have been shown to potentially benefit from the application of systems that can detect patterns in a signal or signals.
- One class of such a system is the neural network. This is a system which can be trained to “recognize” certain characteristics or trends in a signal.
- the neural network of the present system and method is the Fuzzy Adaptive Resonance Theory (Fuzzy ART) neural network.
- the Fuzzy ART is a type of adaptive resonance theory neural network that can examine new input data, and decide if its already-learned prototypes sufficiently match the input (resonate) and if so then the new input is learned.
- This network architecture is very good at novelty detection and can perform quick learning of new localized data without destroying the other stored information. This property eases the implementation of an on-line monitoring system, because retraining can occur in near real-time, as opposed to other neural networks that must have lengthy retraining to incorporate new information.
- a Fuzzy ART system as incorporated herein includes two major components, an attentional subsystem and an orienting subsystem.
- the attentional subsystem activates the system in response to the input vector.
- the orienting subsystem finds the correct internal representation of the new information.
- the F 0 input layer preprocesses the input layer vector, a, extending the representation of the input vector to allow the network to represent ranges of input vectors in a single neuron, as opposed to storing just a single vector.
- the F 1 activity layer determines the amount of activity present in the different neurons when an input vector is presented.
- the input vector is compared with the stored prototype information, using fuzzy arithmetic, to determine how close the new vector is to the stored prototype.
- the F 2 category layer retains the prototypes that are checked for resonance with the input vector.
- the F 1 and F 2 layers contain multiple neurons, but the F 0 layer contains one neuron.
- the activity layer weights are shown as W j and the prototype weights are shown as w j .
- the new input vector is compared, in the activity layer, F 1 to the long term memory (LTM) weights emanating from the prototype layer F 2 .
- Short term memory traces STM are thus generated.
- the orienting subsystem checks these STM traces to find the most active neurons. The amounts of resonance are also checked. If the neuron with the most activation does not have sufficient resonance, the orienting subsystem resets the network and a new neuron is chosen for resonance testing. The chosen neuron then adapts to learn any new information in the input.
- the neural network forms a multidimensional internal representation of the turbine operation. Operating conditions are learned and recorded in the neural memory. If new information that is close to the old information is learned, the network weights will modify slightly to adapt to the new data. For the weights to change, the new information must resonate with the old information already learned. The concept of resonance in fuzzy ART means that the information must be in close proximity to already-learned data. The degree of closeness is controlled by a parameter called vigilance.
- a turbine can be used for propulsion of a movable platform.
- Representative platforms include, without limitation, a marine platform, such as a boat or a ship, a land platform, such as a truck or a tracked vehicle, or an aircraft.
- the present vibration monitoring system can be carried by the respective platform coupled to the turbine.
- the system can be trained in general using data from normally functioning turbines of the same type as being monitored. Specific training using data from the actual turbine to be monitored can be used to bind the system to that particular turbine.
- a visual display coupled to the system, can be used to advise an operator of any developing, abnormal vibration patterns.
- a maintenance program can then be undertaken to correct the developing malfunction.
- FIG. 1 is a block diagram of a system for monitoring an operating unit in accordance with the invention
- FIGS. 2-4 taken together are a block diagram illustrating details of the Input Preprocessing block of FIG. 1;
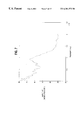
- FIG. 5 is a graph illustrating a typical turbine vibration signal
- FIG. 6 is a graph of a frequency domain representation of the time domain signal of FIG. 5;
- FIG. 7 is a graph of a frequency domain representation of the noise floor of the signal of FIG. 5;
- FIG. 8 is a graph of a frequency domain representation of the graph of FIG. 6 after additional processing
- FIG. 9 is a graph of a frequency domain representation of a normalized version of the graph of FIG. 8;
- FIG. 10 is a multi-dimensional graph of separation of frequency components
- FIG. 11 is a block diagram of Fuzzy ART layers
- FIG. 12 is a graph of an internal neural memory representation of a learned spectrum
- FIG. 13 is a graph based on the graph of FIG. 12 wherein the spectrum has been suppressed
- FIG. 14 is a graph indicating that a spectral change has occurred
- FIG. 15 illustrates a training process for the network
- FIG. 16 illustrates a process for monitoring trends in an operating unit
- FIG. 17 illustrates a process for retraining the network subsequent to conducting maintenance on the unit.
- This invention has applicability to many types of machinery, including jet engines, steam turbines, automobile engines, pumps, compressors, tank engine turbines, and gas turbines.
- the application of the invention to a gas turbine is described, in order to disclose a preferred embodiment and so as to enable one of skill to practice the invention.
- Other applications can be made by a person skilled in the art, based hereon, and familiar with the application area.
- FIG. 1 An overall block diagram of a system S is illustrated in FIG. 1 .
- the system S is carried on a movable platform P.
- the P is moved through a respective sea, land or atmospheric medium by a turbine 10 .
- An input preprocessing block is further described in FIG. 2, FIG. 3, and FIG. 4 .
- Transducer 12 Vibrations from turbine 10 are sensed by vibration transducers 12 .
- Transducer 12 generates a signal that is instantaneously proportional to a unit of vibration, whether displacement, velocity, or acceleration.
- Transducer 12 could be implemented as a laser non-contact interferometer system, a micro-electromechanical system, MEMS, sensor, a piezo-ceramic accelerometer, or other technology.
- transducer or sensor 12 is described as an accelerometer that produces an electrical voltage instantaneously proportional to the acceleration of the turbine at a given point in time.
- instantaneously proportional is meant that the output of the vibration sensor is not a statistically calculated value, such as root-mean-squared or average level of the vibration signal. Multiple sensors could be used if desired.
- the vibration sensor 12 must have sufficient bandwidth to capture desired information that is available in the vibration spectrum of the turbine. This information may include turbine blade-pass frequencies, harmonics of blade-pass frequencies, turbine once-per-rev frequencies, and their harmonics.
- the signal emanating from the vibration sensor 12 is a time domain voltage signal having a form similar to that illustrated in FIG. 5 .
- This signal is a time-domain composite of all the signals from each vibrating element in the turbine, that fall into the system's bandwidth.
- the Filter and Digitizer 14 accept the time domain information and condition it for digitization using the following process:
- a representative sampling rate would be 40,000 samples per second, with 16 bits of resolution where the highest frequency component of interest corresponded to 20 kHz.
- the filter could also be implemented as an analog/digital hybrid filter using over sampling and decimation.
- the Tachometers 46 measure the exact speed that rotating elements in the turbine are turning.
- Various technologies may be used for these tachometers, in the case of an LM2500 gas turbine, the tachometers are implemented using a magnetic gear-tooth sensor, and adjusted to yield digital pulses at a rate proportional to the turbine rotational frequency.
- tachometer output signals are converted to a digital number in a Tachometer Processing Block 48 .
- the digital tachometer values are updated each time the input digital signals are processed by the Fourier Transform 60 of FIG. 2 .
- the Frequency Domain Input Preprocessor Block 50 is illustrated in FIG. 2 .
- the input vibration signals and tachometer signals are prepared for analysis by the Fuzzy ART Neural Network 34 in the Frequency Domain Input Preprocessor.
- the outputs of the Frequency Domain Input Preprocessor are components of the Input Matrix 52 to the neural network.
- the Input Matrix contains a serialized version of the input spectrum, normalized to an amplitude range of [0,1] and loaded into a vector within the Input Matrix. In one embodiment, there are 65536 frequency elements in the input vector.
- the Input Matrix also receives a vector of frequency values that increment throughout all the frequencies covered by the normalized input spectrum. There is also a vector of individual case vigilance values that control the attention that the Fuzzy ART Neural Network devotes to each row in the Input Matrix.
- the Input Matrix also contains a submatrix that shifts the neural memory dimension of individual rows in the Input Matrix to especially highlight certain key spectral components. This process will greatly increase the learning speed of the Fuzzy ART Neural Network.
- FIG. 3 The internal algorithms and elements of the FIG. 2 processing of the time-domain input signal through to the Input Matrix V vector are illustrated in FIG. 3 . These include the Fourier Transform 60 , Spectrum Normalizer 62 and Serializer 64 . The input signal is transformed into the frequency domain, using the Fourier Transform.
- the frequency domain spectrum is then normalized to a [0,1] range in the Spectrum Normalizer 62 .
- the spectrum is presented to the Input Matrix in a serial fashion, represented by the Serializer 64 .
- the time domain signal is windowed using a Flat-Top Window 100 , see FIG. 3, to provide accurate signal amplitudes and minimize scalloping losses in the spectrum.
- the spectrum is converted from the complex number domain into real values by the Absolute Value block 104 .
- the frequency-domain signal is converted into a logarithmic representation 106 and made unipolar positive in block 108 .
- the signal spectrum now has a form as illustrated in FIG. 6 .
- the wavy noise baseline of FIG. 6 is removed in the steps to normalize the signal for input to the neural network.
- the spectrum is duplicated and one spectrum is processed by taking the FFT 110 of the spectrum, subtracting high-frequency components 112 , taking the inverse-FFT 114 , and converting the spectrum to real numbers 116 to get from a frequency spectrum representation of the noise floor.
- the noise floor calculated in this manner for the spectrum of FIG. 6 is illustrated in FIG. 7 .
- the noise-floor is then subtracted 118 from the original spectrum to remove variations in the level of the noise floor. Because this subtraction is performed using a logarithmic representation of the spectrum, the resulting signal consists of just the signal to noise ratio, SNR(k), of each component in the spectrum at frequency k. All dependence on transducer calibrations, gain and offset are removed by this step.
- each component of the spectrum is then divided 122 by the signal to noise ratio of the analog-to-digital converter circuitry to obtain a normalized signal with an amplitude range of [0,1].
- the final normalized signal is illustrated in FIG. 9 .
- the normalized spectrum is stored in the Input Matrix as a vector of values, with the zero-th value corresponding to the DC or 0-Hertz frequency and the N-th value corresponding to the maximum frequency in the spectrum.
- the maximum frequency was 20 kHz, and there were 65536 components in the frequency spectrum.
- individual case-based vigilance (also called indivigilance) values are determined for each component of the resulting spectrum, based on the amplitude of the component.
- indivigilance also called indivigilance
- the use of individual case-based vigilance enables the neural network to substantially completely ignore values that were of a low-enough amplitude to be within the noise floor, while paying close attention to higher amplitude information that may contain necessary spectral information.
- the cutoff for the noise floor was taken as a value at the point tangential to the knee of a histogram of signal amplitudes. Above the knee, the amplitudes were more signal-like and below the knee, the amplitudes were more noise-like.
- two different levels of individual case-based vigilance were used, one for signal-like, and one for noise like. Varying levels of indivigilance could also be used depending on the signal amplitude, or other information pertinent to the signal, such as its frequency.
- the indivigilance was stored in the Input Matrix in the r vector, in parallel with the vibration vector.
- the tachometer data was used by the Create Dimensional Shift Vector Block 70 to indicate the frequencies at which the turbine is spinning.
- Many features in the spectrum are directly related to these features, including once-per-rev vibration, blade-passing frequencies, gear mesh frequencies, sidebands of blade-pass frequencies, and oil-whirl. Some features in the spectrum tend to occur at certain fixed frequency ranges, such as combustion noise.
- the Spectral Features Memory 68 defines where these features exist in the spectrum.
- the dimensional shift is provided through a J matrix that is parallel to the other vectors in the Input Matrix.
- the features are aligned using the Current Turbine Speed Block 130 , see FIG. 4 .
- the spectral components of the features are separated, block 134 , by a dimensionality offset in a certain bandwidth around each feature.
- FIG. 10 An example of the separation of frequency spectrum information using dimensionality shift is illustrated in FIG. 10 .
- the a priori coding dimension of FIG. 10 is a linear representation of the multidimensional shift of different spectral components in the input to the neural network.
- the term ‘a priori’ signifies that it modifies the input to the neural network based upon previously known facts, such as the spectral features.
- Various sections of the spectrum are separated by a shift in the a priori coding dimension.
- Sensitivity to changes in the spectrum is an implementation choice.
- the sensitivity was chosen to be 5%, such that a change of 5% of full-scale of any component in the input spectrum, above the noise floor, would be detected.
- This parameter along with the number of Input Matrix dimensions, controls the vigilance values for the network.
- the vigilance required to detect a certain percentage change is M - ⁇ M ⁇ ⁇ 5 - 0.05 5 ⁇ ⁇ 0.99 ⁇ ⁇
- a dimensional shift is also created in a stair-step manner, 136 of FIG. 4, at periodic frequencies to help ensure separation of the information at those frequencies in the neural memory.
- the frequency period chosen for incrementing the dimensional shift was smaller than the smallest sideband separation that was expected in the spectrum.
- This stair-step fractional-dimension shift allows the Fuzzy ART neural network to learn the input information very rapidly because vigilance trials in the network are reduced.
- the dimensional shift is implemented as a small arithmetic change in the value of the input vectors that make up the J matrix.
- the spectral features are spread to different locations in neural memory using fractional analog dimensions 132 of FIG. 4 .
- the change in the dimension can be made to be smaller than a binary jump from 0 to 1.
- a fraction of a dimension is all that is required to implement a change greater than the sensitivity, ⁇ , of the system.
- a step of ⁇ fraction (1/19) ⁇ was chosen to exceed the ⁇ fraction (1/20) ⁇ step indicated by 5%.
- the Frequency Domain Input Processing section also creates an F vector in the Input Matrix. This vector is just a monotonically increasing vector 72 over the normalized range [ 0 , 1 ] to indicate the frequency corresponding to each row in the Input Matrix.
- the Input Matrix 52 serves as the input to the neural network for both training and on-line operation.
- the Input Matrix has the form:
- V vector of vibration velocities from spectrum
- the Time Domain Statistics Processing 22 provides further dimensions to the Input Matrix, if desired, to hold information pertinent to the signal statistics, such as : average, peak-to-peak, and root-mean-square (rms) values, crest factor, K-factor and kurtosis. These features help to classify the spectrum. These features will not change throughout the spectrum, and serve as a constant value over the processing of an Input Matrix particular to a given frequency spectrum.
- the Fuzzy ART Neural Network 34 is a type of Adaptive Resonance Technology, ART, neural network, modified in this case to accept individual case-based vigilance values, and to indicate when a novel case has been detected. Through the careful setting of the vigilance values, the network will detect a specified amount of change in any frequency spectrum or time domain component.
- the Fuzzy ART Neural Network is an established technology. Its use will be described here, as well as the modifications made to accomplish the requirements of this vibration analysis system. A short description of the network follows.
- a Fuzzy ART system consists of two major components, the attentional subsystem and the orienting subsystem.
- the attentional subsystem activates the system in response to each input vector, and the orienting subsystem finds the correct internal representation of the new information.
- Each Fuzzy ART input vector is a row from the Input Matrix 52 .
- the entire Input Matrix supplies all the training vectors for a single spectrum.
- Fuzzy ART creates two internal representations of vectors presented to the system. There is a long-term memory (LTM) layer that represents information that the system has learned and a short-term memory (STM) layer that perceives and internalizes new cases presented to the system.
- LTM long-term memory
- STM short-term memory
- the long-term memory is stored in neurons, that are also called processing elements (PEs), or nodes, contained in the F 2 layer.
- PEs processing elements
- the short-term memory is formed by neurons in the F 1 layer.
- the long-term memory neurons hold categories or templates that consist of hyper-cubic areas that encompass the region of the input space representing the category of information that it has learned.
- the short-term memory tests the input vectors for degree of match between the long-term memory and the input vector.
- the long-term memory makes up the Neural Memory 32 of the system.
- FIG. 11 illustrates the different Fuzzy ART layers, the short-term memory F 1 layer, long-term memory F 2 layer, the attentional subsystem, and the orienting subsystem.
- the F 0 layer shown in FIG. 11 provides preprocessing of the input vector to allow both low-amplitude and high-amplitude information to affect the network in the same manner.
- the input layer and the F 0 layer both consist of a single PE containing a vector representation of the input case.
- the F 1 and F 2 layers each contains a set of PEs.
- the F 2 layer contains the same number of PEs as the F 1 layer.
- Each PE in the F 1 and F 2 layers contains a vector of weights of the same dimensionality as the processed input vector Î ; in the F 0 layer.
- the number of weights in Î is twice the number of dimensions in the input vector I, due to complement encoding where each input value is subtracted from one to monitor positive going and negative-going changes, as per Fuzzy Art theory.
- the top-down weight vectors in the F 2 layer are called w j , with the j subscript signifying the neuron index number in the F 2 layer.
- the bottom-up weight vectors in the F 1 layer are called W j , with the j subscript signifying the PE index number in the F 1 layer.
- W j weights are the short-term memory traces, (STM) and the w j weights are the long-term memory traces, (LTM).
- FIG. 11 includes vigilance denoted by ⁇ .
- the vigilance controls how close the system pays attention to the input vector.
- the vigilance is set to a constant for the whole training set. This makes all patterns equal in regards to how closely the system learns the individual vectors.
- the amount of vigilance that each vector gets can be set on a per-case basis before input into the neural network.
- the case vigilance for input to the neural net can be set by hand, or modulated algorithmically, based upon features from the input case.
- FIG. 12 many small boxes i.e. 150 a , 150 b , 150 c , are constructed by the network around the higher amplitude peaks in the spectrum. Larger boxes, i.e. 150 d , are constructed around the noise information because noise information was learned with a lower vigilance value.
- a trace from neural memory without the superimposed spectrum is illustrated in FIG. 13 . Dimensionality shifts are not illustrated in these figures for clarity.
- FIG. 14 is a diagram illustrating a change, labeled “new point”, that has exceeded the classification region for a small section of the frequency spectrum. This is a change in a single element of the spectrum. This could indicate a catastrophic event such as a turbine blade crack, or a change of blade-set vibration over time.
- the system S takes advantage of a more sophisticated form of neural network, the Fuzzy ART, to permit fast incremental training without loss of previously learned information.
- New data detected by the network, modifies only a small portion of neural memory as opposed to requiring retraining of all the network weights as would occur in a back-propagation type of neural network.
- the learning characteristics of the Fuzzy ART neural network have been carefully characterized in order to prove the ability to detect a given change in spectrum components.
- the ability to detect changes in any component of the frequency spectrum allows a detailed condition-based maintenance program to be established.
- the turbine could be serviced when its parts start to wear.
- the Analysis System 36 accepts all the detected change data that occurs in on-line use of the turbine.
- the change data is correlated with the spectral features, or maintained as an unpredicted phenomemon. Increasing trends in spectral components can indicate need for maintenance action. A fast-changing trend in turbine vibration, that greatly exceeds the previously learned classification regions, can indicate a catastrophic event that should precipitate immediate action. These events would be determined in the Analysis System and transmitted to the Turbine Controller 44 for alarm or emergency shutdown of the turbine.
- the acceptance regions are learned automatically. They consist of the entire manifold of classification regions in neural memory. These classification regions are bound directly to the turbine to which the system is attached.
- FIG. 15 illustrates a Fuzzy ART algorithm for training the system S.
- the system is trained using vibration data from a turbine that is correctly operating, and installed in its intended environment.
- the classification regions are created in neural memory as the turbine is operated over its entire range of operating points.
- the information is stored in dimensionally separate locations in neural memory.
- the analysis region in neural memory is dynamically shifted as governed by the turbine operating point. Therefore, the turbine acceptance regions in the new system encompass the entire turbine operating envelope, thus increasing the coverage of the monitoring capability. The dependence upon a human operator to manually determine acceptance regions is removed.
- the entire 65536-point frequency spectrum required only 500 neurons to learn to detect 5% changes in the spectrum. This is a large compression of the data, but all spectral points are encompassed by classification regions. To learn the entire turbine operating envelope has been estimated to require 3 Mbytes of memory. This memory would be implemented in nonvolatile fast memory.
- the system S can monitor thousands of components in the spectrum, and detect changes throughout the spectrum, not just at a few predetermined frequencies. It is highly tuned to an individual turbine, and would remain with the turbine through long periods of operating lifetime.
- the analysis system detects trends in vibration response of components in the spectrum. Trends are detected by monitoring the novel cases in the input spectrum, as illustrated in FIG. 16 .
- the novel cases can be learned in order to provide on-line adaptation to changes in the turbine spectrum.
- Increasing trends in blade-pass vibrations can indicate damage to the blade-set, as can increasing sidebands related to the blade-pass frequencies.
- the trending system may be constructed using an expert system to determine if known scenarios in the trends are present, indicative of excessive wear.
- Other technologies include fuzzy logic detector systems to gauge the amount of wear present, as gauged by the changes in spectral component amplitude. The amount of wear present in various components can be summed to give an overall estimate of turbine health, with a threshold provided for the initiation of maintenance actions.
- the system S After maintenance actions have been taken to correct turbine damage or wear, the system S will be automatically retrained with the new turbine spectral signatures by resetting the neural memory and running the turbine through its various operating modes. This process is illustrated in FIG. 17 .
- the retraining enables the system S to adapt to any changes in the spectrum resulting from the maintenance action.
- a Display System 40 that is driven by the neural network output and/or analysis system can display the current operating condition of the turbine, the accumulated changes in various spectral components since the turbine spectrum was first learned, and any alarms, predictions, or trends detected by the analysis system.
- the display can enable a human operator to distinguish between a normal operating condition of the turbine, and a damaged or deteriorating turbine, based upon highlighted changes from the baseline spectrum.
- Outputs 42 to external processing, illustrated in FIG. 1, can include data related to individual turbine wear, or damage.
- the data can be collected and combined with operating data from multiple turbines to create a general library of operating characteristics of a class of turbines.
- the data has been collected from identical monitoring systems, such as the system S, the information is easily combined in training sets. Data related to many types of turbine malfunctions can be collected. This will enable more accurate, automatic diagnosis of turbine faults as the combined data is disseminated to the monitoring systems in service.
- Malfunctions in the turbine that can be distinguished in the vibration spectrum can be collected and tagged as appropriate to the malfunction.
- the information would then be trained in the neural network. When the appropriate neurons are activated, an output would be transmitted to the analysis system to indicate that a known problem has been detected.
- the system S can be implemented on a single digital signal processing, DSP, circuit card. All neural processing can be done using a DSP microprocessor, accessing memory on-line, with an ethernet connection to external processors.
- the system S can alternately be implemented within a general purpose desktop or laptop computer, using internal RAM for storage while providing communication and display capabilities intrinsic to the computer.
- a signal acquisition and digitization system can be installed in the computer or interfaced to the computer from an external electronics module.
- Alternative, separate processing units could be created for each of the subsystems, including FFT, Neural Net, Analysis System, and analog processing.
- Desktop computer installations would be suitable for power-plant operation. Embedded and ruggedized implementations would be appropriate for aerospace propulsion engine use, such as for jet aircraft, and marine ships.
- External processing and data archival systems could be set up for the purpose of combining the information that was automatically learned by the distributed neural network systems. This information could be redistributed to the various installations as important failure characteristics are learned, thus increasing the on-line knowledge of all the installations.
- Various sensor types could be used, including accelerometers, laser non-contact vibration sensors, microelectromechanical systems, MEMS, and fiber-optic based vibration sensors, without departing from the spirit and scope of the present invention.
- Various display mechanisms could be employed, including flat-panel displays, cathode ray tubes, and Light Emitting Diode indicators.
- Alarm mechanisms for excessive vibration could include flashing lights, and siren horns. Failure data could be transmitted through electronic mail to remote locations. The trending data could be accessed over the world wide web using Java applets.
Abstract
A system and a method for tracking long term performance of a vibrating body such as a gas turbine, includes a vibration sensor who time domain outputs are transformed to the frequency domain, using a fast Fourier transform processing. Frequency domain outputs are provided as inputs to a fuzzy adaptive resonance theory neural network. Outputs from the network can be coupled to an expert system for analysis, to display devices for presentation to an operator or are available for other control and information purposes.
Description
The invention pertains to systems and methods of vibration analysis. More particularly, the invention pertains to such systems and methods which incorporate fuzzy adaptive resonance theory neural networks for distinguishing between normal and abnormal vibrations.
Gas turbines engines and power generation, such as the General Electric LM2500, are used in numerous marine applications and for power generation. This harsh environment demands early detection and analysis of impending turbine failure in order to prevent catastrophic failures which may endanger personnel as well as shipboard equipment.
The current “state-of-the-art” monitoring equipment incorporates the Wigner-Ville Distribution (WVD). The WVD monitors the once-per-rev vibration energy of the turbine components.
The once-per-rev energy occurs at the frequency corresponding to the rotational velocity of the turbine. This type of system is being used by the US and Foreign navies to monitor the vibration of the LM2500 gas turbine.
The existing system incorporates acceleration sensors that are mechanically connected to the turbine casing. These sensors provide an analog signals suitable for analysis. These signals are then fed into a data acquisition system to filter and digitize the signal.
Sensor output signals are converted to the frequency domain. In one aspect, the conversion can be implemented using Fast Fourier Transform-type (FFT) processing. The frequency domain representation can be processed by deleting those frequency components known to be of little or no interest.
In addition, the amplitudes of negative frequency components can be set to zero. Inverse FFT processing can then be carried out to produce a time domain signal having only frequencies of interest and no negative frequencies.
The technique of isolating sections of the frequency domain signal to create only a few frequency components in the signal allows the WVD to be applied without any smoothing to reduce cross-term energy. The cross-term energy was controlled to occur in spectral locations that were not used in the analysis. This technique can be used in other analysis efforts with the WVD.
The WVD thus provides a highly accurate measure of the turbine vibration amplitude at any instant. This has been used as an important feature in a condition-based monitoring application.
As the vibration level changes under identical operating conditions, the change can be recorded and used as a measure of turbine health. Steadily increasing vibration levels indicate deteriorating turbine health.
The output of the WVD can be used with a thresholding algorithm to detect excessive once-per-rev (1X) vibration. Thresholding of the 1X vibration is used in many gas turbine installations. This allowed detection of deteriorating turbine condition. Ideally, the deterioration would be detected at an early enough stage to prevent catastrophic damage, and to schedule maintenance activities.
Complex signals have been processed by neural networks. One known form of a neural net is the Fuzzy Adaptive Resonance Theory, Fuzzy (ART) neural network.
This is a neural network architecture developed by Stephen Grossberg and Gail A. Carpenter of the Department of Cognitive and Neural Systems at Boston University. The network uses a resonance concept that involves comparisons of new inputs to information that is already learned.
If the new input is sufficiently close to the old information, then resonance occurs and the network will adapt to learn the new information. The first implementations of ART operated only on binary (0 or 1) data. The theory has been extended to accommodate analog input values of the range zero to one, using Fuzzy ART. The “Fuzzy” prefix implies that the input numbers are analog; no fuzzy logic connotations need be ascribed to the numbers. The system learns to recognize analog values within subsets of its total input space. The information that is presented to the network occupies a section of the input space corresponding to the amplitude of the information.
Fuzzy ART is called an unsupervised neural network because the training set is presented to the network without information as to the desired classification. Instead, the network forms an internal representation of the data presented to it.
While the known vibration analysis systems have generally been effective for their intended purpose, it would be desirable to improve the accuracy and extent of the analysis. In this regard, it would be desirable to be able to detect the presence of non-stationary frequency components. It would also be desirable to be able to eliminate frequency components not of interest.
It would also be desirable to be able to characterize, in some sense, a particular turbine and then monitor, over time the performance of that unit. In this fashion, deviations from expected performance should be detectable at an early enough stage to avoid the occurrence of catastrophic failures. Detected deteriorating performance can trigger unit maintenance.
A system and method for monitoring dynamic performance of an operating turbine utilizing at least one vibration sensor coupled to the turbine incorporate a pattern recognition subsystem. The output signals from the sensor can be transformed to a frequency domain using FFT-type processing. These frequency components can be used as inputs to a neural network.
The solutions to many data analysis problems have been shown to be non-algorithmic in nature. That is, they cannot be described or predicted through application of repetitive numerical manipulation or analysis.
An inability to analyze a signal can be caused by the presence of noise or minor variations in signal or sensor data. These kinds of analysis have been shown to potentially benefit from the application of systems that can detect patterns in a signal or signals. One class of such a system is the neural network. This is a system which can be trained to “recognize” certain characteristics or trends in a signal.
In a preferred embodiment, the neural network of the present system and method is the Fuzzy Adaptive Resonance Theory (Fuzzy ART) neural network. The Fuzzy ART is a type of adaptive resonance theory neural network that can examine new input data, and decide if its already-learned prototypes sufficiently match the input (resonate) and if so then the new input is learned.
This network architecture is very good at novelty detection and can perform quick learning of new localized data without destroying the other stored information. This property eases the implementation of an on-line monitoring system, because retraining can occur in near real-time, as opposed to other neural networks that must have lengthy retraining to incorporate new information.
A Fuzzy ART system as incorporated herein includes two major components, an attentional subsystem and an orienting subsystem. The attentional subsystem activates the system in response to the input vector. The orienting subsystem finds the correct internal representation of the new information.
Each input vector presented to the network enters through the Input Layer. The F0 input layer preprocesses the input layer vector, a, extending the representation of the input vector to allow the network to represent ranges of input vectors in a single neuron, as opposed to storing just a single vector.
The F1 activity layer determines the amount of activity present in the different neurons when an input vector is presented. In the F1 layer, the input vector is compared with the stored prototype information, using fuzzy arithmetic, to determine how close the new vector is to the stored prototype.
The F2 category layer retains the prototypes that are checked for resonance with the input vector. The F1 and F2 layers contain multiple neurons, but the F0 layer contains one neuron. In FIG. 11, the activity layer weights are shown as Wj and the prototype weights are shown as wj.
In operation, the new input vector is compared, in the activity layer, F1 to the long term memory (LTM) weights emanating from the prototype layer F2. Short term memory traces (STM) are thus generated. The orienting subsystem checks these STM traces to find the most active neurons. The amounts of resonance are also checked. If the neuron with the most activation does not have sufficient resonance, the orienting subsystem resets the network and a new neuron is chosen for resonance testing. The chosen neuron then adapts to learn any new information in the input.
The neural network forms a multidimensional internal representation of the turbine operation. Operating conditions are learned and recorded in the neural memory. If new information that is close to the old information is learned, the network weights will modify slightly to adapt to the new data. For the weights to change, the new information must resonate with the old information already learned. The concept of resonance in fuzzy ART means that the information must be in close proximity to already-learned data. The degree of closeness is controlled by a parameter called vigilance.
In one embodiment, a turbine can be used for propulsion of a movable platform. Representative platforms include, without limitation, a marine platform, such as a boat or a ship, a land platform, such as a truck or a tracked vehicle, or an aircraft. The present vibration monitoring system can be carried by the respective platform coupled to the turbine.
In accordance herewith the system can be trained in general using data from normally functioning turbines of the same type as being monitored. Specific training using data from the actual turbine to be monitored can be used to bind the system to that particular turbine.
A visual display, coupled to the system, can be used to advise an operator of any developing, abnormal vibration patterns. A maintenance program can then be undertaken to correct the developing malfunction.
Numerous other advantages and features of the present invention will become readily apparent from the following detailed description of the invention and the embodiments thereof, from the claims and from the accompanying drawings.
FIG. 1 is a block diagram of a system for monitoring an operating unit in accordance with the invention;
FIGS. 2-4 taken together are a block diagram illustrating details of the Input Preprocessing block of FIG. 1;
FIG. 5 is a graph illustrating a typical turbine vibration signal;
FIG. 6 is a graph of a frequency domain representation of the time domain signal of FIG. 5;
FIG. 7 is a graph of a frequency domain representation of the noise floor of the signal of FIG. 5;
FIG. 8 is a graph of a frequency domain representation of the graph of FIG. 6 after additional processing;
FIG. 9 is a graph of a frequency domain representation of a normalized version of the graph of FIG. 8;
FIG. 10 is a multi-dimensional graph of separation of frequency components;
FIG. 11 is a block diagram of Fuzzy ART layers;
FIG. 12 is a graph of an internal neural memory representation of a learned spectrum;
FIG. 13 is a graph based on the graph of FIG. 12 wherein the spectrum has been suppressed;
FIG. 14 is a graph indicating that a spectral change has occurred;
FIG. 15 illustrates a training process for the network;
FIG. 16 illustrates a process for monitoring trends in an operating unit; and
FIG. 17 illustrates a process for retraining the network subsequent to conducting maintenance on the unit.
While this invention is susceptible of embodiment in many different forms, there are shown in the drawing and will be described herein in detail specific embodiments thereof with the understanding that the present disclosure is to be considered as an exemplification of the principles of the invention and is not intended to limit the invention to the specific embodiments illustrated.
This invention has applicability to many types of machinery, including jet engines, steam turbines, automobile engines, pumps, compressors, tank engine turbines, and gas turbines. In this description, the application of the invention to a gas turbine is described, in order to disclose a preferred embodiment and so as to enable one of skill to practice the invention. Other applications can be made by a person skilled in the art, based hereon, and familiar with the application area.
An overall block diagram of a system S is illustrated in FIG. 1. The system S is carried on a movable platform P. The P is moved through a respective sea, land or atmospheric medium by a turbine 10. An input preprocessing block is further described in FIG. 2, FIG. 3, and FIG. 4.
Vibrations from turbine 10 are sensed by vibration transducers 12. Transducer 12 generates a signal that is instantaneously proportional to a unit of vibration, whether displacement, velocity, or acceleration. Transducer 12 could be implemented as a laser non-contact interferometer system, a micro-electromechanical system, MEMS, sensor, a piezo-ceramic accelerometer, or other technology.
In this embodiment, and without limitation, transducer or sensor 12 is described as an accelerometer that produces an electrical voltage instantaneously proportional to the acceleration of the turbine at a given point in time. By the term ‘instantaneously proportional’ is meant that the output of the vibration sensor is not a statistically calculated value, such as root-mean-squared or average level of the vibration signal. Multiple sensors could be used if desired.
The vibration sensor 12 must have sufficient bandwidth to capture desired information that is available in the vibration spectrum of the turbine. This information may include turbine blade-pass frequencies, harmonics of blade-pass frequencies, turbine once-per-rev frequencies, and their harmonics.
The signal emanating from the vibration sensor 12 is a time domain voltage signal having a form similar to that illustrated in FIG. 5. This signal is a time-domain composite of all the signals from each vibrating element in the turbine, that fall into the system's bandwidth.
The Filter and Digitizer 14 accept the time domain information and condition it for digitization using the following process:
1. Impedance match and amplify the vibration signal from sensor 12.
2. Low-pass filter the signal using an anti-aliasing filter. This removes high-frequency information from above the maximum vibration frequency being examined. The out-of-band frequencies will then not corrupt the in-band frequencies during the digitization process.
3. Digitize the signal using a suitable sampling rate and precision to gather all the frequency information in the signal. A representative sampling rate would be 40,000 samples per second, with 16 bits of resolution where the highest frequency component of interest corresponded to 20 kHz.
The filter could also be implemented as an analog/digital hybrid filter using over sampling and decimation.
The Tachometers 46 measure the exact speed that rotating elements in the turbine are turning. Various technologies may be used for these tachometers, in the case of an LM2500 gas turbine, the tachometers are implemented using a magnetic gear-tooth sensor, and adjusted to yield digital pulses at a rate proportional to the turbine rotational frequency.
These tachometer output signals are converted to a digital number in a Tachometer Processing Block 48. The digital tachometer values are updated each time the input digital signals are processed by the Fourier Transform 60 of FIG. 2.
The Frequency Domain Input Preprocessor Block 50 is illustrated in FIG. 2. The input vibration signals and tachometer signals are prepared for analysis by the Fuzzy ART Neural Network 34 in the Frequency Domain Input Preprocessor. The outputs of the Frequency Domain Input Preprocessor are components of the Input Matrix 52 to the neural network.
The Input Matrix contains a serialized version of the input spectrum, normalized to an amplitude range of [0,1] and loaded into a vector within the Input Matrix. In one embodiment, there are 65536 frequency elements in the input vector.
The Input Matrix also receives a vector of frequency values that increment throughout all the frequencies covered by the normalized input spectrum. There is also a vector of individual case vigilance values that control the attention that the Fuzzy ART Neural Network devotes to each row in the Input Matrix.
The Input Matrix also contains a submatrix that shifts the neural memory dimension of individual rows in the Input Matrix to especially highlight certain key spectral components. This process will greatly increase the learning speed of the Fuzzy ART Neural Network.
The internal algorithms and elements of the FIG. 2 processing of the time-domain input signal through to the Input Matrix V vector are illustrated in FIG. 3. These include the Fourier Transform 60, Spectrum Normalizer 62 and Serializer 64. The input signal is transformed into the frequency domain, using the Fourier Transform.
The frequency domain spectrum is then normalized to a [0,1] range in the Spectrum Normalizer 62. The spectrum is presented to the Input Matrix in a serial fashion, represented by the Serializer 64.
Before being input to the Fast Fourier Transform, FFT, 60, the time domain signal is windowed using a Flat-Top Window 100, see FIG. 3, to provide accurate signal amplitudes and minimize scalloping losses in the spectrum. The spectrum is converted from the complex number domain into real values by the Absolute Value block 104. Then the frequency-domain signal is converted into a logarithmic representation 106 and made unipolar positive in block 108. The signal spectrum now has a form as illustrated in FIG. 6.
The wavy noise baseline of FIG. 6 is removed in the steps to normalize the signal for input to the neural network. The spectrum is duplicated and one spectrum is processed by taking the FFT 110 of the spectrum, subtracting high-frequency components 112, taking the inverse-FFT 114, and converting the spectrum to real numbers 116 to get from a frequency spectrum representation of the noise floor.
The noise floor, calculated in this manner for the spectrum of FIG. 6 is illustrated in FIG. 7. The noise-floor is then subtracted 118 from the original spectrum to remove variations in the level of the noise floor. Because this subtraction is performed using a logarithmic representation of the spectrum, the resulting signal consists of just the signal to noise ratio, SNR(k), of each component in the spectrum at frequency k. All dependence on transducer calibrations, gain and offset are removed by this step.
All negative values are set to zero 120. These negative values are of the lowest amplitude noise, and not pertinent to the system processing. This establishes the zero-level noise floor. The signal spectrum now has a form as illustrated in FIG. 8.
To complete the signal standardization, each component of the spectrum is then divided 122 by the signal to noise ratio of the analog-to-digital converter circuitry to obtain a normalized signal with an amplitude range of [0,1]. The final normalized signal is illustrated in FIG. 9.
The normalized spectrum is stored in the Input Matrix as a vector of values, with the zero-th value corresponding to the DC or 0-Hertz frequency and the N-th value corresponding to the maximum frequency in the spectrum. In one implementation, the maximum frequency was 20 kHz, and there were 65536 components in the frequency spectrum.
Although there were 65536 components in the frequency spectrum, the use of cased-base vigilance results in the network requiring only 500 neurons to represent an entire 65536-point spectrum of turbine vibration. The vector in the Input Matrix was designated V to signify the vibration signal vector.
For processing in the Fuzzy ART Neural Network 34, individual case-based vigilance (also called indivigilance) values are determined for each component of the resulting spectrum, based on the amplitude of the component. The use of individual case-based vigilance enables the neural network to substantially completely ignore values that were of a low-enough amplitude to be within the noise floor, while paying close attention to higher amplitude information that may contain necessary spectral information.
The cutoff for the noise floor was taken as a value at the point tangential to the knee of a histogram of signal amplitudes. Above the knee, the amplitudes were more signal-like and below the knee, the amplitudes were more noise-like.
In the illustrated embodiment, two different levels of individual case-based vigilance were used, one for signal-like, and one for noise like. Varying levels of indivigilance could also be used depending on the signal amplitude, or other information pertinent to the signal, such as its frequency. The indivigilance was stored in the Input Matrix in the r vector, in parallel with the vibration vector.
With reference to FIG. 2, the tachometer data was used by the Create Dimensional Shift Vector Block 70 to indicate the frequencies at which the turbine is spinning. Many features in the spectrum are directly related to these features, including once-per-rev vibration, blade-passing frequencies, gear mesh frequencies, sidebands of blade-pass frequencies, and oil-whirl. Some features in the spectrum tend to occur at certain fixed frequency ranges, such as combustion noise.
The use of dimensional shift enables the neural network to separate the information pertaining to these features into separate sections of memory. In this way, the network will not confuse these special inputs with other spectral elements.
The Spectral Features Memory 68 defines where these features exist in the spectrum. The dimensional shift is provided through a J matrix that is parallel to the other vectors in the Input Matrix.
For the spectral features that occupy frequency bands that move in the spectrum with respect to the turbine speed, as sensed through the tachometers, the features are aligned using the Current Turbine Speed Block 130, see FIG. 4. The spectral components of the features are separated, block 134, by a dimensionality offset in a certain bandwidth around each feature.
An example of the separation of frequency spectrum information using dimensionality shift is illustrated in FIG. 10. The a priori coding dimension of FIG. 10 is a linear representation of the multidimensional shift of different spectral components in the input to the neural network. The term ‘a priori’ signifies that it modifies the input to the neural network based upon previously known facts, such as the spectral features. Various sections of the spectrum are separated by a shift in the a priori coding dimension.
Sensitivity to changes in the spectrum is an implementation choice. In one embodiment, the sensitivity was chosen to be 5%, such that a change of 5% of full-scale of any component in the input spectrum, above the noise floor, would be detected. This parameter, along with the number of Input Matrix dimensions, controls the vigilance values for the network. The vigilance required to detect a certain percentage change is 
where M is the number of input dimensions, and Δ is the change amount with 0.05 corresponding to a 5% change. The individual case-based vigilance is shown as ρ. This equation shows that ρ must be greater than 0.99 to detect a 5% change in amplitude of a frequency component.
A dimensional shift is also created in a stair-step manner, 136 of FIG. 4, at periodic frequencies to help ensure separation of the information at those frequencies in the neural memory. The frequency period chosen for incrementing the dimensional shift was smaller than the smallest sideband separation that was expected in the spectrum. This stair-step fractional-dimension shift allows the Fuzzy ART neural network to learn the input information very rapidly because vigilance trials in the network are reduced.
The dimensional shift is implemented as a small arithmetic change in the value of the input vectors that make up the J matrix. The spectral features are spread to different locations in neural memory using fractional analog dimensions 132 of FIG. 4.
Because the inputs to the Fuzzy ART Neural Network are analog numbers of the range [0,1], the change in the dimension can be made to be smaller than a binary jump from 0 to 1. A fraction of a dimension is all that is required to implement a change greater than the sensitivity, Δ, of the system. There are 20 increments of 5% within the range [0,1]. Thus, for a 5% change, a step of {fraction (1/19)} was chosen to exceed the {fraction (1/20)} step indicated by 5%.
There are multiple vectors in the J matrix. When the first vector overflows, the next vector is incremented by {fraction (1/19)}, and the first vector is again run up through the range [0,1]. This allows an arbitrary number of fractional-dimension shifts to be made while requiring only d/j vectors in the J matrix, where d is the number of separations in neural memory required, and j is the modulus, or number of fractional-dimension shifts capable of being fit into a single dimension (19 in this case).
The Frequency Domain Input Processing section also creates an F vector in the Input Matrix. This vector is just a monotonically increasing vector 72 over the normalized range [0,1 ] to indicate the frequency corresponding to each row in the Input Matrix.
The Input Matrix 52 serves as the input to the neural network for both training and on-line operation. The Input Matrix has the form:

where
I=Input Matrix of input cases
r=vector of case vigilances
F=vector of frequencies from spectrum
V=vector of vibration velocities from spectrum
J=matrix of fractional—dimension separations
ρ=individual case vigilance
P=number of input cases in I
The Time Domain Statistics Processing 22 provides further dimensions to the Input Matrix, if desired, to hold information pertinent to the signal statistics, such as : average, peak-to-peak, and root-mean-square (rms) values, crest factor, K-factor and kurtosis. These features help to classify the spectrum. These features will not change throughout the spectrum, and serve as a constant value over the processing of an Input Matrix particular to a given frequency spectrum.
The Fuzzy ART Neural Network 34 is a type of Adaptive Resonance Technology, ART, neural network, modified in this case to accept individual case-based vigilance values, and to indicate when a novel case has been detected. Through the careful setting of the vigilance values, the network will detect a specified amount of change in any frequency spectrum or time domain component.
The Fuzzy ART Neural Network is an established technology. Its use will be described here, as well as the modifications made to accomplish the requirements of this vibration analysis system. A short description of the network follows.
A Fuzzy ART system consists of two major components, the attentional subsystem and the orienting subsystem. The attentional subsystem activates the system in response to each input vector, and the orienting subsystem finds the correct internal representation of the new information. Each Fuzzy ART input vector is a row from the Input Matrix 52. The entire Input Matrix supplies all the training vectors for a single spectrum.
Fuzzy ART creates two internal representations of vectors presented to the system. There is a long-term memory (LTM) layer that represents information that the system has learned and a short-term memory (STM) layer that perceives and internalizes new cases presented to the system.
The long-term memory is stored in neurons, that are also called processing elements (PEs), or nodes, contained in the F2 layer. The short-term memory is formed by neurons in the F1 layer.
The long-term memory neurons hold categories or templates that consist of hyper-cubic areas that encompass the region of the input space representing the category of information that it has learned. The short-term memory tests the input vectors for degree of match between the long-term memory and the input vector. The long-term memory makes up the Neural Memory 32 of the system.
FIG. 11 illustrates the different Fuzzy ART layers, the short-term memory F1 layer, long-term memory F2 layer, the attentional subsystem, and the orienting subsystem. The F0 layer shown in FIG. 11 provides preprocessing of the input vector to allow both low-amplitude and high-amplitude information to affect the network in the same manner. The input layer and the F0 layer both consist of a single PE containing a vector representation of the input case.
The F1 and F2 layers each contains a set of PEs. The F2 layer contains the same number of PEs as the F1 layer. Each PE in the F1 and F2 layers contains a vector of weights of the same dimensionality as the processed input vector Î ; in the F0 layer. The number of weights in Î ; is twice the number of dimensions in the input vector I, due to complement encoding where each input value is subtracted from one to monitor positive going and negative-going changes, as per Fuzzy Art theory.
The top-down weight vectors in the F2 layer are called wj, with the j subscript signifying the neuron index number in the F2 layer. The bottom-up weight vectors in the F1 layer are called Wj, with the j subscript signifying the PE index number in the F1 layer. For each F2 node, wj, there is a corresponding F1 node, Wj. The Wj weights are the short-term memory traces, (STM) and the wj weights are the long-term memory traces, (LTM).
FIG. 11 includes vigilance denoted by ρ. The vigilance controls how close the system pays attention to the input vector. Generally, the vigilance is set to a constant for the whole training set. This makes all patterns equal in regards to how closely the system learns the individual vectors. By using a priori knowledge about the distribution of the input information, the amount of vigilance that each vector gets can be set on a per-case basis before input into the neural network. The case vigilance for input to the neural net can be set by hand, or modulated algorithmically, based upon features from the input case.
Applying the input matrix to the Fuzzy ART neural network allows the network to detect all the information in the spectrum, and make classification regions around each point in the spectrum. The internal neural memory representation of a learned spectrum can be seen in FIG. 12, which shows the classification regions superimposed on the normalized spectrum.
In FIG. 12, many small boxes i.e. 150 a, 150 b, 150 c, are constructed by the network around the higher amplitude peaks in the spectrum. Larger boxes, i.e. 150 d, are constructed around the noise information because noise information was learned with a lower vigilance value. A trace from neural memory without the superimposed spectrum is illustrated in FIG. 13. Dimensionality shifts are not illustrated in these figures for clarity.
After a spectrum has been learned by the neural network, changes in the spectrum are detectable. These changes are detected through the novelty-detector capability of the Fuzzy ART neural network.
FIG. 14 is a diagram illustrating a change, labeled “new point”, that has exceeded the classification region for a small section of the frequency spectrum. This is a change in a single element of the spectrum. This could indicate a catastrophic event such as a turbine blade crack, or a change of blade-set vibration over time.
The system S takes advantage of a more sophisticated form of neural network, the Fuzzy ART, to permit fast incremental training without loss of previously learned information. New data, detected by the network, modifies only a small portion of neural memory as opposed to requiring retraining of all the network weights as would occur in a back-propagation type of neural network. The learning characteristics of the Fuzzy ART neural network have been carefully characterized in order to prove the ability to detect a given change in spectrum components.
The ability to detect changes in any component of the frequency spectrum allows a detailed condition-based maintenance program to be established. The turbine could be serviced when its parts start to wear.
With reference to FIG. 1, the Analysis System 36 accepts all the detected change data that occurs in on-line use of the turbine. The change data is correlated with the spectral features, or maintained as an unpredicted phenomemon. Increasing trends in spectral components can indicate need for maintenance action. A fast-changing trend in turbine vibration, that greatly exceeds the previously learned classification regions, can indicate a catastrophic event that should precipitate immediate action. These events would be determined in the Analysis System and transmitted to the Turbine Controller 44 for alarm or emergency shutdown of the turbine.
This system provides improved analysis of detailed spectra. Prior art has used acceptance regions that were overlaid on the spectrum. These acceptance regions were based upon human expert knowledge and consisted of a limited number of amplitude thresholds for different bands of the spectrum. If the vibration exceeded one of these thresholds in a certain band, an alarm would be raised.
In the present system, the acceptance regions are learned automatically. They consist of the entire manifold of classification regions in neural memory. These classification regions are bound directly to the turbine to which the system is attached.
FIG. 15 illustrates a Fuzzy ART algorithm for training the system S. The system is trained using vibration data from a turbine that is correctly operating, and installed in its intended environment. The classification regions are created in neural memory as the turbine is operated over its entire range of operating points. The information is stored in dimensionally separate locations in neural memory.
As the system S is operated on-line with the turbine, the analysis region in neural memory is dynamically shifted as governed by the turbine operating point. Therefore, the turbine acceptance regions in the new system encompass the entire turbine operating envelope, thus increasing the coverage of the monitoring capability. The dependence upon a human operator to manually determine acceptance regions is removed.
From experiments with a preferred embodiment of the system S, the entire 65536-point frequency spectrum required only 500 neurons to learn to detect 5% changes in the spectrum. This is a large compression of the data, but all spectral points are encompassed by classification regions. To learn the entire turbine operating envelope has been estimated to require 3 Mbytes of memory. This memory would be implemented in nonvolatile fast memory.
The system S can monitor thousands of components in the spectrum, and detect changes throughout the spectrum, not just at a few predetermined frequencies. It is highly tuned to an individual turbine, and would remain with the turbine through long periods of operating lifetime.
As the turbine components wear through use, the analysis system detects trends in vibration response of components in the spectrum. Trends are detected by monitoring the novel cases in the input spectrum, as illustrated in FIG. 16.
The novel cases can be learned in order to provide on-line adaptation to changes in the turbine spectrum. Increasing trends in blade-pass vibrations can indicate damage to the blade-set, as can increasing sidebands related to the blade-pass frequencies. The trending system may be constructed using an expert system to determine if known scenarios in the trends are present, indicative of excessive wear. Other technologies include fuzzy logic detector systems to gauge the amount of wear present, as gauged by the changes in spectral component amplitude. The amount of wear present in various components can be summed to give an overall estimate of turbine health, with a threshold provided for the initiation of maintenance actions.
After maintenance actions have been taken to correct turbine damage or wear, the system S will be automatically retrained with the new turbine spectral signatures by resetting the neural memory and running the turbine through its various operating modes. This process is illustrated in FIG. 17. The retraining enables the system S to adapt to any changes in the spectrum resulting from the maintenance action.
A Display System 40 that is driven by the neural network output and/or analysis system can display the current operating condition of the turbine, the accumulated changes in various spectral components since the turbine spectrum was first learned, and any alarms, predictions, or trends detected by the analysis system. The display can enable a human operator to distinguish between a normal operating condition of the turbine, and a damaged or deteriorating turbine, based upon highlighted changes from the baseline spectrum.
Because the data has been collected from identical monitoring systems, such as the system S, the information is easily combined in training sets. Data related to many types of turbine malfunctions can be collected. This will enable more accurate, automatic diagnosis of turbine faults as the combined data is disseminated to the monitoring systems in service.
Malfunctions in the turbine that can be distinguished in the vibration spectrum can be collected and tagged as appropriate to the malfunction. The information would then be trained in the neural network. When the appropriate neurons are activated, an output would be transmitted to the analysis system to indicate that a known problem has been detected.
The system S can be implemented on a single digital signal processing, DSP, circuit card. All neural processing can be done using a DSP microprocessor, accessing memory on-line, with an ethernet connection to external processors.
The system S can alternately be implemented within a general purpose desktop or laptop computer, using internal RAM for storage while providing communication and display capabilities intrinsic to the computer. A signal acquisition and digitization system can be installed in the computer or interfaced to the computer from an external electronics module. Alternative, separate processing units could be created for each of the subsystems, including FFT, Neural Net, Analysis System, and analog processing.
Desktop computer installations would be suitable for power-plant operation. Embedded and ruggedized implementations would be appropriate for aerospace propulsion engine use, such as for jet aircraft, and marine ships.
External processing and data archival systems could be set up for the purpose of combining the information that was automatically learned by the distributed neural network systems. This information could be redistributed to the various installations as important failure characteristics are learned, thus increasing the on-line knowledge of all the installations.
Various sensor types could be used, including accelerometers, laser non-contact vibration sensors, microelectromechanical systems, MEMS, and fiber-optic based vibration sensors, without departing from the spirit and scope of the present invention. Various display mechanisms could be employed, including flat-panel displays, cathode ray tubes, and Light Emitting Diode indicators.
Alarm mechanisms for excessive vibration could include flashing lights, and siren horns. Failure data could be transmitted through electronic mail to remote locations. The trending data could be accessed over the world wide web using Java applets.
From the foregoing, it will be observed that numerous variations and modifications may be effected without departing from the spirit and scope of the invention. It is to be understood that no limitation with respect to the specific apparatus illustrated herein is intended or should be inferred. It is, of course, intended to cover by the appended claims all such modifications as fall within the scope of the claims.
Claims (37)
1. A vibration analysis system for monitoring an operating device comprising:
at least one vibration sensor;
transform circuitry, coupled to the sensors, for transforming sensor outputs to frequency spectrum information;
a fuzzy adaptive resonance-type neural network for receipt and processing of the information to generate selected output information.
2. A system as in claim 1 wherein the transform circuitry comprises a Fast Fourier Transform.
3. A system as in claim 1 which includes circuitry for converting frequency and amplitude information to serial form for presentation to the network.
4. A system as in claim 3 which includes an expert system for automatically analyzing the output information.
5. A system as in claim 1 wherein the transform circuitry comprises a programmed processor.
6. A system as in claim 1 wherein the neural network comprises a programmed processor and a plurality of network implementing instructions.
7. A system as in claim 6 wherein the transform circuitry is coupled to serializing circuitry which presents serial information to the network implementing instructions.
8. A system as in claim 7 which includes normalizing circuitry coupled between the transform circuitry and serializing circuitry.
9. A system as in claim 1 wherein parameters of the network have been adjusted in response to presenting data from at least one properly functioning source of vibrations.
10. A system as in claim 1 which includes windowing circuitry coupled between the sensor and the transform circuitry.
11. A system as in claim 1 which includes a filter and wherein sensor outputs are filtered before being coupled to the transform circuitry.
12. A system as in claim 11 which includes a digitizer coupled between the filter and the transform circuitry.
13. A system as in claim 1 which includes normalization circuitry, coupled to the transform circuitry, for providing a normalized frequency domain representation to the network.
14. A system as in claim 13 wherein the normalizing circuitry includes baseline noise removal circuitry.
15. A system as in claim 1 wherein the network includes a serial input port.
16. A system as in claim 15 wherein characteristics of a normal operating device have been incorporated into the network.
17. A system as in claim 16 wherein the memory of the network includes vibration-related information from a normally operating device.
18. A system as in claim 17 which includes circuitry for detecting differences between the stored information and signals from the sensor indicative of a current operating condition.
19. A system as in claim 17 which includes circuitry for detecting operational trends, in the input spectrum, which indicate at least one of device wear and device damage.
20. A method of analyzing vibrations generated by a device comprising:
training a resonant-type neural network to recognize a normal class of vibrations from the device using frequency domain inputs from comparable, normally functioning devices;
detecting vibrations from the device to be monitored;
converting the detected vibrations to a frequency domain representation using a variance reduced transform process;
presenting the frequency domain information serially to the trained network;
processing the information in the network; and determining if the detected vibrations are outside of the normal operating mode of the device.
21. A method as in claim 20 which includes filtering the detected vibrations.
22. A method as in claim 20 which includes detecting the operating speed of the device.
23. A method as in claim 22 which includes differentiating between periodic, speed related vibrations and non-speed related vibrations.
24. A method as in claim 20 which includes retraining only portions of the network in response to having carried out a maintenance procedure on the device.
25. A method as in claim 20 which includes coupling outputs from the network to an analysis system.
26. A software based vibration analysis system comprising:
executable instructions for transforming an input time domain signal to a frequency domain representation;
instructions for analyzing and normalizing the frequency domain representation; and
instructions for implementing a resonant-type neural network including instructions for implementing network short term and longer term memory wherein nominal, expected characteristics of a selected type of device being analyzed can be stored.
27. A system as in claim 26 which includes instructions for detecting speed signals from the device and for distinguishing between substantially periodic, speed related and non-speed related signals.
28. A system as in claim 27 which includes instructions for removing base line noise from the frequency domain representation, and normalizing the frequency domain represented.
29. A system as in claim 28 which includes instructions for analyzing differences, detected by the network, between an expected spectral pattern and a spectral pattern for the input signal.
30. An apparatus comprising:
a movable vessel;
a turbine for moving the vessel;
at least one vibration sensor coupled to the turbine;
at least one speed sensor coupled to the turbine;
a processor for comparing digital frequency domain representations of the signals from at least the vibration sensor to prestored expected, frequency domain representations of turbine vibrations wherein the processor implements a software based, resonant-type neural network to carry out the comparing process.
31. An apparatus as in claim 30 which includes processing circuitry, coupled between the speed sensor and the processor and including executable instructions for distinguishing between speed related vibrations and non-speed related vibrations.
32. An apparatus as in claim 30 wherein the vessel is selected from a class which includes a marine platform, a land platform and an airborne platform.
33. An apparatus as in claim 32 which includes an output device and executable instructions for presenting to an operator indications of operational differences between the frequency domain representation of current signals from the vibration sensor and the prestored, expected frequency domain representations.
34. An apparatus as in claim 33 which include instructions for providing maintenance indicators to the operator.
35. A system as in claim 32 wherein the processor includes a digital signal processor.
36. A system as in claim 32 wherein the processor includes a programmable computer for executing at least some of the instructions.
37. A system as in claim 32 wherein the system transmits detected vibration information to an external collecting point, for incorporation into a general vibration database.
Priority Applications (1)
| Application Number | Priority Date | Filing Date | Title |
|---|---|---|---|
| US09/204,334 US6301572B1 (en) | 1998-12-02 | 1998-12-02 | Neural network based analysis system for vibration analysis and condition monitoring |
Applications Claiming Priority (1)
| Application Number | Priority Date | Filing Date | Title |
|---|---|---|---|
| US09/204,334 US6301572B1 (en) | 1998-12-02 | 1998-12-02 | Neural network based analysis system for vibration analysis and condition monitoring |
Publications (1)
| Publication Number | Publication Date |
|---|---|
| US6301572B1 true US6301572B1 (en) | 2001-10-09 |
Family
ID=22757498
Family Applications (1)
| Application Number | Title | Priority Date | Filing Date |
|---|---|---|---|
| US09/204,334 Expired - Lifetime US6301572B1 (en) | 1998-12-02 | 1998-12-02 | Neural network based analysis system for vibration analysis and condition monitoring |
Country Status (1)
| Country | Link |
|---|---|
| US (1) | US6301572B1 (en) |
Cited By (91)
| Publication number | Priority date | Publication date | Assignee | Title |
|---|---|---|---|---|
| US20020091972A1 (en) * | 2001-01-05 | 2002-07-11 | Harris David P. | Method for predicting machine or process faults and automated system for implementing same |
| US6477472B2 (en) * | 2000-04-19 | 2002-11-05 | National Instruments Corporation | Analyzing signals generated by rotating machines using an order mask to select desired order components of the signals |
| US6507789B1 (en) * | 2000-07-18 | 2003-01-14 | General Electric Company | Gear transmission condition monitoring method and apparatus |
| US20030040878A1 (en) * | 2001-08-09 | 2003-02-27 | Rovsing Dynamics A/S | Automatic machinery fault diagnostic method and apparatus |
| US20030065409A1 (en) * | 2001-09-28 | 2003-04-03 | Raeth Peter G. | Adaptively detecting an event of interest |
| US6556956B1 (en) * | 2000-06-30 | 2003-04-29 | General Electric Company | Data acquisition unit for remote monitoring system and method for remote monitoring |
| US6560582B1 (en) * | 2000-01-05 | 2003-05-06 | The United States Of America As Represented By The Secretary Of The Navy | Dynamic memory processor |
| US6590362B2 (en) | 2001-07-27 | 2003-07-08 | Texas A&M University System | Method and system for early detection of incipient faults in electric motors |
| WO2003085366A1 (en) * | 2002-03-18 | 2003-10-16 | Eurocopter | Method and device for detecting defects of at least one rotary wing aircraft rotor |
| US20030200069A1 (en) * | 2002-04-23 | 2003-10-23 | Volponi Allan J. | Hybrid gas turbine engine state variable model |
| US20030204333A1 (en) * | 2002-04-25 | 2003-10-30 | Kabushiki Kaisha Toshiba | Apparatus and method of diagnosing machinery damage factor |
| US20030233212A1 (en) * | 2002-02-11 | 2003-12-18 | Von Drasek William A. | Indirect gas species monitoring using tunable diode lasers |
| US6687654B2 (en) | 2001-09-10 | 2004-02-03 | The Johns Hopkins University | Techniques for distributed machinery monitoring |
| US6713978B2 (en) | 2001-07-18 | 2004-03-30 | Texas A&M University System | Method and system for determining induction motor speed |
| WO2004059399A2 (en) * | 2002-12-30 | 2004-07-15 | Rsl Electronics Ltd. | Method and system for diagnostics and prognostics of a mechanical system |
| WO2004063964A2 (en) * | 2003-01-07 | 2004-07-29 | Hach Company | Classification of deviations in a process |
| US6810341B2 (en) | 2000-04-19 | 2004-10-26 | National Instruments Corporation | Time varying harmonic analysis including determination of order components |
| US20040261531A1 (en) * | 2003-06-30 | 2004-12-30 | General Electric Canada Inc. | Method and system for analyzing hydraulic turbine vibrations |
| US20050021212A1 (en) * | 2003-07-24 | 2005-01-27 | Gayme Dennice F. | Fault detection system and method using augmented data and fuzzy logic |
| US20050022589A1 (en) * | 2003-07-28 | 2005-02-03 | Hongliu Du | Hydraulic system health indicator |
| FR2858690A1 (en) * | 2003-08-04 | 2005-02-11 | Gradient | Vibration frequency calculation method for e.g. turbine blade, involves combining data provided by processing signal, searching maximum in resulting spectrum, and removing alias associated with each maximum |
| US6868348B1 (en) * | 1999-10-29 | 2005-03-15 | Entek Ird International Corporation | Adaptive high frequency energy detection |
| US20050204818A1 (en) * | 2004-03-22 | 2005-09-22 | Johnson Controls Technology Company | Determining amplitude limits for vibration spectra |
| WO2005116592A1 (en) * | 2004-05-28 | 2005-12-08 | Eads Deutschland Gmbh | Travel sensor for electronic components for use in aircraft, method for controlling electronic components aboard aircraft and electronic component |
| US20060056960A1 (en) * | 2002-09-23 | 2006-03-16 | Siemens Westinghouse Power Corporation | Apparatus and method of detecting wear in an abradable coating system |
| US20060056959A1 (en) * | 2002-09-23 | 2006-03-16 | Siemens Westinghouse Power Corporation | Apparatus and method of monitoring operating parameters of a gas turbine |
| US20060122809A1 (en) * | 2004-12-06 | 2006-06-08 | Clarke Burton R | Vibration analysis system and method for a machine |
| WO2007003150A1 (en) * | 2005-06-29 | 2007-01-11 | Blohm + Voss Gmbh | Method and device for monitoring the status of ship systems |
| US20070073518A1 (en) * | 2005-09-26 | 2007-03-29 | Lockheed Martin Corporation | Method and system of monitoring and prognostics |
| DE102006004941A1 (en) * | 2006-02-03 | 2007-08-16 | Areva Np Gmbh | Method and device for detecting the location of a pulse-like mechanical action on a system part |
| US20070231154A1 (en) * | 2006-03-31 | 2007-10-04 | Burdgick Steven S | Methods and apparatus for reducing stress in turbine buckets |
| US20070260656A1 (en) * | 2006-05-05 | 2007-11-08 | Eurocopter | Method and apparatus for diagnosing a mechanism |
| US7338202B1 (en) | 2003-07-01 | 2008-03-04 | Research Foundation Of The University Of Central Florida | Ultra-high temperature micro-electro-mechanical systems (MEMS)-based sensors |
| US20080065281A1 (en) * | 2006-09-11 | 2008-03-13 | Eurocopter | Method and a system for diagnosing an aircraft from measurements performed on the aircraft |
| US20080126012A1 (en) * | 2006-11-29 | 2008-05-29 | United Technologies Corpoation | State initialization for gas turbine engine performance diagnostics |
| US20080127734A1 (en) * | 2006-11-30 | 2008-06-05 | Van Der Merwe Gert Johannes | Vibration measurement system and gas turbine engine including the same |
| US20080133439A1 (en) * | 2006-11-30 | 2008-06-05 | Matsushita Electric Works Ltd. | Device for overall machine tool monitoring |
| US20090044181A1 (en) * | 2007-08-06 | 2009-02-12 | Vrba Joseph A | Graphics Tools for Interactive Analysis of Three-Dimensional Machine Data |
| WO2009037077A2 (en) * | 2007-09-18 | 2009-03-26 | Siemens Aktiengesellschaft | Sensor device and monitoring system for noises |
| US20100114806A1 (en) * | 2008-10-17 | 2010-05-06 | Lockheed Martin Corporation | Condition-Based Monitoring System For Machinery And Associated Methods |
| US20100117859A1 (en) * | 2004-06-21 | 2010-05-13 | Mitchell David J | Apparatus and Method of Monitoring Operating Parameters of a Gas Turbine |
| US20100138694A1 (en) * | 2008-11-25 | 2010-06-03 | Lockheed Martin Corporation | Root-Cause Analysis System And Associated Methods |
| WO2010130925A1 (en) * | 2009-05-14 | 2010-11-18 | Saipem S.A. | Floating support or vessel equipped with a device for detecting the movement of the free surface of a body of liquid |
| USRE42255E1 (en) | 2001-05-10 | 2011-03-29 | Woodall Roger L | Color sensor |
| US20110106747A1 (en) * | 2009-10-30 | 2011-05-05 | General Electric Company | Turbine life assessment and inspection system and methods |
| US20110231110A1 (en) * | 2010-03-16 | 2011-09-22 | Johnston Robert T | Fiber Optic Sensor System for Detecting Surface Wear |
| US20110276247A1 (en) * | 2009-01-13 | 2011-11-10 | Snecma | Method and a system for monitoring vibratory phenomena that occur in an aviation gas turbine engine in operation |
| US8151623B2 (en) | 2002-09-23 | 2012-04-10 | Siemens Energy, Inc. | Sensor for quantifying widening reduction wear on a surface |
| US20130003071A1 (en) * | 2011-06-30 | 2013-01-03 | Catch the Wind, Inc. | System and Method of In Situ Wind Turbine Blade Monitoring |
| CN103177290A (en) * | 2013-04-03 | 2013-06-26 | 大连海事大学 | Identification method for model of ship domain based on online self-organization neural network |
| CN103226028A (en) * | 2013-05-02 | 2013-07-31 | 电子科技大学 | Method for identifying and detecting disturbance signals of phase-sensitive optical time domain reflectometer |
| US20130211665A1 (en) * | 2010-08-04 | 2013-08-15 | Caterpillar Global Mining Hms Gmbh | Method for monitoring drive components in a large hydraulic excavator |
| CN103323103A (en) * | 2013-06-13 | 2013-09-25 | 华北电力大学 | Real-time prediction method for low-frequency vibration of large steam turbine generator unit |
| US8655571B2 (en) | 2011-06-23 | 2014-02-18 | United Technologies Corporation | MFCC and CELP to detect turbine engine faults |
| US9002775B1 (en) | 2011-09-02 | 2015-04-07 | Lockheed Martin Corporation | Systems and methods for estimating a remaining useful life of an item |
| CN105021914A (en) * | 2014-04-30 | 2015-11-04 | 上海冠图防雷科技有限公司 | Portable ship power station detection expert analyzer |
| CN105067101A (en) * | 2015-08-05 | 2015-11-18 | 北方工业大学 | Fundamental tone frequency characteristic extraction method based on vibration signal for vibration source identification |
| CN105184060A (en) * | 2015-08-24 | 2015-12-23 | 哈尔滨工程大学 | Spatial plane configuration and improved Fourier series based laminated structure vibration analysis method |
| CN105222885A (en) * | 2015-06-19 | 2016-01-06 | 北方工业大学 | Optical fiber vibration detection method and device |
| US9239983B1 (en) | 2011-09-02 | 2016-01-19 | Lockheed Martin Corporation | Quantifying a condition with a neural network |
| CN107013449A (en) * | 2017-04-18 | 2017-08-04 | 山东万腾电子科技有限公司 | Voice signal based on deep learning recognizes the method and system of compressor fault |
| EP3220111A1 (en) * | 2016-03-18 | 2017-09-20 | Simmonds Precision Products, Inc. | Rotational frequency estimation from sensed vibrations based on a supervised learning method |
| WO2017158038A1 (en) * | 2016-03-16 | 2017-09-21 | Nuovo Pignone Tecnologie Srl | Methods and systems for monitoring health of a combustor |
| CN107449508A (en) * | 2017-08-03 | 2017-12-08 | 西南大学 | Automobile vibration fault detection system and detection data analysing method |
| CN109074820A (en) * | 2016-05-10 | 2018-12-21 | 谷歌有限责任公司 | Audio processing is carried out using neural network |
| US20190080237A1 (en) * | 2017-09-13 | 2019-03-14 | Southern Methodist University | Bridge impact detection and classification systems and methods |
| US10271051B2 (en) * | 2014-10-03 | 2019-04-23 | Commissariat A L'energie Atomique Et Aux Energies Alternatives | Method of coding a real signal into a quantized signal |
| US10317275B2 (en) | 2016-01-20 | 2019-06-11 | Simmonds Precision Products, Inc. | Vibration monitoring systems |
| EP3546901A1 (en) * | 2018-03-28 | 2019-10-02 | Pratt & Whitney Canada Corp. | Systems and methods for engine vibration monitoring |
| CN111104374A (en) * | 2019-12-25 | 2020-05-05 | 中国航空工业集团公司沈阳飞机设计研究所 | Method and system for processing actual measurement vibration data |
| CN111159820A (en) * | 2020-01-03 | 2020-05-15 | 北京航空航天大学 | Engine surge diagnosis method based on differential fuzzy adaptive resonance network |
| WO2020118130A1 (en) | 2018-12-07 | 2020-06-11 | Itt Manufacturing Enterprises Llc | Embedded system for vibration detection and analysis |
| CN111460722A (en) * | 2020-05-28 | 2020-07-28 | 中国航发湖南动力机械研究所 | Box body vibration energy prediction method |
| EP3708991A1 (en) * | 2019-03-14 | 2020-09-16 | Siemens Aktiengesellschaft | Automated health state classifier for rotating machines based on expert knowledge |
| CN112304417A (en) * | 2019-07-29 | 2021-02-02 | 计算系统有限公司 | Removal of DC interference from vibration waveforms |
| CN112307918A (en) * | 2020-10-21 | 2021-02-02 | 华北电力大学 | Diagnosis method for transformer direct-current magnetic biasing based on fuzzy neural network |
| CN112418407A (en) * | 2020-12-10 | 2021-02-26 | 清研灵智信息咨询(北京)有限公司 | Real-time data early warning analysis method based on neural network |
| CN112665852A (en) * | 2020-11-30 | 2021-04-16 | 南京航空航天大学 | Variable working condition planetary gearbox fault diagnosis method and device based on deep learning |
| US10984338B2 (en) | 2015-05-28 | 2021-04-20 | Raytheon Technologies Corporation | Dynamically updated predictive modeling to predict operational outcomes of interest |
| US11086311B2 (en) | 2016-05-09 | 2021-08-10 | Strong Force Iot Portfolio 2016, Llc | Systems and methods for data collection having intelligent data collection bands |
| US11126173B2 (en) | 2017-08-02 | 2021-09-21 | Strong Force Iot Portfolio 2016, Llc | Data collection systems having a self-sufficient data acquisition box |
| US11221613B2 (en) | 2016-05-09 | 2022-01-11 | Strong Force Iot Portfolio 2016, Llc | Methods and systems for noise detection and removal in a motor |
| WO2022025874A1 (en) * | 2020-07-29 | 2022-02-03 | Massachusetts Institute Of Technology | System and method for providing real-time prediction of time to fatigue failure under stochastic loading |
| CN114567512A (en) * | 2022-04-26 | 2022-05-31 | 深圳市永达电子信息股份有限公司 | Network intrusion detection method, device and terminal based on improved ART2 |
| US20220269255A1 (en) * | 2019-08-06 | 2022-08-25 | Siemens Aktiengesellschaft | Separation of states of mechanical presses by analyzing trained patterns in a neural network |
| US11454243B2 (en) | 2019-09-18 | 2022-09-27 | Industrial Technology Research Institute | Artificial intelligence training method for a target model based on the label matrix |
| US11525788B2 (en) | 2019-06-13 | 2022-12-13 | Rolls-Royce Plc | Computer-implemented methods for determining compressor operability |
| CN115859210A (en) * | 2023-02-10 | 2023-03-28 | 宁波慧声智创科技有限公司 | Intelligent detection method and system for shutdown tail tone of equipment with motor |
| CN116232123A (en) * | 2023-05-06 | 2023-06-06 | 太原理工大学 | Energy self-adaptive conversion device and method based on mining air duct vibration spectrum |
| US11774944B2 (en) | 2016-05-09 | 2023-10-03 | Strong Force Iot Portfolio 2016, Llc | Methods and systems for the industrial internet of things |
| US11809987B2 (en) | 2019-06-13 | 2023-11-07 | Rolls-Royce Plc | Computer-implemented methods for training a machine learning algorithm |
Citations (18)
| Publication number | Priority date | Publication date | Assignee | Title |
|---|---|---|---|---|
| US4894795A (en) | 1987-04-28 | 1990-01-16 | The United States Of America As Represented By The Secretary Of The Navy | High-resolution technique for time-frequency signal analysis using modified wigner-ville analysis |
| US5333240A (en) | 1989-04-14 | 1994-07-26 | Hitachi, Ltd. | Neural network state diagnostic system for equipment |
| US5353233A (en) | 1992-03-17 | 1994-10-04 | National Instruments, Inc. | Method and apparatus for time varying spectrum analysis |
| US5367612A (en) | 1990-10-30 | 1994-11-22 | Science Applications International Corporation | Neurocontrolled adaptive process control system |
| US5419197A (en) | 1992-06-02 | 1995-05-30 | Mitsubishi Denki Kabushiki Kaisha | Monitoring diagnostic apparatus using neural network |
| US5434783A (en) | 1993-01-06 | 1995-07-18 | Nissan Motor Co., Ltd. | Active control system |
| US5517737A (en) | 1994-06-06 | 1996-05-21 | The Procter & Gamble Company | Apparatus for continuously stretching or continuously releasing stretching forces from a web using two pairs of opposing non-planar belts |
| US5521840A (en) | 1994-04-07 | 1996-05-28 | Westinghouse Electric Corporation | Diagnostic system responsive to learned audio signatures |
| US5533383A (en) | 1994-08-18 | 1996-07-09 | General Electric Company | Integrated acoustic leak detection processing system |
| US5566092A (en) * | 1993-12-30 | 1996-10-15 | Caterpillar Inc. | Machine fault diagnostics system and method |
| US5566273A (en) * | 1993-12-30 | 1996-10-15 | Caterpillar Inc. | Supervised training of a neural network |
| US5571969A (en) | 1992-05-14 | 1996-11-05 | Mitsubishi Jukogyo Kabushiki Kaisha | Vibration detection and reduction system and vibration sensors for use in micro-gravity environment |
| US5579232A (en) | 1993-03-29 | 1996-11-26 | General Electric Company | System and method including neural net for tool break detection |
| US5623579A (en) | 1993-05-27 | 1997-04-22 | Martin Marietta Energy Systems, Inc. | Automated method for the systematic interpretation of resonance peaks in spectrum data |
| US5686669A (en) | 1996-02-29 | 1997-11-11 | Monitoring Technology Corporation | Apparatus and method for analyzing the condition and performance of turbomachines by processing signals representing rotor motion |
| US5698788A (en) | 1994-11-22 | 1997-12-16 | Skf Industrial Trading & Development Company B.V. | Method for analysing regularly recurring mechanical vibrations |
| US5745382A (en) | 1995-08-31 | 1998-04-28 | Arch Development Corporation | Neural network based system for equipment surveillance |
| US5854993A (en) * | 1996-12-10 | 1998-12-29 | Caterpillar Inc. | Component machine testing using neural network processed vibration data analysis |
-
1998
- 1998-12-02 US US09/204,334 patent/US6301572B1/en not_active Expired - Lifetime
Patent Citations (18)
| Publication number | Priority date | Publication date | Assignee | Title |
|---|---|---|---|---|
| US4894795A (en) | 1987-04-28 | 1990-01-16 | The United States Of America As Represented By The Secretary Of The Navy | High-resolution technique for time-frequency signal analysis using modified wigner-ville analysis |
| US5333240A (en) | 1989-04-14 | 1994-07-26 | Hitachi, Ltd. | Neural network state diagnostic system for equipment |
| US5367612A (en) | 1990-10-30 | 1994-11-22 | Science Applications International Corporation | Neurocontrolled adaptive process control system |
| US5353233A (en) | 1992-03-17 | 1994-10-04 | National Instruments, Inc. | Method and apparatus for time varying spectrum analysis |
| US5571969A (en) | 1992-05-14 | 1996-11-05 | Mitsubishi Jukogyo Kabushiki Kaisha | Vibration detection and reduction system and vibration sensors for use in micro-gravity environment |
| US5419197A (en) | 1992-06-02 | 1995-05-30 | Mitsubishi Denki Kabushiki Kaisha | Monitoring diagnostic apparatus using neural network |
| US5434783A (en) | 1993-01-06 | 1995-07-18 | Nissan Motor Co., Ltd. | Active control system |
| US5579232A (en) | 1993-03-29 | 1996-11-26 | General Electric Company | System and method including neural net for tool break detection |
| US5623579A (en) | 1993-05-27 | 1997-04-22 | Martin Marietta Energy Systems, Inc. | Automated method for the systematic interpretation of resonance peaks in spectrum data |
| US5566092A (en) * | 1993-12-30 | 1996-10-15 | Caterpillar Inc. | Machine fault diagnostics system and method |
| US5566273A (en) * | 1993-12-30 | 1996-10-15 | Caterpillar Inc. | Supervised training of a neural network |
| US5521840A (en) | 1994-04-07 | 1996-05-28 | Westinghouse Electric Corporation | Diagnostic system responsive to learned audio signatures |
| US5517737A (en) | 1994-06-06 | 1996-05-21 | The Procter & Gamble Company | Apparatus for continuously stretching or continuously releasing stretching forces from a web using two pairs of opposing non-planar belts |
| US5533383A (en) | 1994-08-18 | 1996-07-09 | General Electric Company | Integrated acoustic leak detection processing system |
| US5698788A (en) | 1994-11-22 | 1997-12-16 | Skf Industrial Trading & Development Company B.V. | Method for analysing regularly recurring mechanical vibrations |
| US5745382A (en) | 1995-08-31 | 1998-04-28 | Arch Development Corporation | Neural network based system for equipment surveillance |
| US5686669A (en) | 1996-02-29 | 1997-11-11 | Monitoring Technology Corporation | Apparatus and method for analyzing the condition and performance of turbomachines by processing signals representing rotor motion |
| US5854993A (en) * | 1996-12-10 | 1998-12-29 | Caterpillar Inc. | Component machine testing using neural network processed vibration data analysis |
Non-Patent Citations (3)
| Title |
|---|
| Bozich, D.J.; MacKay, H.B., Vibration cancellation at multiple locations using neurocontrollers with real-time learning, Neural Networks, 1991., IJCNN-91-Seattle International Joint Conference on, vol: ii, Jul. 8-14, 1991, pp: 775-780 vol.2.* |
| DiDomenico, E., Neural network output feedback training for optimal vibration suppression, Neural Networks, 1994. IEEE World Congress on Computational Intelligence., 1994 IEEE International Conference on, vol: 4, Jun. 27-Jul. 2, 1994, p: 2556-25. * |
| Tse, P.; Wang, D.D., A hybrid neural networks based machine condition forecaster and classifier by using multiple vibration parameters, Neural Networks, 1996., IEEE International Conference on, vol: 4, Jun. 3-6, 1996, pp: 2096-2100 vol. 4.* |
Cited By (225)
| Publication number | Priority date | Publication date | Assignee | Title |
|---|---|---|---|---|
| US6868348B1 (en) * | 1999-10-29 | 2005-03-15 | Entek Ird International Corporation | Adaptive high frequency energy detection |
| US6560582B1 (en) * | 2000-01-05 | 2003-05-06 | The United States Of America As Represented By The Secretary Of The Navy | Dynamic memory processor |
| US6810341B2 (en) | 2000-04-19 | 2004-10-26 | National Instruments Corporation | Time varying harmonic analysis including determination of order components |
| US6477472B2 (en) * | 2000-04-19 | 2002-11-05 | National Instruments Corporation | Analyzing signals generated by rotating machines using an order mask to select desired order components of the signals |
| US6556956B1 (en) * | 2000-06-30 | 2003-04-29 | General Electric Company | Data acquisition unit for remote monitoring system and method for remote monitoring |
| US6507789B1 (en) * | 2000-07-18 | 2003-01-14 | General Electric Company | Gear transmission condition monitoring method and apparatus |
| US20020091972A1 (en) * | 2001-01-05 | 2002-07-11 | Harris David P. | Method for predicting machine or process faults and automated system for implementing same |
| USRE42255E1 (en) | 2001-05-10 | 2011-03-29 | Woodall Roger L | Color sensor |
| US6713978B2 (en) | 2001-07-18 | 2004-03-30 | Texas A&M University System | Method and system for determining induction motor speed |
| US6590362B2 (en) | 2001-07-27 | 2003-07-08 | Texas A&M University System | Method and system for early detection of incipient faults in electric motors |
| US20030040878A1 (en) * | 2001-08-09 | 2003-02-27 | Rovsing Dynamics A/S | Automatic machinery fault diagnostic method and apparatus |
| US7089154B2 (en) * | 2001-08-09 | 2006-08-08 | Rovsing Dynamics A/S | Automatic machinery fault diagnostic method and apparatus |
| US6687654B2 (en) | 2001-09-10 | 2004-02-03 | The Johns Hopkins University | Techniques for distributed machinery monitoring |
| US20030065409A1 (en) * | 2001-09-28 | 2003-04-03 | Raeth Peter G. | Adaptively detecting an event of interest |
| US20030233212A1 (en) * | 2002-02-11 | 2003-12-18 | Von Drasek William A. | Indirect gas species monitoring using tunable diode lasers |
| US6859766B2 (en) * | 2002-02-11 | 2005-02-22 | American Air Liquide, Inc. | Indirect gas species monitoring using tunable diode lasers |
| US7085655B2 (en) | 2002-03-18 | 2006-08-01 | Eurocopter | Method and device for detecting defects of at least one rotary wing aircraft rotor |
| US20050125103A1 (en) * | 2002-03-18 | 2005-06-09 | Rogeli Ferrer | Method and device for detecting defects of at least one rotary wing aircraf rotor |
| WO2003085366A1 (en) * | 2002-03-18 | 2003-10-16 | Eurocopter | Method and device for detecting defects of at least one rotary wing aircraft rotor |
| US7216071B2 (en) * | 2002-04-23 | 2007-05-08 | United Technologies Corporation | Hybrid gas turbine engine state variable model |
| US20030200069A1 (en) * | 2002-04-23 | 2003-10-23 | Volponi Allan J. | Hybrid gas turbine engine state variable model |
| AU2003203820B2 (en) * | 2002-04-25 | 2008-06-12 | Kabushiki Kaisha Toshiba | Apparatus and method of diagnosing machinery damage factor |
| US20030204333A1 (en) * | 2002-04-25 | 2003-10-30 | Kabushiki Kaisha Toshiba | Apparatus and method of diagnosing machinery damage factor |
| US6922657B2 (en) * | 2002-04-25 | 2005-07-26 | Kabushiki Kaisha Toshiba | Apparatus and method of diagnosing machinery damage factor |
| US7618712B2 (en) | 2002-09-23 | 2009-11-17 | Siemens Energy, Inc. | Apparatus and method of detecting wear in an abradable coating system |
| US7582359B2 (en) | 2002-09-23 | 2009-09-01 | Siemens Energy, Inc. | Apparatus and method of monitoring operating parameters of a gas turbine |
| US8151623B2 (en) | 2002-09-23 | 2012-04-10 | Siemens Energy, Inc. | Sensor for quantifying widening reduction wear on a surface |
| US20060056959A1 (en) * | 2002-09-23 | 2006-03-16 | Siemens Westinghouse Power Corporation | Apparatus and method of monitoring operating parameters of a gas turbine |
| US20060056960A1 (en) * | 2002-09-23 | 2006-03-16 | Siemens Westinghouse Power Corporation | Apparatus and method of detecting wear in an abradable coating system |
| US20050096873A1 (en) * | 2002-12-30 | 2005-05-05 | Renata Klein | Method and system for diagnostics and prognostics of a mechanical system |
| US7027953B2 (en) * | 2002-12-30 | 2006-04-11 | Rsl Electronics Ltd. | Method and system for diagnostics and prognostics of a mechanical system |
| WO2004059399A2 (en) * | 2002-12-30 | 2004-07-15 | Rsl Electronics Ltd. | Method and system for diagnostics and prognostics of a mechanical system |
| EP1581839A2 (en) * | 2002-12-30 | 2005-10-05 | RSL Electronics Ltd. | Method and system for diagnostics and prognostics of a mechanical system |
| WO2004059399A3 (en) * | 2002-12-30 | 2004-09-02 | Rsl Electronics Ltd | Method and system for diagnostics and prognostics of a mechanical system |
| EP1581839A4 (en) * | 2002-12-30 | 2006-05-31 | Rsl Electronics Ltd | Method and system for diagnostics and prognostics of a mechanical system |
| WO2004063964A2 (en) * | 2003-01-07 | 2004-07-29 | Hach Company | Classification of deviations in a process |
| US20040158432A1 (en) * | 2003-01-07 | 2004-08-12 | Hach Company | Classification of deviations in a process |
| US6999898B2 (en) * | 2003-01-07 | 2006-02-14 | Hach Company | Classification of deviations in a process |
| WO2004063964A3 (en) * | 2003-01-07 | 2004-12-09 | Hach Co | Classification of deviations in a process |
| US20040261531A1 (en) * | 2003-06-30 | 2004-12-30 | General Electric Canada Inc. | Method and system for analyzing hydraulic turbine vibrations |
| US7338202B1 (en) | 2003-07-01 | 2008-03-04 | Research Foundation Of The University Of Central Florida | Ultra-high temperature micro-electro-mechanical systems (MEMS)-based sensors |
| US7734400B2 (en) * | 2003-07-24 | 2010-06-08 | Honeywell International Inc. | Fault detection system and method using augmented data and fuzzy logic |
| US20050021212A1 (en) * | 2003-07-24 | 2005-01-27 | Gayme Dennice F. | Fault detection system and method using augmented data and fuzzy logic |
| US7043975B2 (en) * | 2003-07-28 | 2006-05-16 | Caterpillar Inc | Hydraulic system health indicator |
| US20060162439A1 (en) * | 2003-07-28 | 2006-07-27 | Hongliu Du | Hydraulic system health indicator |
| US7204138B2 (en) | 2003-07-28 | 2007-04-17 | Caterpillar Inc | Hydraulic system health indicator |
| US20050022589A1 (en) * | 2003-07-28 | 2005-02-03 | Hongliu Du | Hydraulic system health indicator |
| WO2005019841A2 (en) * | 2003-08-04 | 2005-03-03 | Gradient | Signal-processing method which is used to calculate sub-sampled signal spectra |
| FR2858690A1 (en) * | 2003-08-04 | 2005-02-11 | Gradient | Vibration frequency calculation method for e.g. turbine blade, involves combining data provided by processing signal, searching maximum in resulting spectrum, and removing alias associated with each maximum |
| WO2005019841A3 (en) * | 2003-08-04 | 2005-05-19 | Gradient | Signal-processing method which is used to calculate sub-sampled signal spectra |
| US7124637B2 (en) * | 2004-03-22 | 2006-10-24 | Johnson Controls Technology Company | Determining amplitude limits for vibration spectra |
| US20050204818A1 (en) * | 2004-03-22 | 2005-09-22 | Johnson Controls Technology Company | Determining amplitude limits for vibration spectra |
| US7630799B2 (en) | 2004-05-28 | 2009-12-08 | Eads Deutschland Gmbh | Flight sensor for electronic components for use in aircraft, method of controlling electronic components on board aircraft, and electronic component |
| WO2005116592A1 (en) * | 2004-05-28 | 2005-12-08 | Eads Deutschland Gmbh | Travel sensor for electronic components for use in aircraft, method for controlling electronic components aboard aircraft and electronic component |
| US20070225875A1 (en) * | 2004-05-28 | 2007-09-27 | Eads Deutschland Gmbh | Flight Sensor for Electronic Components for Use in Aircraft, Method of Controlling Electronic Components on Board Aircraft, and Electronic Component |
| US20100117859A1 (en) * | 2004-06-21 | 2010-05-13 | Mitchell David J | Apparatus and Method of Monitoring Operating Parameters of a Gas Turbine |
| US8742944B2 (en) | 2004-06-21 | 2014-06-03 | Siemens Energy, Inc. | Apparatus and method of monitoring operating parameters of a gas turbine |
| GB2433997A (en) * | 2004-12-06 | 2007-07-11 | Caterpillar Inc | Vibration analysis system and method for a machine |
| US7194383B2 (en) | 2004-12-06 | 2007-03-20 | Caterpillar Inc | Vibration analysis system and method for a machine |
| GB2433997B (en) * | 2004-12-06 | 2008-01-16 | Caterpillar Inc | Vibration analysis system and method for a machine |
| US20060122809A1 (en) * | 2004-12-06 | 2006-06-08 | Clarke Burton R | Vibration analysis system and method for a machine |
| WO2006062577A1 (en) * | 2004-12-06 | 2006-06-15 | Caterpillar Inc. | Vibration analysis system and method for a machine |
| WO2007003150A1 (en) * | 2005-06-29 | 2007-01-11 | Blohm + Voss Gmbh | Method and device for monitoring the status of ship systems |
| US7917335B2 (en) | 2005-09-26 | 2011-03-29 | Lockheed Martin Corporation | Method and system of monitoring prognostics |
| US20070094173A1 (en) * | 2005-09-26 | 2007-04-26 | Harrison Gregory A | Method and System of Monitoring and Prognostics |
| US7478013B2 (en) * | 2005-09-26 | 2009-01-13 | Lockheed Martin Corporation | Method and system of monitoring and prognostics |
| US20090070282A1 (en) * | 2005-09-26 | 2009-03-12 | Lockheed Martin Corporation | Method and system of monitoring prognostics |
| US20070073518A1 (en) * | 2005-09-26 | 2007-03-29 | Lockheed Martin Corporation | Method and system of monitoring and prognostics |
| US20070282773A1 (en) * | 2005-09-26 | 2007-12-06 | Harrison Gregory A | Method And System Of Monitoring And Prognostics |
| DE102006004941A1 (en) * | 2006-02-03 | 2007-08-16 | Areva Np Gmbh | Method and device for detecting the location of a pulse-like mechanical action on a system part |
| JP4861438B2 (en) * | 2006-02-03 | 2012-01-25 | アレヴァ エンペー ゲゼルシャフト ミット ベシュレンクテル ハフツング | Method and apparatus for detecting the location of impulsive mechanical action on equipment parts |
| US20080288187A1 (en) * | 2006-02-03 | 2008-11-20 | Areva Np Gmbh | Method and Device for Detecting the Location of a Pulse-Type Mechanical Effect on a System Part |
| DE102006004941B4 (en) * | 2006-02-03 | 2008-01-10 | Areva Np Gmbh | Method and device for detecting the location of a pulse-like mechanical action on a system part |
| US7542860B2 (en) | 2006-02-03 | 2009-06-02 | Areva Np Gmbh | Method and device for detecting the location of a pulse-type mechanical effect on a system part |
| US7766625B2 (en) | 2006-03-31 | 2010-08-03 | General Electric Company | Methods and apparatus for reducing stress in turbine buckets |
| US20070231154A1 (en) * | 2006-03-31 | 2007-10-04 | Burdgick Steven S | Methods and apparatus for reducing stress in turbine buckets |
| US20070260656A1 (en) * | 2006-05-05 | 2007-11-08 | Eurocopter | Method and apparatus for diagnosing a mechanism |
| US7430483B2 (en) | 2006-05-05 | 2008-09-30 | Eurocopter | Method and apparatus for diagnosing a mechanism |
| US7949439B2 (en) | 2006-09-11 | 2011-05-24 | Eurocopter | Method and a system for diagnosing an aircraft from measurements performed on the aircraft |
| US20080065281A1 (en) * | 2006-09-11 | 2008-03-13 | Eurocopter | Method and a system for diagnosing an aircraft from measurements performed on the aircraft |
| US20080126012A1 (en) * | 2006-11-29 | 2008-05-29 | United Technologies Corpoation | State initialization for gas turbine engine performance diagnostics |
| US20080127734A1 (en) * | 2006-11-30 | 2008-06-05 | Van Der Merwe Gert Johannes | Vibration measurement system and gas turbine engine including the same |
| US20080133439A1 (en) * | 2006-11-30 | 2008-06-05 | Matsushita Electric Works Ltd. | Device for overall machine tool monitoring |
| US8648860B2 (en) * | 2007-08-06 | 2014-02-11 | Csi Technology, Inc. | Graphics tools for interactive analysis of three-dimensional machine data |
| US20090044181A1 (en) * | 2007-08-06 | 2009-02-12 | Vrba Joseph A | Graphics Tools for Interactive Analysis of Three-Dimensional Machine Data |
| WO2009037077A3 (en) * | 2007-09-18 | 2013-07-18 | Siemens Aktiengesellschaft | Sensor device and monitoring system for noises |
| WO2009037077A2 (en) * | 2007-09-18 | 2009-03-26 | Siemens Aktiengesellschaft | Sensor device and monitoring system for noises |
| US8332337B2 (en) * | 2008-10-17 | 2012-12-11 | Lockheed Martin Corporation | Condition-based monitoring system for machinery and associated methods |
| US20100114806A1 (en) * | 2008-10-17 | 2010-05-06 | Lockheed Martin Corporation | Condition-Based Monitoring System For Machinery And Associated Methods |
| US8407170B2 (en) | 2008-11-25 | 2013-03-26 | Lockheed Martin Corporation | Root-cause analysis system and associated methods |
| US20100138694A1 (en) * | 2008-11-25 | 2010-06-03 | Lockheed Martin Corporation | Root-Cause Analysis System And Associated Methods |
| US8831860B2 (en) * | 2009-01-13 | 2014-09-09 | Snecma | Method and a system for monitoring vibratory phenomena that occur in an aviation gas turbine engine in operation |
| US20110276247A1 (en) * | 2009-01-13 | 2011-11-10 | Snecma | Method and a system for monitoring vibratory phenomena that occur in an aviation gas turbine engine in operation |
| FR2945511A1 (en) * | 2009-05-14 | 2010-11-19 | Saipem Sa | VESSEL OR FLOATING SUPPORT EQUIPPED WITH A DEVICE FOR DETECTING THE MOVEMENTS OF LIQUID CARENES |
| US8770125B2 (en) | 2009-05-14 | 2014-07-08 | Saipem S.A. | Floating support or vessel equipped with a device for detecting the movement of the free surface of a body of liquid |
| WO2010130925A1 (en) * | 2009-05-14 | 2010-11-18 | Saipem S.A. | Floating support or vessel equipped with a device for detecting the movement of the free surface of a body of liquid |
| US20110106747A1 (en) * | 2009-10-30 | 2011-05-05 | General Electric Company | Turbine life assessment and inspection system and methods |
| US8571813B2 (en) | 2010-03-16 | 2013-10-29 | Siemens Energy, Inc. | Fiber optic sensor system for detecting surface wear |
| US20110231110A1 (en) * | 2010-03-16 | 2011-09-22 | Johnston Robert T | Fiber Optic Sensor System for Detecting Surface Wear |
| US20130211665A1 (en) * | 2010-08-04 | 2013-08-15 | Caterpillar Global Mining Hms Gmbh | Method for monitoring drive components in a large hydraulic excavator |
| US8655571B2 (en) | 2011-06-23 | 2014-02-18 | United Technologies Corporation | MFCC and CELP to detect turbine engine faults |
| US20130114066A1 (en) * | 2011-06-30 | 2013-05-09 | Bluescout Technologies, Inc. | System and method of in situ wind turbine blade monitoring |
| US20130003071A1 (en) * | 2011-06-30 | 2013-01-03 | Catch the Wind, Inc. | System and Method of In Situ Wind Turbine Blade Monitoring |
| US9002775B1 (en) | 2011-09-02 | 2015-04-07 | Lockheed Martin Corporation | Systems and methods for estimating a remaining useful life of an item |
| US9239983B1 (en) | 2011-09-02 | 2016-01-19 | Lockheed Martin Corporation | Quantifying a condition with a neural network |
| CN103177290B (en) * | 2013-04-03 | 2017-05-03 | 大连海事大学 | Identification method for model of ship domain based on online self-organization neural network |
| CN103177290A (en) * | 2013-04-03 | 2013-06-26 | 大连海事大学 | Identification method for model of ship domain based on online self-organization neural network |
| CN103226028B (en) * | 2013-05-02 | 2015-07-01 | 电子科技大学 | Method for identifying and detecting disturbance signals of phase-sensitive optical time domain reflectometer |
| CN103226028A (en) * | 2013-05-02 | 2013-07-31 | 电子科技大学 | Method for identifying and detecting disturbance signals of phase-sensitive optical time domain reflectometer |
| CN103323103A (en) * | 2013-06-13 | 2013-09-25 | 华北电力大学 | Real-time prediction method for low-frequency vibration of large steam turbine generator unit |
| CN105021914A (en) * | 2014-04-30 | 2015-11-04 | 上海冠图防雷科技有限公司 | Portable ship power station detection expert analyzer |
| CN105021914B (en) * | 2014-04-30 | 2018-06-26 | 上海冠图电气科技有限公司 | Detect analysis expert instrument in portable Ship Power Station |
| US10271051B2 (en) * | 2014-10-03 | 2019-04-23 | Commissariat A L'energie Atomique Et Aux Energies Alternatives | Method of coding a real signal into a quantized signal |
| US10984338B2 (en) | 2015-05-28 | 2021-04-20 | Raytheon Technologies Corporation | Dynamically updated predictive modeling to predict operational outcomes of interest |
| CN105222885A (en) * | 2015-06-19 | 2016-01-06 | 北方工业大学 | Optical fiber vibration detection method and device |
| CN105222885B (en) * | 2015-06-19 | 2018-07-24 | 北方工业大学 | Optical fiber vibration detection method and device |
| CN105067101A (en) * | 2015-08-05 | 2015-11-18 | 北方工业大学 | Fundamental tone frequency characteristic extraction method based on vibration signal for vibration source identification |
| CN105184060A (en) * | 2015-08-24 | 2015-12-23 | 哈尔滨工程大学 | Spatial plane configuration and improved Fourier series based laminated structure vibration analysis method |
| CN105184060B (en) * | 2015-08-24 | 2018-12-07 | 哈尔滨工程大学 | A kind of laminate structures vibration analysis method based on space with face and improvement Fourier space |
| US10317275B2 (en) | 2016-01-20 | 2019-06-11 | Simmonds Precision Products, Inc. | Vibration monitoring systems |
| WO2017158038A1 (en) * | 2016-03-16 | 2017-09-21 | Nuovo Pignone Tecnologie Srl | Methods and systems for monitoring health of a combustor |
| CN108779916A (en) * | 2016-03-16 | 2018-11-09 | 诺沃皮尼奥内技术股份有限公司 | Monitor the method and system of burner health |
| EP3220111A1 (en) * | 2016-03-18 | 2017-09-20 | Simmonds Precision Products, Inc. | Rotational frequency estimation from sensed vibrations based on a supervised learning method |
| US10082520B2 (en) | 2016-03-18 | 2018-09-25 | Simmonds Precision Products, Inc. | Rotational frequency estimation from sensed vibrations based on a supervised learning method |
| US11378938B2 (en) | 2016-05-09 | 2022-07-05 | Strong Force Iot Portfolio 2016, Llc | System, method, and apparatus for changing a sensed parameter group for a pump or fan |
| US11327475B2 (en) | 2016-05-09 | 2022-05-10 | Strong Force Iot Portfolio 2016, Llc | Methods and systems for intelligent collection and analysis of vehicle data |
| US11609552B2 (en) | 2016-05-09 | 2023-03-21 | Strong Force Iot Portfolio 2016, Llc | Method and system for adjusting an operating parameter on a production line |
| US11609553B2 (en) | 2016-05-09 | 2023-03-21 | Strong Force Iot Portfolio 2016, Llc | Systems and methods for data collection and frequency evaluation for pumps and fans |
| US11586181B2 (en) | 2016-05-09 | 2023-02-21 | Strong Force Iot Portfolio 2016, Llc | Systems and methods for adjusting process parameters in a production environment |
| US11838036B2 (en) | 2016-05-09 | 2023-12-05 | Strong Force Iot Portfolio 2016, Llc | Methods and systems for detection in an industrial internet of things data collection environment |
| US11836571B2 (en) | 2016-05-09 | 2023-12-05 | Strong Force Iot Portfolio 2016, Llc | Systems and methods for enabling user selection of components for data collection in an industrial environment |
| US11586188B2 (en) | 2016-05-09 | 2023-02-21 | Strong Force Iot Portfolio 2016, Llc | Methods and systems for a data marketplace for high volume industrial processes |
| US11573558B2 (en) | 2016-05-09 | 2023-02-07 | Strong Force Iot Portfolio 2016, Llc | Methods and systems for sensor fusion in a production line environment |
| US11507064B2 (en) | 2016-05-09 | 2022-11-22 | Strong Force Iot Portfolio 2016, Llc | Methods and systems for industrial internet of things data collection in downstream oil and gas environment |
| US11507075B2 (en) | 2016-05-09 | 2022-11-22 | Strong Force Iot Portfolio 2016, Llc | Method and system of a noise pattern data marketplace for a power station |
| US11493903B2 (en) | 2016-05-09 | 2022-11-08 | Strong Force Iot Portfolio 2016, Llc | Methods and systems for a data marketplace in a conveyor environment |
| US11797821B2 (en) | 2016-05-09 | 2023-10-24 | Strong Force Iot Portfolio 2016, Llc | System, methods and apparatus for modifying a data collection trajectory for centrifuges |
| US11791914B2 (en) | 2016-05-09 | 2023-10-17 | Strong Force Iot Portfolio 2016, Llc | Methods and systems for detection in an industrial Internet of Things data collection environment with a self-organizing data marketplace and notifications for industrial processes |
| US11774944B2 (en) | 2016-05-09 | 2023-10-03 | Strong Force Iot Portfolio 2016, Llc | Methods and systems for the industrial internet of things |
| US11663442B2 (en) | 2016-05-09 | 2023-05-30 | Strong Force Iot Portfolio 2016, Llc | Methods and systems for detection in an industrial Internet of Things data collection environment with intelligent data management for industrial processes including sensors |
| US11086311B2 (en) | 2016-05-09 | 2021-08-10 | Strong Force Iot Portfolio 2016, Llc | Systems and methods for data collection having intelligent data collection bands |
| US11728910B2 (en) | 2016-05-09 | 2023-08-15 | Strong Force Iot Portfolio 2016, Llc | Methods and systems for detection in an industrial internet of things data collection environment with expert systems to predict failures and system state for slow rotating components |
| US11119473B2 (en) | 2016-05-09 | 2021-09-14 | Strong Force Iot Portfolio 2016, Llc | Systems and methods for data collection and processing with IP front-end signal conditioning |
| US11755878B2 (en) | 2016-05-09 | 2023-09-12 | Strong Force Iot Portfolio 2016, Llc | Methods and systems of diagnosing machine components using analog sensor data and neural network |
| US11126171B2 (en) | 2016-05-09 | 2021-09-21 | Strong Force Iot Portfolio 2016, Llc | Methods and systems of diagnosing machine components using neural networks and having bandwidth allocation |
| US11415978B2 (en) | 2016-05-09 | 2022-08-16 | Strong Force Iot Portfolio 2016, Llc | Systems and methods for enabling user selection of components for data collection in an industrial environment |
| US11137752B2 (en) | 2016-05-09 | 2021-10-05 | Strong Force loT Portfolio 2016, LLC | Systems, methods and apparatus for data collection and storage according to a data storage profile |
| US11409266B2 (en) | 2016-05-09 | 2022-08-09 | Strong Force Iot Portfolio 2016, Llc | System, method, and apparatus for changing a sensed parameter group for a motor |
| US11402826B2 (en) | 2016-05-09 | 2022-08-02 | Strong Force Iot Portfolio 2016, Llc | Methods and systems of industrial production line with self organizing data collectors and neural networks |
| US11169511B2 (en) | 2016-05-09 | 2021-11-09 | Strong Force Iot Portfolio 2016, Llc | Methods and systems for network-sensitive data collection and intelligent process adjustment in an industrial environment |
| US11397422B2 (en) | 2016-05-09 | 2022-07-26 | Strong Force Iot Portfolio 2016, Llc | System, method, and apparatus for changing a sensed parameter group for a mixer or agitator |
| US11181893B2 (en) | 2016-05-09 | 2021-11-23 | Strong Force Iot Portfolio 2016, Llc | Systems and methods for data communication over a plurality of data paths |
| US11194318B2 (en) | 2016-05-09 | 2021-12-07 | Strong Force Iot Portfolio 2016, Llc | Systems and methods utilizing noise analysis to determine conveyor performance |
| US11194319B2 (en) | 2016-05-09 | 2021-12-07 | Strong Force Iot Portfolio 2016, Llc | Systems and methods for data collection in a vehicle steering system utilizing relative phase detection |
| US11221613B2 (en) | 2016-05-09 | 2022-01-11 | Strong Force Iot Portfolio 2016, Llc | Methods and systems for noise detection and removal in a motor |
| US11770196B2 (en) | 2016-05-09 | 2023-09-26 | Strong Force TX Portfolio 2018, LLC | Systems and methods for removing background noise in an industrial pump environment |
| US11243528B2 (en) | 2016-05-09 | 2022-02-08 | Strong Force Iot Portfolio 2016, Llc | Systems and methods for data collection utilizing adaptive scheduling of a multiplexer |
| US11243521B2 (en) | 2016-05-09 | 2022-02-08 | Strong Force Iot Portfolio 2016, Llc | Methods and systems for data collection in an industrial environment with haptic feedback and data communication and bandwidth control |
| US11243522B2 (en) * | 2016-05-09 | 2022-02-08 | Strong Force Iot Portfolio 2016, Llc | Methods and systems for detection in an industrial Internet of Things data collection environment with intelligent data collection and equipment package adjustment for a production line |
| US11256243B2 (en) * | 2016-05-09 | 2022-02-22 | Strong Force loT Portfolio 2016, LLC | Methods and systems for detection in an industrial Internet of Things data collection environment with intelligent data collection and equipment package adjustment for fluid conveyance equipment |
| US11256242B2 (en) | 2016-05-09 | 2022-02-22 | Strong Force Iot Portfolio 2016, Llc | Methods and systems of chemical or pharmaceutical production line with self organizing data collectors and neural networks |
| US11262737B2 (en) | 2016-05-09 | 2022-03-01 | Strong Force Iot Portfolio 2016, Llc | Systems and methods for monitoring a vehicle steering system |
| US11269319B2 (en) | 2016-05-09 | 2022-03-08 | Strong Force Iot Portfolio 2016, Llc | Methods for determining candidate sources of data collection |
| US11281202B2 (en) | 2016-05-09 | 2022-03-22 | Strong Force Iot Portfolio 2016, Llc | Method and system of modifying a data collection trajectory for bearings |
| US11307565B2 (en) | 2016-05-09 | 2022-04-19 | Strong Force Iot Portfolio 2016, Llc | Method and system of a noise pattern data marketplace for motors |
| US11397421B2 (en) | 2016-05-09 | 2022-07-26 | Strong Force Iot Portfolio 2016, Llc | Systems, devices and methods for bearing analysis in an industrial environment |
| US11334063B2 (en) | 2016-05-09 | 2022-05-17 | Strong Force Iot Portfolio 2016, Llc | Systems and methods for policy automation for a data collection system |
| US11340589B2 (en) | 2016-05-09 | 2022-05-24 | Strong Force Iot Portfolio 2016, Llc | Methods and systems for detection in an industrial Internet of Things data collection environment with expert systems diagnostics and process adjustments for vibrating components |
| US11347205B2 (en) | 2016-05-09 | 2022-05-31 | Strong Force Iot Portfolio 2016, Llc | Methods and systems for network-sensitive data collection and process assessment in an industrial environment |
| US11392109B2 (en) | 2016-05-09 | 2022-07-19 | Strong Force Iot Portfolio 2016, Llc | Methods and systems for data collection in an industrial refining environment with haptic feedback and data storage control |
| US11347215B2 (en) | 2016-05-09 | 2022-05-31 | Strong Force Iot Portfolio 2016, Llc | Methods and systems for detection in an industrial internet of things data collection environment with intelligent management of data selection in high data volume data streams |
| US11347206B2 (en) | 2016-05-09 | 2022-05-31 | Strong Force Iot Portfolio 2016, Llc | Methods and systems for data collection in a chemical or pharmaceutical production process with haptic feedback and control of data communication |
| US11353850B2 (en) | 2016-05-09 | 2022-06-07 | Strong Force Iot Portfolio 2016, Llc | Systems and methods for data collection and signal evaluation to determine sensor status |
| US11353851B2 (en) | 2016-05-09 | 2022-06-07 | Strong Force Iot Portfolio 2016, Llc | Systems and methods of data collection monitoring utilizing a peak detection circuit |
| US11353852B2 (en) | 2016-05-09 | 2022-06-07 | Strong Force Iot Portfolio 2016, Llc | Method and system of modifying a data collection trajectory for pumps and fans |
| US11392111B2 (en) | 2016-05-09 | 2022-07-19 | Strong Force Iot Portfolio 2016, Llc | Methods and systems for intelligent data collection for a production line |
| US11360459B2 (en) | 2016-05-09 | 2022-06-14 | Strong Force Iot Portfolio 2016, Llc | Method and system for adjusting an operating parameter in a marginal network |
| US11366455B2 (en) | 2016-05-09 | 2022-06-21 | Strong Force Iot Portfolio 2016, Llc | Methods and systems for optimization of data collection and storage using 3rd party data from a data marketplace in an industrial internet of things environment |
| US11366456B2 (en) | 2016-05-09 | 2022-06-21 | Strong Force Iot Portfolio 2016, Llc | Methods and systems for detection in an industrial internet of things data collection environment with intelligent data management for industrial processes including analog sensors |
| US11372394B2 (en) | 2016-05-09 | 2022-06-28 | Strong Force Iot Portfolio 2016, Llc | Methods and systems for detection in an industrial internet of things data collection environment with self-organizing expert system detection for complex industrial, chemical process |
| US11372395B2 (en) | 2016-05-09 | 2022-06-28 | Strong Force Iot Portfolio 2016, Llc | Methods and systems for detection in an industrial Internet of Things data collection environment with expert systems diagnostics for vibrating components |
| US11646808B2 (en) | 2016-05-09 | 2023-05-09 | Strong Force Iot Portfolio 2016, Llc | Methods and systems for adaption of data storage and communication in an internet of things downstream oil and gas environment |
| US11385622B2 (en) | 2016-05-09 | 2022-07-12 | Strong Force Iot Portfolio 2016, Llc | Systems and methods for characterizing an industrial system |
| US11385623B2 (en) | 2016-05-09 | 2022-07-12 | Strong Force Iot Portfolio 2016, Llc | Systems and methods of data collection and analysis of data from a plurality of monitoring devices |
| CN109074820B (en) * | 2016-05-10 | 2023-09-12 | 谷歌有限责任公司 | Audio processing using neural networks |
| CN109074820A (en) * | 2016-05-10 | 2018-12-21 | 谷歌有限责任公司 | Audio processing is carried out using neural network |
| CN107013449A (en) * | 2017-04-18 | 2017-08-04 | 山东万腾电子科技有限公司 | Voice signal based on deep learning recognizes the method and system of compressor fault |
| US11442445B2 (en) | 2017-08-02 | 2022-09-13 | Strong Force Iot Portfolio 2016, Llc | Data collection systems and methods with alternate routing of input channels |
| US11397428B2 (en) | 2017-08-02 | 2022-07-26 | Strong Force Iot Portfolio 2016, Llc | Self-organizing systems and methods for data collection |
| US11175653B2 (en) | 2017-08-02 | 2021-11-16 | Strong Force Iot Portfolio 2016, Llc | Systems for data collection and storage including network evaluation and data storage profiles |
| US11144047B2 (en) | 2017-08-02 | 2021-10-12 | Strong Force Iot Portfolio 2016, Llc | Systems for data collection and self-organizing storage including enhancing resolution |
| US11131989B2 (en) | 2017-08-02 | 2021-09-28 | Strong Force Iot Portfolio 2016, Llc | Systems and methods for data collection including pattern recognition |
| US11126173B2 (en) | 2017-08-02 | 2021-09-21 | Strong Force Iot Portfolio 2016, Llc | Data collection systems having a self-sufficient data acquisition box |
| CN107449508B (en) * | 2017-08-03 | 2020-01-10 | 西南大学 | Detection data analysis method based on automobile vibration fault detection system |
| CN107449508A (en) * | 2017-08-03 | 2017-12-08 | 西南大学 | Automobile vibration fault detection system and detection data analysing method |
| US11551092B2 (en) * | 2017-09-13 | 2023-01-10 | Southern Methodist University | Bridge impact detection and classification systems and methods |
| US20190080237A1 (en) * | 2017-09-13 | 2019-03-14 | Southern Methodist University | Bridge impact detection and classification systems and methods |
| EP3546901A1 (en) * | 2018-03-28 | 2019-10-02 | Pratt & Whitney Canada Corp. | Systems and methods for engine vibration monitoring |
| CN113272659A (en) * | 2018-12-07 | 2021-08-17 | Itt制造企业有限责任公司 | Embedded system for vibration detection and analysis |
| EP3891513A4 (en) * | 2018-12-07 | 2022-08-10 | ITT Manufacturing Enterprises, LLC | Embedded system for vibration detection and analysis |
| WO2020118130A1 (en) | 2018-12-07 | 2020-06-11 | Itt Manufacturing Enterprises Llc | Embedded system for vibration detection and analysis |
| US11747191B2 (en) * | 2019-03-14 | 2023-09-05 | Siemens Aktiengesellschaft | Automated health state classifier for rotating machines based on expert knowledge |
| WO2020182412A1 (en) | 2019-03-14 | 2020-09-17 | Siemens Aktiengesellschaft | Automated health state classifier for rotating machines based on expert knowledge |
| EP3708991A1 (en) * | 2019-03-14 | 2020-09-16 | Siemens Aktiengesellschaft | Automated health state classifier for rotating machines based on expert knowledge |
| US20220178737A1 (en) * | 2019-03-14 | 2022-06-09 | Siemens Aktiengesellschaft | Automated health state classifier for rotating machines based on expert knowledge |
| CN113557420A (en) * | 2019-03-14 | 2021-10-26 | 西门子股份公司 | Expert knowledge based automatic health status classifier for rotating machines |
| US11525788B2 (en) | 2019-06-13 | 2022-12-13 | Rolls-Royce Plc | Computer-implemented methods for determining compressor operability |
| US11809987B2 (en) | 2019-06-13 | 2023-11-07 | Rolls-Royce Plc | Computer-implemented methods for training a machine learning algorithm |
| CN112304417A (en) * | 2019-07-29 | 2021-02-02 | 计算系统有限公司 | Removal of DC interference from vibration waveforms |
| US20220269255A1 (en) * | 2019-08-06 | 2022-08-25 | Siemens Aktiengesellschaft | Separation of states of mechanical presses by analyzing trained patterns in a neural network |
| US11454243B2 (en) | 2019-09-18 | 2022-09-27 | Industrial Technology Research Institute | Artificial intelligence training method for a target model based on the label matrix |
| CN111104374A (en) * | 2019-12-25 | 2020-05-05 | 中国航空工业集团公司沈阳飞机设计研究所 | Method and system for processing actual measurement vibration data |
| CN111104374B (en) * | 2019-12-25 | 2023-04-07 | 中国航空工业集团公司沈阳飞机设计研究所 | Actually measured vibration data processing method and system |
| CN111159820A (en) * | 2020-01-03 | 2020-05-15 | 北京航空航天大学 | Engine surge diagnosis method based on differential fuzzy adaptive resonance network |
| CN111460722B (en) * | 2020-05-28 | 2022-10-25 | 中国航发湖南动力机械研究所 | Box body vibration energy prediction method |
| CN111460722A (en) * | 2020-05-28 | 2020-07-28 | 中国航发湖南动力机械研究所 | Box body vibration energy prediction method |
| WO2022025874A1 (en) * | 2020-07-29 | 2022-02-03 | Massachusetts Institute Of Technology | System and method for providing real-time prediction of time to fatigue failure under stochastic loading |
| CN112307918A (en) * | 2020-10-21 | 2021-02-02 | 华北电力大学 | Diagnosis method for transformer direct-current magnetic biasing based on fuzzy neural network |
| CN112665852A (en) * | 2020-11-30 | 2021-04-16 | 南京航空航天大学 | Variable working condition planetary gearbox fault diagnosis method and device based on deep learning |
| CN112418407A (en) * | 2020-12-10 | 2021-02-26 | 清研灵智信息咨询(北京)有限公司 | Real-time data early warning analysis method based on neural network |
| CN114567512A (en) * | 2022-04-26 | 2022-05-31 | 深圳市永达电子信息股份有限公司 | Network intrusion detection method, device and terminal based on improved ART2 |
| CN114567512B (en) * | 2022-04-26 | 2022-08-23 | 深圳市永达电子信息股份有限公司 | Network intrusion detection method, device and terminal based on improved ART2 |
| CN115859210A (en) * | 2023-02-10 | 2023-03-28 | 宁波慧声智创科技有限公司 | Intelligent detection method and system for shutdown tail tone of equipment with motor |
| CN116232123B (en) * | 2023-05-06 | 2023-08-08 | 太原理工大学 | Energy self-adaptive conversion device and method based on mining air duct vibration spectrum |
| CN116232123A (en) * | 2023-05-06 | 2023-06-06 | 太原理工大学 | Energy self-adaptive conversion device and method based on mining air duct vibration spectrum |
Similar Documents
| Publication | Publication Date | Title |
|---|---|---|
| US6301572B1 (en) | Neural network based analysis system for vibration analysis and condition monitoring | |
| Antoniadou et al. | Aspects of structural health and condition monitoring of offshore wind turbines | |
| Pan et al. | A novel deep learning network via multiscale inner product with locally connected feature extraction for intelligent fault detection | |
| KR0153464B1 (en) | Monitoring | |
| Goumas et al. | Classification of washing machines vibration signals using discrete wavelet analysis for feature extraction | |
| Lei et al. | Gear crack level identification based on weighted K nearest neighbor classification algorithm | |
| Moshrefzadeh | Condition monitoring and intelligent diagnosis of rolling element bearings under constant/variable load and speed conditions | |
| US5210704A (en) | System for prognosis and diagnostics of failure and wearout monitoring and for prediction of life expectancy of helicopter gearboxes and other rotating equipment | |
| US6687654B2 (en) | Techniques for distributed machinery monitoring | |
| Sanz et al. | Fault diagnosis of rotating machinery based on auto-associative neural networks and wavelet transforms | |
| US7826943B2 (en) | Method and system for diagnosing faults in a particular device within a fleet of devices | |
| EP3136255A1 (en) | Method and system for automatically detecting defects on a rotating shaft | |
| Liu et al. | An enhanced diagnostic scheme for bearing condition monitoring | |
| US20190178852A1 (en) | Structural health monitoring of cyclically loaded structures | |
| Babouri et al. | Rolling bearing faults severity classification using a combined approach based on multi-scales principal component analysis and fuzzy technique | |
| Yang et al. | The application of advanced signal processing techniques to induction motor bearing condition diagnosis | |
| Shukla et al. | Automated bearing fault classification based on discrete wavelet transform method | |
| Senanayaka et al. | CNN based Gearbox Fault Diagnosis and Interpretation of Learning Features | |
| Wegerich | Similarity‐based modeling of vibration features for fault detection and identification | |
| Yan et al. | Feature extraction for bearing prognostics and health management (PHM)‐a survey (preprint) | |
| Yang et al. | Basis pursuit‐based intelligent diagnosis of bearing faults | |
| Sharma | Fault diagnosis of bearings using recurrences and artificial intelligence techniques | |
| Liu et al. | Machine health monitoring and prognostication via vibration information | |
| Leoni et al. | A new comprehensive monitoring and diagnostic approach for early detection of mechanical degradation in helicopter transmission systems | |
| Yang | Automatic fault diagnosis of rolling element bearings using wavelet based pursuit features |
Legal Events
| Date | Code | Title | Description |
|---|---|---|---|
| AS | Assignment |
Owner name: LOCKHEED MARTIN CORPORATION, FLORIDA Free format text: ASSIGNMENT OF ASSIGNORS INTEREST;ASSIGNOR:HARRISON, GREGORY A.;REEL/FRAME:009721/0218 Effective date: 19990113 |
|
| STCF | Information on status: patent grant |
Free format text: PATENTED CASE |
|
| FPAY | Fee payment |
Year of fee payment: 4 |
|
| FPAY | Fee payment |
Year of fee payment: 8 |
|
| FPAY | Fee payment |
Year of fee payment: 12 |