US6104945A - Spectral volume microprobe arrays - Google Patents
Spectral volume microprobe arrays Download PDFInfo
- Publication number
- US6104945A US6104945A US08/782,936 US78293697A US6104945A US 6104945 A US6104945 A US 6104945A US 78293697 A US78293697 A US 78293697A US 6104945 A US6104945 A US 6104945A
- Authority
- US
- United States
- Prior art keywords
- array
- optical
- illuminating
- sample
- electromagnetic radiation
- Prior art date
- Legal status (The legal status is an assumption and is not a legal conclusion. Google has not performed a legal analysis and makes no representation as to the accuracy of the status listed.)
- Expired - Lifetime
Links
Images


Classifications
-
- A—HUMAN NECESSITIES
- A61—MEDICAL OR VETERINARY SCIENCE; HYGIENE
- A61B—DIAGNOSIS; SURGERY; IDENTIFICATION
- A61B1/00—Instruments for performing medical examinations of the interior of cavities or tubes of the body by visual or photographical inspection, e.g. endoscopes; Illuminating arrangements therefor
- A61B1/00002—Operational features of endoscopes
- A61B1/00059—Operational features of endoscopes provided with identification means for the endoscope
-
- A—HUMAN NECESSITIES
- A61—MEDICAL OR VETERINARY SCIENCE; HYGIENE
- A61B—DIAGNOSIS; SURGERY; IDENTIFICATION
- A61B5/00—Measuring for diagnostic purposes; Identification of persons
- A61B5/0059—Measuring for diagnostic purposes; Identification of persons using light, e.g. diagnosis by transillumination, diascopy, fluorescence
- A61B5/0071—Measuring for diagnostic purposes; Identification of persons using light, e.g. diagnosis by transillumination, diascopy, fluorescence by measuring fluorescence emission
-
- A—HUMAN NECESSITIES
- A61—MEDICAL OR VETERINARY SCIENCE; HYGIENE
- A61B—DIAGNOSIS; SURGERY; IDENTIFICATION
- A61B5/00—Measuring for diagnostic purposes; Identification of persons
- A61B5/0059—Measuring for diagnostic purposes; Identification of persons using light, e.g. diagnosis by transillumination, diascopy, fluorescence
- A61B5/0075—Measuring for diagnostic purposes; Identification of persons using light, e.g. diagnosis by transillumination, diascopy, fluorescence by spectroscopy, i.e. measuring spectra, e.g. Raman spectroscopy, infrared absorption spectroscopy
-
- A—HUMAN NECESSITIES
- A61—MEDICAL OR VETERINARY SCIENCE; HYGIENE
- A61B—DIAGNOSIS; SURGERY; IDENTIFICATION
- A61B5/00—Measuring for diagnostic purposes; Identification of persons
- A61B5/0059—Measuring for diagnostic purposes; Identification of persons using light, e.g. diagnosis by transillumination, diascopy, fluorescence
- A61B5/0082—Measuring for diagnostic purposes; Identification of persons using light, e.g. diagnosis by transillumination, diascopy, fluorescence adapted for particular medical purposes
- A61B5/0084—Measuring for diagnostic purposes; Identification of persons using light, e.g. diagnosis by transillumination, diascopy, fluorescence adapted for particular medical purposes for introduction into the body, e.g. by catheters
-
- G—PHYSICS
- G01—MEASURING; TESTING
- G01N—INVESTIGATING OR ANALYSING MATERIALS BY DETERMINING THEIR CHEMICAL OR PHYSICAL PROPERTIES
- G01N21/00—Investigating or analysing materials by the use of optical means, i.e. using sub-millimetre waves, infrared, visible or ultraviolet light
- G01N21/17—Systems in which incident light is modified in accordance with the properties of the material investigated
- G01N21/47—Scattering, i.e. diffuse reflection
- G01N21/4795—Scattering, i.e. diffuse reflection spatially resolved investigating of object in scattering medium
-
- A—HUMAN NECESSITIES
- A61—MEDICAL OR VETERINARY SCIENCE; HYGIENE
- A61B—DIAGNOSIS; SURGERY; IDENTIFICATION
- A61B1/00—Instruments for performing medical examinations of the interior of cavities or tubes of the body by visual or photographical inspection, e.g. endoscopes; Illuminating arrangements therefor
- A61B1/04—Instruments for performing medical examinations of the interior of cavities or tubes of the body by visual or photographical inspection, e.g. endoscopes; Illuminating arrangements therefor combined with photographic or television appliances
- A61B1/043—Instruments for performing medical examinations of the interior of cavities or tubes of the body by visual or photographical inspection, e.g. endoscopes; Illuminating arrangements therefor combined with photographic or television appliances for fluorescence imaging
-
- A—HUMAN NECESSITIES
- A61—MEDICAL OR VETERINARY SCIENCE; HYGIENE
- A61B—DIAGNOSIS; SURGERY; IDENTIFICATION
- A61B2562/00—Details of sensors; Constructional details of sensor housings or probes; Accessories for sensors
- A61B2562/08—Sensors provided with means for identification, e.g. barcodes or memory chips
-
- A—HUMAN NECESSITIES
- A61—MEDICAL OR VETERINARY SCIENCE; HYGIENE
- A61B—DIAGNOSIS; SURGERY; IDENTIFICATION
- A61B5/00—Measuring for diagnostic purposes; Identification of persons
- A61B5/0059—Measuring for diagnostic purposes; Identification of persons using light, e.g. diagnosis by transillumination, diascopy, fluorescence
- A61B5/0062—Arrangements for scanning
- A61B5/0068—Confocal scanning
Definitions
- the present invention provides apparatus and methods to derive spatially differentiated analytical information from an exposed surface by analyzing the results of the interaction of electromagnetic radiation with discrete volume elements of the sample. This is achieved by spatially limiting the probing beam to a small volume element and limiting the accepted response detected from the same volume element only, scanning the sample at various depths along the axis of the optical assembly formed by the beam to determine the interaction from volume elements at the different depths and collecting such data from a plurality of points in a plane generally perpendicular to the probing beam.
- tissue biopsies can only characterize the tissue based upon representative samples taken from the tissue. This results in a large number of resections being routinely performed to gather a selection of tissue capable of accurately representing the sample.
- tissue biopsies are subject to sampling and interpretation errors. Magnetic resonance imaging is a successful tool, but is expensive and has serious limitations in detecting pathologies that are very thin or in their early stages of development.
- Laser induced fluorescence utilizes a laser tuned to a particular wavelength to excite tissue and to cause the tissue to fluoresce at a set of secondary wavelengths that can then be analyzed to infer characteristics of the tissue. Fluorescence can originate either from molecules normally found within the tissue, or from molecules that have been introduced into the body to serve as marker molecules.
- the fluorescence signature of neoplasia appears to reflect both biochemical and morphological changes.
- the observed changes in the spectra are similar for many cancers, which suggest similar mechanisms are at work.
- useful auto-fluorescence spectral markers may reflect biochemical changes in the mitochondria, e.g., in the relative concentration of nicotinamide adenine dinucleotide (NADH) and flavins. Mucosal thickening and changes in capillary profusion are structural effects that have been interpreted as causing some typical changes in the spectroscopic record.
- NADH nicotinamide adenine dinucleotide
- tryptophan 390 nm emission
- chromophores in elastin 410 nm
- collagen 300 nm
- NADH 470 nm
- flavins 520 nm
- melanin 540 nm
- the sample can be illuminated with a UV beam of sufficiently short wavelength and record responses from the above enumerated wavelengths of light in order to determine the presence of each of above identified contributions to tissues types.
- hemoglobin has an absorption peak between 400 and 540 nm, while both oxyhemoglobin and hemoglobin have strong light absorption above 600 nm. Blood distribution may also influence the observed emission spectra of elastin, collagen, NAD, and NADH. Further compounds present in tissue which may absorb emitted light and change the shape of the emitted spectra include myoglobin, porphyrins, and dinucleotide co-enzymes.
- neoplasia has high levels of NADH because its metabolic pathway is primarily anaerobic.
- the inability of cells to elevate their NAD+:NADH ratio at confluence is a characteristic of transformed cells related to their defective growth control.
- the ratio of NADH+:NADH is an indicator of the metabolic capability of the cell, for example, its capacity for glycolysis versus gluconeogenesis.
- Surface fluorescence has been used to measure the relative level of NADH in both in vitro and in vivo tissues. Emission spectra obtained from individual myocyte produces residual green fluorescence, probably originating from mitochondrial oxidized flavin proteins, and blue fluorescence is consistent with NADH of a mitochondrial origin.
- Collagen, NADH, and flavin adenine dinucleotide are thought to be the major fluorophores in colonic tissue and were used to spectrally decompose the fluorescence spectra. Residuals between the fits and the data resemble the absorption spectra of a mix of oxy-and deoxy-hemoglobin; thus the residuals can be attributed to the presence of blood.
- Alfano U.S. Pat. No. 4,930,516, teaches the use of luminescence to distinguish cancerous from normal tissue when the shape of the visible luminescence spectra from the normal and cancerous tissue are substantially different, and in particular when the cancerous tissue exhibits a shift to the blue with different intensity peaks.
- Alfano discloses that a distinction between a known healthy tissue and a suspect tissue can be made by comparing the spectra of the suspect tissue with the healthy tissue.
- the spectra of the tissue can be generated by exciting the tissue with substantially monochromatic radiation and comparing the fluorescence induced at least at two wavelengths.
- Alfano in U.S. Pat. No. 5,042,494, teaches a technique for distinguishing cancer from normal tissue by identifying how the shape of the visible luminescence spectra from the normal and cancerous tissue are substantially different.
- Alfano further teaches, in U.S. Pat. No. 5,131,398, the use of luminescence to distinguish cancer from normal or benign tissue by employing (a) monochromatic or substantially monochromatic excitation wavelengths below about 315 nm, and, in particular, between about 260 and 315 nm, and, specifically, at 300 nm, and (b) comparing the resulting luminescence at two wavelengths about 340 and 440 nm.
- Alfano fails to teach a method capable of distinguishing between normal, malignant, benign, tumorous, dysplastic, hyperplastic, inflamed, or infected tissue. Failure to define these subtle distinctions in diagnosis makes appropriate treatment choices nearly impossible. While the simple ratio, difference and comparison analysis of Alfano and others have proven to be useful tools in cancer research and provocative indicators of tissue status, these have not, to date, enabled a method nor provided means which are sufficiently accurate and robust to be clinically acceptable for cancer diagnosis.
- Rosenthal U.S. Pat. No. 4,017,192, describes a technique for automatic detection of abnormalities, including cancer, in multi-cellular bulk biomedical specimens, which overcome the problems associated with complex spectral responses of biological tissues. Rosenthal teaches the determination of optical responses (transmission or reflection) data from biological tissue over a large number of wavelengths for numerous samples and then the correlation of these optical responses to conventional, clinical results to select test wavelengths and a series of constants to form a correlation equation. The correlation equation is then used in conjunction with optical responses at the selected wavelengths taken on an uncharacterized tissue to predict the status of this tissue.
- Rosenthal excises the tissues and obtains in essence a homogeneous sample in which the optical responses do not include the optical signatures of underlying tissues. Rosenthal's methods, therefore, cannot be used in vivo applications as contemplated in the present invention.
- pathological tissues does not provide information on the depth of the pathologies, and cannot provide positive diagnosis of the pathology. Furthermore, since biopsies are carried out ex vivo, a time lag between the taking of the biopsy and obtaining its results cannot be avoided. It would be very useful for physicians to have a device capable of performing such diagnostic tasks in vivo and to obtain differential diagnostics (between healthy and pathological tissues) while performing the examination. This is particularly important when performing exploratory surgical procedures, but can be very useful when examining more accessible tissues as well.
- a number of devices have been described in the prior art relating particularly to confocal microscopy where illumination and detection arrays are provided.
- a confocal scanning microscope in which mechanical scanning of the illuminating and the transmitted (or the reflected) beams is avoided is described in U.S. Pat. No. 5,065,008.
- a light shutter array is used to provide synchronous detection of a scanned light beam without the need to move a photodetector to follow the scanning beam, and each of the shutters is serving, in essence, as a field stop in the confocal microscope.
- two overlapping arrays of liquid crystals are used as optical shutter arrays to attempt reduction in the size of the field stops.
- the dimensions of the field stops need to be small relative to the diffraction limit of the optical beam used in the system.
- Other embodiments also provide for two sets of field stops, conjugated within the sample, one set for the illuminating beam and one set for the transmitted or reflected beam. While this patent teaches the use of electronic scanning of the illumination and response beams, the illumination intensity and response signal strength are drastically limited due to the use of dual liquid crystal optical shutters required to achieve the pin-hole effect of a scanning confocal microscope.
- U.S. Pat. No. 5,028,802 where a microlaser array provides a flying spot light source in a confocal configuration.
- U.S. Pat. No. 5,239,178 provides for an illuminating grid for essentially the same purpose, except that light emitting diodes are used for the grid's light sources.
- These approaches are limited to monochromatic illumination and are usable only with relatively long wavelengths at which solid state laser diodes and thus microlaser arrays or light emitting diode arrays are available.
- None of these devices provide for an array of non-imaging volume microprobes. Accordingly, there is a need for a device comprising an array of non-imaging volume microprobes in which a plurality of volume elements in a sample can rapidly be scanned in order to obtain diagnostic or analytical information over a relatively large area of the sample without integrating the data from all the sampled volume elements.
- the principles taught in the aforementioned application are applied to automatically obtain optical responses from a three dimensional array of such volume elements by providing a plurality of non imaging volume microprobes in parallel which automatically presents mapping of the diagnostic information sought, in a plane generally parallel to the surface of the specimen (the xy plane) and in the z direction which is generally perpendicular to the xy plane.
- the optical responses from an array of volume elements are further analyzed to provide visually (namely on a monitor) information which is not readily available by direct examination of the specimen.
- This is achieved by, in essence, providing an artificial three dimensional biochemical map composed from the optical responses, or more accurately, derivatives of such responses, of each individual volume element examined in an array, and by further converting these biochemical data to an artificial pathological image delineating the nature, extent and depth of pathologies observed.
- This is achieved by creating an artificial pathological scale, for each pathology of interest, by training the instrument to recognize specific pathologies.
- a training set of specimens on which optical responses with a non imaging volume microprobe were collected is subjected to a rigorous laboratory determination of the pathological state of each of its specimens and a value is assigned to each specimen on the artificial pathological scale.
- a set of linear equations relating to the responses (or functions of the responses) for each specimen to the pathological states is constructed and optimized solutions for the correlation coefficients sought. These correlation coefficients are then used to transform responses obtained on unknown specimen to obtain the pathological state of these unknown specimen.
- the objectives of the instant invention are achieved by providing an array of optical assemblies each consisting of two conjugated, or partially conjugated, optical assemblies.
- the first optical assembly is designed to image selectively a transmitted beam from a light source, or another source of radiation, within a plurality of selected volume elements of a sample in a sequential manner.
- the second optical assembly is designed to collect light, or radiation emanating from the volume elements, in the same sequential manner, and transmit the collected light or radiation to a detector for further analysis of the interaction of the first transmitted beam with the volume elements.
- the first optical assembly includes a first field stop to achieve selective illumination of a selected volume element, and the second optical assembly includes a second field stop to restrict acceptance of said emanating radiation or light into the collection optics, essentially only from the selected volume element.
- a controller is provided to adjust the depth of the selected volume elements relative to the surface of the sample by controlling the respective focal points of the two optical assemblies while keeping them conjugated and having the volume element as a common conjugation point for both optical assemblies.
- Sequential illumination of the various volume elements in an array is desired to assure that only responses from a given volume element are collected by the optical assembly associated with the volume element at any given time.
- an array of optical shutters is interposed between the light source and the sample, each shutter serving as either a field stop or an aperture stop for a specific optical assembly.
- a single array of optical shutters is provided, while in other embodiments two arrays of optical shutters are provided.
- an array of micromirrors is used to control the sequential illumination and response collection of the various volume elements in the sample.
- an arrayed bundle of optical fibers is used to sequentially illuminate an array of volume elements in the sample and to collect sequentially responses from the volume elements. Appropriate movement of the optics so as to probe various depths of the sample is provided.
- the optical responses from the selected volume elements bear important information about the volume elements, such as chemistry, morphology, and in general the physiological nature of the volume elements.
- these optical responses are analyzed by classical spectral techniques of peak matching, deconvolution or intensity determination at selected wavelengths.
- One such system could be the determination of the degree of homogeneity of a mixture or a solution of a plurality of compounds.
- the spectral complexity is often too great to obtain meaningful diagnosis.
- a training sample of a specific target pathology Such a sample will preferably have at least 10 specimens.
- Optical responses are first collected from well defined volume elements in the specimens and recorded. These optical responses can be taken with an array microprobe or with a single volume microprobe device as described in the aforementioned co-pending application.
- the same volume elements that have been sampled with the non imaging volume microprobe are excised and biopsies (namely cytological analysis of the excised volume elements) is carried out in a classical pathological laboratory and the specimens are scored on an arbitrary scale which relates to the extent of the pathology, C (for instance a specific cancer) being characterized.
- the factors a ic the correlation transform's coefficients for the pathology C, are now found from the set of equations created above, by means well known in the prior art, such as multivariate linear regression analysis or univariant linear regression analysis.
- Instruments embodying the invention are deemed useful for obtaining artificial images of some characteristics of turbid materials, such as biological tissue, plastics, coatings, and chemical reaction processes, and may offer particular benefits in analysis of biological tissue, both in vitro and in vivo.
- the invention is adapted to work with existing endoscopes, laparoscopes, or arthroscopes.
- FIG. 1 is a schematic and generalized block diagram of the major elements of the present invention.
- FIG. 2 is a block diagram of an embodiment of the invention with an array of light valves, in which each light valve acts as an addressable field stop for the illumination and detection beams.
- FIG. 3 illustrates an embodiment where an array of lenslets of the same periodicity as the array of light valves acts as an array of objective lens for both the illumination and detection beams.
- FIG. 4 and FIG. 4A illustrate embodiments of the invention in which separate illumination and detection light valves arrays create arrays of aperture stops, each in conjunction with lens arrays serving as objectives for the illumination and detection optics.
- the detection lens array is replaced with a single lens.
- FIG. 5 illustrates an embodiment of the invention in which an array of (deformable) flat micromirrors is used as field stops and the sequential selection of micromirrors serves to sequentially illuminate volume elements in a sample.
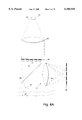
- FIGS. 6 and 6A show embodiments of the invention in which an array of (deformable) off axis parabolic mirrors serve as selecting objectives to sequentially apply excitation beams to various volume elements and collect the responses from the volume elements.
- FIG. 7 shows an embodiment of the invention in which the light shutter array is replaced with a fiber switching device to sequentially illuminate (and obtain responses from) an array of volume elements in a target sample.
- FIG. 8 illustrates an embodiment having two optical assemblies, each coupled to its own (excitation and detection) fiber bundles in which sequential illumination of fibers (and detection) is practiced to obtain data from an array of volume elements.
- FIGS. 9 and 10 illustrate embodiments of the invention in which light shutter arrays are coupled to optical fiber bundles.
- FIG. 11 is a schematic representation of one of the embodiments of the invention, including a block diagram of the control and data processing elements of the system.
- FIG. 12 is a block diagram that illustrates methods of using volume probe arrays of the invention, particularly in the diagnostic of various pathologies.
- FIGS. 13a and 13b are bottom and top views, respectively, of a partial segment of a PVDF based optical shutter array.
- FIG. 14 shows another embodiment of a PVDF based optical shutter array.
- FIG. 15 is a top view of a micromachined optical shutter array.
- FIG. 16 shows another embodiment of a micromachined optical shutter array.
- FIG. 1 we show a generalized schematic volume probe array, 10, whose function is to collect data from a plurality of points in a target sample.
- the system generally includes an appropriate light source 11, whose light output is conditioned and may be multiplexed in block 12 to create a plurality of light sources to be relayed to an array 13 of light valves.
- These light valves can act as illuminating field stops or aperture field stops, and only one valve is open at a given time, thus providing for sequential illumination of volume elements in sample 19.
- the light emanating from each light valve is then directed to a targeted volume element in the sample 19 with an appropriate illumination objective 14.
- a single objective lens is used, while in other embodiments, we incorporate an array of objective microlens having the same periodicity as that of the light valve array.
- Responses from each targeted volume element in the form of light emanating from the volume elements is collected through a collection optics objective 15 (which in some embodiments can be the same as the illumination objective and an array of microlens), and through an array 16 of light valves (which can also be the same array as the one used for illumination).
- the responses are then directed to one or more detectors 17 to determine their optical and spectral characteristics.
- both the illumination optics and the collection optics each contain a field stop having dimensions that are relatively large in relation to the average wavelength of the illuminating radiation, and furthermore, these field stops are conjugated to each other through the volume element examined.
- a well defined volume element is illuminated at any time, and the optical response from the element collected through the field stop of the collection optics is essentially limited to responses emanating from the volume element.
- a controller 18 is provided to control the sequencing of the volume elements scanned (in the x,y plane, the plane of the sample) and to control the depth of the volume elements examined (in the z direction.)
- FIG. 2 a simple example of an array volume microprobe system 20 is shown.
- the system includes a light source 21. Light from the light source is condensed with a lens 22 onto an array of light shutters 24, through a beam splitter 25.
- each element 28 in the light shutter array serves as a field stop which is being imaged through an objective lens 26 on a sample 27.
- the dimensions and shape of the shutters determine the morphology of volume elements sampled in a manner discussed in detail in copending applications, Ser. Nos. 08/510,041 and 08/510,043.
- the mean dimension, d, of each shutter is selected to be larger than the wavelength divided by the numerical aperture, NA, of the objective or d>> ⁇ /NA.
- the image of the field stop in the plane of the sample is larger than the diffraction limited resolution for the wavelength.
- a very large proportion of the light that traverses a given field stop and is imaged in the sample is within a well-defined volume element of the sample.
- the total response to the illumination is distributed over a very large spatial angle (essentially 4 ⁇ steradians)
- only responses that are emanating from within the same volume element are imaged back onto the field stop and reach detector 29, by being reflected on the beam splitter 25 onto a collector lens 23 which concentrates the response onto the detector 29.
- both field stops are embodied within the same aperture (an optical shutter or a light valve 28 within the optical shutter array).
- the beam splitter 25 can be a dichroic mirror, particularly when the light source is a short wavelength (UV) exciting light source and the responses are fluorescence responses.
- the beam splitter 25 can be a half silvered mirror which separates the optical path of responses from the sample from the optical path of the exciting beam, for instance, when the exciting beam is provided with a broad spectrum light source, and the responses involve back scattering and reflections from the sample (and thus mostly the extent of absorption of the exciting beam in the targeted volume element is examined).
- the array of light valves, or optical shutters can be implemented in a number of different ways.
- ITO Indium Tin Oxide
- TO Tin Oxide
- films of PDLC polymer dispersed liquid crystals
- Another embodiment contemplated, when the required scanning is particularly fast is an array of ferroelectric elements, each acting as a light valve.
- Yet another embodiment of the light valves can involve an array of PVDF (Polyvinyl-difluoride) bimorphs, each coated to be reflective (or opaque on both sides) on the side facing the light source and designed to bend out of the light path so as to create a light valve.
- PVDF Polyvinyl-difluoride
- the typical dimensions of the light valve range from a low of about 20 microns to as much as 1000 microns. The size is determined primarily by the application, the nature of the sample analyzed and the particular design of the specific array volume microprobe utilized.
- the space between adjacent light valves is usually kept as small as possible, so as to provide as closely spaced as possible scanned volume elements. It should be understood however that in some embodiments, the spacing is kept relatively large (as large as the field stop itself) when an image of the pathology consisting of well spaced discrete points is more appropriate.
- the controller 18 keeps one of the light valves open and adjusts the position of the device so as to image the field stop at the desired volume element in the sample 27.
- the controller causes scanning of the surface of the specimen in the xy (the plane of the specimen) direction by sequentially closing an open light valve and opening an adjacent light valve.
- the time interval of each light valve in the open position is a strong function of the intensity of the light source and the efficiency of collection of the responses from each volume element. In some embodiments, this time interval can be shorter than a millisecond, while in other embodiments tens to hundreds milliseconds are required.
- the controller 18 also controls the position of the volume elements within the sample in the z direction, generally an axis perpendicular to the plane of the samples. This can be achieved in a number of ways. For instance, the whole optical assembly can be moved back and forth in the z direction. In some embodiments, this translational movement of the image plane of the field stops in the sample can be achieved by moving the objective alone, or the array of light valves, or both of these elements simultaneously. The specific design depends on the particular embodiment of the device.
- FIG. 3 a slightly different embodiment of an array volume microprobe 30 of the present invention is shown.
- the system includes a light source 31 with appropriate optics (not shown) to project a common field stop 41 through a condenser lens 32 onto an addressable shutter array 34.
- Each element in the addressable shutter array can be considered an aperture stop which serves to further limit the spatial distribution of the light impinging on a sample 37.
- a lens array 36 is interposed between the shutter array and the sample.
- the lens array 36 consists of a plurality of microlens 42.
- the periodicity of the lens array is exactly the same as that of the shutter array, and each lens 42 within the lens array 36 corresponds to a light valve 38 within the light shutter array 34.
- the light impinging on the shutter array would be collimated, and the shutter array would be fixed in position relative to the lens array.
- the volume element probed would be at the focal point of the objective lens within the microlens array, and movement of the combination of the shutter and lens array in the z direction, can be used to probe different layers within the sample, as explained above when describing the array volume microprobe of FIG. 2.
- Light responses to the exciting radiation from the light source 31 from each of the sampled volume elements are collected through the same objective elements through which illumination is effected.
- the light responses are separated from the illuminating beam by the beam splitter 35.
- These responses are then imaged via a collecting lens 33 onto a collection field stop 43 that restricts the responses received by a sensor 39 to be essentially only from the probed volume element.
- the controller 18 opens a given shutter and allows the illumination of a single volume element.
- the same light shutter allows optical responses to the excitation to be recorded by the detector 39. This is followed by closing the light valve and opening another light valve, so that sequentially discrete volume elements within the sample are scanned to obtain optical responses thereof.
- the illuminating and detecting optics are each provided with their own array of optical shutters.
- FIG. 4 such an embodiment is shown schematically.
- the array volume microprobe 50 includes a light source 51, a first field stop 52, a collimating lens 53, a first shutter array 54, a first objective lens array 55, beam splitting means 56, a second objective lens array 58, a second shutter array 59, a second collimating lens 60, a second field stop 61 and a detector 62.
- the array volume microprobe 50 includes a light source 51, a first field stop 52, a collimating lens 53, a first shutter array 54, a first objective lens array 55, beam splitting means 56, a second objective lens array 58, a second shutter array 59, a second collimating lens 60, a second field stop 61 and a detector 62.
- Not shown in FIG. 4 are appropriate means to image the light source 51 and detector 62 onto their respective field stops 52 and 61.
- the light source 51 is imaged onto the field stop 52, having dimensions that are greater than the diffraction resolution limits of the exciting radiation.
- the light emanating from the field stop 52 is collimated into an essentially parallel beam that impinges on the back side of the shutter array 54.
- only one of the light valves in the light shutter array is opened and its corresponding light valve in the detector shutter array is open.
- the sequential illumination of an array of volume elements within the sample in a manner similar to that described above, coupled with the synchronous opening of the appropriate light valve in the detector array, assures that at any given time, only responses from the probed volume element are detected.
- controller 18 sequencing the opening and closing of the light valves in the two shutter arrays in synchronism. It should be understood that in this embodiment, the two field stops 52 and 61 are conjugated to each other via each of the volume elements 63 in the sample 57.
- FIG. 4A an arrangement essentially identical to that described in FIG. 4 is shown, except that the array of microlens 58 is replaced with a single large lens 58'.
- Like elements in FIGS. 4 and 4A have the same reference numbers.
- FIG. 5 shows an array volume microprobe 70.
- the system includes a light source 71 and a detector 72 having their optical axes orthogonal to each other and separated by a first beam splitter 73.
- the light emanating from the source is condensed onto an array of field stops 74 with a condenser lens 75 and a second beam splitter 76.
- the array of field stops 74 consists of an array of micromirrors 77 that can be tilted in and out of a plane generally parallel to the plane of the array. Light reflected from any one of these mirrors, while in the untilted position, is reflected back through the second beam splitter 76 and is imaged onto a sample 79 with an objective lens 77. As shown in FIG.
- micromirror 78 only one micromirror 78 at any given time is oriented to reflect light onto the sample. All other micromirrors in the array are tilted so that light impinging on them is reflected away from the sample.
- rays 1 and 4 are limiting rays for the total field
- rays 2 and 3 are limiting rays for a single micromirror.
- the micromirrors 77 are sequentially brought to the untilted position by the controller 18, and as a result of this sequential untilting of micromirrors, a sequence of responses from volume elements in the sample 79 is recorded in the detector 72. An artificial image from the responses can then be recorded and displayed.
- probing of the sample with the volume microprobe array in the z direction (depth) can be achieved by either moving the objective lens 77 or the array 74 in the z direction.
- the control of the tilting mirror is performed by controller 18, and the tilting mechanism can be implemented in a number of ways well known in the prior art.
- the mirrors can be micromachined in silicon, leaving a cantilever in the middle of the back of the mirrors. Two opposing electrodes cause the mirror to tilt about the cantilever due to charging one or the other electrode with a charge opposing the charge on the mirror itself.
- Another method of obtaining tilting mirrors is well known in the art of deformable mirrors, whereby each micromirror is mounted on a bipolar piezoelectric element.
- An array volume microprobe 80 includes a light source 81 from which light is conditioned to pass through a first field stop (not shown) and through a lens 82. The light is collimated onto an array of micromirrors 83.
- the micromirrors are tiltable as described above. However, each of the micromirrors is shaped to be an off axis segment of a paraboloid of revolution having its focal point tracing an arc of radius which is somewhat larger than the distance of the array from the sample.
- the geometry is such that when the mirrors are untilted (parallel to the plane of the array), the axis of the paraboloid of revolution (of which the specific mirror is an off axis segment) is perpendicular to the plane of the array.
- a line between the focal point (of the paraboloid of revolution) and the micromirror is at a predetermined angle to the normal to the array.
- the micromirrors can be tilted through that angle so as to bring the focal point of the paraboloid onto the sample.
- the micromirrors are arranged in alternating right rows 89 and left rows 88 of off-axis segments of a paraboloid.
- the right mirrors can be termed the exciting mirrors and the left mirrors the detecting mirrors.
- each segment of right rows 89 upon tilting at the above mentioned angle, resides within the sample at the volume element 85, and its respective paraboloid axis of revolution is parallel to the optics axis of the exciting beam, while the tilting in the opposing direction (at the same angle) of each micromirror in an adjacent left row causes the focal point of each micromirror to move to the same volume element (85) in the sample 84, and its respective paraboloid axis of revolution is parallel with the optics axis of the detector.
- all mirrors in right rows 89 are used to excite volume element 85 in the sample 84 and all left rows 88 are used to collect responses from volume element 85.
- the controller 18 controls the sequence of tilting each pair of mirrors to obtain an array of responses from different volume elements in the sample.
- the depth of the volume element in the sample is also controlled by the controller 18 by moving the total array 83 along the z axis toward or away from sample 84.
- FIG. 6A A slightly modified embodiment of the volume probe array shown in FIG. 6 is presented in FIG. 6A.
- This embodiment allows for using each off axis parabolic micromirror both as an excitation and detection mirror.
- the system is equivalent to that shown in FIG. 6 and described above, except that the micromirrors of array 83' of the volume probe array 80' are rotated by 90° to the right or the left.
- the axis of revolution (and thus the optical axis) of each mirror is at 90° to the optical axis of the exciting and detecting optics.
- volume element 85' is determined by the overlap of the images of the two field stops, as explained in detail in copending application Ser. Nos. 08/510,041 and 08/510,043. In this embodiment, as well as the one shown in FIG.
- sheared conjugation of the excitation and detection optics field stops is used to provide for spatial discrimination of the excitation beam to the target volume element as well as the spatial discrimination of the detected responses to be essentially from each volume element.
- the controller 18 causes two adjacent micromirrors (89' and 88') to be rotated simultaneously as described above and thus provides excitation of essentially only the desired volume element 85' and responses which emanate essentially from the volume element 85'.
- An advantage of the embodiment shown in FIG. 6A is that a higher resolution of volume elements is feasible for the same density of micromirrors, since each mirror can be used to either excite a volume element or to collect responses from an adjacent volume element. This differs from the embodiment shown in FIG. 6, where all left mirrors can be used only to collect responses and all right mirrors can be used only to excite volume elements.
- the tilting of the off-axis paraboloids of each segment is in a plane perpendicular to the plane of the array, while in the embodiment of FIG. 6A, the plane of rotation is parallel to the plane of the array.
- An array microprobe 90 includes an illumination optical assembly with a light source 91 and a first collimating lens 92, and a response collection optical assembly having a detector 93 and a second collimating lens 94.
- the respective optical axes of the light source assembly and the detector assembly are at 90° to each other.
- a beam splitter 95 is positioned at the intersection of the exciting and detected beam so as to separate the detected signal from the excitation signal.
- a lens 96 is used to focus the exciting beam into an optical fiber 102 which is interfaced with a fiber switching element 97.
- the fiber switching element 97 is terminated on the opposing side with a plurality of fibers 98, and the switching element is capable of connecting optically and sequentially (under the control of the controller 18) the proximal fiber 102 to any of the fibers 98 in the distal bundle.
- the ends of the individual fibers in the bundle are then arranged in an array 99 (this array may be either a linear array or a two dimensional array).
- An objective lens 100 then images the respective ends of the fibers in the fiber bundle onto the specimen.
- Each individual fiber end (within the fiber holder) defines a field stop which is imaged onto the sample. This field stop serves as a field stop to both the exciting beam and the detected responses from the sample.
- the fiber switching element 97 directs the exciting beam sequentially through all the fibers in the bundle 98.
- a plurality of volume elements in the sample 101 (having a distribution corresponding to the array of fibers in the bundle 98) are excited sequentially.
- Responses are collected through the same field stop (the natural aperture of each fiber end) and are separated from the exciting beam by the beam splitter 95 to be detected in detector 93.
- This embodiment has the advantage that a higher intensity of excitation is feasible, since the light source is used sequentially by the different fibers in the bundle.
- FIG. 8 yet another embodiment of a volume microprobe array 110 is shown.
- the device includes two optical assemblies, an excitation or source assembly 111 and a detector assembly 112. Each of the assemblies is interfaced to its own individual fiber bundle 113 and 114, respectively.
- the individual fibers are organized, in one embodiment, in two rows 116 and 117, respectively, in a fiber holder 115.
- the fibers are organized in two opposing rows, one row consisting of the excitation fibers in bundle 113 and the other row of detection fibers in bundle 114.
- the fibers are organized in alternating rows of excitation fibers and detection fibers, with a small tilt of such rows relative to each other.
- the excitation optics 111 includes a light source 118 and focusing optics 119 that can focus the output of the light source on each fiber in the bundle 113 sequentially.
- a rotating mirror 120 is used to index the light source onto the opening apertures of the fibers in the bundle 113.
- the input aperture of the excitation fibers can be terminated in an appropriate way to improve collection of the light from the rotating mirror. Such termination may include, but is not limited to, flaring of the input end of the fiber, or termination of each fiber with a small compound parabolic concentrator, as is well known in the prior art.
- the controller 18 causes the incremental rotation of the mirror 120 so as to direct the excitation beam to fibers in bundle 113 sequentially.
- This light then emanates through an excitation field stop at each distal end of the fiber, the field stop being essentially the aperture of each fiber.
- These field stops are imaged onto a sample 124 with objective microlens at the end of each fiber.
- the distal ends of both excitation and detection fibers are terminated into microlenses that serve as objectives.
- the excitation and detection fibers may be at a slight angle to each other, and sheared conjugation of their respective field stops (fiber apertures) defines the volume elements probed.
- the volume elements in the sample will be a mirror image of the fiber arrangement, namely a row or an array of points, depending on the organization of the fibers in the fiber holder 115.
- the distance between the volume elements may be the same as that between the fibers in the fiber holder or may differ from the interspacing of the fibers in the fiber holder, and will depend on the magnification of a relay lens 125. In some embodiments, one can allow for movement of the relay lens relative to the fiber holder so as to provide magnification (or demagnification). However, the size of each volume element will also be modified somewhat.
- This configuration allows for the sequential illumination of an array of volume elements in sample 124.
- An excited volume element will emit a response to the exciting beam.
- the responses are collected with a dedicated fiber from bundle 114.
- the optics are configured such that the respective field stops of the response fibers (their natural aperture) are each conjugated to the respective field stops of the associated exciting fiber.
- the excitation beam has its highest intensity within the sample within the zone of sheared conjugation (the probed volume element), and the intensity declines very rapidly outside the volume element.
- responses collected by each detection fiber emanate essentially only from the volume element, and any response collected from adjacent tissues is very small relative to the response obtained from the zone of sheared conjugation of the excitation and detection field stops.
- the response optics include a receiving rotating mirror 123 which directs (sequentially and in synchronism with the excitation mirror 120) the responses through a focusing lens 122 to a detector 121. This assures that stray responses (namely, responses emanating outside the zone of sheared conjugation and thus outside the target volume element) and collected by adjacent fibers, do not reach the detector. In this manner, as before, spatial discrimination is obtained, and sequential detection of responses from specific volume elements is achieved.
- the use of a beam splitter is avoided, and only very simple optics are used at the distal end of the device.
- Such a device is particularly suitable when a distance between the sample and the optics (source and detector) is required, such as in laparoscopic and endoscopic devices.
- This embodiment has the additional advantage that higher excitation energies are feasible, since the light source resources are not distributed simultaneously over a full array as in some embodiments described above, and in this respect is similar to the embodiment shown in FIG. 7 and described above.
- FIGS. 9 and 10 two additional embodiments of the invention, which differ from each other only in the position in the system of the addressable light shutters, are shown.
- a volume microprobe array 130 that includes a light source 131, a detector 132, and an optical fiber bundle 133 is shown.
- the proximal end of the optical fiber bundle interfaces an addressable array of optical shutters 134.
- the optical shutters are under the control of the controller 18.
- Each fiber in the bundle 113 is positioned in an array arrangement that corresponds to the addressable light shutter array.
- the light source 131 is coupled to the light shutter array via a condenser lens 135 and a shutter array coupling lens 136. As a result, light from the light source is distributed over the light shutter array, and, when one of the shutters is in the open position, light is transmitted to the specific fiber coupled to that specific shutter.
- the device At the distal end of the fiber bundle, the device has objective optics 137 which essentially images each of the apertures 138 of the fibers on a sample 139.
- the distal apertures of the fibers are, in essence, acting as the excitation and detection field stops for each of the volume microprobes in the volume microprobe array 130 of this embodiment.
- Responses to the exciting signals emitted from volume elements in the sample are collected by the fibers through the same objective optics 137 and the same fibers through which excitation was carried.
- the excitations and responses are limited to the individual volume elements probed by each fiber.
- the light shutter array is controlled by the controller 18 to sequentially open the light shutters in front of the fiber bundle sequentially in such as way that only one fiber is powered at any given time.
- the response is separated from the excitation by a beam splitter 140 positioned at 45° to the optical axis of the excitation optics and detection optics.
- FIG. 10 a similar volume microprobe array 150 is presented.
- the essential difference is that a shutter array 154 is positioned at the distal end of the fiber bundle. This allows for selecting an array of field stops determined by each of the apertures within the shutter array rather than by the individual apertures of the optical fibers.
- a plurality of detectors corresponding to adjacent full regions of the shutter array are employed. Each detector accepts responses from a subarray of the light shutter array, and thus from the sample.
- data collection is accelerated by the simultaneous opening of a light valve in each of the subarrays in the light shutter array and detecting the response in their respective detectors.
- care is taken to assure that interferences (or noise) from responses outside each specific region are smaller than a preset value of the expected response from the sample in each region.
- an array of light shutters is employed to sequence the excitation of an array of volume elements in the sample as well as collect responses from the volume elements.
- each shutter serves as an excitation and detection field stop, while in other embodiments other optical elements in the system perform the function of the field stop.
- Such light shutters are well known in the prior art and have been used in a number of display devices, whereby the sequence of opening and closing sets of optical shutters that are back illuminated provide either a fixed or a time variable image.
- the actual embodiments of such shutters in the prior art can take many forms.
- the most widely used light shutter array is an array of liquid crystal elements having two sheets of polarizer one each on the front and the back of the array. On each element in the array, a voltage can be applied. When the voltage is sufficiently high, the liquid crystal causes rotation of the plane of polarization of light passing through it.
- the two polarizers are oriented in such a way that no light passes through an element when no voltage is applied. Thus, the polarizers are cross polarized (their relative orientation is 90°, thus the first polarizer removes all light polarized in one direction, while the second polarizer blocks the light passing through the then inactive liquid crystal element).
- the plane of polarization of the light passing through the liquid crystal cell is rotated, so that the second polarizer is essentially transparent to the light passing through the active liquid crystal cell.
- the addressing can be carried out as in the prior art, either as row and columns, so that only the sum of voltages applied to both a row and column is sufficient to cause the desired rotation of polarized light. Since the dimensions of our light shutters are relatively large and the number of shutters small relative to the current practice in liquid crystal display, such addressing is quite sufficient, and cross talk is minimal and insignificant in view of the strong spatial discrimination due to the conjugation of the excitation and detection field stops.
- the shutter array consists of ferroelectric elements activated in a manner similar to that of liquid crystal light shutter arrays. These shutter arrays are useful when the switching rate desired, namely, the rate of opening and closing a given light shutter in the array, is faster.
- the light switching medium is a polymer dispersed liquid crystal (PDLC).
- PDLC polymer dispersed liquid crystal
- a dispersion of droplets of liquid crystal is embedded in a polymer having an index of refraction equal to the field oriented index of refraction of the liquid crystal dispersion.
- the droplets are randomly oriented and light is scattered in all directions.
- the shutter can be considered as closed.
- a sufficiently large electric field is applied to a PDLC element, the liquid crystal droplets orient themselves with the field and thus, in the direction of the field, the index of refraction is essentially constant and light passes through uninterrupted.
- the shutter is open.
- essentially electromechanical shutters are used. Such can be easily implemented with piezoelectric bimorphs, which when actuated bend out of the path of the light and when inactive, assume a straight geometry which blocks light transmission through a given shutter.
- FIG. 13a a top view of a light shutter array 310 is shown.
- This shutter array consists of two main elements, a passive base element in which an array of perforations 311 and an array 320 of active flags 321 are provided.
- the passive base can be made of an appropriate plastic, metal or even silicon.
- the perforations 311 are about 0.1 mm in diameter and are spaced on a grid in which the interspace between the perforations is about 1.0 mm. It should be understood that other dimensions may be selected without deviating from the teachings of the invention.
- the perforations which are preferentially slightly conical with their bases at the proximal end and their truncated apices at the distal end, serve as receptacles for optical fibers, each having an external diameter of 0.1 mm.
- optical fibers can first be inserted and cemented in place, and then the surface of the passive base, with the fibers in place, is optically polished to ensure that the fibers are flush with the distal surface of the base and have an acceptable optical finish.
- the surface can then be treated with an antireflective coating so as to minimize optical reflections from the distal ends of the fibers, and thus improve both the illumination and signal collection efficiency.
- the array 320 of active flags 321 consists of two sheets of piezoelectric material, such as polyvinyl difluoride (PVDF) with metallization on both sides.
- the two sheets are first cemented together (for instance with an acrylonitrile compound).
- the metallization is etched, leaving a pattern of rows of electrodes 323 interconnected with common leads 322 (in rows) on the top side of the pair of PVDF sheets as shown in FIG. 13a.
- the electrodes 323 have the same geometry as the flags 321, or can be just a little smaller than the flags.
- FIG. 13b the bottom side of the array 320 of active flags 321 is shown.
- the metallization of the bottom side is etched to provide second electrodes 324 for each flag, which are interconnected with leads 325 in columns.
- the flags are formed, the electrodes being congruent on both sides (overlapping but spaced apart by the two sheets of PVDF).
- the array of flags 321 is created by punching or etching horseshoe-like perforations 326 around each of the metallized pairs of opposing electrodes in the array. It should be apparent to a person trained in the art that one could choose to first form the flags and then etch away the excess metallization between the rows and columns of electrodes.
- the application of a voltage to a row of top electrodes 323 through the common lead 322 causes the top half (formed by the top PVDF sheet) of the flags 321 in that row to become shorter than in their respective unpowered state, while the application of a similar voltage (but of opposite polarity) on a column of bottom electrodes 324 via common lead 325, causes the bottom half (formed by the bottom PVDF sheet) of the flags 321 in that column to become elongated relative to their unpowered state.
- the appropriate voltages are applied to a specific row through conductor 328 and none other, and to a specific column through conductor 327 and none other.
- the flag 329 which is the only flag at that time having both its top and bottom electrodes powered, has on its top portion a voltage that causes its top half to shorten and has on its bottom portion a voltage that causes its bottom half to elongate.
- flag 329 bends upward and exposes the perforation under it, allowing illumination to reach the sample and allowing responses from the sample to reach the aperture of the optical fiber and thus be transmitted to the sensor.
- All other flags in the row powered by the row conductor 328 are devoid of voltage on their respective bottom electrodes, and, similarly, all other flags powered by the column conductor 327 are devoid of voltage on their respective top electrodes.
- PVDF flags 332 are structured in a similar fashion to the system shown in FIGS. 13a and 13B and described above. Specifically, two sheets of PVDF are cemented back to back, and flags 332 are formed with electrodes on both sides connected on the top side in columns with leads 333 and connected on the bottom side in rows with leads 334. This assembly is overlayed on a plate having an array of perforations 331. The flags are oriented at 45° to the main lattice to allow for a greater movement of the flag.
- the operation of this array follows the principles described above. In particular, the application of a driving voltage to a given column and a given row causes the actuation of the flag on that column and row.
- each bimorph has a flag (parallel to the plane of the array and thus perpendicular to the bimorph) covering its respective perforation in the array.
- the actuation of each bimorph causes movement parallel to the array surface rather than above the surface.
- This embodiment is somewhat more difficult to implement, but has the advantage that smaller bending of the bimorph is required, particularly when the optical fibers used in the array possess a large numerical aperture.
- FIG. 15 yet another embodiment of an array of optical shutters is shown.
- the array 340 is best produced by techniques of micromachining from silicon wafers. While a certain order of description of the various elements in the array is followed below, this order is not necessarily the order used in the micromachining process.
- Perforations 341, through which optical fibers are inserted, are provided in an array. In this embodiment, these perforations are about 0.1 mm in diameter and are spaced on a grid of 1.0 mm spacing. Each perforation is associated with its own shutter 342.
- the shutter 342 consists of a thin flexible arm 343 anchored on one side to the base plate 344 via an axis 345. On the opposing side of the arm, a flag 346 is provided.
- the flag is sufficiently large to cover its respective perforation 341 when the shutter is in the closed position.
- Two series of posts 347 and 348 positioned on opposite sides of the arm 343 are connected to appropriate electrical leads (not shown).
- the shutter element is connected to its own electrical lead (not shown).
- the total array of optical shutters is manufactured monolithically from a single wafer. In that case, the arm and flag are machined to be in the "open" position 349. Otherwise, it becomes impractical to etch the perforations.
- the array is produced from two pieces cemented together. One piece may contain the array of arms, and the other piece may contain the array of perforations. Then it is preferred to have the rest position of the arms in the closed position.
- the groups of posts 347 and 348 can be on either of the two wafers, but for practical reasons it is preferred to produce them on the array of arms. It is also possible to provide a single well-positioned post for the group of posts 347 and a single well-positioned post for the group of posts 348. The choice of the specific design depends on the dynamic response required from the light shutters in the array.
- the operation of the arm as a light shutter is based on the electrostatic attraction and repulsion generated by the charging and discharging of various members of the assembly.
- the arm may be charged, for instance negatively, and the distal posts 347 may be charged positively to cause the arm to be attracted to this set of posts.
- the proximal posts 348 can be charged negatively to cause simultaneous repulsion of the arm. It should be understood that actual contact of the moving arm with either group of posts 348 or 347 is not required. It is preferred to actually avoid such contact and in order to accomplish this aim, the whole assembly can be treated to have a thin layer of silicon oxide as an insulation, thus avoiding such contact.
- the activating voltages in rows and columns, and only the simultaneous actuation of a given column and a given row causes opening of the shutter at the intersection of the selected row and column.
- This can be achieved in a number of ways. Consider the case where the device is made of two independent wafers, so that the rest position of the arm can be in the closed state. Thus, when no charges are present on the arm, the optical shutter is closed. Referring again to FIG. 15, we apply a pulse charging all the arms in the first row negatively, and through the pair of leads for the first column, a positive charge is applied to the posts 347 and a negative charge is applied to the posts 348.
- the negatively charged arm in the first row and the first column is repulsed from the negatively charged posts 348 and is attracted to the positively charged posts 347, thus opening the optical shutter previously covered by the flag 346.
- the other arms in the first row are unaffected, since their respective posts 347 and 348 are uncharged.
- all arms in the first column are uncharged and thus, despite the fact that the posts 347 and 348 are charged, the arms do not move, thus leaving the optical shutters closed.
- all arms 343 in a given row may be kept charged and the posts in adjacent columns may be sequentially charged.
- the return of the arm to its closed position may be achieved either through the spring forces in the arm or actively by reversing the charges on the posts 347 and 348.
- the selection of a passive return or an active return to the closed position is determined by the dynamics of the scanning process. When extremely rapid scanning is desired, reversal of the charges on the posts is preferred, but when the dynamic response may be slower, mechanical relaxation to the rest position may be practiced.
- FIG. 16 another embodiment of a micromachined optical shutter array is shown.
- the array may be monolithically produced or may be assembled from two sub structures.
- an array of perforations 361 having a diameter of about 0.1 mm spaced on a grid whose points have 1.0 mm spacing is provided.
- the active elements comprise flat arms 362 attached to the base plate with a twistable post around which the arm can rotate. The distal end of the arm is sufficiently broad to cover the perforations and thus block the optical path to the fibers that are mounted within the perforations. While in FIG. 16 arms having their width gradually expanding to cover the perforation 361 are shown, it should be understood that a narrow arm 362 terminated by a wide flag at its distal end, sufficient to cover the perforation, may be provided.
- the proximal end of the arm is terminated with a structure 364 generally perpendicular to the axis of the arm.
- Two posts 365 protrude from the base plate, positioned somewhat apart from the structure 364.
- the array may be operated by maintaining a given row (charging the arms 362 in that row) negatively and scanning the column, which positively charges all pairs of posts 365, to obtain sequential opening and closing of the optical shutter array.
- the elastic properties of silicon may be relied upon to return the arm to its rest position (through the twisting base 363 spring action), or the charge on the pairs of posts may be reversed before switching to the next column.
- a variety of light sources can be used in conjunction with the array volume microprobes of the present invention.
- a laser source such as a nitrogen laser having a wavelength in the ultraviolet part of the spectrum, such as 337 nanometers.
- the light source is usually a broad spectrum source such as, but not limited to, a xenon discharge lamp, a halogen incandescent lamp, or any other suitable broad spectrum light source.
- a light source can be conditioned with an appropriate filter to homogenize or otherwise modify the light spectral distribution.
- a volume microprobe array may include a UV laser source to perform fluorescence measurements, as well as a wide band light source to perform scattering and absorption measurements.
- a third light source particularly rich in near infrared radiation can be included as well.
- these light sources can be directed toward the excitation optical assembly in a predetermined sequence.
- a typical UV laser source would operate in a pulse mode having a relatively short duration pulse (for instance under a microsecond) and a slow repetition rate.
- a lapse time between excitation of milliseconds or fractions thereof is available between measurements of fluorescence responses.
- a broadband light source can be directed at the excitation optics, and measurements of the response of the target sample to that second light source can be detected.
- the light source or excitation beam can then be a laser within the visible range of the spectrum.
- a laser in the far red or the near infrared part of the spectrum.
- Such light sources can be a HeNe laser at 633 nm, or a GaAlAs diode or laser diode at 783 nm or even a Nd:YAG laser at 1064 nm, as well as other near infrared diodes or laser diodes.
- multiple detectors can be used as well. Each is designed to be optimized for the spectral response and response intensity anticipated. In such cases, the timing of the excitation from the plurality of sources and the responses from their associated detectors is controlled by the controller 18.
- FIG. 11 a typical volume microprobe array 170 with its associated electronic modules and computing modules is shown.
- the optical system is similar to that shown in FIGS. 9 and 10 and described above, except that the beam splitter is positioned at the distal end of the optical fiber assembly, and in lieu of using the light shutter array for both the excitation and detection optics, an array of detectors is used for the spatial discrimination of the responses, rather than an array of light shutters.
- the volume microprobe 170 includes a data processing and system control unit 171 and an optical system 172.
- the optical system includes at least one light source 173. Lenses 174 and 175 are interposed between the light source and a light shutters array 176 so as to image the light source onto the array.
- a device 176 can be included to condition the spectral distribution of the light source.
- a device can be a filter that is designed to modify the normal spectral distribution of the light source, which may include parts of the spectrum at intensities that are greater than other parts, and thus normalize the spectral distribution of the exciting beam.
- the element 176 can be a plurality of filters mounted on a rotating filter wheel, so as to interpose different type of filters (or no filter) in the exciting beam path.
- a second device 177 can be included to modulate the exciting beam in time and in intensity.
- Such a scheme can be used to improve the signal-to-noise ratio of the detection system by synchronizing the modulation and detection through an appropriate phase locked amplifier (not shown), which is part of the electronics system 171 (indicated as control arrows 191 and 193).
- the timing of the light source 173, including the sequencing of a plurality of light source or the pulse rate and pulse width of a UV laser source, is also under the control of the controller 201 as indicated by the control arrow 192.
- the light shutter array 176 is coupled to an optical fiber bundle 178 in such a manner that each fiber within the bundle is coupled to a given light shutter in the array.
- the distal ends of the fibers within the bundle 178 are arranged in the same array configuration as the proximal ends so as to maintain the same array geometry.
- the aperture of the individual optical fiber determines the field stop of the excitation optics in this embodiment.
- the light shutters within the array 176 are under the control of the controller 201 via a control line 200, and in operation, the controller sequentially opens light shutters so as to provide an excitation beam sequentially to all fibers in the array.
- a beam driving mirror 184 is provided, the function of which is to select, within the sample, the desired area from which an array of volume elements is to be analyzed.
- the tilt of the directing mirror 184 is controlled by a joy stick 187, which can be operated manually, or be under the control of the controller 201 via control line 196.
- a beam splitter 180 is utilized to separate the excitation beam from the responses. Since the illumination of volume elements within the target array is sequential, at any time, only responses from a given volume element are received by the detector assembly.
- the detector assembly contains an array of detectors 183, and the respective apertures of each detector element within the array also serve as the field stops of the detection optics. Since both the excitation optics and the field stops of the detection optics are conjugated within the target volume element in the sample, we ensure that detection of responses emanating essentially only from each volume element are recorded for each volume element in the sample.
- the detector assembly also contains additional traditional optical elements, such as a spectral filter 181, whose function is to eliminate from the responses undesired parts of the spectrum. For instance, when the excitation beam is a nitrogen laser and the desired responses are fluorescence emissions, the filter blocks any reflections of the excitation beam and prevents their registration as responses.
- a spectral analyzer 182 is also included to determine the spectral distribution of the responses.
- the detector array is under the control of the controller 201 via a control line 194 so as to ensure the synchronization of excitation and response detection from each volume element in the target sample.
- the detector assembly or in some embodiments a specific element of the assembly such as an objective lens, can be caused to move in a direction parallel to the optical axis of the assembly with a driving mechanism 186 under the control of controller 201 (through control line 197), so as to adjust the z position, or depth, of the volume elements probed by the array microprobe system, in a manner similar to that described above.
- Signals from the detector, representing optical responses, are directed to a signal processing unit 202, which then transfers the data to an analog to digital converter 203 for further data conditioning in a data preparation module 204.
- the data representing responses (and tagged to assure that the processor recognizes data from various volume elements, which is achieved with a control line 199 from the controller 201) are then treated in a calibrator/scaler 205 to normalize the data. This is achieved by monitoring the output of the light source and renormalizing data for variations in the output of the source via line 220.
- the control and data processing unit 171 contains a memory unit 210 in which calibration and scaling constants 208 are stored as well as correlation transform matrices 209, as further described below.
- Data from the system are converted to diagnostic information by a computer 211 and displayed, either as diagnostic values or as artificial maps on a display station 212.
- the computer has memory (resident or removable) in which data can be stored and retrieved for future analysis off line.
- the invention is intended to operate, at least partially, to record and generally also compile and analyze the responses it collects.
- only diagnostic prediction of pathologies is provided.
- the system is equipped with a library of correlation transform vectors or matrices for specific diagnostics, and the system only registers the signals I ij (response intensities at a specific wavelength, i, for a specific volume element j) and calculates functions F(I ij ) required to provide a diagnostic score C j , for an array of volume element j, as is further described below.
- the output from detector 183 is fed to a data processor 206 after preprocessing in signal processor 202, analog to digital converter 203 and data preparation module 204.
- Data processor 206 can process the output from detector 183 or it can store the data in memory unit 210 for processing at a later time.
- the computer 211 can also provide the ability to compare a first data set obtained from detector 183 with a second data set obtained from memory unit 210, or to perform comparative studies of various volume elements within an array of volume elements measured at any given time, thus providing for spatial correlation of volume elements within a given sample.
- data processor 206 can calculate correlations between a first data set representative of the material being probed and a second data set in memory unit 210.
- the second data set may be a library of optical response data or a mathematical model abstracted from such a library, as described below in the section entitled, "Methodology and Operation.”
- Memory unit 210 can be used to store a large body of data about particular materials.
- memory unit 210 can store data concerning the characteristics of light which has interacted with a particular type of biological tissue, or memory unit 210 can store data concerning the characteristics of light emitted, particularly fluorescence, by particular types of biological tissues in response to excitation by each of a set of wavelengths of light, or can store such spectra indexed by tissue depth, or other complex multidimensional spectra derived from a prior set of observations.
- Memory unit 210 can further store information associating particular characteristics of light obtained from a biological tissue sample with a particular diagnosis.
- the ratio of light reflected at one wavelength to light reflected at a second reference wavelength can be associated with cancerous tissue growth as in certain known observations, or may be associated with a clinically relevant condition such as a thickening of one layer of tissue, a precancerous metabolic change, or a malignancy, based on correlation with the spectral library and previous clinical characterizations.
- correlation with annotated or stored digitized spectra may provide a diagnostic judgment, even without the identification of any specific individual spectral features, such as peaks or absorbance bands, that have been required for diagnosis in the past.
- the detector 183 is shown accepting responses from the specimen after being treated trough a spectral analyzer 182
- the spectral analyzer can be replaced with either a temporal interferometer (such as a Michelson interferometer) or a spatial interferometer (such as a Sagnac interferometer).
- the resulting interferogram may then provide the Fourier transform of the optical responses obtained from each volume element probed for subsequent data analysis as described elsewhere in this application.
- Raman spectroscopy particularly when selecting for an excitation beam a source in the near infrared, where the intensity of the Raman scattering is greatly reduced, one can impose in the response path, in lieu of an interferometer, a Hadamard encodement mask consisting of a multi-slit array, in order to obtain via Hadamard transform of the data the Raman spectral response of the probed volume elements.
- microprobe analysis of biological tissue has requirements that are somewhat different from those of classical microprobes. Particularly, it is not desired to have a resolution greater than the typical dimensions of differentiated tissues, but it is required to have analytical tools that can be operated by personnel without specific training in the analytical arts, such as physicians, process control personnel and other professionals.
- the use of the present invention allows for microprobing of samples and biological tissues in vivo, and enables the spatial delineation of compositional, morphological and pathological features of such specimens.
- array volume microprobe can be used, and without limiting the scope of the instant invention, we describe herein some of these approaches.
- responses from an array of volume elements which represent the interactions of the material within each of said volume elements with the exciting radiation, or at least contain specific signatures of such interactions, are presented in terms of received light intensities for various wavelengths, or as is known in the art, as a spectrum of the response.
- a researcher trained in the specific analytical art can then use these spectra to deduce important information about each of the volume elements in the array from his knowledge of the exciting radiation and the modes of interactions of the radiation with his target material.
- a variety of analytical tools such as software programs designed to conduct spectral peak fitting, or spectral deconvolution, can be used to further increase the researcher's basic understanding of such interactions and to provide the researcher with information on the chemical, morphological and physiological nature of the target volume elements in the array, since the responses correspond each to a specific volume element in the array probed.
- This in accordance with basic principles known in the art except that the data provided to the researcher are derived from a well-defined volume element and thus interferences and response weakening due to parasitic responses and interferences originating outside the target volume elements no longer hinder the researcher's ability to differentiate specific features within a largely heterogeneous sample.
- the array volume microprobe of the present invention can be used to perform classical spectroscopical analysis, fluorescence analysis, Raman scattering and other parametric or characterizing analysis which involves the measurement of the responses of each volume element in the array to a localized radiation while limiting the observed responses to essentially each of the volume elements in the array only at any given time.
- the system is equipped with a library of correlation transforms dedicated to the user's special needs, so that the system is essentially pre-calibrated for specific analytical tasks.
- the method of calibrating the array volume microprobe is further detailed herein.
- the goal of the method is to calibrate an array volume microprobe for the diagnosis of the presence or lack thereof of tissues that are affected by certain cancer and that are accessible to optical visualization, either on the external skin, or in the cervix, or in other cavities that are accessible via endoscopes or laparoscopes, such as the various segments of the gastrointestinal tract (starting from the mouth, through the esophagus and the stomach, and by rectal examination the colon), or various organs in the peritoneal cavities that are accessible via exploratory laparoscopy.
- a physician which is not a trained spectroscopist views the suspected tissues, and when discoloration or other morphological abnormalities are present, samples from such areas are excised and sent to a pathological laboratory for microscopic examination of the tissues to determine the presence or lack thereof, as well as the stage, of possible cancer. It would be extremely useful if, during the visual examination, a diagnostic scoring to determine the nature of the suspected pathology of the suspicious target tissue was available, so that immediate action could be taken, if necessary, and to avoid unnecessary excision of tissue for biopsies.
- the array volume microprobe of the instant invention will enable the automated diagnostics of such viewed tissues by a physician, provide an artificial image of the pathology and its extent, without the need to examine such tissues under the microscope by another professional pathologist.
- FIG. 12 is a diagram 300 showing the various steps undertaken in the calibration and then the use of the array volume microprobe.
- a training set 302 of specimens for the specific pathology is first selected.
- the term training set will be used herein to denote a group of tissue specimens on which very exacting cytological and pathological determination of the state of each specimen was conducted in a pathological laboratory, denoted by the step 303.
- each specimen in the training set was subjected, in vivo, to an exacting study with the microprobe array 301 of the present invention.
- the target volume elements in the training set are excited with both a laser UV source and a broad band white light source.
- the array is used with only a single shutter open, or a special single channel non imaging volume microprobe can be used.
- the intensities of the responses to the UV and white light excitations of the targeted volume element within the specimen j be J uj and I ij respectively, where u and i are central wavelengths within spectral bands of the spectral responses to the UV and to the white light excitations, respectively.
- the volume elements in the training set are excised after recording the responses obtained with the non imaging volume microprobe, and pathological determinations of the state of each specimen are recorded in the form of scores C j , where j is the identity of the specimen and C j is a number selected according to the specimen state on a monotonic scoring scale, for instance 0 to 10, where zero denotes normal tissues and 10 fully entrenched and deep cancerous tissues. Since this training set will calibrate non imaging volume microprobes for future determinations of the presence or lack thereof of such pathologies, it is important that great care is taken at arriving at an objective determination of the pathological state of the training set. In such cases, the same samples are examined microscopically by a number of independent pathologists in a blind experiment, and only those specimens for which a minimum agreement between the various pathological results exists, are included in the training set.
- the values of I ij and J uj previously stored in memory unit 210 are used to set up a set of n correlation equations (n would be the number of volume elements in the training set):
- the bandwidths around the wavelengths i and u of the responses to white light and UV light, respectively, are usually between 5 and 50 nm, depending on the spectral resolution achievable or desirable in the system's detection monochromator or spectrograph (element 182 in FIG. 11).
- the selection of the functions F depends to some extent on the nature of responses received.
- F(I ij ) (dI ij /d ⁇ )I ij , where ⁇ is the wavelength.
- the functions G(M sj ) are included to allow for the impact on the observed responses of the patient's specific "medical history", and usually includes parameter such as sex, age, race, and presence or lack thereof of systemic pathologies such as hypertension, diabetes etc. In many situations, part or all the coefficient c s are nil, and these factors have no impact on the calibration, but in special cases, these factors play a role and are included here for completeness.
- a computer is now used at step 304 to perform a regression analysis to minimize the number of wavelengths i and u (and s which are "artificial wavelengths" representing medical history) used to obtain a valid correlation and to solve the set of minimized equations (1) for the correlation constants a i , b u (and c s ).
- This regression analysis is performed using the n equations obtained experimentally, using in essence the correlation constants as unknowns, for which a solution having the best correlation is sought.
- the minimization is carried out to extract those wavelengths at which the responses contain independent relevant information that correlates the responses I ij and J uj to the scores C j .
- the methods used for obtaining the minimal set of wavelengths and the associated correlation coefficients a i and b u are well known in the prior art and include multivariant linear regression analysis and univariant linear regression analysis. Other statistical tools, such as neural networks analysis, are also available and can be used for this purpose.
- Such information may include general classification of the subject in which the volume element resides, such as, but not limited to sex, age, race, other systemic pathologies and weight.
- Such information when its inclusion in the regression improves the confidence level of the regression, can be included as additional artificial responses R ij (in lieu of the functions G(M sj )).
- the index i therefore represents the type of response obtained, whether it is obtained with the non imaging microprobe (one or more types of responses as well as the spectral band from which the response is registered) or by other means.
- the ordered values a i can be termed the correlation vector (a) for pathology C
- the ordered responses R ij can be termed the response vector (R j ) for volume element j in the training set.
- the functional response vector (F(R j )) is similarly defined as the ordered functions of the elements of the responses in the response vectors (R j ).
- the ordered scores C j can be termed the pathology score vector (C) for the training set.
- the process of calibrating the array microprobe for a given pathology C consists therefore of obtaining all the response vectors (R j ) and their corresponding pathology score vector (C) and from these data, after generating the functional response vector (F(R j )), obtaining a minimal correlation vector (a), which is the calibration vector of the non imaging volume microprobe.
- the calibration is identical to the calibration designed for the non imaging volume microprobe of copending application Ser. Nos. 08/510,041 and 08/510,043.
- the calibration for a number of different pathologies can be stored in a calibration library 305 for future use on unknown specimens.
- Each microprobe array includes a correlation engine 307 which can take calibration vectors from the calibration library 305 and response vectors obtained from the microprobe array and other sources such as medical records 308 and reconstruct for the response vector a value C of the observed pathology. Since in the various embodiments of the invention the different optical channels representing excitation and responses from given volume elements are equivalent, a single calibration (for a given pathology) suffices.
- the use of the calibrated microprobe array on an array of volume elements k(x,y,z), whose pathological state C k (x,y,z) is unknown, allows for the immediate and automatic diagnosis of the pathology in volume element k(x,y,z).
- This procedure is repeated for all volume elements in the array, and the set of values C k (x,y,z) for all volume elements in the array can now be presented on a display 309, either as numerical values or as artificial images of the array examined.
- Normal methods of three-dimensional image handling and manipulation can thus provide the physician with an insight as to the nature, extent, severity and penetration depth of suspected pathologies. This reduces the number of unnecessary biopsies required and provides the physician with immediate information on which he can act during the examination.
- the functions F(R ik (x,y,z) can be derived from the Fourier Transforms obtained from the responses, either with a temporal interferometer such as a Michelson interferometer or with a spatial interferometer such as a Sagnac interferometer. It is even possible to use the interferograms themselves in lieu of the Fourier transform generated from them. Similarly, when probing for molecular structural information on the probed elements, one uses for the functions F(R ik (x,y,z) the values at various wavelengths obtained from the Hadamard transform of the Raman spectral response.
- microprobe arrays of the invention can be calibrated to diagnose a plurality of pathologies P m , where m denotes a specific pathology.
- the task of calibrating the instrument for this plurality of pathologies consists as before of obtaining for a training set j, responses R ij and pathological scores P mj , where i is the bandwidth of the response or the type of artificial response, j is the volume element or the specimen in the training set and P mj is the score for pathology m on specimen j.
- a m correlation vectors
- the correlation vector (a) mentioned above is now replaced with a correlation matrix ⁇ a ⁇ whose elements are a im
- the functional response vector (F(R k )) for an uncharacterized specimen, k is replaced with the matrix ⁇ F(R k ) ⁇ whose elements are F(R imk ) and the diagnostic results are given as a vector (P) k whose elements are P mk by obtaining the product of the correlation matrix ⁇ a ⁇ with the functional response matrix ⁇ F(R k ) ⁇ .
- the correlation created will use the same responses (if not all of them at least some of them) for different pathologies.
- a response vector (R k ) (having elements R ik ) is required, which includes the minimal set of responses from volume element k to obtain diagnostic scores P mk .
- the matrix ⁇ a ⁇ can also be termed the correlation transform matrix, since it transforms one set of measurable (or observable) values, to another set of numbers or values, which are the desired pathological scores. This is achieved by multiplying the correlation transform matrix, ⁇ a ⁇ , with the vector (F(R k )), the functional response vector, to obtain a transformation of the response vector (R k ) to a diagnostic score vector (P) k .
- the correlation transform method exploited herein of predicting diagnostic or analytic information on an unknown specimen by correlating optical responses of a training set to independent determination of the diagnostic or analytic data on the training set has been shown by Rosenthal to work well on artificially homogenized samples that are large enough to provide a set of responses possessing a large signal-to-noise ratio. It is surprising that the expanded method of the instant invention yields good correlation on very minuscule volume elements in vivo. In classical spectroscopy, for instance, as practiced by Alfano, spectra or optical responses of diseased tissues are compared to similar spectra or responses of healthy tissues to attempt a diagnostic reading on the target tissue. This method fails to work because of the large variations encountered between subjects and the nature of the tissue examined.
Abstract
Description
Σa.sub.i F(I.sub.ij)+Σb.sub.u F(J.sub.uj)+Σc.sub.s G(M.sub.sj)=C.sub.j (1)
Σa.sub.i F(R.sub.ij)=C.sub.j (2)
Claims (88)
Priority Applications (15)
| Application Number | Priority Date | Filing Date | Title |
|---|---|---|---|
| US08/782,936 US6104945A (en) | 1995-08-01 | 1997-01-13 | Spectral volume microprobe arrays |
| ES98903435T ES2192320T3 (en) | 1997-01-13 | 1998-01-09 | OPTICAL MEASUREMENTS RESOLVED SPACIALLY. |
| PCT/US1998/000481 WO1998030889A1 (en) | 1997-01-13 | 1998-01-09 | Spatially resolved optical measurements |
| CA002277095A CA2277095C (en) | 1997-01-13 | 1998-01-09 | Spatially resolved optical measurements |
| DE69812886T DE69812886T2 (en) | 1997-01-13 | 1998-01-09 | OPTICAL MEASUREMENTS WITH SPATIAL RESOLUTION |
| EP98903435A EP0951643B1 (en) | 1997-01-13 | 1998-01-09 | Spatially resolved optical measurements |
| AT98903435T ATE236388T1 (en) | 1997-01-13 | 1998-01-09 | OPTICAL MEASUREMENTS WITH SPATIAL RESOLUTION |
| JP53116898A JP3992113B2 (en) | 1997-01-13 | 1998-01-09 | Spatially resolved optical measurements |
| EP02019837A EP1262763A3 (en) | 1997-01-13 | 1998-01-09 | Spatially resolved optical measurements |
| US09/241,806 US6411835B1 (en) | 1997-01-13 | 1999-02-02 | Spectral volume microprobe arrays |
| US09/481,762 US6826422B1 (en) | 1997-01-13 | 2000-01-11 | Spectral volume microprobe arrays |
| US09/591,706 US6847490B1 (en) | 1997-01-13 | 2000-06-09 | Optical probe accessory device for use in vivo diagnostic procedures |
| US10/701,123 US20040186382A1 (en) | 1997-01-13 | 2003-11-04 | Spectral volume microprobe arrays |
| US11/018,665 US20050159646A1 (en) | 1997-01-13 | 2004-12-21 | Optical probe accessory device for use in in vivo diagnostic procedures |
| US11/127,062 US20060052709A1 (en) | 1995-08-01 | 2005-05-11 | Analysis of volume elements for tissue characterization |
Applications Claiming Priority (2)
| Application Number | Priority Date | Filing Date | Title |
|---|---|---|---|
| US08/510,041 US5713364A (en) | 1995-08-01 | 1995-08-01 | Spectral volume microprobe analysis of materials |
| US08/782,936 US6104945A (en) | 1995-08-01 | 1997-01-13 | Spectral volume microprobe arrays |
Related Parent Applications (1)
| Application Number | Title | Priority Date | Filing Date |
|---|---|---|---|
| US08/510,041 Continuation-In-Part US5713364A (en) | 1995-08-01 | 1995-08-01 | Spectral volume microprobe analysis of materials |
Related Child Applications (2)
| Application Number | Title | Priority Date | Filing Date |
|---|---|---|---|
| US09/241,806 Continuation-In-Part US6411835B1 (en) | 1995-08-01 | 1999-02-02 | Spectral volume microprobe arrays |
| US09/841,325 Continuation-In-Part US20010041843A1 (en) | 1995-08-01 | 2001-04-24 | Spectral volume microprobe arrays |
Publications (1)
| Publication Number | Publication Date |
|---|---|
| US6104945A true US6104945A (en) | 2000-08-15 |
Family
ID=25127644
Family Applications (1)
| Application Number | Title | Priority Date | Filing Date |
|---|---|---|---|
| US08/782,936 Expired - Lifetime US6104945A (en) | 1995-08-01 | 1997-01-13 | Spectral volume microprobe arrays |
Country Status (8)
| Country | Link |
|---|---|
| US (1) | US6104945A (en) |
| EP (2) | EP1262763A3 (en) |
| JP (1) | JP3992113B2 (en) |
| AT (1) | ATE236388T1 (en) |
| CA (1) | CA2277095C (en) |
| DE (1) | DE69812886T2 (en) |
| ES (1) | ES2192320T3 (en) |
| WO (1) | WO1998030889A1 (en) |
Cited By (65)
| Publication number | Priority date | Publication date | Assignee | Title |
|---|---|---|---|---|
| US6329661B1 (en) * | 2000-02-29 | 2001-12-11 | The University Of Chicago | Biochip scanner device |
| US6343228B1 (en) * | 1999-10-19 | 2002-01-29 | The Hong Kong University Of Science And Technology | Method and apparatus for fluorescence imaging of tissue |
| WO2002012854A2 (en) * | 2000-08-04 | 2002-02-14 | Photonify Technologies, Inc. | Systems and methods for providing information concerning chromophores in physiological media |
| US6369888B1 (en) * | 1999-11-17 | 2002-04-09 | Applied Materials, Inc. | Method and apparatus for article inspection including speckle reduction |
| US6385484B2 (en) | 1998-12-23 | 2002-05-07 | Medispectra, Inc. | Spectroscopic system employing a plurality of data types |
| US6411835B1 (en) * | 1997-01-13 | 2002-06-25 | Medispectra, Inc. | Spectral volume microprobe arrays |
| US6417506B1 (en) * | 1995-05-23 | 2002-07-09 | The Regents Of The University Of California | High density array fabrication and readout method for a fiber optic biosensor |
| US20020146160A1 (en) * | 2001-01-19 | 2002-10-10 | Parker Mary F. | Method and apparatus for generating two-dimensional images of cervical tissue from three-dimensional hyperspectral cubes |
| US20030016357A1 (en) * | 2002-07-30 | 2003-01-23 | Shofner Frederick M. | Measurement of aerosol mass concentration and mass delivery rate |
| US6516209B2 (en) * | 2000-08-04 | 2003-02-04 | Photonify Technologies, Inc. | Self-calibrating optical imaging system |
| US6538730B2 (en) * | 2001-04-06 | 2003-03-25 | Kla-Tencor Technologies Corporation | Defect detection system |
| US20030078739A1 (en) * | 2001-10-05 | 2003-04-24 | Surromed, Inc. | Feature list extraction from data sets such as spectra |
| US6587711B1 (en) * | 1999-07-22 | 2003-07-01 | The Research Foundation Of Cuny | Spectral polarizing tomographic dermatoscope |
| US6587703B2 (en) | 2000-09-18 | 2003-07-01 | Photonify Technologies, Inc. | System and method for measuring absolute oxygen saturation |
| US6597931B1 (en) | 2000-09-18 | 2003-07-22 | Photonify Technologies, Inc. | System and method for absolute oxygen saturation |
| US6603537B1 (en) * | 1998-08-21 | 2003-08-05 | Surromed, Inc. | Optical architectures for microvolume laser-scanning cytometers |
| US20030160957A1 (en) * | 2000-07-14 | 2003-08-28 | Applera Corporation | Scanning system and method for scanning a plurality of samples |
| US20040079894A1 (en) * | 2002-10-23 | 2004-04-29 | Leica Microsystems (Schweiz) Ag | Eye protection system on an electronically controlled fluorescence microscope |
| US20040111031A1 (en) * | 1999-07-22 | 2004-06-10 | Alfano Robert R. | Spectral polarizing tomographic dermatoscope |
| US20040125368A1 (en) * | 2002-09-13 | 2004-07-01 | Mehdi Vaez-Iravani | Inspection system for integrated applications |
| US20040141178A1 (en) * | 2001-06-29 | 2004-07-22 | Reiner Spolaczyk | Device for photometric measurement of several samples |
| US6768918B2 (en) | 2002-07-10 | 2004-07-27 | Medispectra, Inc. | Fluorescent fiberoptic probe for tissue health discrimination and method of use thereof |
| US20040161143A1 (en) * | 1999-07-21 | 2004-08-19 | Dietz Louis J. | System for microvolume laser scanning cytometry |
| US20040169853A1 (en) * | 2003-02-18 | 2004-09-02 | Yoichiro Iwa | Surface inspection apparatus |
| US6791676B1 (en) * | 1999-10-08 | 2004-09-14 | Dade Behring Marburg Gmbh | Spectrophotometric and nephelometric detection unit |
| US6818903B2 (en) | 2002-07-09 | 2004-11-16 | Medispectra, Inc. | Method and apparatus for identifying spectral artifacts |
| US6826422B1 (en) * | 1997-01-13 | 2004-11-30 | Medispectra, Inc. | Spectral volume microprobe arrays |
| US20050046848A1 (en) * | 2003-08-26 | 2005-03-03 | Blueshift Biotechnologies, Inc. | Time dependent fluorescence measurements |
| US20050059681A1 (en) * | 2001-10-09 | 2005-03-17 | Christopher Cremer | Far field light microscopical method system and computer program product for analysing at least one object having a subwavelength size |
| US20050209789A1 (en) * | 2001-08-24 | 2005-09-22 | Hastings Curtis A | Peak selection in multidimensional data |
| US20050280817A1 (en) * | 2004-04-02 | 2005-12-22 | Uwe Horchner | Polychromic laser scanning system and method of use |
| US20060007436A1 (en) * | 2004-07-09 | 2006-01-12 | Toshiro Kurosawa | Appearance inspection apparatus and projection method for projecting image of sample under inspection |
| US20060097154A1 (en) * | 2000-11-27 | 2006-05-11 | Curtis Hastings | Median filter for liquid chromatography-mass spectrometry data |
| US20060131222A1 (en) * | 2002-05-09 | 2006-06-22 | Ppd Biomarker Discovery Sciences, Llc | Methods for time-alignment of liquid chromatography-mass spectrometry data |
| US20060253261A1 (en) * | 2004-05-05 | 2006-11-09 | Chem Image Corporation | Digitizing biology |
| US20060259246A1 (en) * | 2000-11-28 | 2006-11-16 | Ppd Biomarker Discovery Sciences, Llc | Methods for efficiently mining broad data sets for biological markers |
| US20070161876A1 (en) * | 2005-11-18 | 2007-07-12 | Spectrx, Inc. | Method and apparatus for rapid detection and diagnosis of tissue abnormalities |
| US7259845B2 (en) | 1999-04-23 | 2007-08-21 | Ppd Biomarker Discovery Sciences Llc | Disposable optical cuvette cartridge with low fluorescence material |
| US20080080816A1 (en) * | 2004-07-27 | 2008-04-03 | Ut-Battelle, Llc | Multi-tipped optical component |
| US20090259446A1 (en) * | 2008-04-10 | 2009-10-15 | Schlumberger Technology Corporation | Method to generate numerical pseudocores using borehole images, digital rock samples, and multi-point statistics |
| US20100145199A1 (en) * | 2006-03-02 | 2010-06-10 | Kristie Johnson | Cancer Detection System |
| US20100261958A1 (en) * | 2007-11-12 | 2010-10-14 | Cornell University | Multi-path, multi-magnification, non-confocal fluorescence emission endoscopy apparatus and methods |
| US20100270479A1 (en) * | 2007-11-12 | 2010-10-28 | Cornell University | Non-imaging, weakly focused fluorescence emission apparatus and method |
| US20110004447A1 (en) * | 2009-07-01 | 2011-01-06 | Schlumberger Technology Corporation | Method to build 3D digital models of porous media using transmitted laser scanning confocal mircoscopy and multi-point statistics |
| US20110004448A1 (en) * | 2009-07-01 | 2011-01-06 | Schlumberger Technology Corporation | Method to quantify discrete pore shapes, volumes, and surface areas using confocal profilometry |
| US20110101243A1 (en) * | 2008-06-24 | 2011-05-05 | Koninklijke Philips Electronics N.V. | Microarray characterization system and method |
| US20110117025A1 (en) * | 2008-05-20 | 2011-05-19 | Ralph Sebastian Dacosta | Device and method for fluorescence-based imaging and monitoring |
| US20120179010A1 (en) * | 2002-04-04 | 2012-07-12 | Maynard John D | Determination of a Measure of a Glycation End-Product or Disease State Using Tissue Fluorescence of Various Sites |
| US20120289947A1 (en) * | 2010-01-18 | 2012-11-15 | Wolfgang Neuberger | Device and method for removing veins |
| US20130003072A1 (en) * | 2009-09-04 | 2013-01-03 | Christian Buil | Field-compensated interferometer |
| US20150025445A1 (en) * | 2013-07-18 | 2015-01-22 | International Business Machines Corporation | Laser-assisted transdermal delivery of nanoparticulates and hydrogels |
| DE102014108143A1 (en) * | 2014-06-10 | 2015-12-10 | Kist Europe-Korea Institute of Science and Technologie Europe Forschungsgesellschaft mbh | An optical system for detecting fluorescent or luminescent signals of at least two samples |
| US20150359440A1 (en) * | 2013-01-28 | 2015-12-17 | Oslo Universitetssykehus Hf | Assessing circulatory failure |
| US20160161218A1 (en) * | 2014-12-08 | 2016-06-09 | The Charles Stark Draper Laboratory, Inc. | Multi-Target Optical Designator |
| EP3003131A4 (en) * | 2013-06-06 | 2017-01-18 | Profusa, Inc. | Apparatus and methods for detecting optical signals from implanted sensors |
| US9581723B2 (en) | 2008-04-10 | 2017-02-28 | Schlumberger Technology Corporation | Method for characterizing a geological formation traversed by a borehole |
| DE102016200271A1 (en) * | 2016-01-13 | 2017-07-13 | Institut Dr. Foerster Gmbh & Co. Kg | Device for generating and measuring an emission |
| US20170227469A1 (en) * | 2016-02-05 | 2017-08-10 | Sciaps, Inc. | Analyzer alignment, sample detection, localization, and focusing method and system |
| US9828284B2 (en) | 2014-03-28 | 2017-11-28 | Ut-Battelle, Llc | Thermal history-based etching |
| US10045722B2 (en) | 2013-03-14 | 2018-08-14 | Profusa, Inc. | Method and device for correcting optical signals |
| US10117613B2 (en) | 2010-10-06 | 2018-11-06 | Profusa, Inc. | Tissue-integrating sensors |
| US10438356B2 (en) | 2014-07-24 | 2019-10-08 | University Health Network | Collection and analysis of data for diagnostic purposes |
| US10473766B2 (en) | 2017-03-13 | 2019-11-12 | The Charles Stark Draper Laboratory, Inc. | Light detection and ranging (LiDAR) system and method |
| WO2021070170A1 (en) * | 2019-10-10 | 2021-04-15 | Check-Cap Ltd. | Fail safe radiation concealment mechanism |
| US11961236B2 (en) | 2023-06-13 | 2024-04-16 | University Health Network | Collection and analysis of data for diagnostic purposes |
Families Citing this family (67)
| Publication number | Priority date | Publication date | Assignee | Title |
|---|---|---|---|---|
| WO2000028304A1 (en) * | 1998-11-11 | 2000-05-18 | The University Of Manchester Institute Of Science And Technology | Chemical species distribution and mixture monitoring |
| DE19919092A1 (en) | 1999-04-27 | 2000-11-02 | Zeiss Carl Jena Gmbh | Arrangement for the optical evaluation of an array of objects |
| GB2351556B (en) | 1999-06-26 | 2004-06-30 | Cambridge Imaging Ltd | Improved assay analysis |
| US6411373B1 (en) | 1999-10-08 | 2002-06-25 | Instrumentation Metrics, Inc. | Fiber optic illumination and detection patterns, shapes, and locations for use in spectroscopic analysis |
| AU2001245329A1 (en) * | 2000-02-22 | 2001-09-03 | Shofner Engineering Associates, Inc. | Measurement of aerosol mass concentration and mass delivery rate |
| JP2002005835A (en) * | 2000-06-23 | 2002-01-09 | 宏夫 ▲浜▼口 | Raman spectroscopic measuring apparatus and analytical method for living body sample using the same |
| JP4241038B2 (en) | 2000-10-30 | 2009-03-18 | ザ ジェネラル ホスピタル コーポレーション | Optical method and system for tissue analysis |
| DE10206004A1 (en) * | 2002-02-14 | 2003-08-28 | Zeiss Carl Jena Gmbh | Device for confocal optical microanalysis |
| JP2004222870A (en) * | 2003-01-21 | 2004-08-12 | Pentax Corp | Probe for endoscope |
| WO2004088361A2 (en) | 2003-03-31 | 2004-10-14 | The General Hospital Corporation | Speckle reduction in optical coherence tomography by path length encoded angular compounding |
| KR101386971B1 (en) | 2003-06-06 | 2014-04-18 | 더 제너럴 하스피탈 코포레이션 | Process and apparatus for a wavelength tunning source |
| JP4913041B2 (en) * | 2004-06-04 | 2012-04-11 | カール・ツァイス・エスエムティー・ゲーエムベーハー | Projection system with compensation for intensity variation and compensation element therefor |
| WO2006014392A1 (en) | 2004-07-02 | 2006-02-09 | The General Hospital Corporation | Endoscopic imaging probe comprising dual clad fibre |
| WO2006024014A2 (en) | 2004-08-24 | 2006-03-02 | The General Hospital Corporation | Process, system and software arrangement for measuring a mechanical strain and elastic properties of a sample |
| US8208995B2 (en) | 2004-08-24 | 2012-06-26 | The General Hospital Corporation | Method and apparatus for imaging of vessel segments |
| JP2008521516A (en) | 2004-11-29 | 2008-06-26 | ザ ジェネラル ホスピタル コーポレイション | Configuration, apparatus, endoscope, catheter, and method for performing optical image generation by simultaneously illuminating and detecting multiple points on a sample |
| EP2325803A1 (en) | 2005-04-28 | 2011-05-25 | The General Hospital Corporation | Evaluating optical coherence tomography information for an anatomical structure |
| US9060689B2 (en) | 2005-06-01 | 2015-06-23 | The General Hospital Corporation | Apparatus, method and system for performing phase-resolved optical frequency domain imaging |
| ES2354287T3 (en) | 2005-08-09 | 2011-03-11 | The General Hospital Corporation | APPARATUS AND METHOD FOR PERFORMING A DEMODULATION IN QUADRATURE BY POLARIZATION IN OPTICAL COHERENCE TOMOGRAPHY. |
| CN101365375B (en) | 2005-09-29 | 2013-09-11 | 通用医疗公司 | Method and apparatus for optical imaging via spectral encoding |
| PL1973466T3 (en) | 2006-01-19 | 2021-07-05 | The General Hospital Corporation | Ballon imaging catheter |
| US8145018B2 (en) | 2006-01-19 | 2012-03-27 | The General Hospital Corporation | Apparatus for obtaining information for a structure using spectrally-encoded endoscopy techniques and methods for producing one or more optical arrangements |
| WO2007149603A2 (en) | 2006-02-01 | 2007-12-27 | The General Hospital Corporation | Apparatus for applying a plurality of electro-magnetic radiations to a sample |
| JP5524487B2 (en) | 2006-02-01 | 2014-06-18 | ザ ジェネラル ホスピタル コーポレイション | A method and system for emitting electromagnetic radiation to at least a portion of a sample using a conformal laser treatment procedure. |
| EP1987318B1 (en) | 2006-02-24 | 2015-08-12 | The General Hospital Corporation | Methods and systems for performing angle-resolved fourier-domain optical coherence tomography |
| US7872754B2 (en) * | 2006-04-18 | 2011-01-18 | Koninklijke Philips Electronics N.V. | Optical measurement device |
| EP2517616A3 (en) | 2006-05-10 | 2013-03-06 | The General Hospital Corporation | Processes, arrangements and systems for providing frequency domain imaging of a sample |
| EP1898206A1 (en) * | 2006-09-06 | 2008-03-12 | DKFZ Deutsches Krebsforschungszentrum | Dual-modality imaging |
| WO2008049118A2 (en) | 2006-10-19 | 2008-04-24 | The General Hospital Corporation | Apparatus and method for obtaining and providing imaging information associated with at least one portion of a sample and effecting such portion(s) |
| JP5002813B2 (en) * | 2007-02-06 | 2012-08-15 | 国立大学法人浜松医科大学 | Fluorescence measuring device |
| EP2602651A3 (en) | 2007-03-23 | 2014-08-27 | The General Hospital Corporation | Methods, arrangements and apparatus for utilizing a wavelength-swept laser using angular scanning and dispersion procedures |
| US10534129B2 (en) | 2007-03-30 | 2020-01-14 | The General Hospital Corporation | System and method providing intracoronary laser speckle imaging for the detection of vulnerable plaque |
| EP2163885A1 (en) * | 2008-06-24 | 2010-03-17 | Koninklijke Philips Electronics N.V. | Microarray characterization system and method |
| WO2010009136A2 (en) | 2008-07-14 | 2010-01-21 | The General Hospital Corporation | Apparatus and methods for color endoscopy |
| JP5731394B2 (en) | 2008-12-10 | 2015-06-10 | ザ ジェネラル ホスピタル コーポレイション | System, apparatus and method for extending imaging depth range of optical coherence tomography through optical subsampling |
| US9615748B2 (en) | 2009-01-20 | 2017-04-11 | The General Hospital Corporation | Endoscopic biopsy apparatus, system and method |
| CN102308444B (en) | 2009-02-04 | 2014-06-18 | 通用医疗公司 | Apparatus and method for utilization of a high-speed optical wavelength tuning source |
| BR112012001042A2 (en) | 2009-07-14 | 2016-11-22 | Gen Hospital Corp | fluid flow measurement equipment and method within anatomical structure. |
| ES2831223T3 (en) | 2010-03-05 | 2021-06-07 | Massachusetts Gen Hospital | Apparatus for providing electromagnetic radiation to a sample |
| US9069130B2 (en) | 2010-05-03 | 2015-06-30 | The General Hospital Corporation | Apparatus, method and system for generating optical radiation from biological gain media |
| US9795301B2 (en) | 2010-05-25 | 2017-10-24 | The General Hospital Corporation | Apparatus, systems, methods and computer-accessible medium for spectral analysis of optical coherence tomography images |
| US9557154B2 (en) | 2010-05-25 | 2017-01-31 | The General Hospital Corporation | Systems, devices, methods, apparatus and computer-accessible media for providing optical imaging of structures and compositions |
| EP2575591A4 (en) | 2010-06-03 | 2017-09-13 | The General Hospital Corporation | Apparatus and method for devices for imaging structures in or at one or more luminal organs |
| US9510758B2 (en) | 2010-10-27 | 2016-12-06 | The General Hospital Corporation | Apparatus, systems and methods for measuring blood pressure within at least one vessel |
| WO2013013049A1 (en) | 2011-07-19 | 2013-01-24 | The General Hospital Corporation | Systems, methods, apparatus and computer-accessible-medium for providing polarization-mode dispersion compensation in optical coherence tomography |
| EP2769491A4 (en) | 2011-10-18 | 2015-07-22 | Gen Hospital Corp | Apparatus and methods for producing and/or providing recirculating optical delay(s) |
| WO2013148306A1 (en) | 2012-03-30 | 2013-10-03 | The General Hospital Corporation | Imaging system, method and distal attachment for multidirectional field of view endoscopy |
| EP2844983A2 (en) * | 2012-04-30 | 2015-03-11 | Mayo Foundation For Medical Education And Research | Spectrometric systems and methods for improved focus localization of time-and space-varying measurements |
| WO2013177154A1 (en) | 2012-05-21 | 2013-11-28 | The General Hospital Corporation | Apparatus, device and method for capsule microscopy |
| JP6227652B2 (en) | 2012-08-22 | 2017-11-08 | ザ ジェネラル ホスピタル コーポレイション | System, method, and computer-accessible medium for fabricating a miniature endoscope using soft lithography |
| JP6560126B2 (en) | 2013-01-28 | 2019-08-14 | ザ ジェネラル ホスピタル コーポレイション | Apparatus and method for providing diffusion spectroscopy superimposed on optical frequency domain imaging |
| WO2014120791A1 (en) | 2013-01-29 | 2014-08-07 | The General Hospital Corporation | Apparatus, systems and methods for providing information regarding the aortic valve |
| US11179028B2 (en) | 2013-02-01 | 2021-11-23 | The General Hospital Corporation | Objective lens arrangement for confocal endomicroscopy |
| JP6378311B2 (en) | 2013-03-15 | 2018-08-22 | ザ ジェネラル ホスピタル コーポレイション | Methods and systems for characterizing objects |
| EP2992826B1 (en) | 2013-05-02 | 2023-01-04 | Atonarp Inc. | Monitor and system for monitoring living organisms |
| WO2014186353A1 (en) | 2013-05-13 | 2014-11-20 | The General Hospital Corporation | Detecting self-interefering fluorescence phase and amplitude |
| JPWO2014199885A1 (en) * | 2013-06-13 | 2017-02-23 | コニカミノルタ株式会社 | Multi-angle colorimeter |
| WO2015009932A1 (en) | 2013-07-19 | 2015-01-22 | The General Hospital Corporation | Imaging apparatus and method which utilizes multidirectional field of view endoscopy |
| EP3021735A4 (en) | 2013-07-19 | 2017-04-19 | The General Hospital Corporation | Determining eye motion by imaging retina. with feedback |
| EP3025173B1 (en) | 2013-07-26 | 2021-07-07 | The General Hospital Corporation | Apparatus with a laser arrangement utilizing optical dispersion for applications in fourier-domain optical coherence tomography |
| US9733460B2 (en) | 2014-01-08 | 2017-08-15 | The General Hospital Corporation | Method and apparatus for microscopic imaging |
| WO2015116986A2 (en) | 2014-01-31 | 2015-08-06 | The General Hospital Corporation | System and method for facilitating manual and/or automatic volumetric imaging with real-time tension or force feedback using a tethered imaging device |
| WO2015153982A1 (en) | 2014-04-04 | 2015-10-08 | The General Hospital Corporation | Apparatus and method for controlling propagation and/or transmission of electromagnetic radiation in flexible waveguide(s) |
| WO2016015052A1 (en) | 2014-07-25 | 2016-01-28 | The General Hospital Corporation | Apparatus, devices and methods for in vivo imaging and diagnosis |
| EP3273225B1 (en) | 2015-01-30 | 2022-11-23 | Japan Science and Technology Agency | Multifocal spectroscopic measurement device, and optical system for multifocal spectroscopic measurement device |
| FR3032527B1 (en) * | 2015-02-06 | 2020-03-13 | Commissariat A L'energie Atomique Et Aux Energies Alternatives | DEVICE FOR MEASURING AN OPTICAL SIGNAL BACKPACKED BY A SAMPLE |
| JP2022032193A (en) * | 2020-08-11 | 2022-02-25 | 株式会社ヴィーネックス | Foreign substance/defect inspection apparatus, image forming device in foreign substance/defect inspection apparatus, and foreign substance/defect inspection method |
Citations (71)
| Publication number | Priority date | Publication date | Assignee | Title |
|---|---|---|---|---|
| US34214A (en) * | 1862-01-21 | Improvement in washers for paper-pulp | ||
| US3013467A (en) * | 1957-11-07 | 1961-12-19 | Minsky Marvin | Microscopy apparatus |
| US4017192A (en) * | 1975-02-06 | 1977-04-12 | Neotec Corporation | Optical analysis of biomedical specimens |
| US4198571A (en) * | 1977-04-28 | 1980-04-15 | National Research Development Corporation | Scanning microscopes |
| US4254421A (en) * | 1979-12-05 | 1981-03-03 | Communications Satellite Corporation | Integrated confocal electromagnetic wave lens and feed antenna system |
| US4357075A (en) * | 1979-07-02 | 1982-11-02 | Hunter Thomas M | Confocal reflector system |
| US4397557A (en) * | 1979-12-20 | 1983-08-09 | Heimann Gmbh | Optical arrangement for a light scattering type smoke detector |
| SU1223092A1 (en) * | 1984-03-11 | 1986-04-07 | Предприятие П/Я Р-6681 | Small-angle nephelometer |
| US4733063A (en) * | 1985-12-13 | 1988-03-22 | Hitachi, Ltd. | Scanning laser microscope with aperture alignment |
| US4753530A (en) * | 1980-08-21 | 1988-06-28 | Oriel Scientific Ltd. | Analytical optical instruments |
| EP0280418A1 (en) * | 1987-02-02 | 1988-08-31 | Wyatt Technology Corporation | Method and apparatus for examining the interior of semi-opaque objects |
| US4844617A (en) * | 1988-01-20 | 1989-07-04 | Tencor Instruments | Confocal measuring microscope with automatic focusing |
| US4845352A (en) * | 1986-12-08 | 1989-07-04 | U.S. Philips Corporation | Scanning differential phase contrast microscope |
| US4852955A (en) * | 1986-09-16 | 1989-08-01 | Laser Precision Corporation | Microscope for use in modular FTIR spectrometer system |
| EP0335725A2 (en) * | 1988-04-01 | 1989-10-04 | Syntex (U.S.A.) Inc. | Apparatus and method for detection of fluorescence or light scatter |
| US4930516A (en) * | 1985-11-13 | 1990-06-05 | Alfano Robert R | Method for detecting cancerous tissue using visible native luminescence |
| US4965441A (en) * | 1988-01-27 | 1990-10-23 | Commissariat A L'energie Atomique | Method for the scanning confocal light-optical microscopic and indepth examination of an extended field and devices for implementing said method |
| US4972258A (en) * | 1989-07-31 | 1990-11-20 | E. I. Du Pont De Nemours And Company | Scanning laser microscope system and methods of use |
| US4997242A (en) * | 1988-03-07 | 1991-03-05 | Medical Research Council | Achromatic scanning system |
| US5011243A (en) * | 1986-09-16 | 1991-04-30 | Laser Precision Corporation | Reflectance infrared microscope having high radiation throughput |
| US5028802A (en) * | 1990-01-11 | 1991-07-02 | Eye Research Institute Of Retina Foundation | Imaging apparatus and methods utilizing scannable microlaser source |
| US5032720A (en) * | 1988-04-21 | 1991-07-16 | White John G | Confocal imaging system |
| US5034613A (en) * | 1989-11-14 | 1991-07-23 | Cornell Research Foundation, Inc. | Two-photon laser microscopy |
| US5042494A (en) * | 1985-11-13 | 1991-08-27 | Alfano Robert R | Method and apparatus for detecting cancerous tissue using luminescence excitation spectra |
| US5054926A (en) * | 1987-03-24 | 1991-10-08 | Commonwealth Scientific And Industrial Research Organisation | Distance measuring device |
| US5065008A (en) * | 1989-10-18 | 1991-11-12 | Fuji Photo Film Co., Ltd. | Scanning microscope and scanning mechanism for the same |
| US5071246A (en) * | 1989-10-27 | 1991-12-10 | Carl-Zeiss-Stiftung | Confocal scanning ophthalmoscope |
| US5074306A (en) * | 1990-02-22 | 1991-12-24 | The General Hospital Corporation | Measurement of burn depth in skin |
| US5083220A (en) * | 1990-03-22 | 1992-01-21 | Tandem Scanning Corporation | Scanning disks for use in tandem scanning reflected light microscopes and other optical systems |
| US5091652A (en) * | 1990-01-12 | 1992-02-25 | The Regents Of The University Of California | Laser excited confocal microscope fluorescence scanner and method |
| EP0474264A2 (en) * | 1991-04-24 | 1992-03-11 | Kaman Aerospace Corporation | Spectrally dispersive imaging Lidar method and apparatus |
| US5120953A (en) * | 1988-07-13 | 1992-06-09 | Harris Martin R | Scanning confocal microscope including a single fibre for transmitting light to and receiving light from an object |
| US5122653A (en) * | 1989-08-22 | 1992-06-16 | Nikon Corporation | Confocal type laser scan microscope with integrated illumination, detection and waveguide system |
| US5132526A (en) * | 1990-04-10 | 1992-07-21 | Fuji Photo Film Co., Ltd. | Confocal scanning microscope having a signal output regulating means |
| US5139025A (en) * | 1983-10-14 | 1992-08-18 | Somanetics Corporation | Method and apparatus for in vivo optical spectroscopic examination |
| US5161053A (en) * | 1988-08-01 | 1992-11-03 | Commonwealth Scientific & Industrial Research | Confocal microscope |
| US5162941A (en) * | 1991-07-23 | 1992-11-10 | The Board Of Governors Of Wayne State University | Confocal microscope |
| US5162641A (en) * | 1991-02-19 | 1992-11-10 | Phoenix Laser Systems, Inc. | System and method for detecting, correcting and measuring depth movement of target tissue in a laser surgical system |
| US5168157A (en) * | 1990-11-20 | 1992-12-01 | Fuji Photo Film Co., Ltd. | Scanning microscope with means for detecting a first and second polarized light beams along first and second optical receiving paths |
| US5192980A (en) * | 1990-06-27 | 1993-03-09 | A. E. Dixon | Apparatus and method for method for spatially- and spectrally-resolved measurements |
| US5201318A (en) * | 1989-04-24 | 1993-04-13 | Rava Richard P | Contour mapping of spectral diagnostics |
| US5225671A (en) * | 1991-05-29 | 1993-07-06 | Olympus Optical Co., Ltd. | Confocal optical apparatus |
| US5235457A (en) * | 1987-09-24 | 1993-08-10 | Washington University | Kit for converting a standard microscope into a single aperture confocal scanning epi-illumination microscope |
| US5239178A (en) * | 1990-11-10 | 1993-08-24 | Carl Zeiss | Optical device with an illuminating grid and detector grid arranged confocally to an object |
| US5248876A (en) * | 1992-04-21 | 1993-09-28 | International Business Machines Corporation | Tandem linear scanning confocal imaging system with focal volumes at different heights |
| US5260569A (en) * | 1991-07-25 | 1993-11-09 | Fuji Photo Film Co., Ltd. | Scanning microscope and scanning mechanism |
| US5260578A (en) * | 1991-04-10 | 1993-11-09 | Mayo Foundation For Medical Education And Research | Confocal imaging system for visible and ultraviolet light |
| US5262646A (en) * | 1990-07-27 | 1993-11-16 | Booker Graham R | Infra-red scanning microscopy |
| US5274240A (en) * | 1990-01-12 | 1993-12-28 | The Regents Of The University Of California | Capillary array confocal fluorescence scanner and method |
| US5284149A (en) * | 1992-01-23 | 1994-02-08 | Dhadwal Harbans S | Method and apparatus for determining the physical characteristics of ocular tissue |
| US5294799A (en) * | 1993-02-01 | 1994-03-15 | Aslund Nils R D | Apparatus for quantitative imaging of multiple fluorophores |
| US5296700A (en) * | 1991-09-12 | 1994-03-22 | Nikon Corporation | Fluorescent confocal microscope with chromatic aberration compensation |
| US5303026A (en) * | 1991-02-26 | 1994-04-12 | The Regents Of The University Of California Los Alamos National Laboratory | Apparatus and method for spectroscopic analysis of scattering media |
| US5306902A (en) * | 1992-09-01 | 1994-04-26 | International Business Machines Corporation | Confocal method and apparatus for focusing in projection lithography |
| US5313567A (en) * | 1991-06-13 | 1994-05-17 | At&T Bell Laboratories | Arrangement for determining and displaying volumetric data in an imaging system |
| US5319200A (en) * | 1991-06-05 | 1994-06-07 | Zeltex, Inc. | Rapid near-infrared measurement of nonhomogeneous samples |
| US5324979A (en) * | 1990-09-26 | 1994-06-28 | Futrex, Inc. | Method and means for generating synthetic spectra allowing quantitative measurement in near infrared measuring instruments |
| US5329352A (en) * | 1991-04-12 | 1994-07-12 | Bayer Aktiengesellschaft | Spectroscopically correlated light scanning microscopy |
| US5343038A (en) * | 1991-12-12 | 1994-08-30 | Matsushita Electric Industrial Co., Ltd. | Scanning laser microscope with photo coupling and detecting unit |
| US5345306A (en) * | 1990-05-22 | 1994-09-06 | Research Development Corporation Of Japan | Method and apparatus for measuring spectral absorption in an opaque specimen and method and apparatus for measuring the microscopic absorption distribution |
| WO1994026168A1 (en) * | 1993-05-12 | 1994-11-24 | Board Of Regents, The University Of Texas System | Diagnosis of dysplasia using laser induced fluorescence |
| EP0641542A2 (en) * | 1993-09-03 | 1995-03-08 | Ken Ishihara | Non-invasive blood analyzer and method using the same |
| US5418797A (en) * | 1993-01-15 | 1995-05-23 | The United States Of America As Represented By The Secretary Of The Navy | Time gated imaging through scattering material using polarization and stimulated raman amplification |
| US5421337A (en) * | 1989-04-14 | 1995-06-06 | Massachusetts Institute Of Technology | Spectral diagnosis of diseased tissue |
| US5451931A (en) * | 1992-09-14 | 1995-09-19 | Cerberus Ag | Optical smoke detector |
| US5477382A (en) * | 1994-08-05 | 1995-12-19 | Northrop Grumman Corporation | Optical correlator system |
| US5480775A (en) * | 1990-01-26 | 1996-01-02 | Canon Kabushiki Kaisha | Method for measuring a specimen by the use of fluorescent light |
| US5493444A (en) * | 1994-04-28 | 1996-02-20 | The United States Of America As Represented By The Secretary Of The Air Force | Photorefractive two-beam coupling nonlinear joint transform correlator |
| US5587832A (en) * | 1993-10-20 | 1996-12-24 | Biophysica Technologies, Inc. | Spatially light modulated confocal microscope and method |
| WO1997005473A1 (en) * | 1995-08-01 | 1997-02-13 | Medispectra, Inc. | Optical microprobes and methods for spectral analysis of materials |
| US5713364A (en) * | 1995-08-01 | 1998-02-03 | Medispectra, Inc. | Spectral volume microprobe analysis of materials |
Family Cites Families (4)
| Publication number | Priority date | Publication date | Assignee | Title |
|---|---|---|---|---|
| US4515165A (en) * | 1980-02-04 | 1985-05-07 | Energy Conversion Devices, Inc. | Apparatus and method for detecting tumors |
| JPH026730A (en) * | 1988-06-25 | 1990-01-10 | Shimadzu Corp | Optical scanner |
| ATE137588T1 (en) * | 1990-11-10 | 1996-05-15 | Grosskopf Rudolf Dr Ing | OPTICAL SCANNING DEVICE WITH CONFOCAL BEAM PATH USING LIGHT SOURCE AND DETECTOR MATRIX |
| JP3779352B2 (en) * | 1995-05-17 | 2006-05-24 | 聡 河田 | Infrared microspectroscopic analysis method and apparatus |
-
1997
- 1997-01-13 US US08/782,936 patent/US6104945A/en not_active Expired - Lifetime
-
1998
- 1998-01-09 EP EP02019837A patent/EP1262763A3/en not_active Withdrawn
- 1998-01-09 JP JP53116898A patent/JP3992113B2/en not_active Expired - Fee Related
- 1998-01-09 DE DE69812886T patent/DE69812886T2/en not_active Expired - Lifetime
- 1998-01-09 ES ES98903435T patent/ES2192320T3/en not_active Expired - Lifetime
- 1998-01-09 EP EP98903435A patent/EP0951643B1/en not_active Expired - Lifetime
- 1998-01-09 AT AT98903435T patent/ATE236388T1/en not_active IP Right Cessation
- 1998-01-09 WO PCT/US1998/000481 patent/WO1998030889A1/en active IP Right Grant
- 1998-01-09 CA CA002277095A patent/CA2277095C/en not_active Expired - Fee Related
Patent Citations (73)
| Publication number | Priority date | Publication date | Assignee | Title |
|---|---|---|---|---|
| US34214A (en) * | 1862-01-21 | Improvement in washers for paper-pulp | ||
| US3013467A (en) * | 1957-11-07 | 1961-12-19 | Minsky Marvin | Microscopy apparatus |
| US4017192A (en) * | 1975-02-06 | 1977-04-12 | Neotec Corporation | Optical analysis of biomedical specimens |
| US4198571A (en) * | 1977-04-28 | 1980-04-15 | National Research Development Corporation | Scanning microscopes |
| US4357075A (en) * | 1979-07-02 | 1982-11-02 | Hunter Thomas M | Confocal reflector system |
| US4254421A (en) * | 1979-12-05 | 1981-03-03 | Communications Satellite Corporation | Integrated confocal electromagnetic wave lens and feed antenna system |
| US4397557A (en) * | 1979-12-20 | 1983-08-09 | Heimann Gmbh | Optical arrangement for a light scattering type smoke detector |
| US4753530A (en) * | 1980-08-21 | 1988-06-28 | Oriel Scientific Ltd. | Analytical optical instruments |
| US5139025A (en) * | 1983-10-14 | 1992-08-18 | Somanetics Corporation | Method and apparatus for in vivo optical spectroscopic examination |
| SU1223092A1 (en) * | 1984-03-11 | 1986-04-07 | Предприятие П/Я Р-6681 | Small-angle nephelometer |
| US5042494A (en) * | 1985-11-13 | 1991-08-27 | Alfano Robert R | Method and apparatus for detecting cancerous tissue using luminescence excitation spectra |
| US4930516B1 (en) * | 1985-11-13 | 1998-08-04 | Laser Diagnostic Instr Inc | Method for detecting cancerous tissue using visible native luminescence |
| US4930516A (en) * | 1985-11-13 | 1990-06-05 | Alfano Robert R | Method for detecting cancerous tissue using visible native luminescence |
| US4733063A (en) * | 1985-12-13 | 1988-03-22 | Hitachi, Ltd. | Scanning laser microscope with aperture alignment |
| US4852955A (en) * | 1986-09-16 | 1989-08-01 | Laser Precision Corporation | Microscope for use in modular FTIR spectrometer system |
| US5011243A (en) * | 1986-09-16 | 1991-04-30 | Laser Precision Corporation | Reflectance infrared microscope having high radiation throughput |
| US4845352A (en) * | 1986-12-08 | 1989-07-04 | U.S. Philips Corporation | Scanning differential phase contrast microscope |
| EP0280418A1 (en) * | 1987-02-02 | 1988-08-31 | Wyatt Technology Corporation | Method and apparatus for examining the interior of semi-opaque objects |
| US5054926A (en) * | 1987-03-24 | 1991-10-08 | Commonwealth Scientific And Industrial Research Organisation | Distance measuring device |
| US5235457A (en) * | 1987-09-24 | 1993-08-10 | Washington University | Kit for converting a standard microscope into a single aperture confocal scanning epi-illumination microscope |
| US4844617A (en) * | 1988-01-20 | 1989-07-04 | Tencor Instruments | Confocal measuring microscope with automatic focusing |
| US4965441A (en) * | 1988-01-27 | 1990-10-23 | Commissariat A L'energie Atomique | Method for the scanning confocal light-optical microscopic and indepth examination of an extended field and devices for implementing said method |
| US4997242A (en) * | 1988-03-07 | 1991-03-05 | Medical Research Council | Achromatic scanning system |
| EP0335725A2 (en) * | 1988-04-01 | 1989-10-04 | Syntex (U.S.A.) Inc. | Apparatus and method for detection of fluorescence or light scatter |
| US5032720A (en) * | 1988-04-21 | 1991-07-16 | White John G | Confocal imaging system |
| US5120953A (en) * | 1988-07-13 | 1992-06-09 | Harris Martin R | Scanning confocal microscope including a single fibre for transmitting light to and receiving light from an object |
| US5161053A (en) * | 1988-08-01 | 1992-11-03 | Commonwealth Scientific & Industrial Research | Confocal microscope |
| US5421337A (en) * | 1989-04-14 | 1995-06-06 | Massachusetts Institute Of Technology | Spectral diagnosis of diseased tissue |
| US5201318A (en) * | 1989-04-24 | 1993-04-13 | Rava Richard P | Contour mapping of spectral diagnostics |
| US4972258A (en) * | 1989-07-31 | 1990-11-20 | E. I. Du Pont De Nemours And Company | Scanning laser microscope system and methods of use |
| US5122653A (en) * | 1989-08-22 | 1992-06-16 | Nikon Corporation | Confocal type laser scan microscope with integrated illumination, detection and waveguide system |
| US5065008A (en) * | 1989-10-18 | 1991-11-12 | Fuji Photo Film Co., Ltd. | Scanning microscope and scanning mechanism for the same |
| US5071246A (en) * | 1989-10-27 | 1991-12-10 | Carl-Zeiss-Stiftung | Confocal scanning ophthalmoscope |
| US5034613A (en) * | 1989-11-14 | 1991-07-23 | Cornell Research Foundation, Inc. | Two-photon laser microscopy |
| US5028802A (en) * | 1990-01-11 | 1991-07-02 | Eye Research Institute Of Retina Foundation | Imaging apparatus and methods utilizing scannable microlaser source |
| US5091652A (en) * | 1990-01-12 | 1992-02-25 | The Regents Of The University Of California | Laser excited confocal microscope fluorescence scanner and method |
| US5274240A (en) * | 1990-01-12 | 1993-12-28 | The Regents Of The University Of California | Capillary array confocal fluorescence scanner and method |
| US5480775A (en) * | 1990-01-26 | 1996-01-02 | Canon Kabushiki Kaisha | Method for measuring a specimen by the use of fluorescent light |
| US5074306A (en) * | 1990-02-22 | 1991-12-24 | The General Hospital Corporation | Measurement of burn depth in skin |
| US5083220A (en) * | 1990-03-22 | 1992-01-21 | Tandem Scanning Corporation | Scanning disks for use in tandem scanning reflected light microscopes and other optical systems |
| US5132526A (en) * | 1990-04-10 | 1992-07-21 | Fuji Photo Film Co., Ltd. | Confocal scanning microscope having a signal output regulating means |
| US5345306A (en) * | 1990-05-22 | 1994-09-06 | Research Development Corporation Of Japan | Method and apparatus for measuring spectral absorption in an opaque specimen and method and apparatus for measuring the microscopic absorption distribution |
| US5192980A (en) * | 1990-06-27 | 1993-03-09 | A. E. Dixon | Apparatus and method for method for spatially- and spectrally-resolved measurements |
| US5262646A (en) * | 1990-07-27 | 1993-11-16 | Booker Graham R | Infra-red scanning microscopy |
| US5324979A (en) * | 1990-09-26 | 1994-06-28 | Futrex, Inc. | Method and means for generating synthetic spectra allowing quantitative measurement in near infrared measuring instruments |
| US5239178A (en) * | 1990-11-10 | 1993-08-24 | Carl Zeiss | Optical device with an illuminating grid and detector grid arranged confocally to an object |
| US5168157A (en) * | 1990-11-20 | 1992-12-01 | Fuji Photo Film Co., Ltd. | Scanning microscope with means for detecting a first and second polarized light beams along first and second optical receiving paths |
| US5162641A (en) * | 1991-02-19 | 1992-11-10 | Phoenix Laser Systems, Inc. | System and method for detecting, correcting and measuring depth movement of target tissue in a laser surgical system |
| US5286964A (en) * | 1991-02-19 | 1994-02-15 | Phoenix Laser Systems, Inc. | System for detecting, correcting and measuring depth movement of a target |
| US5303026A (en) * | 1991-02-26 | 1994-04-12 | The Regents Of The University Of California Los Alamos National Laboratory | Apparatus and method for spectroscopic analysis of scattering media |
| US5260578A (en) * | 1991-04-10 | 1993-11-09 | Mayo Foundation For Medical Education And Research | Confocal imaging system for visible and ultraviolet light |
| US5329352A (en) * | 1991-04-12 | 1994-07-12 | Bayer Aktiengesellschaft | Spectroscopically correlated light scanning microscopy |
| EP0474264A2 (en) * | 1991-04-24 | 1992-03-11 | Kaman Aerospace Corporation | Spectrally dispersive imaging Lidar method and apparatus |
| US5225671A (en) * | 1991-05-29 | 1993-07-06 | Olympus Optical Co., Ltd. | Confocal optical apparatus |
| US5319200A (en) * | 1991-06-05 | 1994-06-07 | Zeltex, Inc. | Rapid near-infrared measurement of nonhomogeneous samples |
| US5313567A (en) * | 1991-06-13 | 1994-05-17 | At&T Bell Laboratories | Arrangement for determining and displaying volumetric data in an imaging system |
| US5162941A (en) * | 1991-07-23 | 1992-11-10 | The Board Of Governors Of Wayne State University | Confocal microscope |
| US5260569A (en) * | 1991-07-25 | 1993-11-09 | Fuji Photo Film Co., Ltd. | Scanning microscope and scanning mechanism |
| US5296700A (en) * | 1991-09-12 | 1994-03-22 | Nikon Corporation | Fluorescent confocal microscope with chromatic aberration compensation |
| US5343038A (en) * | 1991-12-12 | 1994-08-30 | Matsushita Electric Industrial Co., Ltd. | Scanning laser microscope with photo coupling and detecting unit |
| US5284149A (en) * | 1992-01-23 | 1994-02-08 | Dhadwal Harbans S | Method and apparatus for determining the physical characteristics of ocular tissue |
| US5248876A (en) * | 1992-04-21 | 1993-09-28 | International Business Machines Corporation | Tandem linear scanning confocal imaging system with focal volumes at different heights |
| US5306902A (en) * | 1992-09-01 | 1994-04-26 | International Business Machines Corporation | Confocal method and apparatus for focusing in projection lithography |
| US5451931A (en) * | 1992-09-14 | 1995-09-19 | Cerberus Ag | Optical smoke detector |
| US5418797A (en) * | 1993-01-15 | 1995-05-23 | The United States Of America As Represented By The Secretary Of The Navy | Time gated imaging through scattering material using polarization and stimulated raman amplification |
| US5294799A (en) * | 1993-02-01 | 1994-03-15 | Aslund Nils R D | Apparatus for quantitative imaging of multiple fluorophores |
| WO1994026168A1 (en) * | 1993-05-12 | 1994-11-24 | Board Of Regents, The University Of Texas System | Diagnosis of dysplasia using laser induced fluorescence |
| EP0641542A2 (en) * | 1993-09-03 | 1995-03-08 | Ken Ishihara | Non-invasive blood analyzer and method using the same |
| US5587832A (en) * | 1993-10-20 | 1996-12-24 | Biophysica Technologies, Inc. | Spatially light modulated confocal microscope and method |
| US5493444A (en) * | 1994-04-28 | 1996-02-20 | The United States Of America As Represented By The Secretary Of The Air Force | Photorefractive two-beam coupling nonlinear joint transform correlator |
| US5477382A (en) * | 1994-08-05 | 1995-12-19 | Northrop Grumman Corporation | Optical correlator system |
| WO1997005473A1 (en) * | 1995-08-01 | 1997-02-13 | Medispectra, Inc. | Optical microprobes and methods for spectral analysis of materials |
| US5713364A (en) * | 1995-08-01 | 1998-02-03 | Medispectra, Inc. | Spectral volume microprobe analysis of materials |
Non-Patent Citations (28)
| Title |
|---|
| C. Koester, "Comparison of Optical Sectioning Methods: The Scanning Slit Confocal Microscope", Confocal Microscopy Handbook, pp. 189-194. |
| C. Koester, Comparison of Optical Sectioning Methods: The Scanning Slit Confocal Microscope , Confocal Microscopy Handbook, pp. 189 194. * |
| C.J. Koester, "Scanning Mirror Microscope with Optical Sectioning Characteristics: Applications in Ophthalmology", Applied Optics, vol. 19, No. 11, Jun. 1980, pp. 1749-1757. |
| C.J. Koester, Scanning Mirror Microscope with Optical Sectioning Characteristics: Applications in Ophthalmology , Applied Optics, vol. 19, No. 11, Jun. 1980, pp. 1749 1757. * |
| C.J.R. Sheppard et al, "Depth of Field in the Scanning Microscope", Optics Letters, vol. 3, No. 3 Sep. 1978, pp. 115-117. |
| C.J.R. Sheppard et al, Depth of Field in the Scanning Microscope , Optics Letters, vol. 3, No. 3 Sep. 1978, pp. 115 117. * |
| J.M. Schmitt et al, "Confocal Microscopy in Turbid Media", Biomed. Eng. And Inst. Program, NCRR, National Institute of Health, Bethesda, MD 20892, pp. 1-46. |
| J.M. Schmitt et al, "Interferometric Versus Confocal Techniques for Imaging Microstructures in Turbid Biologocal Media", Proc. SPIE, 2135 (1994), pp. 1-2. |
| J.M. Schmitt et al, Confocal Microscopy in Turbid Media , Biomed. Eng. And Inst. Program, NCRR, National Institute of Health, Bethesda, MD 20892, pp. 1 46. * |
| J.M. Schmitt et al, Interferometric Versus Confocal Techniques for Imaging Microstructures in Turbid Biologocal Media , Proc. SPIE, 2135 (1994), pp. 1 2. * |
| Jeffrey W. Hall, et al, "Near-Infrared Spectrophotometry: A New Dimension in Clinical Chemistry", Clin. Chem. 38/9, 1623-1631 (1992). |
| Jeffrey W. Hall, et al, Near Infrared Spectrophotometry: A New Dimension in Clinical Chemistry , Clin. Chem. 38/9, 1623 1631 (1992). * |
| Kevin T. Schomacker, et al. "Ultraviolet Laser-Induced Fluorescence of Colonic Tissue: Basic Biology and Diagnostic Potential", Lasers in Surgery and Medicine, 12: 63-78, (1992). |
| Kevin T. Schomacker, et al. Ultraviolet Laser Induced Fluorescence of Colonic Tissue: Basic Biology and Diagnostic Potential , Lasers in Surgery and Medicine, 12: 63 78, (1992). * |
| N. Ramanujam et al, "In vivo diagnosis of cervical intraepithelial neoplasia using 337-nm-excited laser-induced fluorescence", Proc. Natl. Acad. Sci. USA, vol. 91, Pp. 10193-10197, Oct. 1994. |
| N. Ramanujam et al, Fluorescence Spectroscopy: A Diagnostic Tool for Cervical Intraepithelial Neoplasa (CIN), Gynecologic Oncology 52, pp. 31 38 (1994). * |
| N. Ramanujam et al, Fluorescence Spectroscopy: A Diagnostic Tool for Cervical Intraepithelial Neoplasa (CIN), Gynecologic Oncology 52, pp. 31-38 (1994). |
| N. Ramanujam et al, In vivo diagnosis of cervical intraepithelial neoplasia using 337 nm excited laser induced fluorescence , Proc. Natl. Acad. Sci. USA, vol. 91, Pp. 10193 10197, Oct. 1994. * |
| P. Davidovits et al, "Scanning Laser Microscope for Biological Investigations", Applied Optics, vol. 10, No. 7, pp. 1615-1619, Jul. 1971. |
| P. Davidovits et al, Scanning Laser Microscope for Biological Investigations , Applied Optics, vol. 10, No. 7, pp. 1615 1619, Jul. 1971. * |
| R. Richards Kortum et al, Description and Performance of a Fiber Optic Confocal Fluorescence Spectrometer , Applied Spectroscopy, vol. 48, No. 3, pp. 350 355, (1994). * |
| R. Richards-Kortum et al, "Description and Performance of a Fiber-Optic Confocal Fluorescence Spectrometer", Applied Spectroscopy, vol. 48, No. 3, pp. 350-355, (1994). |
| S. Schwartz, "Real-time laser-scanning confocal ratio imaging", American Laboratory, pp. 53-62, Apr. 1993. |
| S. Schwartz, Real time laser scanning confocal ratio imaging , American Laboratory, pp. 53 62, Apr. 1993. * |
| S.G. Anderson, "Confocal Laser Microscopes See A Wider Field of Application", Laser Focus World, pp. 83-86, Feb. 1994. |
| S.G. Anderson, Confocal Laser Microscopes See A Wider Field of Application , Laser Focus World, pp. 83 86, Feb. 1994. * |
| T. Wilson, "The Role of th Pinhole in Confocal Imaging Systems", Confocal Microscopy Handbook, pp. 99-113. |
| T. Wilson, The Role of th Pinhole in Confocal Imaging Systems , Confocal Microscopy Handbook, pp. 99 113. * |
Cited By (123)
| Publication number | Priority date | Publication date | Assignee | Title |
|---|---|---|---|---|
| US6417506B1 (en) * | 1995-05-23 | 2002-07-09 | The Regents Of The University Of California | High density array fabrication and readout method for a fiber optic biosensor |
| US6411835B1 (en) * | 1997-01-13 | 2002-06-25 | Medispectra, Inc. | Spectral volume microprobe arrays |
| US6826422B1 (en) * | 1997-01-13 | 2004-11-30 | Medispectra, Inc. | Spectral volume microprobe arrays |
| US20050057749A1 (en) * | 1998-08-21 | 2005-03-17 | Surromed, Inc. | Novel optical architectures for microvolume laser-scanning cytometers |
| US6800860B2 (en) | 1998-08-21 | 2004-10-05 | Surromed, Inc. | Optical architectures for microvolume laser-scanning cytometers |
| US6603537B1 (en) * | 1998-08-21 | 2003-08-05 | Surromed, Inc. | Optical architectures for microvolume laser-scanning cytometers |
| US6979830B2 (en) | 1998-08-21 | 2005-12-27 | Ppd Biomarker Discovery Sciences, Llc | Optical architectures for microvolume laser-scanning cytometers |
| US6385484B2 (en) | 1998-12-23 | 2002-05-07 | Medispectra, Inc. | Spectroscopic system employing a plurality of data types |
| US6411838B1 (en) | 1998-12-23 | 2002-06-25 | Medispectra, Inc. | Systems and methods for optical examination of samples |
| US6760613B2 (en) | 1998-12-23 | 2004-07-06 | Medispectra, Inc. | Substantially monostatic, substantially confocal optical systems for examination of samples |
| US7259845B2 (en) | 1999-04-23 | 2007-08-21 | Ppd Biomarker Discovery Sciences Llc | Disposable optical cuvette cartridge with low fluorescence material |
| US20040161143A1 (en) * | 1999-07-21 | 2004-08-19 | Dietz Louis J. | System for microvolume laser scanning cytometry |
| US7336812B2 (en) | 1999-07-21 | 2008-02-26 | Ppd Biomarker Discovery Sciences, Llc | System for microvolume laser scanning cytometry |
| US20040111031A1 (en) * | 1999-07-22 | 2004-06-10 | Alfano Robert R. | Spectral polarizing tomographic dermatoscope |
| US6587711B1 (en) * | 1999-07-22 | 2003-07-01 | The Research Foundation Of Cuny | Spectral polarizing tomographic dermatoscope |
| US6791676B1 (en) * | 1999-10-08 | 2004-09-14 | Dade Behring Marburg Gmbh | Spectrophotometric and nephelometric detection unit |
| US6343228B1 (en) * | 1999-10-19 | 2002-01-29 | The Hong Kong University Of Science And Technology | Method and apparatus for fluorescence imaging of tissue |
| US6798505B2 (en) | 1999-11-17 | 2004-09-28 | Applied Materials, Inc. | Method and apparatus for article inspection including speckle reduction |
| US7463352B2 (en) | 1999-11-17 | 2008-12-09 | Applied Materials, Inc. | Method and apparatus for article inspection including speckle reduction |
| US6556294B2 (en) | 1999-11-17 | 2003-04-29 | Applied Materials, Inc. | Method of and apparatus for article inspection including speckle reduction |
| US6587194B2 (en) | 1999-11-17 | 2003-07-01 | Applied Materials, Inc. | Method of and apparatus for article inspection including speckle reduction |
| US20050128473A1 (en) * | 1999-11-17 | 2005-06-16 | Applied Materials, Inc. | Method and apparatus for article inspection including speckle reduction |
| US6924891B2 (en) | 1999-11-17 | 2005-08-02 | Applied Materials, Inc. | Method and apparatus for article inspection including speckle reduction |
| US6369888B1 (en) * | 1999-11-17 | 2002-04-09 | Applied Materials, Inc. | Method and apparatus for article inspection including speckle reduction |
| US6429931B1 (en) | 1999-11-17 | 2002-08-06 | Applied Materials, Inc. | Method and apparatus for article inspection including speckle reduction |
| US6329661B1 (en) * | 2000-02-29 | 2001-12-11 | The University Of Chicago | Biochip scanner device |
| US20030160957A1 (en) * | 2000-07-14 | 2003-08-28 | Applera Corporation | Scanning system and method for scanning a plurality of samples |
| US6735458B2 (en) * | 2000-08-04 | 2004-05-11 | Photonify Technologies, Inc. | Self-calibrating optical imaging system |
| WO2002012854A3 (en) * | 2000-08-04 | 2002-12-19 | Photonify Technologies Inc | Systems and methods for providing information concerning chromophores in physiological media |
| US6516209B2 (en) * | 2000-08-04 | 2003-02-04 | Photonify Technologies, Inc. | Self-calibrating optical imaging system |
| WO2002012854A2 (en) * | 2000-08-04 | 2002-02-14 | Photonify Technologies, Inc. | Systems and methods for providing information concerning chromophores in physiological media |
| US6587703B2 (en) | 2000-09-18 | 2003-07-01 | Photonify Technologies, Inc. | System and method for measuring absolute oxygen saturation |
| US6597931B1 (en) | 2000-09-18 | 2003-07-22 | Photonify Technologies, Inc. | System and method for absolute oxygen saturation |
| US7253404B2 (en) | 2000-11-27 | 2007-08-07 | Ppd Biomarker Discovery Sciences, Llc | Median filter for liquid chromatography-mass spectrometry data |
| US20060097154A1 (en) * | 2000-11-27 | 2006-05-11 | Curtis Hastings | Median filter for liquid chromatography-mass spectrometry data |
| US20060259246A1 (en) * | 2000-11-28 | 2006-11-16 | Ppd Biomarker Discovery Sciences, Llc | Methods for efficiently mining broad data sets for biological markers |
| US20020146160A1 (en) * | 2001-01-19 | 2002-10-10 | Parker Mary F. | Method and apparatus for generating two-dimensional images of cervical tissue from three-dimensional hyperspectral cubes |
| US6538730B2 (en) * | 2001-04-06 | 2003-03-25 | Kla-Tencor Technologies Corporation | Defect detection system |
| US20030210393A1 (en) * | 2001-04-06 | 2003-11-13 | Kla-Tencor Corporation | Defect detection system |
| US20050018181A1 (en) * | 2001-04-06 | 2005-01-27 | Mehdi Vaez-Iravani | Defect detection system |
| US6862096B2 (en) | 2001-04-06 | 2005-03-01 | Kla-Tencor Corporation | Defect detection system |
| US7102131B2 (en) * | 2001-06-29 | 2006-09-05 | Eppendorf Ag | Device for photometric measurement of several samples |
| US20040141178A1 (en) * | 2001-06-29 | 2004-07-22 | Reiner Spolaczyk | Device for photometric measurement of several samples |
| US7197401B2 (en) | 2001-08-24 | 2007-03-27 | Ppd Biomarker Discovery Sciences, Llc | Peak selection in multidimensional data |
| US20050209789A1 (en) * | 2001-08-24 | 2005-09-22 | Hastings Curtis A | Peak selection in multidimensional data |
| US20030078739A1 (en) * | 2001-10-05 | 2003-04-24 | Surromed, Inc. | Feature list extraction from data sets such as spectra |
| US20050059681A1 (en) * | 2001-10-09 | 2005-03-17 | Christopher Cremer | Far field light microscopical method system and computer program product for analysing at least one object having a subwavelength size |
| US7298461B2 (en) * | 2001-10-09 | 2007-11-20 | Ruprecht-Karls-Universitat | Far field light microscopical method, system and computer program product for analysing at least one object having a subwavelength size |
| US20120179010A1 (en) * | 2002-04-04 | 2012-07-12 | Maynard John D | Determination of a Measure of a Glycation End-Product or Disease State Using Tissue Fluorescence of Various Sites |
| US7628914B2 (en) | 2002-05-09 | 2009-12-08 | Ppd Biomarker Discovery Sciences, Llc | Methods for time-alignment of liquid chromatography-mass spectrometry data |
| US20060131222A1 (en) * | 2002-05-09 | 2006-06-22 | Ppd Biomarker Discovery Sciences, Llc | Methods for time-alignment of liquid chromatography-mass spectrometry data |
| US6818903B2 (en) | 2002-07-09 | 2004-11-16 | Medispectra, Inc. | Method and apparatus for identifying spectral artifacts |
| US6768918B2 (en) | 2002-07-10 | 2004-07-27 | Medispectra, Inc. | Fluorescent fiberoptic probe for tissue health discrimination and method of use thereof |
| US8005527B2 (en) | 2002-07-10 | 2011-08-23 | Luma Imaging Corporation | Method of determining a condition of a tissue |
| US20030016357A1 (en) * | 2002-07-30 | 2003-01-23 | Shofner Frederick M. | Measurement of aerosol mass concentration and mass delivery rate |
| US7116413B2 (en) | 2002-09-13 | 2006-10-03 | Kla-Tencor Corporation | Inspection system for integrated applications |
| US20040125368A1 (en) * | 2002-09-13 | 2004-07-01 | Mehdi Vaez-Iravani | Inspection system for integrated applications |
| US7067825B2 (en) * | 2002-10-23 | 2006-06-27 | Leica Microsystems (Schweiz) Ag | Eye protection system on an electronically controlled fluorescence microscope |
| US20040079894A1 (en) * | 2002-10-23 | 2004-04-29 | Leica Microsystems (Schweiz) Ag | Eye protection system on an electronically controlled fluorescence microscope |
| US20040169853A1 (en) * | 2003-02-18 | 2004-09-02 | Yoichiro Iwa | Surface inspection apparatus |
| US20050046848A1 (en) * | 2003-08-26 | 2005-03-03 | Blueshift Biotechnologies, Inc. | Time dependent fluorescence measurements |
| US7812956B2 (en) | 2003-08-26 | 2010-10-12 | Blueshift Biotechnologies, Inc. | Time dependent fluorescence measurements |
| US20050280817A1 (en) * | 2004-04-02 | 2005-12-22 | Uwe Horchner | Polychromic laser scanning system and method of use |
| US7248360B2 (en) | 2004-04-02 | 2007-07-24 | Ppd Biomarker Discovery Sciences, Llc | Polychronic laser scanning system and method of use |
| US20060253261A1 (en) * | 2004-05-05 | 2006-11-09 | Chem Image Corporation | Digitizing biology |
| US7330265B2 (en) * | 2004-07-09 | 2008-02-12 | Tokyo Seimitsu Co., Ltd. | Appearance inspection apparatus and projection method for projecting image of sample under inspection |
| US20060007436A1 (en) * | 2004-07-09 | 2006-01-12 | Toshiro Kurosawa | Appearance inspection apparatus and projection method for projecting image of sample under inspection |
| US20080080816A1 (en) * | 2004-07-27 | 2008-04-03 | Ut-Battelle, Llc | Multi-tipped optical component |
| US7697808B2 (en) * | 2004-07-27 | 2010-04-13 | Ut-Battelle, Llc | Multi-tipped optical component |
| US9561003B2 (en) | 2005-11-18 | 2017-02-07 | Spectrx, Inc. | Method and apparatus for rapid detection and diagnosis of tissue abnormalities |
| US20070161876A1 (en) * | 2005-11-18 | 2007-07-12 | Spectrx, Inc. | Method and apparatus for rapid detection and diagnosis of tissue abnormalities |
| US20100145199A1 (en) * | 2006-03-02 | 2010-06-10 | Kristie Johnson | Cancer Detection System |
| US20100261958A1 (en) * | 2007-11-12 | 2010-10-14 | Cornell University | Multi-path, multi-magnification, non-confocal fluorescence emission endoscopy apparatus and methods |
| US20100270479A1 (en) * | 2007-11-12 | 2010-10-28 | Cornell University | Non-imaging, weakly focused fluorescence emission apparatus and method |
| US8553337B2 (en) | 2007-11-12 | 2013-10-08 | Cornell University | Multi-path, multi-magnification, non-confocal fluorescence emission endoscopy apparatus and methods |
| US20090259446A1 (en) * | 2008-04-10 | 2009-10-15 | Schlumberger Technology Corporation | Method to generate numerical pseudocores using borehole images, digital rock samples, and multi-point statistics |
| US8725477B2 (en) | 2008-04-10 | 2014-05-13 | Schlumberger Technology Corporation | Method to generate numerical pseudocores using borehole images, digital rock samples, and multi-point statistics |
| US9581723B2 (en) | 2008-04-10 | 2017-02-28 | Schlumberger Technology Corporation | Method for characterizing a geological formation traversed by a borehole |
| US11154198B2 (en) | 2008-05-20 | 2021-10-26 | University Health Network | Method and system for imaging and collection of data for diagnostic purposes |
| US11284800B2 (en) | 2008-05-20 | 2022-03-29 | University Health Network | Devices, methods, and systems for fluorescence-based endoscopic imaging and collection of data with optical filters with corresponding discrete spectral bandwidth |
| US11375898B2 (en) | 2008-05-20 | 2022-07-05 | University Health Network | Method and system with spectral filtering and thermal mapping for imaging and collection of data for diagnostic purposes from bacteria |
| US9042967B2 (en) | 2008-05-20 | 2015-05-26 | University Health Network | Device and method for wound imaging and monitoring |
| US20110117025A1 (en) * | 2008-05-20 | 2011-05-19 | Ralph Sebastian Dacosta | Device and method for fluorescence-based imaging and monitoring |
| US8686376B2 (en) * | 2008-06-24 | 2014-04-01 | Koninklijke Philips N.V. | Microarray characterization system and method |
| US20110101243A1 (en) * | 2008-06-24 | 2011-05-05 | Koninklijke Philips Electronics N.V. | Microarray characterization system and method |
| US20110004447A1 (en) * | 2009-07-01 | 2011-01-06 | Schlumberger Technology Corporation | Method to build 3D digital models of porous media using transmitted laser scanning confocal mircoscopy and multi-point statistics |
| US20110004448A1 (en) * | 2009-07-01 | 2011-01-06 | Schlumberger Technology Corporation | Method to quantify discrete pore shapes, volumes, and surface areas using confocal profilometry |
| US8311788B2 (en) | 2009-07-01 | 2012-11-13 | Schlumberger Technology Corporation | Method to quantify discrete pore shapes, volumes, and surface areas using confocal profilometry |
| US20130003072A1 (en) * | 2009-09-04 | 2013-01-03 | Christian Buil | Field-compensated interferometer |
| US20120289947A1 (en) * | 2010-01-18 | 2012-11-15 | Wolfgang Neuberger | Device and method for removing veins |
| US10463287B2 (en) | 2010-10-06 | 2019-11-05 | Profusa, Inc. | Tissue-integrating sensors |
| US10117613B2 (en) | 2010-10-06 | 2018-11-06 | Profusa, Inc. | Tissue-integrating sensors |
| US20150359440A1 (en) * | 2013-01-28 | 2015-12-17 | Oslo Universitetssykehus Hf | Assessing circulatory failure |
| US10987011B2 (en) * | 2013-01-28 | 2021-04-27 | Oslo Universitetssykehus Hf | Assessing circulatory failure |
| US11134871B2 (en) | 2013-03-14 | 2021-10-05 | Profusa, Inc. | Method and device for correcting optical signals |
| US10045722B2 (en) | 2013-03-14 | 2018-08-14 | Profusa, Inc. | Method and device for correcting optical signals |
| EP3003131A4 (en) * | 2013-06-06 | 2017-01-18 | Profusa, Inc. | Apparatus and methods for detecting optical signals from implanted sensors |
| US11504035B2 (en) | 2013-06-06 | 2022-11-22 | Profusa, Inc. | Apparatus and methods for detecting optical signals from implanted sensors |
| EP3777656A1 (en) * | 2013-06-06 | 2021-02-17 | Profusa, Inc. | Apparatus for detecting optical signals from implanted sensors |
| US10219729B2 (en) | 2013-06-06 | 2019-03-05 | Profusa, Inc. | Apparatus and methods for detecting optical signals from implanted sensors |
| AU2014274784B2 (en) * | 2013-06-06 | 2018-12-06 | Profusa, Inc. | Apparatus and methods for detecting optical signals from implanted sensors |
| US10456197B2 (en) * | 2013-07-18 | 2019-10-29 | International Business Machines Corporation | Laser-assisted transdermal delivery of nanoparticulates and hydrogels |
| US10413359B2 (en) | 2013-07-18 | 2019-09-17 | International Business Machines Corporation | Laser-assisted transdermal delivery of nanoparticulates and hydrogels |
| US20150025445A1 (en) * | 2013-07-18 | 2015-01-22 | International Business Machines Corporation | Laser-assisted transdermal delivery of nanoparticulates and hydrogels |
| US11324552B2 (en) | 2013-07-18 | 2022-05-10 | International Business Machines Corporation | Laser-assisted transdermal delivery of nanoparticulates and hydrogels |
| US10155688B2 (en) | 2014-03-28 | 2018-12-18 | Ut-Battelle, Llc | Thermal history-based etching |
| US9828284B2 (en) | 2014-03-28 | 2017-11-28 | Ut-Battelle, Llc | Thermal history-based etching |
| DE102014108143A1 (en) * | 2014-06-10 | 2015-12-10 | Kist Europe-Korea Institute of Science and Technologie Europe Forschungsgesellschaft mbh | An optical system for detecting fluorescent or luminescent signals of at least two samples |
| US10438356B2 (en) | 2014-07-24 | 2019-10-08 | University Health Network | Collection and analysis of data for diagnostic purposes |
| US11954861B2 (en) | 2014-07-24 | 2024-04-09 | University Health Network | Systems, devices, and methods for visualization of tissue and collection and analysis of data regarding same |
| US11676276B2 (en) | 2014-07-24 | 2023-06-13 | University Health Network | Collection and analysis of data for diagnostic purposes |
| US9766041B2 (en) * | 2014-12-08 | 2017-09-19 | The Charles Stark Draper Laboratory, Inc. | Multi-target optical designator |
| US20160161218A1 (en) * | 2014-12-08 | 2016-06-09 | The Charles Stark Draper Laboratory, Inc. | Multi-Target Optical Designator |
| JP2017538910A (en) * | 2014-12-08 | 2017-12-28 | ザ・チャールズ・スターク・ドレイパ・ラボラトリー・インコーポレイテッド | Multi-target optical designator |
| DE102016200271A1 (en) * | 2016-01-13 | 2017-07-13 | Institut Dr. Foerster Gmbh & Co. Kg | Device for generating and measuring an emission |
| US10605732B2 (en) | 2016-01-13 | 2020-03-31 | Institut Dr. Foerster Gmbh & Co. Kg | Portable device for detecting explosive substances comprising a device for generating and measuring the emission of an indicator |
| US11079333B2 (en) | 2016-02-05 | 2021-08-03 | Sciaps, Inc. | Analyzer sample detection method and system |
| US20170227469A1 (en) * | 2016-02-05 | 2017-08-10 | Sciaps, Inc. | Analyzer alignment, sample detection, localization, and focusing method and system |
| US10697895B2 (en) | 2016-02-05 | 2020-06-30 | Sciaps, Inc. | Analyzer sample detection method and system |
| US9939383B2 (en) * | 2016-02-05 | 2018-04-10 | Sciaps, Inc. | Analyzer alignment, sample detection, localization, and focusing method and system |
| US10473766B2 (en) | 2017-03-13 | 2019-11-12 | The Charles Stark Draper Laboratory, Inc. | Light detection and ranging (LiDAR) system and method |
| WO2021070170A1 (en) * | 2019-10-10 | 2021-04-15 | Check-Cap Ltd. | Fail safe radiation concealment mechanism |
| US11961236B2 (en) | 2023-06-13 | 2024-04-16 | University Health Network | Collection and analysis of data for diagnostic purposes |
Also Published As
| Publication number | Publication date |
|---|---|
| CA2277095C (en) | 2003-09-16 |
| DE69812886T2 (en) | 2003-12-04 |
| EP0951643B1 (en) | 2003-04-02 |
| EP1262763A3 (en) | 2004-03-03 |
| WO1998030889A1 (en) | 1998-07-16 |
| EP0951643A1 (en) | 1999-10-27 |
| JP3992113B2 (en) | 2007-10-17 |
| ES2192320T3 (en) | 2003-10-01 |
| JP2001508340A (en) | 2001-06-26 |
| EP1262763A2 (en) | 2002-12-04 |
| CA2277095A1 (en) | 1998-07-16 |
| DE69812886D1 (en) | 2003-05-08 |
| ATE236388T1 (en) | 2003-04-15 |
Similar Documents
| Publication | Publication Date | Title |
|---|---|---|
| US6104945A (en) | Spectral volume microprobe arrays | |
| US6411835B1 (en) | Spectral volume microprobe arrays | |
| US20010041843A1 (en) | Spectral volume microprobe arrays | |
| US6826422B1 (en) | Spectral volume microprobe arrays | |
| US5713364A (en) | Spectral volume microprobe analysis of materials | |
| US5813987A (en) | Spectral volume microprobe for analysis of materials | |
| US10874333B2 (en) | Systems and methods for diagnosis of middle ear conditions and detection of analytes in the tympanic membrane | |
| JP3923080B2 (en) | Optical fine probe and spectral analysis method of material | |
| US6069689A (en) | Apparatus and methods relating to optical systems for diagnosis of skin diseases | |
| US6031619A (en) | Imaging spectrometer | |
| US6741884B1 (en) | Infrared endoscopic balloon probes | |
| US8538507B2 (en) | Infrared endoscopic balloon probes | |
| US9433351B2 (en) | Tri modal spectroscopic imaging | |
| US20040068193A1 (en) | Optical devices for medical diagnostics | |
| US20030191368A1 (en) | Fluorescence imaging endoscope | |
| AU2003234222A1 (en) | Bio-spectral imaging system and methods for diagnosing cell disease state | |
| AU2003254731B2 (en) | Spectral volume microprobe arrays | |
| WO2000013578A1 (en) | Infrared endoscopic balloon probes | |
| MXPA99006493A (en) | Spatially resolved optical measurements | |
| Zelenchuk et al. | Remote sensing as a method of cervical cancer diagnosis | |
| Lau | Raman spectroscopy for optical diagnosis in head and neck tissue |
Legal Events
| Date | Code | Title | Description |
|---|---|---|---|
| AS | Assignment |
Owner name: MEDISPECTRA, INC., MASSACHUSETTS Free format text: ASSIGNMENT OF ASSIGNORS INTEREST;ASSIGNORS:MODELL, MARK;HED, A. ZE'EV;REEL/FRAME:008363/0604;SIGNING DATES FROM 19961224 TO 19961227 |
|
| FEPP | Fee payment procedure |
Free format text: ENTITY STATUS SET TO SMALL (ORIGINAL EVENT CODE: SMAL); ENTITY STATUS OF PATENT OWNER: SMALL ENTITY |
|
| AS | Assignment |
Owner name: MEDISPECTRA, INC., MASSACHUSETTS Free format text: ASSIGNMENT OF ASSIGNORS INTEREST;ASSIGNOR:MODELL, MARK;REEL/FRAME:009849/0803 Effective date: 19990304 |
|
| STCF | Information on status: patent grant |
Free format text: PATENTED CASE |
|
| FEPP | Fee payment procedure |
Free format text: PAT HOLDER CLAIMS SMALL ENTITY STATUS, ENTITY STATUS SET TO SMALL (ORIGINAL EVENT CODE: LTOS); ENTITY STATUS OF PATENT OWNER: SMALL ENTITY |
|
| FPAY | Fee payment |
Year of fee payment: 4 |
|
| FPAY | Fee payment |
Year of fee payment: 8 |
|
| REMI | Maintenance fee reminder mailed | ||
| AS | Assignment |
Owner name: EUCLIDSR PARTNERS, L.P., NEW YORK Free format text: ASSIGNMENT OF ASSIGNORS INTEREST;ASSIGNOR:EUCLIDSR PARTNERS, LP, COLLATERAL AGENT;REEL/FRAME:025532/0048 Effective date: 20070907 Owner name: LUMA IMAGING CORPORATION, CALIFORNIA Free format text: ASSIGNMENT OF ASSIGNORS INTEREST;ASSIGNORS:EUCLIDSR PARTNERS IV, L.P.;EUCLIDSR PARTNERS, L.P.;EUCLIDSR BIOTECHNOLOGY PARTNERS, L.P.;SIGNING DATES FROM 20070907 TO 20070910;REEL/FRAME:025532/0068 Owner name: EUCLIDSR PARTNERS IV, L.P., NEW YORK Free format text: ASSIGNMENT OF ASSIGNORS INTEREST;ASSIGNOR:EUCLIDSR PARTNERS, LP, COLLATERAL AGENT;REEL/FRAME:025532/0048 Effective date: 20070907 Owner name: EUCLIDSR BIOTECHNOLOGY PARTNERS, L.P., NEW YORK Free format text: ASSIGNMENT OF ASSIGNORS INTEREST;ASSIGNOR:EUCLIDSR PARTNERS, LP, COLLATERAL AGENT;REEL/FRAME:025532/0048 Effective date: 20070907 Owner name: EUCLIDSR PARTNERS, LP, COLLATERAL AGENT, NEW YORK Free format text: ASSIGNMENT OF ASSIGNORS INTEREST;ASSIGNOR:MEDISPECTRA, INC.;REEL/FRAME:025532/0018 Effective date: 20070830 |
|
| FPAY | Fee payment |
Year of fee payment: 12 |