US6100531A - Dual-purpose radiation transmission source for nuclear medicine imaging system - Google Patents
Dual-purpose radiation transmission source for nuclear medicine imaging system Download PDFInfo
- Publication number
- US6100531A US6100531A US09/062,303 US6230398A US6100531A US 6100531 A US6100531 A US 6100531A US 6230398 A US6230398 A US 6230398A US 6100531 A US6100531 A US 6100531A
- Authority
- US
- United States
- Prior art keywords
- radiation
- detector
- collimator
- transmission
- photon
- Prior art date
- Legal status (The legal status is an assumption and is not a legal conclusion. Google has not performed a legal analysis and makes no representation as to the accuracy of the status listed.)
- Expired - Fee Related
Links
Images


Classifications
-
- G—PHYSICS
- G01—MEASURING; TESTING
- G01T—MEASUREMENT OF NUCLEAR OR X-RADIATION
- G01T1/00—Measuring X-radiation, gamma radiation, corpuscular radiation, or cosmic radiation
- G01T1/16—Measuring radiation intensity
- G01T1/161—Applications in the field of nuclear medicine, e.g. in vivo counting
- G01T1/164—Scintigraphy
- G01T1/1641—Static instruments for imaging the distribution of radioactivity in one or two dimensions using one or several scintillating elements; Radio-isotope cameras
- G01T1/1642—Static instruments for imaging the distribution of radioactivity in one or two dimensions using one or several scintillating elements; Radio-isotope cameras using a scintillation crystal and position sensing photodetector arrays, e.g. ANGER cameras
Definitions
- the present invention pertains to the field of medical imaging. More particularly, the present invention relates to transmission sources for performing transmission scans in a nuclear medicine imaging system.
- nuclear medicine imaging techniques include single-photon emission computed tomography (SPECT) and positron emission tomography (PET).
- SPECT imaging is based on the detection of individual gamma rays emitted from the body, while PET imaging is based on the detection of gamma ray pairs emitted in coincidence in opposite directions due to electron-positron annihilations. Accordingly, PET imaging is sometimes referred to as coincidence imaging.
- One problem encountered in nuclear medicine is associated with transmission scanning for purposes of generating an attenuation map.
- Gamma ray detectors are typically collimated during SPECT imaging.
- a conventional parallel hole lead collimator is often used.
- the associated transmission scan involves the use of a radiation source to transmit gamma rays through the patient to a collimated detector.
- a line source is scanned directly across the field of view (FOV) of the corresponding detector.
- FOV field of view
- the configuration and positioning of the line sources allows a substantial number of the transmitted photons to pass through the holes of the collimator to the detector, without impinging on the septa of the collimator.
- Such photons are not absorbed by the collimator, and there is therefore no need to remove the collimator for purposes of performing the transmission scan.
- a transmission source in a gamma camera system such that the paths of the transmitted photons will not line up with the holes of the collimator, in contrast with the above-mentioned system.
- collimators tend to be quite large and heavy, removal and changing of collimators can be time-consuming and difficult. In a clinical setting, the amount of time spent conducting an imaging session may impact the patient's comfort and may be critical to the patient's health. It would be undesirable, therefore, to increase the overall time required to complete an imaging session by requiring the changing or removal of collimators. Hence, what is needed is a technique for performing transmission scanning in a nuclear medicine imaging system which overcomes this problem.
- the present invention includes a method and apparatus for operating an imaging system that includes a radiation detector.
- the radiation detector has a collimator mounted to it, which includes radiation-absorbing material.
- the radiation detector is operated during a transmission scan of an object.
- a radiation transmission source is also operated during the transmission scan to transmit radiation through the object to the detector, such that a substantial portion of the transmitted radiation penetrates the radiation-absorbing material of the collimator to be detected by the detector.
- FIG. 1 illustrates a dual-detector gamma camera imaging system.
- FIG. 2 illustrates the processing system of the gamma camera system of FIG. 1, according to one embodiment.
- FIG. 3 is a flow diagram illustrating an overall routine for generating attenuation-corrected coincidence emission images of a patient.
- FIG. 4 illustrates a point source transmitting a fan beam to a detector and a sample area defined on the imaging surface of the detector.
- FIGS. 5A, 5B, and 5C illustrate sample areas defined on the imaging surface of a detector according to three alternative embodiments.
- FIG. 6 is a flow diagram illustrating a routine for correcting an attenuation map for deadtime.
- FIG. 7 illustrates projection data of an object with a discontinuity in the data.
- FIG. 8 illustrates aspects of a sinogram of transmission data of an object.
- FIG. 9 is a flow diagram illustrating a routine for correcting discontinuities in acquired transmission data.
- FIG. 10 is a flow diagram illustrating an overall routine for performing randoms correction.
- FIG. 11 is a flow diagram illustrating a routine for acquiring randoms profiles as a function of object distribution, in accordance with the routine of FIG. 10.
- FIG. 12 is a flow diagram illustrating a routine for acquiring a randoms fraction as a function of both singles and coincidence countrates, in accordance with the routine of FIG. 10.
- FIG. 13 illustrates projection data of an object, including true coincidences, scatter and random coincidences.
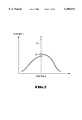
- FIG. 14 illustrates three plots of singles rate versus coincidence rate, each corresponding to a different phantom.
- FIGS. 15A and 15B are a flow diagram illustrating an alternative routine for obtaining a randoms fraction.
- FIG. 16 illustrates a gamma ray detector fitted with a parallel hole collimator and gamma rays from a Cs-137 point source penetrating the septa of the collimator.
- the present invention may be implemented in a dual-detector gamma camera system that is capable of both PET and SPECT imaging.
- a dual-detector gamma camera system that is capable of both PET and SPECT imaging.
- Such systems are available from ADAC Laboratories of Milpitas, Calif.
- FIG. 1 illustrates a block diagram of one such system. Although the illustrated system is a dual-detector system, note that the present invention is not limited to implementation in a dual-detector system, nor is the present invention limited to a system that can perform both PET and SPECT imaging.
- the gamma camera system of FIG. 1 includes a processing system 18 coupled to two scintillation detectors 10.
- the detectors 10 are mounted to a gantry 11, which can rotate the detectors 10, either individually or in unison, about an axis of rotation that is perpendicular to the x-y plane (parallel to the z axis).
- the detectors 10 are shown in FIG. 1 configured in a 180 degree orientation relative to each other about the axis of rotation, such as may be used for coincidence imaging.
- a patient 12 rests on a table 14 positioned between the detectors 10.
- Each of the detectors 10 includes a scintillation crystal, an array of photomultiplier tubes (PMTs) optically coupled to the crystal, and appropriate processing circuitry coupled to receive and process the outputs of the PMTs and to provide the processed outputs to the processing system 18.
- PMTs photomultiplier tubes
- the gamma camera system also includes two transmission radiation point sources 16, which are positioned slightly outside the FOVs of the detectors 10.
- the point sources generally are used for transmission scanning for purposes of acquiring an attenuation map of the patient 12.
- Each of the point sources 16 is mounted so as to be rotatable about the axis of rotation in unison with an opposing detector 10.
- each of the point sources 16 is a Cesium (Cs-137) 662 keV source.
- Each source 16 is configured to transmit radiation to the opposing detector in a fan beam profile.
- the transmission sources 16 may be used for transmission imaging for correction of either coincidence or SPECT emission data, as will be described further below.
- the processing system 18 controls the overall operation of the gamma camera system, including receiving data acquired by the detectors 10, reconstructing images based on the acquired data, controlling the gantry 11 to appropriately position the detectors 10, and controlling the imaging mode (PET or SPECT) of the detectors 10 based on a user command.
- PET imaging mode
- some of the above-mentioned functions or aspects thereof may be implemented within the detectors 10, the gantry 11, or in separate modules.
- the processing system 18 may be, or may include, a conventional computer system, such as a personal computer (PC), a server and workstation, a single-board computer, etc.
- FIG. 2 illustrates a block diagram of processing system 18 according to one such embodiment. Note, however, that the specific architecture of processing system 18 is not important for purposes of practicing the present invention.
- the processing system 18 includes a central processing unit (CPU) 20, random access memory (RAM) 21, read-only memory (ROM) 22, and a mass storage device 23, each coupled to a bus system 28.
- the bus system 28 may represent multiple physical buses coupled together by appropriate bridges, controllers, and/or adapters.
- a display device including controller 24 24, which may be a cathode ray tube (CRT), liquid crystal display (LCD), or the like; a keyboard 25; a pointing device 26, such as a mouse, trackball, touchpad, or the like; a data communication device 27; and a printer 29.
- Data communication device 27 may be used by processing system 18 to communicate with the detectors 10 and/or other computer systems or components and may be, for example, a network adapter, a modem, or any other suitable data communication device.
- Display device 24 and printer 29 may be used to display and print, respectively, tomographic images reconstructed by processing system 18.
- the present invention may be embodied in software. That is, the present invention may be carried out, at least in part, in a computer system, such as processing system 18, in response to its CPU executing sequences of instructions contained in memory.
- the instructions may be executed from RAM, ROM, a mass storage device, or a combination thereof.
- hardwired circuitry may be used in place of, or in combination with, software instructions to implement the present invention.
- the present invention is not limited to any specific combination of hardware circuitry and software, nor to any particular source of any such software.
- FIG. 3 illustrates an overall routine for acquiring coincidence emission data and for generating images from that data.
- the routine of FIG. 3 relates to coincidence imaging, aspects of the present invention are also applicable to SPECT imaging and associated transmission scans, as will be apparent to those skilled in the art. Note also that many variations upon the routine of FIG. 3 are possible without departing from the scope of the present invention.
- a blank (reference) transmission scan is performed to determine a reference intensity level I 0 for each of the angular positions.
- a "blank" transmission scan is a transmission scan performed without a patient or table present and may be performed in a pre-clinical test setting. In general, the data from one blank scan can be used in imaging studies of multiple patients. However, it may be desirable to perform a new blank transmission scan periodically (e.g., every few months) to account for drift in system parameters.
- initial study parameters are set up in processing system 18.
- These parameters may include, for example, the imaging mode (i.e., PET or SPECT, emission or transmission scan, etc.), the initial configuration of the detectors, the total number of angular positions about the axis of rotation, the total acquisition time at each position, etc.
- the detectors are configured in the 180 degree orientation relative to each other about the axis of rotation.
- emission and transmission scans of the patient are performed for each of the angular positions. Note that the emission and transmission scans may be performed either simultaneously or sequentially.
- processing system 18 generates an attenuation map from the transmission data, which is corrected for deadtime.
- the processing system 18 corrects the coincidence emission data for randoms, and at 306 the processing system reconstructs the randoms-corrected emission data to generate a set of tomographic images, using the deadtime-corrected attenuation map to correct the emission data for non-uniform attenuation.
- the deadtime correction technique of the present invention requires no knowledge of the singles countrate and requires no a priori knowledge about particular detector characteristics. It is well-known that the measured radiation intensity level I at a depth d within an attenuating material can be represented as set forth in equation (1):
- equation (2) is not entirely accurate in a system that is subject to deadtime losses. Accordingly, we may rewrite equation (2) for a system which has deadtime losses as equation (3), where D 0 is an appropriate correction factor to correct the blank scan for deadtime losses, and D is an appropriate correction factor to correct the transmission scan with the patient present for deadtime losses. ##EQU1## Since I and I 0 are measured values, an attenuation map of the patient can be corrected for deadtime losses by determining the ratio ##EQU2##
- FIG. 4 illustrates one of the detectors 10 and a corresponding one of the point sources 16, with the patient 12 positioned between the detector 10 and the point source 16.
- point source 16 is a Cs-137 source configured to transmit 662 keV gamma radiation in a fan beam 38, such that the transaxial (x) width of the fan beam 38 at the imaging surface 30 of detector 10 essentially matches the transaxial FOV of the detector 10.
- the width of the fan beam 38 is chosen to be relatively narrow in the axial (z) direction.
- the point source 16 does not move physically across the FOV of the corresponding detector 10, but instead remains positioned outside the FOV.
- the fan beam 38 may be scanned axially across the imaging surface 30 of detector 10 by moving source 16 laterally outside the FOV or by selectively varying collimation (not shown) at source 16.
- the deadtime correction technique of the present invention is based upon the assumption that the intensity level I measured in region 31 should be identical to the intensity level I 0 measured during the reference scan after both intensity levels have been corrected for deadtime losses. This assumption, therefore, can be used to determine the ratio ##EQU3## as will now be described.
- a sample area is defined as a portion 32 of the imaging surface 30 of each detector 10 at the edge of the transaxial FOV closest to the source 16.
- the sample area 32 is selected to be a region of the imaging surface 30 upon which the radiation shadow of the patient is least likely to fall during an imaging session, or is substantially less likely to fall than other regions of the imaging surface 30.
- the present invention provides that the ratio of the intensity level I SA in the sample area 32 during a patient scan to the intensity level I 0 ,SA measured in the sample area 32 during the reference scan is used as a deadtime correction factor for correcting the transmission map of the patient.
- This ratio may be determined for one angular position and then applied uniformly to the entire transmission map. Alternatively, separate ratios can be determined for each angular position and applied individually to the transmission map. The latter approach is believed to be more accurate.
- the above-described technique generally is based on the assumption that deadtime losses are uniform across the imaging surface of the detector. Because that assumption may not hold, however, the present invention also includes a technique to correct for local variations in deadtime losses across the imaging surface of a detector, as will be described below.
- the sample area 32 can be defined along the edge of the transaxial FOV 40 of the detector 10.
- the sample area 32 is defined along the entire axial field of view of detector 10.
- the sample area 32 is defined such that the radiation shadow 42 of the patient will not cover (or will rarely cover) the sample area 32. In certain instances, such when scanning an extremely large patient, the radiation shadow may, in fact, fall upon the sample area 32 for certain angular positions. Accordingly, an alternative approach, illustrated in FIG.
- FIG. 5B is to define two (or more) separate sample areas 32a and 32b adjacent to each other axially at the edge of the transaxial FOV of the detector 10.
- the greater of the intensities measured in each of sample areas 32a and 32b is taken as the intensity level I SA for purposes of computing the deadtime correction factor.
- FIG. 5C shows yet another embodiment, in which two sample areas 32c and 32d are defined to overlap.
- FIG. 6 illustrates a routine for correcting an attenuation map of the patient according to the above-described technique. More specifically, the routine of FIG. 6 illustrates in greater detail part 304 of the routine of FIG. 3. Note that the following routine is performed independently for each detector. Initially, at 601 the average ratio ##EQU7## inside the sample area is determined for a given angle ⁇ . A single computation of this ratio may be used for all angles, as noted above. However, the routine of FIG. 6 makes a separate computation for each angle. Next, at 602 the appropriate attenuation coefficient ⁇ d is determined according to equations (3) and (5) for each (x,y) position. If there are additional angles to be considered at 603, then the next angle is selected at 604, and the routine repeats from 601; otherwise, the routine ends. Thus, an attenuation map generated as described above is appropriately corrected for deadtime.
- the foregoing technique assumes that the deadtime is uniform across the imaging surface of the detector. That assumption, however, may not be correct. If the detector deadtime varies along the imaging surface of the detector, then the sampling at the outer edge of the transaxial FOV of a detector may not represent the deadtime on the other side of the transaxial FOV, which samples the center of the object. Small data errors in projection data representing the center of the object can cause substantial artifacts in the reconstructed image.
- center region 34 is defined by the inner edge of the fan beam 38 (i.e., the edge toward the right side the FIG. 4 for the illustrated orientation) for all angular positions in aggregate. Note that the center region 34 will be sampled by the inner edge of the transaxial FOV of the detector 10.
- the center region 34 may be covered by supplementing rotation of the detectors 10 with appropriate motion of the table 14 to extend the transaxial FOV, if necessary.
- the illustrated system is a dual-detector system in which the detectors 10 are rotated about the patient, the center region 34 can be covered twice by each detector after 360 degrees of rotation of the detector.
- any discrepancy between the two samplings of the center region 34 may appear as a discontinuity 50 at the center 51 of the projection. Again, such a discontinuity may cause substantial artifacts in the reconstructed image.
- discontinuities are corrected generally by averaging values in sinogram space which represent a discontinuity and then recomputing those values based on the average.
- the discontinuity is smoothed by such a technique, eliminating or reducing the severity of artifacts in the reconstructed image.
- This procedure is performed for all projections and for all transaxial slices. Consequently, this procedure corrects for certain local variations in deadtime along the imaging surface of a detector.
- FIG. 8 illustrates the format of a sinogram 56 of an object.
- each detector acquires data along each of a number of diagonal lines 58 during a transmission scan.
- Each diagonal line 58 on the left side of sinogram 56 represents data acquired by a detector while the detector is at a particular angular position, while the corresponding diagonal line 58 on the right side of sinogram 56 represents data acquired by the same detector when positioned at the 180 degrees opposite angular position.
- Centerline 60 of sinogram 56 corresponds to the axis of rotation 36 of the detectors 10 (FIG. 4).
- the center strip 63 of the sinogram 56 corresponds to center region 34.
- the diagonal lines 58 of data extend beyond centerline 60, because the inner edge of the transmission fan beam 38 extends beyond the axis of rotation 36.
- the discontinuity correction technique described above is applied to all projection data.
- FIG. 9 illustrates a routine embodying this technique.
- the processing system 18 computes an average of the data values within the center strip 63 of the sinogram 56 which result from detector rotations defined as left side angles (i.e., the left side of the sinogram). This average is designated as the left average AVG L .
- the processing system 18 computes an average of data values within the center strip 63 of the sinogram 56 which result from detector rotations defined as right side angles. This average is designated as the right average AVG R . Note that if one transaxial slice does not provide enough center strip data to be statistically significant, multiple transaxial slices can be averaged together for purposes of computing these averages.
- corresponding left and right data values represent the same object density, such data values should be the same.
- "corresponding" left and right data values are horizontally-aligned data values on each side of the centerline 60 and equidistant from the centerline 60.
- point 65 in FIG. 9 represents a left data value
- point 66 represents the corresponding right data value. Due to local deadtime variations, however, corresponding left and right data values may not be the same. The result may be a glitch in the projection, as shown in FIG. 7. Consequently, two correction factors are applied in accordance with the present invention, to correctly align the projection.
- a left correction factor F L and a right correction factor F R are computed based on the averages.
- the correction factors F L and F R are computed so as to move toward the average all corresponding left and right data values, respectively, for the given projection ⁇ .
- the left correction factor F L may be computed as
- a left data value LEFT in the given projection ⁇ is multiplied by the left correction factor F L
- a right data value RIGHT in the projection ⁇ is multiplied by the right correction factor F R .
- the computation of 903 is then repeated for all data values in the given projection ⁇ , per 904 and 907 (i.e., for all data values along a given horizontal line in the sinogram), using the same left and right correction factors for all data values in that projection ⁇ .
- 901 through 904 are repeated for all transaxial slices, per 905 and 908, including computing new left and right averages AVG L and AVG R and new correction factors F L and F R for each slice.
- the present invention also includes a technique for correcting coincidence emission data for randoms.
- One problem with randoms correction techniques of the prior art is that they fail to take into consideration variations in the size and shape of patients. Accordingly, the technique of the present invention uses the actual patient distribution to perform randoms correction.
- a basic premise of the present invention is that the randoms fraction Rf may vary even though the singles rates remains constant, due to the distributed radiation source in the object, radiation sources from outside the FOV, the energy window used, and the camera geometry.
- randoms correction is also performed as a function of both the singles rate and the coincidence rate. More specifically, both the coincidence rate and the singles rate are used in determining the randoms fraction R f .
- patient projection data P(x, y, ⁇ ) is corrected based on a computed randoms distribution R(x, y, ⁇ ).
- the randoms distribution R(x,y, ⁇ ) is computed as a function of a measured randoms profile R 0 (x, y, ⁇ ) and a randoms fraction R f (S,C).
- the randoms fraction R f (S,C) is computed as a function of both the singles rate S and the coincidence rate C for each angle ⁇ .
- the randoms profile R 0 (x, y, ⁇ ) is computed as the convolution of the patient profile P(x, y, ⁇ ) with a wide (high ⁇ ) Gaussian distribution. This approach therefore differs from randoms corrections techniques of the prior art, which do not take into account the coincidence rate or the object distribution.
- the gamma camera system obtains raw coincidence (emission) projection data P(x, y, ⁇ ) for all angles ⁇ .
- the gamma camera system computes axial averages P(x, y, ⁇ ) of multiple transaxial slices.
- each axial average P(x, y, ⁇ ) may be an average of three (or any other appropriate number of) axially adjacent transaxial slices. Such averaging may be omitted, if desired.
- processing system 18 computes the randoms profiles R 0 (x, y, ⁇ ).
- processing system 18 computes the randoms fraction R f (S, C), where S represents the singles rate for a given angle ⁇ , and C represents the coincidence rate for that angle ⁇ .
- processing system 18 computes a randoms distribution R(x, y, ⁇ ) according to equation (6),
- the processing system 18 corrects the averaged patient projection data P(x, y, ⁇ ) for randoms by subtracting the randoms distribution data R (x, y, ⁇ ) from the averaged projection data P(x, y, ⁇ ) to produce corrected patient projection data P c (x,y, ⁇ ), as set forth in equation (7).
- FIG. 11 illustrates a routine for computing the randoms profiles R 0 (x, y, ⁇ ). Note that most of the routine of FIG. 11 is intended to be performed in a pre-clinical test setting, rather than in a clinical setting, as will become clear from the description which follows. The exception is that the final computation of the randoms profile R 0 (x, y, ⁇ ) is performed in a clinical setting, i.e., during an imaging session. Thus, at 1101, the gamma camera system is operated to acquire projection data for coincidence activity emitted by a simple phantom, for multiple angles ⁇ , at both high countrate and low countrate. A simple right-cylindrical phantom is believed to be suitable.
- low countrate is a countrate at which randoms are negligible (e.g., below one percent of the total coincidence events).
- the acquired high and low countrate datasets are each corrected for system deadtime using any suitable deadtime correction technique, such as the technique described above.
- randoms R(x,y) are computed as the difference between the high countrate projection data and the low countrate projection data for a given angle 0.
- the ⁇ value of the above-mentioned Gaussian function is computed.
- the Gaussian function is defined according to equation (8) and is a well-known mathematical function. ##EQU8##
- the ⁇ value is computed by minimizing the difference between the randoms distribution R(x,y) and the convolution of the projection data from the high countrate phantom and the Gaussian G(x,y), i.e., by minimizing ((P(x,y) ⁇ G(x,y))-R(x,y)).
- a simple curve fit procedure can be employed using, for example a chi-square or a least squares approach. For an imaging system such as described above, a ⁇ value of 200/ ⁇ 2 is currently believed to be appropriate, according to one embodiment.
- the final aspect of determining the randoms profile R 0 (x, y, ⁇ ) is performed in the clinical setting, based on the patient projection data. More specifically, at 1105 the randoms profile R 0 (x, y, ⁇ ) is computed as the convolution of the axially averaged projection data P (x, y, ⁇ ) and the Gaussian distribution G (x,y), using the ⁇ value computed as described above, as set forth in equation (9).
- FIG. 12 illustrates a routine for computing the randoms fraction R f as a function of both singles rate S and coincidence rate C, according to one embodiment.
- the routine of FIG. 12 is intended to be performed in a pre-clinical setting.
- the gamma camera system is operated to obtain coincidence projection emission data for each of multiple phantoms at various different countrates.
- Corresponding coincidence rates C and singles rates S are recorded during the data acquisition process.
- the phantoms are selected to fairly represent a wide range of patient body sizes and shapes. In one embodiment, three right-cylindrical phantoms of varying sizes are used.
- the singles rates S and corresponding coincidence rates C are plotted for each phantom.
- FIG. 1 illustrates a routine for computing the randoms fraction R f as a function of both singles rate S and coincidence rate C, according to one embodiment.
- the routine of FIG. 12 is intended to be performed in a pre-clinical setting.
- the gamma camera system
- FIG. 14 shows an example of three C vs. S plots 81, 82 and 83, corresponding to three different phantoms.
- a randoms distribution R is determined from the data for each of multiple (C,S) pairs by using a linear extrapolation, as will now be described with reference to FIG. 13.
- FIG. 13 illustrates a plot 70 of projection data taken from a cylindrical phantom from a given projection angle ⁇ .
- the overall intensity I i.e., total number of counts
- portion 73 of plot 70 represents the contribution of randoms R
- portion 72 represents the contribution of scatter Sc
- portion 71 represents the contribution of true coincidences T.
- portion 73 representing the contribution from randoms is approximated using a linear extrapolation. More specifically, coincidence events are measured at the perimeter of the FOV, represented by shaded regions 74 under curve 70.
- the height of regions 74 at their innermost boundaries is linearly extrapolated across the face of the detector, as represented by line 76 in FIG. 13.
- the area of curve 70 which falls below line 76 approximates the total number of counts due to randoms. Note that this approximation does not account for a small fraction of the contribution of randoms, which is represented by the shaded area above line 76 under curve 70.
- the randoms fraction R f may be computed in a manner which avoids this type of approximation error. Further, even if the randoms fraction R f is underestimated, the shape of the randoms profile computed from equation (9) is not affected by such error.
- the randoms R are determined for each of multiple (C,S) pairs using this linear extrapolation.
- the randoms fraction R f is then computed by dividing the randoms R by the total number of counts for each of the (C,S) pairs.
- the randoms fraction R f is then plotted against singles rate S at 1205, and at 1206, the randoms fraction R f is plotted against coincidence rate C for various constant singles rates S.
- the R f versus C curves are fitted to equation (10) to determine the coefficients A and B.
- Equation (10) with the computed coefficients A and B is stored in any suitable form within the gamma camera imaging system, for use during an imaging session. Equation (10) is then applied during the imaging of a patient to compute R f for various different angles ⁇ , based on the measured singles and coincidence rates. More specifically, computed R f values are used to determine the overall randoms distribution R(x, y, ⁇ ) according to equation (6), which is used to correct the patient projection data P c (x, y, ⁇ ) according to equation (7).
- Equation (10) may overcorrect under count-poor conditions. Accordingly, an alternative formula for R f may be used when the singles countrate falls below a threshold countrate.
- the formula of equation (11), for example, may be suitable for countrates below 450 kcps for a gamma camera system such as described above. ##EQU9##
- FIGS. 15A and 15B collectively illustrate an alternative routine for computing the randoms fraction R f , which avoids this approximation and which also may provide a more accurate ⁇ value for the Gaussian function G(x,y).
- the gamma camera system is operated to obtain coincidence (emission) projection data of a phantom at both high countrate and at low countrate. The data is then plotted.
- low countrate in this context refers to a countrate at which the randoms are negligible, such as 100 kcps or below.
- the high and low countrate data are corrected for system deadtime.
- a randoms curve is computed as the difference between the high countrate projection data and the low countrate projection data.
- the randoms fraction R f is computed by dividing the total number of counts R under the randoms curve by the total number of counts under the high countrate curve Total H .
- the computed randoms curve is fitted to equation (12) in order to determine the value of ⁇ . A chi-square or least squares curve fit may be used. Note that the R f values are summed before performing the curve fit.
- the preceding steps are then repeated for other countrates to obtain additional ⁇ values (1506).
- the foregoing steps are then further repeated for other phantoms of different sizes to obtain additional ⁇ values (1507).
- the average ⁇ value ⁇ is computed for all the previously determined ⁇ values, and at 1509 the average ⁇ is taken to be the final ⁇ value of the Gaussian function G(x,y).
- a three-dimensional plot of C vs. S vs. R f is computed from the acquired data, and at 1511 the plot is stored in any suitable form in the imaging system, for later use during an imaging system (i.e., for computation of R f ).
- the plot may be stored in the form of a look-up table.
- the transmission point sources 16 of the above-described imaging system may be Cs-137 sources, which transmit radiation with a photopeak at 662 keV.
- a Cs-137 point source has been found to be desirable for performing transmission scans for correction of PET data in such a system. Because the 662 keV photopeak of Cs-137 is close to the 511 keV photopeak of flourodeoxyglucose (FDG), a common PET radio-pharmaceutical, but not so close as to cause excessive energy level overlap, minimal energy level scaling of the transmission map is required. Further, because the 662 keV photopeak of Cs-137 is higher than the FDG photopeak, contamination due to scatter into the transmission image is reduced.
- FDG flourodeoxyglucose
- the 662 keV photopeak of Cs-137 is sufficiently high as to enable the majority of the transmitted gamma rays to completely penetrate most general-purpose nuclear medicine collimators. This characteristic also makes the use of Cs-137 advantageous for performing transmission scans to correct SPECT data, as will now be discussed.
- FIG. 16 illustrates a parallel-hole collimator 82 coupled to the imaging surface 30 of one of the detectors 10.
- the collimator 82 includes a number of lead septa 81, which define the parallel holes.
- FIG. 16 further illustrates gamma rays 83 from the Cs-137 transmission source 16 penetrating the septa 81 of collimator 82 to reach the imaging surface 30 of the detector 10.
- certain prior art systems use line sources, which are scanned directly across the FOV of the corresponding detectors.
- Such a technique allows a substantial number of the transmitted photons to pass through the holes of the collimator to the detector, since the paths of many of the transmitted photons are parallel to the holes of the collimator. Therefore, there is no need to remove the collimator for the transmission scan in such a system.
- a high percentage generally, at least 50%
- Collimators with energy ratings below 300 keV are believed to be preferable, however, to increase photon penetration.
- Penetration of 50% or more is sufficient to generate a high-quality transmission map of the patient for correcting SPECT data using current data processing techniques.
- removal of the collimator is not necessary prior to performing a transmission scan for correcting SPECT data.
- the reconstructed transmission map must be scaled appropriately to match the energy level of the single-photon emission source. Techniques for performing such scaling are well known to those skilled in the art.
Abstract
Description
I=I.sub.0 e.sup.-∫μd (1)
∫μd=1n[I.sub.0 /I] (2)
I.sub.SA ·D.sub.SA =I.sub.0,SA ·D.sub.0,SA(4)
F.sub.L =(AVG.sub.R +AVG.sub.L)/(2·AVG.sub.L),
F.sub.R =(AVG.sub.R +AVG.sub.L)/(2·AVG.sub.R).
R(x, y, θ)=R.sub.0 (x, y, θ)·R.sub.f (S,C)(6)
P.sub.c (x, y, θ)=P(x, y, θ)-R(x, y, θ) (7)
R.sub.0 (x,y, θ)=P(x,y,θ)×G(x,y) (9)
R.sub.f =A·S.sup.2 /C+B (10)
R=R.sub.f (x).sub.e.sup.-x.spsp.2.spsp./2σ.sbsp.2 (12)
Claims (36)
Priority Applications (5)
| Application Number | Priority Date | Filing Date | Title |
|---|---|---|---|
| US09/062,303 US6100531A (en) | 1998-04-17 | 1998-04-17 | Dual-purpose radiation transmission source for nuclear medicine imaging system |
| AU31118/99A AU3111899A (en) | 1998-04-17 | 1999-03-22 | Dual-purpose radiation transmission source for nuclear medicine imaging system |
| PCT/US1999/006341 WO1999054756A1 (en) | 1998-04-17 | 1999-03-22 | Dual-purpose radiation transmission source for nuclear medicine imaging system |
| JP2000545046A JP2002512374A (en) | 1998-04-17 | 1999-03-22 | Dual purpose radiant transmission source for nuclear medical imaging systems |
| DE19983222T DE19983222T1 (en) | 1998-04-17 | 1999-03-22 | Dual-use radiation transmission source for a nuclear medical imaging system |
Applications Claiming Priority (1)
| Application Number | Priority Date | Filing Date | Title |
|---|---|---|---|
| US09/062,303 US6100531A (en) | 1998-04-17 | 1998-04-17 | Dual-purpose radiation transmission source for nuclear medicine imaging system |
Publications (1)
| Publication Number | Publication Date |
|---|---|
| US6100531A true US6100531A (en) | 2000-08-08 |
Family
ID=22041608
Family Applications (1)
| Application Number | Title | Priority Date | Filing Date |
|---|---|---|---|
| US09/062,303 Expired - Fee Related US6100531A (en) | 1998-04-17 | 1998-04-17 | Dual-purpose radiation transmission source for nuclear medicine imaging system |
Country Status (5)
| Country | Link |
|---|---|
| US (1) | US6100531A (en) |
| JP (1) | JP2002512374A (en) |
| AU (1) | AU3111899A (en) |
| DE (1) | DE19983222T1 (en) |
| WO (1) | WO1999054756A1 (en) |
Cited By (11)
| Publication number | Priority date | Publication date | Assignee | Title |
|---|---|---|---|---|
| WO2001022120A1 (en) * | 1999-09-17 | 2001-03-29 | Cti Pet Systems, Inc. | Transmission attenuation correction method for pet and spect |
| US20040167398A1 (en) * | 2002-11-29 | 2004-08-26 | Thomas Flohr | Combined emission tomography and computer tomography unit |
| US20060249682A1 (en) * | 2003-06-04 | 2006-11-09 | Darren Hogg | Generating detector efficiency estimates for a pet scanner |
| US20100067766A1 (en) * | 2008-09-18 | 2010-03-18 | Siemens Medical Solutions Usa, Inc. | Extracting location information using difference images from a non-parallel hole collimator |
| EP2442102A2 (en) | 2002-04-02 | 2012-04-18 | Caliper Life Sciences Inc. | Methods, systems and apparatus for separation and isolation of one or more sample components of a sample biological material |
| EP2581739A1 (en) | 2002-03-05 | 2013-04-17 | Caliper Life Sciences, Inc. | Mixed mode microfluidic systems |
| US9606245B1 (en) | 2015-03-24 | 2017-03-28 | The Research Foundation For The State University Of New York | Autonomous gamma, X-ray, and particle detector |
| US20180303439A1 (en) * | 2015-03-11 | 2018-10-25 | David Byron Douglas | Spatial resolution in molecular and radiological imaging |
| US11439358B2 (en) | 2019-04-09 | 2022-09-13 | Ziteo, Inc. | Methods and systems for high performance and versatile molecular imaging |
| US11464503B2 (en) | 2014-11-14 | 2022-10-11 | Ziteo, Inc. | Methods and systems for localization of targets inside a body |
| US11678804B2 (en) | 2012-03-07 | 2023-06-20 | Ziteo, Inc. | Methods and systems for tracking and guiding sensors and instruments |
Families Citing this family (9)
| Publication number | Priority date | Publication date | Assignee | Title |
|---|---|---|---|---|
| US6388257B1 (en) * | 2000-03-10 | 2002-05-14 | Philips Medical Systems (Cleveland ), Inc. | Stepped asymmetric sampling scheme for transmission radiation corrected gamma cameras |
| JP4536212B2 (en) * | 2000-05-24 | 2010-09-01 | 浜松ホトニクス株式会社 | PET equipment |
| JP4781501B2 (en) * | 2000-05-24 | 2011-09-28 | 浜松ホトニクス株式会社 | PET equipment |
| JP4536211B2 (en) * | 2000-05-24 | 2010-09-01 | 浜松ホトニクス株式会社 | PET equipment |
| JP2010249847A (en) * | 2010-08-09 | 2010-11-04 | Hamamatsu Photonics Kk | Pet apparatus |
| KR20160008820A (en) * | 2014-07-15 | 2016-01-25 | 한국원자력의학원 | Apparatus and method for calculating correction factor |
| US11249198B2 (en) | 2017-02-07 | 2022-02-15 | Molecular Dynamics Limited | Weighting detector configurations in SPECT imaging |
| US10779778B2 (en) * | 2017-05-08 | 2020-09-22 | General Electric Company | Reference detector elements in conjunction with an anti-scatter collimator |
| CN113534229B (en) * | 2021-06-07 | 2022-12-02 | 苏州大学 | Method and system for evaluating nuclear radiation resistance of nuclear radiation detector |
Citations (12)
| Publication number | Priority date | Publication date | Assignee | Title |
|---|---|---|---|---|
| US4071761A (en) * | 1976-06-07 | 1978-01-31 | Beckman Instruments, Inc. | Method for determining random coincidence count rate in a scintillation counter utilizing the coincidence technique |
| US4181855A (en) * | 1978-01-30 | 1980-01-01 | Beckman Instruments, Inc. | Method and apparatus for determining random coincidence count rate in a scintillation counter utilizing the coincidence technique |
| US4418282A (en) * | 1981-06-29 | 1983-11-29 | Beckman Instruments, Inc. | Method and apparatus for determining random coincidence count rate in a scintillation counter utilizing the coincidence technique |
| US5296708A (en) * | 1993-03-26 | 1994-03-22 | Cti, Inc. | Method and apparatus for transmission measurements to form a 3-D image in tomography applications |
| US5444252A (en) * | 1991-05-23 | 1995-08-22 | Adac Laboratories | Adjustable dual-detector image data acquisition system |
| US5461232A (en) * | 1993-01-08 | 1995-10-24 | Mccandless; Brian K. | Pulse transmission scintigraphic imaging |
| US5471061A (en) * | 1994-03-21 | 1995-11-28 | Cti Pet Systems, Inc. | Method and apparatus for transmission measurements to form a 2-d or a 3-d image in tomography applications |
| US5552606A (en) * | 1995-05-11 | 1996-09-03 | Adac Laboratories, Inc. | Variable filters used with radiation source to reduce unobstructed detector area |
| US5565684A (en) * | 1995-06-30 | 1996-10-15 | The University Of Utah | Three-dimensional SPECT reconstruction of combined cone-beam and fan-beam data |
| US5585637A (en) * | 1995-06-09 | 1996-12-17 | Adac Laboratories | Multi-head nuclear medicine camera for dual SPECT and PET imaging |
| US5602395A (en) * | 1995-10-02 | 1997-02-11 | Adac Laboratories | Gamma camera having partial septas and moving septas for positron emission tomography (PET) |
| US5608221A (en) * | 1995-06-09 | 1997-03-04 | Adac Laboratories | Multi-head nuclear medicine camera for dual SPECT and PET imaging with monuniform attenuation correction |
-
1998
- 1998-04-17 US US09/062,303 patent/US6100531A/en not_active Expired - Fee Related
-
1999
- 1999-03-22 DE DE19983222T patent/DE19983222T1/en not_active Withdrawn
- 1999-03-22 WO PCT/US1999/006341 patent/WO1999054756A1/en active Application Filing
- 1999-03-22 JP JP2000545046A patent/JP2002512374A/en active Pending
- 1999-03-22 AU AU31118/99A patent/AU3111899A/en not_active Abandoned
Patent Citations (12)
| Publication number | Priority date | Publication date | Assignee | Title |
|---|---|---|---|---|
| US4071761A (en) * | 1976-06-07 | 1978-01-31 | Beckman Instruments, Inc. | Method for determining random coincidence count rate in a scintillation counter utilizing the coincidence technique |
| US4181855A (en) * | 1978-01-30 | 1980-01-01 | Beckman Instruments, Inc. | Method and apparatus for determining random coincidence count rate in a scintillation counter utilizing the coincidence technique |
| US4418282A (en) * | 1981-06-29 | 1983-11-29 | Beckman Instruments, Inc. | Method and apparatus for determining random coincidence count rate in a scintillation counter utilizing the coincidence technique |
| US5444252A (en) * | 1991-05-23 | 1995-08-22 | Adac Laboratories | Adjustable dual-detector image data acquisition system |
| US5461232A (en) * | 1993-01-08 | 1995-10-24 | Mccandless; Brian K. | Pulse transmission scintigraphic imaging |
| US5296708A (en) * | 1993-03-26 | 1994-03-22 | Cti, Inc. | Method and apparatus for transmission measurements to form a 3-D image in tomography applications |
| US5471061A (en) * | 1994-03-21 | 1995-11-28 | Cti Pet Systems, Inc. | Method and apparatus for transmission measurements to form a 2-d or a 3-d image in tomography applications |
| US5552606A (en) * | 1995-05-11 | 1996-09-03 | Adac Laboratories, Inc. | Variable filters used with radiation source to reduce unobstructed detector area |
| US5585637A (en) * | 1995-06-09 | 1996-12-17 | Adac Laboratories | Multi-head nuclear medicine camera for dual SPECT and PET imaging |
| US5608221A (en) * | 1995-06-09 | 1997-03-04 | Adac Laboratories | Multi-head nuclear medicine camera for dual SPECT and PET imaging with monuniform attenuation correction |
| US5565684A (en) * | 1995-06-30 | 1996-10-15 | The University Of Utah | Three-dimensional SPECT reconstruction of combined cone-beam and fan-beam data |
| US5602395A (en) * | 1995-10-02 | 1997-02-11 | Adac Laboratories | Gamma camera having partial septas and moving septas for positron emission tomography (PET) |
Non-Patent Citations (31)
| Title |
|---|
| Bailey, et al, Ecart Art A Continuously Rotating PET Camera: Performance Characteristics, Initial Clinical Studies, and Installation Considerations in a Nuclear Medicine Department, European Journal of Nuclear Medicine, vol. 24, No. 1, Jan. 1997, London (UK) and Knoxville (TN), 10 pgs. * |
| Bailey, et al, Ecart Art-A Continuously Rotating PET Camera: Performance Characteristics, Initial Clinical Studies, and Installation Considerations in a Nuclear Medicine Department, European Journal of Nuclear Medicine, vol. 24, No. 1, Jan. 1997, London (UK) and Knoxville (TN), 10 pgs. |
| G. Muehllehner, et al. Abstract No. 284, From proceedings of the 42nd Annual Meeting, Scientific Papers, Spect Scanner with PET Coincidence Capability, Journal of Nuclear Medicine, Jun. 14, 1995, Philadelphia (PA), p. 70P. * |
| G. Muehllehner, et al., "Performance Parameters of a Positron Imaging Camera," IEEE Transactions on Nuclear Science, vol. NS-23, No. 1, Feb. 1976, Des Plains (IL), pp. 528-537. |
| G. Muehllehner, et al., Performance Parameters of a Positron Imaging Camera, IEEE Transactions on Nuclear Science, vol. NS 23, No. 1, Feb. 1976, Des Plains (IL), pp. 528 537. * |
| Gerd Muehllehner, Positron Camera with Extended Counting Rate Capability, Journal of Nuclear Medicine, vol. 15, No. 7, Jul. 1975, Des Plaines (IL), pp. 653 657. * |
| Gerd Muehllehner, Positron Camera with Extended Counting Rate Capability, Journal of Nuclear Medicine, vol. 15, No. 7, Jul. 1975, Des Plaines (IL), pp. 653-657. |
| James A. Sorenson, Ph.D. et al., Physics in Nuclear Medicine, W.B. Saunders Company, 2nd Ed., Philadelphia, 1987, pp. 252 259, 332 340, 443, 438 442, 451. * |
| James A. Sorenson, Ph.D. et al., Physics in Nuclear Medicine, W.B. Saunders Company, 2nd Ed., Philadelphia, 1987, pp. 252-259, 332-340, 443, 438-442, 451. |
| Karp et al., Singles Transmissioin in Positron Emission Tomography Using 137 Cs, from 1995 IEEE Nuclear Science Symposium and Medical Imaging Conference record vol. 13, University of Pennsylvania and UGM Medical Systems (Philadelphia, PA), pp. 1363 1367. * |
| Karp et al., Singles Transmissioin in Positron Emission Tomography Using137 Cs, from 1995 IEEE Nuclear Science Symposium and Medical Imaging Conference record vol. 13, University of Pennsylvania and UGM Medical Systems (Philadelphia, PA), pp. 1363-1367. |
| Karp, et al. Singles Transmission in Volume Imaging PET with a 137 Cs Source, Phys. Med. Biol. vol. 40, 1995, University of Pennsylvania and UGM Medical Systems (Philadelphia, PA), pp. 929 944. * |
| Karp, et al. Singles Transmission in Volume-Imaging PET with a 137 Cs Source, Phys. Med. Biol. vol. 40, 1995, University of Pennsylvania and UGM Medical Systems (Philadelphia, PA), pp. 929-944. |
| Karp, et al., Abstract No. 156 From proceedings of the 41st Annual Meeting, Scientific Papers, vol. 35, No. 5, Attenuation Correction in PET Using a Singles Transmission Source, May 1994, Philadelphia (PA), p. 41P. * |
| Karp, et al., Continuous Slice Penn PET: A Positron Tomograph with Volume Imaging Capability, Journal of Nuclear Medicine, vol. 31, No. 5, May 1990, Philadelphia, (PA), pp. 617 627. * |
| Karp, et al., Continuous-Slice Penn-PET: A Positron Tomograph with Volume Imaging Capability, Journal of Nuclear Medicine, vol. 31, No. 5, May 1990, Philadelphia, (PA), pp. 617-627. |
| P. Nellemann, et al., Performance Characteristics of a Dual Head Spect Scanner with PET Capability, From 1995 IEEE Nuclear Science Symposium conference record vol. 3, ADAC Laboratories and UGM Laboratory, pp. 1751 1755. * |
| P. Nellemann, et al., Performance Characteristics of a Dual Head Spect Scanner with PET Capability, From 1995 IEEE Nuclear Science Symposium conference record vol. 3, ADAC Laboratories and UGM Laboratory, pp. 1751-1755. |
| R.A. De Kamp, et al. Design and Performance of 3D Photon Transmission Measurement on a Positron Tomograph with Continuously Rotating Detectors, International Meeting on Fully Three Dimensional Image Reconstruction in Radiology and Nuclear Medicine, 1995, Ottowa and Hamilton (ON), Knoxville (TN), pp. 51 54. * |
| R.A. De Kamp, et al. Design and Performance of 3D Photon Transmission Measurement on a Positron Tomograph with Continuously Rotating Detectors, International Meeting on Fully Three-Dimensional Image Reconstruction in Radiology and Nuclear Medicine, 1995, Ottowa and Hamilton (ON), Knoxville (TN), pp. 51-54. |
| R.J. Smith and J.S. Karp, "Post injection Transmission Scanning in a Volume Imaging PET Camera", IEEE Transactions on Nuclear Science, vol. 41, No. 4, Aug. 1994, pp. 1526-1531. |
| R.J. Smith and J.S. Karp, "Simultaneous Post-Injection Transmission and Emission Contamination Scans in a Volume Imaging PET Scanner", IEEE Nuclear Science Symposium and Medical Imaging Conference Records, vol. 3, 1995, pp. 1781-01785. |
| R.J. Smith and J.S. Karp, Post injection Transmission Scanning in a Volume Imaging PET Camera , IEEE Transactions on Nuclear Science, vol. 41, No. 4, Aug. 1994, pp. 1526 1531. * |
| R.J. Smith and J.S. Karp, Simultaneous Post Injection Transmission and Emission Contamination Scans in a Volume Imaging PET Scanner , IEEE Nuclear Science Symposium and Medical Imaging Conference Records, vol. 3, 1995, pp. 1781 01785. * |
| R.J. Smith et al., "Singles Transmission Scans Performed Post-Injection for Quantitative Whole Body PET Imaging," IEEE Nuclear Science Symposium Conference Record, vol. 3, Nov. 1996, Philadelphia (PA), 7 pgs. |
| R.J. Smith et al., Singles Transmission Scans Performed Post Injection for Quantitative Whole Body PET Imaging, IEEE Nuclear Science Symposium Conference Record, vol. 3, Nov. 1996, Philadelphia (PA), 7 pgs. * |
| Robert A. De Kamp, et al. Attenuation Correction in PET Using Single Photon Transmission Measurement, Med. Phys., vol. 21, No. 6, Jun. 1994, Hamilton (ON), pp. 771 778. * |
| Robert A. De Kamp, et al. Attenuation Correction in PET Using Single Photon Transmission Measurement, Med. Phys., vol. 21, No. 6, Jun. 1994, Hamilton (ON), pp. 771-778. |
| Robert Anthony Dekemp, B.A.Sc., Attenuation Correction in Positron Emission Tomography Single Photon Transmission Measurement, Sep. 1992, Hamilton (ON), 106 pgs. * |
| Siu K. Yu and Claude Nahmias, Single Photon Transmission Measurements in Positron Tomography Using 137 Cs, 1995, Hamilton (ON), 29 pgs. * |
| Siu K. Yu and Claude Nahmias, Single Photon Transmission Measurements in Positron Tomography Using137 Cs, 1995, Hamilton (ON), 29 pgs. |
Cited By (16)
| Publication number | Priority date | Publication date | Assignee | Title |
|---|---|---|---|---|
| WO2001022120A1 (en) * | 1999-09-17 | 2001-03-29 | Cti Pet Systems, Inc. | Transmission attenuation correction method for pet and spect |
| EP2581739A1 (en) | 2002-03-05 | 2013-04-17 | Caliper Life Sciences, Inc. | Mixed mode microfluidic systems |
| EP2442102A2 (en) | 2002-04-02 | 2012-04-18 | Caliper Life Sciences Inc. | Methods, systems and apparatus for separation and isolation of one or more sample components of a sample biological material |
| US20040167398A1 (en) * | 2002-11-29 | 2004-08-26 | Thomas Flohr | Combined emission tomography and computer tomography unit |
| US20060249682A1 (en) * | 2003-06-04 | 2006-11-09 | Darren Hogg | Generating detector efficiency estimates for a pet scanner |
| US7564035B2 (en) * | 2003-06-04 | 2009-07-21 | Hammersmith Imanet Limited | Generating detector efficiency estimates for a pet scanner |
| US20100067766A1 (en) * | 2008-09-18 | 2010-03-18 | Siemens Medical Solutions Usa, Inc. | Extracting location information using difference images from a non-parallel hole collimator |
| US8294109B2 (en) * | 2008-09-18 | 2012-10-23 | Siemens Medical Solutions Usa, Inc. | Extracting location information using difference images from a non-parallel hole collimator |
| US11678804B2 (en) | 2012-03-07 | 2023-06-20 | Ziteo, Inc. | Methods and systems for tracking and guiding sensors and instruments |
| US11464503B2 (en) | 2014-11-14 | 2022-10-11 | Ziteo, Inc. | Methods and systems for localization of targets inside a body |
| US20180303439A1 (en) * | 2015-03-11 | 2018-10-25 | David Byron Douglas | Spatial resolution in molecular and radiological imaging |
| US10517546B2 (en) * | 2015-03-11 | 2019-12-31 | David Byron Douglas | Spatial resolution in molecular and radiological imaging |
| US9606245B1 (en) | 2015-03-24 | 2017-03-28 | The Research Foundation For The State University Of New York | Autonomous gamma, X-ray, and particle detector |
| US9835737B1 (en) | 2015-03-24 | 2017-12-05 | The Research Foundation For The State University Of New York | Autonomous gamma, X-ray, and particle detector |
| US11439358B2 (en) | 2019-04-09 | 2022-09-13 | Ziteo, Inc. | Methods and systems for high performance and versatile molecular imaging |
| US11883214B2 (en) | 2019-04-09 | 2024-01-30 | Ziteo, Inc. | Methods and systems for high performance and versatile molecular imaging |
Also Published As
| Publication number | Publication date |
|---|---|
| JP2002512374A (en) | 2002-04-23 |
| WO1999054756A1 (en) | 1999-10-28 |
| AU3111899A (en) | 1999-11-08 |
| DE19983222T1 (en) | 2001-07-26 |
Similar Documents
| Publication | Publication Date | Title |
|---|---|---|
| US5999588A (en) | Deadtime correction in a nuclear medicine imaging system | |
| US6100531A (en) | Dual-purpose radiation transmission source for nuclear medicine imaging system | |
| US6008493A (en) | Method and apparatus for performing correction of emission contamination and deadtime loss in a medical imaging system | |
| US5900636A (en) | Dual-mode gamma camera system utilizing single-photon transmission scanning for attenuation correction of PET data | |
| Geworski et al. | Recovery correction for quantitation in emission tomography: a feasibility study | |
| EP0526970B1 (en) | Imaging methods and apparatus | |
| US6603125B1 (en) | Event localization and fall-off correction by distance-dependent weighting | |
| US5998793A (en) | Method and apparatus for correcting for random coincidences in a nuclear medicine imaging system | |
| US6403960B1 (en) | Correction for spatial variations of deadtime of a monolithic scintillator based detector in a medical imaging system | |
| US6410920B1 (en) | Method and apparatus for performing correction of emission contamination and deadtime loss in a medical imaging system | |
| Li et al. | Determination of both mechanical and electronic shifts in cone beam SPECT | |
| Smith et al. | Singles transmission scans performed post-injection for quantitative whole body PET imaging | |
| Muehllehner et al. | Design and performance of a new positron tomograph | |
| US4984159A (en) | Method and apparatus for estimating elliptical body contours in fan beam computed tomographic systems | |
| US5834779A (en) | Method and apparatus for performing correction for random coincidences in a medical imaging system | |
| CA1204884A (en) | Energy window selection for a radiation signal processing system | |
| US5990482A (en) | Method and apparatus for performing correction of transmission self-contamination in a medical imaging system | |
| Koral et al. | Improving emission-computed-tomography quantification by Compton-scatter rejection through offset windows | |
| Rogers | A method for correcting the depth-of-interaction blurring in PET cameras | |
| Cutler et al. | Use of digital front-end electronics for optimization of a modular PET detector | |
| Mas et al. | Improvement of quantification in SPECT studies by scatter and attenuation compensation | |
| Welch et al. | A comparison of Gd/Tc versus Tc/Tl simultaneous transmission and emission imaging using both single and triple detector fan-beam SPECT systems | |
| US6259097B1 (en) | Use of transmission pre-scan of an object to be imaged to determine duration of transmission scan | |
| US5424946A (en) | Adaptive angular transmission filter for pet scanner | |
| Kaplan et al. | Scatter and attenuation correction for 111In based on energy spectrum fitting |
Legal Events
| Date | Code | Title | Description |
|---|---|---|---|
| AS | Assignment |
Owner name: ADAC LABORATORIES, CALIFORNIA Free format text: ASSIGNMENT OF ASSIGNORS INTEREST;ASSIGNORS:HINES, HORACE H.;FARMER, IAN;NELLEMANN, PETER;AND OTHERS;REEL/FRAME:009341/0824;SIGNING DATES FROM 19980602 TO 19980603 |
|
| AS | Assignment |
Owner name: ABN AMRO BANK, N.V., AS AGENT, CALIFORNIA Free format text: SECURITY INTEREST;ASSIGNOR:ADAC LABORATORIES;REEL/FRAME:010370/0793 Effective date: 19990817 |
|
| FEPP | Fee payment procedure |
Free format text: PAYOR NUMBER ASSIGNED (ORIGINAL EVENT CODE: ASPN); ENTITY STATUS OF PATENT OWNER: LARGE ENTITY |
|
| AS | Assignment |
Owner name: ADAC LABORATORIES, CALIFORNIA Free format text: RELEASE;ASSIGNOR:ABN AMRO BANK N.V., AS AGENT;REEL/FRAME:011506/0729 Effective date: 20010131 |
|
| AS | Assignment |
Owner name: KONINKLIJKE PHILIPS ELECTRONICS N.V., NETHERLANDS Free format text: ASSIGNMENT OF ASSIGNORS INTEREST;ASSIGNOR:ADAC LABORATORIES;REEL/FRAME:013475/0446 Effective date: 20020819 |
|
| FPAY | Fee payment |
Year of fee payment: 4 |
|
| FPAY | Fee payment |
Year of fee payment: 8 |
|
| REMI | Maintenance fee reminder mailed | ||
| LAPS | Lapse for failure to pay maintenance fees | ||
| STCH | Information on status: patent discontinuation |
Free format text: PATENT EXPIRED DUE TO NONPAYMENT OF MAINTENANCE FEES UNDER 37 CFR 1.362 |
|
| FP | Lapsed due to failure to pay maintenance fee |
Effective date: 20120808 |