US5807750A - Optical substance analyzer and data processor - Google Patents
Optical substance analyzer and data processor Download PDFInfo
- Publication number
- US5807750A US5807750A US08/434,527 US43452795A US5807750A US 5807750 A US5807750 A US 5807750A US 43452795 A US43452795 A US 43452795A US 5807750 A US5807750 A US 5807750A
- Authority
- US
- United States
- Prior art keywords
- analyte
- sample
- inert
- gas
- analyzer
- Prior art date
- Legal status (The legal status is an assumption and is not a legal conclusion. Google has not performed a legal analysis and makes no representation as to the accuracy of the status listed.)
- Expired - Fee Related
Links
- 230000003287 optical effect Effects 0.000 title claims abstract description 47
- 239000000126 substance Substances 0.000 title description 5
- 239000000523 sample Substances 0.000 claims abstract description 143
- 239000007789 gas Substances 0.000 claims abstract description 99
- 239000007788 liquid Substances 0.000 claims abstract description 49
- 239000000463 material Substances 0.000 claims abstract description 19
- 238000001514 detection method Methods 0.000 claims abstract description 12
- 239000012491 analyte Substances 0.000 claims description 76
- 238000005259 measurement Methods 0.000 claims description 45
- 238000005070 sampling Methods 0.000 claims description 39
- 230000003595 spectral effect Effects 0.000 claims description 30
- 238000000034 method Methods 0.000 claims description 29
- 230000005855 radiation Effects 0.000 claims description 27
- 239000000835 fiber Substances 0.000 claims description 26
- 239000011521 glass Substances 0.000 claims description 23
- 230000004044 response Effects 0.000 claims description 21
- VYPSYNLAJGMNEJ-UHFFFAOYSA-N silicon dioxide Inorganic materials O=[Si]=O VYPSYNLAJGMNEJ-UHFFFAOYSA-N 0.000 claims description 19
- 230000003993 interaction Effects 0.000 claims description 14
- 239000010453 quartz Substances 0.000 claims description 14
- 239000011159 matrix material Substances 0.000 claims description 11
- 238000010521 absorption reaction Methods 0.000 claims description 10
- 238000012545 processing Methods 0.000 claims description 10
- 238000010276 construction Methods 0.000 claims description 9
- 238000001228 spectrum Methods 0.000 claims description 9
- XKRFYHLGVUSROY-UHFFFAOYSA-N Argon Chemical compound [Ar] XKRFYHLGVUSROY-UHFFFAOYSA-N 0.000 claims description 8
- QSHDDOUJBYECFT-UHFFFAOYSA-N mercury Chemical compound [Hg] QSHDDOUJBYECFT-UHFFFAOYSA-N 0.000 claims description 8
- 229910052753 mercury Inorganic materials 0.000 claims description 8
- 230000000694 effects Effects 0.000 claims description 7
- 238000011065 in-situ storage Methods 0.000 claims description 7
- 229910052724 xenon Inorganic materials 0.000 claims description 7
- FHNFHKCVQCLJFQ-UHFFFAOYSA-N xenon atom Chemical compound [Xe] FHNFHKCVQCLJFQ-UHFFFAOYSA-N 0.000 claims description 7
- YZCKVEUIGOORGS-OUBTZVSYSA-N Deuterium Chemical compound [2H] YZCKVEUIGOORGS-OUBTZVSYSA-N 0.000 claims description 5
- 229910052805 deuterium Inorganic materials 0.000 claims description 5
- 239000005350 fused silica glass Substances 0.000 claims description 5
- -1 tungsten halogen Chemical class 0.000 claims description 5
- 229910052786 argon Inorganic materials 0.000 claims description 4
- CPBQJMYROZQQJC-UHFFFAOYSA-N helium neon Chemical compound [He].[Ne] CPBQJMYROZQQJC-UHFFFAOYSA-N 0.000 claims description 4
- 238000004611 spectroscopical analysis Methods 0.000 claims description 4
- 229910001220 stainless steel Inorganic materials 0.000 claims description 4
- 239000010935 stainless steel Substances 0.000 claims description 4
- 229910052721 tungsten Inorganic materials 0.000 claims description 4
- 239000010937 tungsten Substances 0.000 claims description 4
- 229910052736 halogen Inorganic materials 0.000 claims description 3
- 238000010438 heat treatment Methods 0.000 claims description 3
- 229920002994 synthetic fiber Polymers 0.000 claims description 3
- 229910000831 Steel Inorganic materials 0.000 claims description 2
- 239000011248 coating agent Substances 0.000 claims description 2
- 238000000576 coating method Methods 0.000 claims description 2
- 239000002245 particle Substances 0.000 claims description 2
- 239000010959 steel Substances 0.000 claims description 2
- 230000001678 irradiating effect Effects 0.000 claims 8
- 238000003491 array Methods 0.000 claims 3
- WFKWXMTUELFFGS-UHFFFAOYSA-N tungsten Chemical compound [W] WFKWXMTUELFFGS-UHFFFAOYSA-N 0.000 claims 1
- 238000004458 analytical method Methods 0.000 abstract description 29
- 238000012544 monitoring process Methods 0.000 abstract description 29
- 241000282414 Homo sapiens Species 0.000 abstract description 17
- 238000013461 design Methods 0.000 abstract description 15
- 230000007613 environmental effect Effects 0.000 abstract description 14
- 239000008280 blood Substances 0.000 abstract description 8
- 210000004369 blood Anatomy 0.000 abstract description 8
- 238000004868 gas analysis Methods 0.000 abstract description 8
- 210000003296 saliva Anatomy 0.000 abstract description 8
- 230000000295 complement effect Effects 0.000 abstract description 5
- 238000011109 contamination Methods 0.000 abstract description 5
- 239000005388 borosilicate glass Substances 0.000 abstract description 4
- 238000012360 testing method Methods 0.000 abstract description 4
- 238000012986 modification Methods 0.000 abstract description 3
- 230000004048 modification Effects 0.000 abstract description 3
- 210000004027 cell Anatomy 0.000 description 58
- QGZKDVFQNNGYKY-UHFFFAOYSA-N Ammonia Chemical compound N QGZKDVFQNNGYKY-UHFFFAOYSA-N 0.000 description 14
- RAHZWNYVWXNFOC-UHFFFAOYSA-N Sulphur dioxide Chemical compound O=S=O RAHZWNYVWXNFOC-UHFFFAOYSA-N 0.000 description 14
- 239000003570 air Substances 0.000 description 12
- GQPLMRYTRLFLPF-UHFFFAOYSA-N Nitrous Oxide Chemical compound [O-][N+]#N GQPLMRYTRLFLPF-UHFFFAOYSA-N 0.000 description 10
- 150000001875 compounds Chemical class 0.000 description 10
- 238000010586 diagram Methods 0.000 description 9
- 239000000203 mixture Substances 0.000 description 8
- CURLTUGMZLYLDI-UHFFFAOYSA-N Carbon dioxide Chemical compound O=C=O CURLTUGMZLYLDI-UHFFFAOYSA-N 0.000 description 7
- IJGRMHOSHXDMSA-UHFFFAOYSA-N Atomic nitrogen Chemical compound N#N IJGRMHOSHXDMSA-UHFFFAOYSA-N 0.000 description 6
- JCXJVPUVTGWSNB-UHFFFAOYSA-N Nitrogen dioxide Chemical compound O=[N]=O JCXJVPUVTGWSNB-UHFFFAOYSA-N 0.000 description 6
- 239000012530 fluid Substances 0.000 description 6
- 229910000069 nitrogen hydride Inorganic materials 0.000 description 6
- 229910002092 carbon dioxide Inorganic materials 0.000 description 5
- 238000001914 filtration Methods 0.000 description 5
- 239000001272 nitrous oxide Substances 0.000 description 5
- 238000004886 process control Methods 0.000 description 5
- 230000035945 sensitivity Effects 0.000 description 5
- 210000002700 urine Anatomy 0.000 description 5
- 238000000862 absorption spectrum Methods 0.000 description 4
- 229910021529 ammonia Inorganic materials 0.000 description 4
- 230000008901 benefit Effects 0.000 description 4
- 230000008859 change Effects 0.000 description 4
- 230000001276 controlling effect Effects 0.000 description 4
- 229910052751 metal Inorganic materials 0.000 description 4
- 239000002184 metal Substances 0.000 description 4
- 230000008569 process Effects 0.000 description 4
- 230000003068 static effect Effects 0.000 description 4
- UHOVQNZJYSORNB-UHFFFAOYSA-N Benzene Chemical compound C1=CC=CC=C1 UHOVQNZJYSORNB-UHFFFAOYSA-N 0.000 description 3
- 241001465754 Metazoa Species 0.000 description 3
- YXFVVABEGXRONW-UHFFFAOYSA-N Toluene Chemical compound CC1=CC=CC=C1 YXFVVABEGXRONW-UHFFFAOYSA-N 0.000 description 3
- 238000002835 absorbance Methods 0.000 description 3
- 239000012080 ambient air Substances 0.000 description 3
- 201000010099 disease Diseases 0.000 description 3
- 208000037265 diseases, disorders, signs and symptoms Diseases 0.000 description 3
- 238000005516 engineering process Methods 0.000 description 3
- ORUIBWPALBXDOA-UHFFFAOYSA-L magnesium fluoride Chemical compound [F-].[F-].[Mg+2] ORUIBWPALBXDOA-UHFFFAOYSA-L 0.000 description 3
- 229910001635 magnesium fluoride Inorganic materials 0.000 description 3
- VLKZOEOYAKHREP-UHFFFAOYSA-N n-Hexane Chemical compound CCCCCC VLKZOEOYAKHREP-UHFFFAOYSA-N 0.000 description 3
- 229910052757 nitrogen Inorganic materials 0.000 description 3
- 239000013307 optical fiber Substances 0.000 description 3
- 238000007619 statistical method Methods 0.000 description 3
- 235000010269 sulphur dioxide Nutrition 0.000 description 3
- 206010007733 Catabolic state Diseases 0.000 description 2
- MWUXSHHQAYIFBG-UHFFFAOYSA-N Nitric oxide Chemical compound O=[N] MWUXSHHQAYIFBG-UHFFFAOYSA-N 0.000 description 2
- CBENFWSGALASAD-UHFFFAOYSA-N Ozone Chemical compound [O-][O+]=O CBENFWSGALASAD-UHFFFAOYSA-N 0.000 description 2
- XSQUKJJJFZCRTK-UHFFFAOYSA-N Urea Chemical compound NC(N)=O XSQUKJJJFZCRTK-UHFFFAOYSA-N 0.000 description 2
- 229910052782 aluminium Inorganic materials 0.000 description 2
- XAGFODPZIPBFFR-UHFFFAOYSA-N aluminium Chemical compound [Al] XAGFODPZIPBFFR-UHFFFAOYSA-N 0.000 description 2
- 238000013459 approach Methods 0.000 description 2
- 230000005540 biological transmission Effects 0.000 description 2
- 238000004159 blood analysis Methods 0.000 description 2
- 239000004202 carbamide Substances 0.000 description 2
- 239000001569 carbon dioxide Substances 0.000 description 2
- 210000005056 cell body Anatomy 0.000 description 2
- 239000000919 ceramic Substances 0.000 description 2
- 239000013626 chemical specie Substances 0.000 description 2
- 238000002485 combustion reaction Methods 0.000 description 2
- 238000001658 differential optical absorption spectrophotometry Methods 0.000 description 2
- 239000002803 fossil fuel Substances 0.000 description 2
- 238000004817 gas chromatography Methods 0.000 description 2
- 150000002500 ions Chemical class 0.000 description 2
- 238000012423 maintenance Methods 0.000 description 2
- 230000002503 metabolic effect Effects 0.000 description 2
- 238000004867 photoacoustic spectroscopy Methods 0.000 description 2
- 150000003254 radicals Chemical class 0.000 description 2
- 230000001105 regulatory effect Effects 0.000 description 2
- 239000000243 solution Substances 0.000 description 2
- 241000894007 species Species 0.000 description 2
- 238000003860 storage Methods 0.000 description 2
- 230000001360 synchronised effect Effects 0.000 description 2
- 230000007306 turnover Effects 0.000 description 2
- 238000002211 ultraviolet spectrum Methods 0.000 description 2
- XLYOFNOQVPJJNP-UHFFFAOYSA-N water Substances O XLYOFNOQVPJJNP-UHFFFAOYSA-N 0.000 description 2
- 229910000619 316 stainless steel Inorganic materials 0.000 description 1
- 201000003883 Cystic fibrosis Diseases 0.000 description 1
- 241000282412 Homo Species 0.000 description 1
- 238000004566 IR spectroscopy Methods 0.000 description 1
- 206010023126 Jaundice Diseases 0.000 description 1
- SNIOPGDIGTZGOP-UHFFFAOYSA-N Nitroglycerin Chemical compound [O-][N+](=O)OCC(O[N+]([O-])=O)CO[N+]([O-])=O SNIOPGDIGTZGOP-UHFFFAOYSA-N 0.000 description 1
- 206010035664 Pneumonia Diseases 0.000 description 1
- 208000034189 Sclerosis Diseases 0.000 description 1
- 230000000274 adsorptive effect Effects 0.000 description 1
- 238000010171 animal model Methods 0.000 description 1
- 239000008346 aqueous phase Substances 0.000 description 1
- QVGXLLKOCUKJST-UHFFFAOYSA-N atomic oxygen Chemical compound [O] QVGXLLKOCUKJST-UHFFFAOYSA-N 0.000 description 1
- YEESUBCSWGVPCE-UHFFFAOYSA-N azanylidyneoxidanium iron(2+) pentacyanide Chemical compound [Fe++].[C-]#N.[C-]#N.[C-]#N.[C-]#N.[C-]#N.N#[O+] YEESUBCSWGVPCE-UHFFFAOYSA-N 0.000 description 1
- 208000027119 bilirubin metabolic disease Diseases 0.000 description 1
- DGJPPCSCQOIWCP-UHFFFAOYSA-N cadmium mercury Chemical compound [Cd].[Hg] DGJPPCSCQOIWCP-UHFFFAOYSA-N 0.000 description 1
- 238000006243 chemical reaction Methods 0.000 description 1
- 238000004590 computer program Methods 0.000 description 1
- 238000012937 correction Methods 0.000 description 1
- 238000010141 design making Methods 0.000 description 1
- 208000000718 duodenal ulcer Diseases 0.000 description 1
- 210000001198 duodenum Anatomy 0.000 description 1
- 238000004993 emission spectroscopy Methods 0.000 description 1
- 238000000295 emission spectrum Methods 0.000 description 1
- 231100000821 endpoints of toxicity testing Toxicity 0.000 description 1
- 239000003344 environmental pollutant Substances 0.000 description 1
- 238000011156 evaluation Methods 0.000 description 1
- 230000005713 exacerbation Effects 0.000 description 1
- 239000002657 fibrous material Substances 0.000 description 1
- 239000003546 flue gas Substances 0.000 description 1
- 230000037406 food intake Effects 0.000 description 1
- 229960003711 glyceryl trinitrate Drugs 0.000 description 1
- 238000009499 grossing Methods 0.000 description 1
- 230000002949 hemolytic effect Effects 0.000 description 1
- 208000036796 hyperbilirubinemia Diseases 0.000 description 1
- 238000005286 illumination Methods 0.000 description 1
- WPYVAWXEWQSOGY-UHFFFAOYSA-N indium antimonide Chemical compound [Sb]#[In] WPYVAWXEWQSOGY-UHFFFAOYSA-N 0.000 description 1
- 239000002440 industrial waste Substances 0.000 description 1
- 238000002347 injection Methods 0.000 description 1
- 239000007924 injection Substances 0.000 description 1
- 230000010354 integration Effects 0.000 description 1
- 238000001990 intravenous administration Methods 0.000 description 1
- 230000009545 invasion Effects 0.000 description 1
- 238000004519 manufacturing process Methods 0.000 description 1
- 238000004949 mass spectrometry Methods 0.000 description 1
- 239000011944 nitrogen(II) oxide Substances 0.000 description 1
- 229960002460 nitroprusside Drugs 0.000 description 1
- 235000003715 nutritional status Nutrition 0.000 description 1
- 239000000382 optic material Substances 0.000 description 1
- 230000001151 other effect Effects 0.000 description 1
- 239000001301 oxygen Substances 0.000 description 1
- 229910052760 oxygen Inorganic materials 0.000 description 1
- 244000052769 pathogen Species 0.000 description 1
- 230000001717 pathogenic effect Effects 0.000 description 1
- 230000035515 penetration Effects 0.000 description 1
- 230000002572 peristaltic effect Effects 0.000 description 1
- 231100000719 pollutant Toxicity 0.000 description 1
- 230000002028 premature Effects 0.000 description 1
- 230000001681 protective effect Effects 0.000 description 1
- 230000002285 radioactive effect Effects 0.000 description 1
- 230000000306 recurrent effect Effects 0.000 description 1
- 230000029058 respiratory gaseous exchange Effects 0.000 description 1
- 239000012898 sample dilution Substances 0.000 description 1
- 238000004904 shortening Methods 0.000 description 1
- 238000001179 sorption measurement Methods 0.000 description 1
- 238000012144 step-by-step procedure Methods 0.000 description 1
- 210000002784 stomach Anatomy 0.000 description 1
- 231100000331 toxic Toxicity 0.000 description 1
- 230000002588 toxic effect Effects 0.000 description 1
- 238000000411 transmission spectrum Methods 0.000 description 1
- 230000001960 triggered effect Effects 0.000 description 1
- 239000002699 waste material Substances 0.000 description 1
Images


Classifications
-
- G—PHYSICS
- G01—MEASURING; TESTING
- G01N—INVESTIGATING OR ANALYSING MATERIALS BY DETERMINING THEIR CHEMICAL OR PHYSICAL PROPERTIES
- G01N21/00—Investigating or analysing materials by the use of optical means, i.e. using sub-millimetre waves, infrared, visible or ultraviolet light
- G01N21/17—Systems in which incident light is modified in accordance with the properties of the material investigated
- G01N21/25—Colour; Spectral properties, i.e. comparison of effect of material on the light at two or more different wavelengths or wavelength bands
- G01N21/31—Investigating relative effect of material at wavelengths characteristic of specific elements or molecules, e.g. atomic absorption spectrometry
- G01N21/33—Investigating relative effect of material at wavelengths characteristic of specific elements or molecules, e.g. atomic absorption spectrometry using ultraviolet light
-
- G—PHYSICS
- G01—MEASURING; TESTING
- G01N—INVESTIGATING OR ANALYSING MATERIALS BY DETERMINING THEIR CHEMICAL OR PHYSICAL PROPERTIES
- G01N2201/00—Features of devices classified in G01N21/00
- G01N2201/02—Mechanical
- G01N2201/024—Modular construction
Definitions
- This invention relates to devices for detecting and measuring the chemical composition of gaseous and liquid compounds, and more particularly, relates to an analyzer for analyzing gas and liquid compounds utilizing ultraviolet, visible and infrared absorption spectroscopy.
- Liquid and gas analyzers are being used to analyze the composition of compounds for purposes of environmental monitoring and control, as well as medical and diagnostic purposes.
- Low level detection and measurement of gaseous and liquid compounds is currently being achieved through a variety of different analytical techniques including spectroscopy, mass spectrometry, gas chromatography and electro chemical cells.
- the need to measure increasingly lower concentrations of pollutants in waste stream produced by industry, as well as in the environment, is being catalyzed by stricter environmental regulations.
- Industrial plants seek to optimize the process efficiencies requiring fast feedback from the monitoring instruments to make necessary control adjustments.
- a genuine need for low cost, sensitive and fast analyzing exists.
- the monitoring of gaseous analytes is described in more detail in "Air Monitoring by Spectrascopic Techniques" (Ed Markus W. Sigrist, 1994 Wiley-Interscience, John Wiley and Sons, New York, Chitchester, Brisbane, Toronto, Singapore).
- Yet another object of the present invention is to provide a liquid and gas analyzer that can be used in the bio-medical industry for diagnostic purposes.
- Still another object of the present invention is to provide a liquid and gas analyzer using ultraviolet (UV) based Differential Optical Absorption Spectroscopy (DOAS) analysis.
- UV ultraviolet
- DOAS Differential Optical Absorption Spectroscopy
- Yet another object of the present invention is to provide a liquid and gas analyzing system having a short path coupled to monitor exhaust gas streams by extractive multi-gas analysis.
- Still another object of the present invention is to provide a liquid and gas analyzer for monitoring extreme low levels of gases at a utility for environmental compliance and process control.
- Yet another object of the present invention is to provide a liquid and gas analyzer that utilizes extractive gas analysis system for monitoring ambient air quality.
- Still another object of the present invention is to provide a liquid and gas analyzer that provides in-situ gas analysis employing fiber optics.
- Yet another object of the present invention is to provide a liquid and gas analyzer that utilizes extractive liquid analysis for environmental monitoring.
- Yet another object of the present invention is to provide a liquid and gas analyzer that provides in-situ liquid analysis for environmental monitoring.
- Still another object of the present invention is to provide a liquid and gas analyzing system that provides long path/remote sensing gas monitoring such as fence line monitoring and leak detection.
- Yet another object of the present invention is to provide a liquid and gas analyzing system that can be utilized for non-invasive human breath analysis using conventional sterile plastic bags fitted with a valve for a sample collection.
- Still another object of the present invention is to provide a liquid and gas analyzing system that employs a fiber optic based system for analysis of human fluids such as saliva, human blood or urine.
- the purpose of the present invention is to provide efficient liquid and gas analyzing system that can be employed both in environmental monitoring and process control, and also has medical applications.
- a variety of unique features are embodied in the liquid and gas analyzer of the present invention that make is stand out from contemporary systems.
- the system employs an extractive analyzer for measurement of low levels of gases and incorporates features that allow use in extreme applications such as high temperatures and with highly corrosive chemicals.
- One embodiment allows use in industrial enterprises that typically need to monitor low levels, often zero to ten parts per million (ppm) of ammonia (NH 3 ), nitrous oxide (NO) and sulfur dioxide (SO 2 ) in a gas stream exhausting from boilers.
- Oxides of nitrogen (NO X ) can be reduced by controlling the injection of NH 3 (either in the form of free gas or as urea) into a stack gas treatment system, leading to a reaction affording water and nitrogen.
- NH 3 slip the penetration of NH 3 into the gas treatment system and subsequently into the environment (often referred to as NH 3 slip) is highly undesirable.
- the gas analyzer of the present invention therefore, can continuously monitor the emitted extreme low concentration of these compounds in a sufficiently short period of time (in the order of seconds) to allow feedback and process control.
- the system of the present invention utilizes a sampling probe comprised of a borosilicate gas tube liner surrounded by an electrical heater (controlled to maintain the temperature at 250° C.) and a protective 316 stainless steel sheath.
- the tip of the probe is provided with a probe filter (sintered quartz, 2 ⁇ m) glass blown onto a medium wall 1/2 inch tubing so that a sample is filtered at the sampling point rather than inside the probe housing outside the stack as with traditional probes.
- the probe tip is protected with a steel funnel.
- the borosilicate probe lining is constructed so that it can be easily replaced in the field.
- the end of the borosilicate probe liner extends out of the stack and is connected to a T-union of synthetic inert material in the probe housing.
- the T-union is linked to a commercially available automated cylinder gas calibration unit by a high temperature solenoid valve lined with inert material.
- a third connection to the T-union is comprised of a specially formed piece of tubing made of an inert synthetic material in a spiral configuration to minimize stress on glass pieces.
- the probe housing and tubing is insulated, heated, and temperature regulated to approximately 250° C. and is delivered to an analyzer.
- the heated line is connected to a borosilicate T-piece via a synthetic inert union.
- a vertical portion of the T-piece is connected to a source of compressed air (blow back) through a suitable solenoid valve to periodically clean the probe filter of particulates.
- the third end of the T-piece is an all glass solenoid valve (ball and socket design with a metal plunger encapsulated in glass) that allows the analyzer to be isolated during blow back of compressed air or if a system failure occurs.
- a sample cell is then connected via a synthetic union to the downstream end of the solenoid valve (1/2 inch glass tubing).
- a heated pump aspirates the gas sample downstream from the sample cell which is then vented to the cabinet exhaust.
- the entire sampling system is surrounded by a special electric heater and is insulated as is known in the art. Temperature sensors, fitted at strategic points throughout the system, monitor and control the temperature at a specified temperature such as at 250° C. up to and including the optical cell and at 150° C. at the exhaust vent from the cell.
- the entire analyzing system can be stack mounted or mounted on a surface close to the stack.
- a preferred feature of the invention is to have the analyzer on the stack by the probe, eliminating the need for long sample lines that are costly and difficult to maintain, and inevitably lead to sample loss/contamination.
- the sample volume between the probe tip and the analyzer exhaust being taken is under one liter, leading to very fast response time. Also, none of the gas sample is exposed to any metal surface from the point of sampling to the exhaust from the optical cell in the analyzer.
- the main contact is with borosilicate glass at 250° C., a material that inert to into the gases and the mixture as well as possessing low adsorption properties.
- the system described allows a non-corrupted, representative gas sample to be delivered to an optical cell in a very short period of time using a low maintenance and low cost sampling system.
- the optical sample cell in the analyzer is a single pass design having two fused silica windows made of quartz. Fast off-axis mirrors are employed at each end of the cell to allow optimum interface between the various components as well as good beam collimation. Once aligned, the system is rugged and insensitive to mechanical vibrations. In some instances, a multi-pass cell could be used instead of a single-pass design allowing even longer optical path lengths and hence higher sensitivity.
- the sample cell is selected to fit the application. It is either a heated cell or an ambient temperature cell.
- the cell has a fixed optical path length that is typically selected to be between 1 and 20 meters, but optical path lengths of more than 100 meters are possible allowing sample measurements to the low ppb levels.
- the use and operation of multi-pass sample cells is described in "Gas Measurement in the Fundamental Infrared Region, Volume 1" by Philip Hanst and Steven Hanst.
- the entire optical cell is externally coated with a reflective material.
- the illumination or radiation source is then placed close to the entrance of the cell with a detector directly in-line at the opposite end.
- This system eliminates the need for any lenses or mirrors.
- the angle of the source, to the cell could be varied to change the number of reflections the light beam would make inside the cell, which would change the distance traveled by the beam.
- a cell coated with a reflective surface would have an effective optical path length that is longer than the physical length of the cell, thereby raising the instrument sensitivity. Undesirable radiation can be filtered out using bandpass filters.
- the radiation source for the cell is preferably a xenon flash lamp, supplied with trigger module and power supply.
- This type of radiation is preferred because it has a strong emission in the desired spectral range and is very stable.
- Another advantage of this source of radiation is that typical emission peaks from the excited xenon gas can be used to calibrate the detector and test optical resolution of the system.
- the trigger module for the system is under direct control of software controlling the spectrometer, thereby synchronizing the energy pulse with measurements.
- Alternate radiation sources can be a deuterium lamp, mercury lamp, mercury/argon lamp, tungsten halogen lamp, diode laser, helium-neon laser, etc. if desired.
- a detector receives the radiation passing through the sample and is comprised of a miniature spectrometer which is a dispersive instrument of a particular design equipped with an array of detectors.
- the miniature spectrometer detector has a measurement range from 180 to 300 nm (nanometer). Additional miniature spectrometers can be added in a modular fashion to increase the measurement range without sacrificing optical resolution and/or to act as a reference channel.
- the system is constructed so that a plurality of detectors in the miniature spectrometer all receive their respective wavelengths of radiation simultaneously so that the time related effects of the flowing sample will not introduce inaccuracies into the measurement.
- the output of the miniature spectrometer is connected to an analog to digital converter and custom data acquisition system having software that has been written to accommodate the requirements of the analyzer.
- the output of the spectrometer is in the form of electronic counts as a function of spectral wavelength. This information is treated mathematically to filter instrument noise to achieve higher detection limits and account for interferences by other species in the sample.
- the software processes the data by first obtaining an electronic count value of the wavelength set characteristic of a sample. A signal ratio for the sample is then calculated that minimizes spectral interferences.
- Environmentally derived algorithms are then used to calculate the concentration of the sample from instrument's response, the concentration of spectral interference, and the extent of interaction of spectral interference on the concentration of the sample.
- the interference is then subtracted from the initial concentration to give a first approximation.
- a second interference-free approximation is performed by using a decision matrix and a corresponding experimentally determined step-by-step procedure.
- the output provides an accurate analysis and measurement of extremely low levels of components in the sample.
- a unique aspect of the invention is its modular construction that allows the addition of other components to make the system highly versatile and powerful.
- An infrared (IR) analyzer module can easily be interfaced with the sample and analyzing system.
- the heated gas stream would be fed from the pump exhaust through a heated multi-pass cell and then connected to either a miniature gas chromatographic instrument or vented to the atmosphere or back into the stack.
- the principle of an IR component of this system is shown and described in U.S. Pat. No. 4,746,218 of Lord, issued May 24, 1988, incorporated herein by reference.
- the source could also consist of a glowing ceramic element, a diode laser and/or a carbon dioxide laser.
- FT dispersive Fourier Transform
- rotating diffraction grating mounted to a synchronous motor
- linear circular variable filter a photo acoustic spectroscopy system
- opto-acoustic filtration system Several options are available to replace the gas filtration and detection system such as a dispersive Fourier Transform (FT) spectrometer, a rotating diffraction grating mounted to a synchronous motor, a linear circular variable filter, a photo acoustic spectroscopy system or an opto-acoustic filtration system.
- FT dispersive Fourier Transform
- Another option is the addition of gas chromatography capability.
- This option permits the use of a miniature gas chromatographic (GC) instrument that can be easily linked into the system either instead of, or along with the IR capabilities described above.
- the chromatographic instrument would be connected in parallel with the sample line and would be programmed to sample the gas stream at regular intervals.
- the system also has applications in the biomedical industry. It would provide a system that would yield a versatile, non-invasive diagnostic system having vast potential. One such application would be as a breath analyzer.
- the breath of healthy humans and animals normally contains approximately 60 to 80 volatile compounds produced by endogenous metabolic and catabolic reactions. Individual breath components have yielded valuable information as disease indicators.
- sample handling temperatures would be around 40° C.
- a pass-through or re-breathing system could be employed to collect the breath samples.
- a sample would be collected in a sterile, sealed bag made of an inert synthetic material fitted with a suitable valve. The valve would then be connected to the analyzer for sampling. This system sampling would be static in contrast to the dynamic sampling of stack gases.
- the gas mixture would be analyzed and then purged with zero gas. Multiple measurements would be possible in a short period of time from one sample of breath thereby allowing an internal check of the measured concentration of a target analyte.
- An analyte is a chemical species, either an atom, molecule, radical or ion, in a fluid which can be gaseous or liquid.
- a more elegant sampling could be provided by having the patient breathe directly into the analyzer which would be equipped with a low power pump to ensure adequate sample turnover rates and draw a zero gas through the system once measurements have been made.
- Human saliva contains a variety of compounds that as in the case of human breath, have a variety of applications for non-invasive diagnostics.
- Human blood of course, also has a well documented history of diagnostic value.
- the measurements of saliva, human blood or urine would also be made in a static mode.
- the sample being analyzed would be transferred to a disposable cell and inserted into a slot provided in the analyzer. In the case of blood analysis the sample would probably require an anaerobic handling. Once placed in the analyzer, the sample would be analyzed by the same steps previously described.
- FIG. 1(a) is a diagram of a stack analyzing system constructed according to the invention.
- FIG. 1(b) is a diagram of a probe assembly for use in the stack analyzing system.
- FIG. 2 is a diagrammatic view of the optical system for use in the liquid and gas analyzing system according to the invention.
- FIG. 3 is a flow chart illustrating processing of the sample data in the liquid and gas analyzer according to the invention.
- FIG. 3(a) is a graph of the absorbance spectrum of an analyte.
- FIG. 4 is a diagrammatic view of the system illustrating the modular construction and how an infrared (IR) analyzer module can be easily interfaced with the liquid and gas analyzing system according to the invention.
- IR infrared
- FIG. 5 is a diagram illustrating, in schematic form, the system of the invention modified for non-invasive gas analysis of industrial waste streams (e.g. gas stacks) with the liquid and gas analyzer according to the invention.
- industrial waste streams e.g. gas stacks
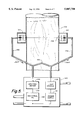
- FIG. 6 is a diagram of an embodiment of the system for use in the medical field for non-invasive human breath analysis.
- FIGS. 1 and 2 are diagrams illustrating one embodiment of the invention installed to measure the concentration of selected gases in a stack.
- FIGS. 1 and 2 are illustrative of the unique features of the invention that allow short coupled (i.e., less than about ten feet) extractive testing of gas streams in a stack and analysis in the system that is modular in construction.
- a gas stream 12, exhausting from stack 10 results from the combustion of fossil fuels to drive various processes, before being exhausted in the atmosphere.
- Stack 10 will be a conduit from which the gas stream 12 flows.
- the system shown is not limited to the analysis of a gas stream 12 in a stack 10, but can be used for extractive gas analysis to monitor ambient air quality, in-situ gas analysis employing fiber optics and extractive or in-situ liquid analysis for environmental monitoring. It is also applicable through long pass/remote sensing gas monitoring (e.g., for fence line monitoring and leak detection).
- the system is designed in a modular fashion to integrate into complementary multi-gas non-dispersive and/or dispersive infrared analyzers.
- Probe 14 illustrated in FIGS. 1a and 1b, is mounted in the wall of stack 10 for extracting a gas sample.
- Sampling probe 14 is comprised of a borosilicate glass liner 16 surrounded by an electrical heater 18 and protected by a "316" stainless steel sheath 20. Heater 18 maintains the temperature of liner 16 at approximately 250° C.
- Probe filter 22 is of a sintered quartz, 2 ⁇ m glass blown into the medium walled 1/2 inch tubing 24 that makes up the tip of probe 14 in stack 10 so that samples are filtered at the sampling point inside the probe housing rather than outside the stack as with usual probes.
- a stainless steel funnel 25 protects the tip of probe 14. The probe is manufactured so that borosilicate probe liner 16 can be easily replaced in the field.
- T-union 26 of a synthetic inert material in probe housing 28.
- Vertical connection 30 of T-union 26 is comprised of a short piece of inert material followed by a lined high temperature solenoid valve 32, linking the system to an automated gas calibration device (not shown).
- Outlet 34 of T-union 26 connects to a specially formed piece of flexible tubing 36 made of inert material. Flexible tubing 36 is formed in a spiral to minimize stress on the glass line 52 and is heated, insulated and temperature regulated to 250° C. and is connected to chamber 38 of analyzer 40.
- Analyzer 40 is designed to allow the system to be constructed in a modular fashion to integrate complementary components.
- the system is designed so that a complementary multi-gas non-dispersive infrared (NDIR) analyzer or other components can be easily integrated, as will be described in greater detail hereinafter.
- Chamber 42 allows the addition of integrated additional components.
- Heated flexible tubing 36 connects to borosilicate T-piece 44 via a synthetic inert union.
- the vertical portion of T-piece 44 connects through a suitable solenoid valve 46 to receive a source (not shown) of compressed air (blow back) to periodically clear probe filter 22 of particles. Compressed air is forced backwards through the system through probe 14 and filter 22 to clear probe filter 22.
- Outlet end 48 of T-piece 44 that is glass blown is connected to a unique all glass solenoid valve (ball and socket design with a metal plunger encapsulated in glass) such as Model No. G-170 manufactured by Glass Instruments, Inc. Solenoid valve 50 allows the analyzer to be isolated during blow back or if system failure occurs.
- Solenoid valve 50 is connected directly to sample cell 54 by a inert union 52 (1/2 inch glass tubing). Pump 58 draws sample from exit 60 through tubing 62 which is then exhausted through port 64. Electric heater 66 surrounds the entire sampling system, and is insulated. Several temperature sensors 67 (not shown) are fitted at strategic points (e.g., in each chamber 38, 42, 56) in the system to monitor and control temperature at 250° C. up to and including optical cell 54 and at 150° C. up to exhaust vent 64 from analyzer cabinet 40.
- the entire analyzer can either rest on floor 68 adjacent to stack 10 or can be mounted directly on the stack by a specially designed bracket (not shown) that bolts to standard size flanges.
- the entire analyzer is near the stack by probe 14 thereby eliminating the need for long sample lines which are costly, difficult to maintain and inevitably lead to sample loss/contamination.
- the sample line in the present system need not be any longer than about ten feet and will generally be no more than about three feet.
- the volume of the entire sampling and analyzing system is under one liter, thereby leading to very fast response times.
- the gas sample collected by probe 14 is not exposed to any metal surface at the point of sampling at filter 22 up to exhaust 60 from detector optical cell 54.
- the main contact of the entire sample received by probe 14 is borosilicate glass and/or quartz, a material that is inert to the gas in the mixture and possesses low adsorptive properties.
- Cabinet 70 contains a heater 72 for heating the system and an air conditioner to cool electronics such as computer 74 through tubing 76.
- the heater and air conditioner are connected directly to the cabinet for analyzer 40 and computer 74 respectively.
- Optical cell 54 consists of a single pass design using a one inch diameter fused silica (UV) windows 78 and 80.
- Fused silica windows 78 and 80 are glass blown onto cell body 82 which is made of quartz.
- the length of cell body 82 depends upon the sensitivity to the measured analyte, measured range and the nature of the interferents, but is typically around 20 inches and inlet/outlet tubes 52 and 60 (1/2 inch glass tubing) are at opposite ends (i.e., in a "Z" configuration).
- Parabolic mirrors 84 and 86 are employed to allow optical interface between the various components and beam collimation throughout optical cell 54.
- the system is designed and constructed to be rugged and insensitive to mechanical vibrations once aligned.
- a multi-pass cell could be used instead of the single-pass design making even longer optical path lengths readily accessible.
- Explanation of White Cell e.g., Infrared Analysis, Inc.
- Other types of multi-pass cells are also available commercially (e.g., Astigmatic cell by New Focus, Inc.)
- Parabolic mirrors 84 and 86 could be dispensed with altogether by using a "light tube” design.
- Entire optical cell 54 would be made of a fused silica (UV grade) and coated externally with magnesium fluoride and a reflective material (e.g., polished aluminum). The diameter and length of the reflective light tube design would depend upon the particular application.
- a radiation source 88 would be placed close to the entrance of optical cell 54 and a CCD (charge couple device) array spectrometer 90 directly at the opposite end, or exit of optical cell 54. No lenses or mirrors would be necessary. Varying the angle of radiation source 88 to optical cell 54 would change the number of reflections the light beam would make inside the cell, thereby changing the distance traveled by the beam.
- the effective optical path length of such an arrangement would be longer than the physical length of the cell, thereby raising the instrument sensitivity. This is because the UV absorption characteristics of a gas are directly related to path length as defined by the Beer-Lambert Law. Undesirable radiation would be filtered out with bandpass filters (not shown).
- Radiation source 88 is preferably a xenon flash lamp such as an EG&G 11C Series (FX1152) along with the supply trigger module and power supply.
- This lamp has a strong emission in the desired spectral range (180-300 nm) is very stable from pulse to pulse and has a long lifetime (typically 10 9 flashes).
- Another advantage of this source is that typical emission peaks from the excited xenon gas can be used to calibrate the detector and test optical resolution of the system.
- Source 88 is triggered directly from controlling software in computer 74, also controlling spectrometer 90 thereby synchronizing energy pulses from source 88 with measurements.
- Source 88 could be an alternative source such as a deuterium lamp, mercury lamp, mercury/argon lamp, tungsten halogen lamp, diode laser, helium-neon laser, etc. if desired.
- CCD array detector 90 is a miniature spectrometer such as an ocean optics S1000 miniature spectrometer having a dispersing element (holographic grating, 2400 lines per mm) equipped with a 25 micron ( ⁇ m) slit and a 1024 element array of Si CCD detectors.
- the measurement range employed is from 180 to 300 nm.
- One or more of miniature spectrometers 90 can be added on in a modular fashion to increase the measurement range without sacrificing optical resolution and/or to act as a reference channel. All 1024 coupled elements of detector array 90 receive their respective wavelengths of radiation effectively simultaneously so that time-related effects of the sample flowing through optical cell 54 will not introduce inaccuracies into the measurement.
- a detector array 90 from other manufacturers may be more suitable. For example, they may have a higher dynamic range, different detector element composition and could be substituted if desired.
- Cabinet 70 also includes programmable logic controller 92 (PLC) linked to computer system 74 that controls mechanical parts (e.g. pump 58 and solenoid valves 32, 46 and 50).
- Program logic controller 92 also controls the temperature of heated line 36, and the interior of instrument enclosure or cabinet 40.
- Air conditioner/heater 72 maintains the temperature inside cabinet 40 and instrument enclosures to within +/-1° C. and constantly circulates air.
- a filter (not shown) between heater and air conditioner 72 and lines 66 and 76 destroys any ozone generated by the source.
- Industrial personal computer 74 digitizes analog signals from miniature spectrometer detector array 90 and sends the required values to data acquisition system 94 through serial link 96 in cabinet 70.
- Data acquisition system 94 operates under custom data acquisition system software that is written to accommodate the requirements of the analyzer.
- the program is written to run in the environment of a personal computer.
- Equation (A) expresses mathematically how the custom data acquisition system software analyzes the data for analyte (A).
- S(M n ) the signal strength, in arbitrary units (e.g., electronic counts, volts, absorbance units, % transmission) of the nth measured point in the spectrum corresponding to an absorption peak of analyte A,
- S(R n ) the signal strength, in arbitrary units (e.g., electronic counts, volts, absorbance units, % transmission) of the nth reference point in the spectrum of analyte A,
- ⁇ n constant adjusting the nth signal ratio for baseline effects.
- Equation (A) A polynomial regression algorithm derived from experimental data according to Equation (A) is used to calibrate the instrument response to the concentration of analyte A to calculate the concentration of analyte A without modeling spectral interferents.
- the algorithm is derived from experimental data using Equation A shown above.
- the algorithm of the equation A is used to calculate a signal ratio for the particular analyte thus minimizing spectral interferences.
- a second algorithm is developed from known concentrations of an analyte that are plotted on a graph with the signal ratio as the x-axis and the concentration as the y-axis. Multiple signal ratios are calculated using four or more concentrations of the analyte.
- the graph is then used to derive an algorithm from a polynomial regression or other statistical method using points on the graph.
- the computer will now have a learned response for a range of concentrations of the analyte.
- a third algorithm is then developed by plotting the concentration of an interferent against the instrument response (signal ratio) for the desired analyte.
- the algorithm is derived from a polynomial regression or other statistical method and can be used to model for the interferent in the data processing software. This method can be used to compensate for one or more interferents as each interferent will have an associated experimentally derived algorithm.
- an array of algorithms is used to model the interaction of one or more interferents more precisely. For instance, analyte A is blended with interferent B at a specific concentration of A. The signal ratio of A is noted as a function of B and plotted. This will lead to an algorithm, derived through a polynomial regression or other statistical method, which is specific to a window of interaction of B with A. The procedure is repeated for a variety of concentrations of A with B. The procedure is repeated for a variety of concentrations of A and B until the measured range of A has been covered adequately (usually, five concentrations suffice). The process is repeated for other interferents.
- the library of algorithms mathematically describing the interferents of one or more species with the signal for analyte A is stored in the data processing software.
- Computer and DAS 94 have now been taught the algorithms to determine the concentration of an analyte, concentration of interference and the interaction of interference over a wide range providing a decision matrix for use to analyze liquids or gases having an unknown concentration of an analyte. While it is possible to perform these procedures with each analyzer, it is generally not necessary as the experimentally developed algorithm learned by the computer will not change for the analyte or interferents in question.
- a second experimentally derived polynomial regression algorithm is used to measure the concentration of one or more interferences to make up the corresponding adjustments to the previously calculated concentration of analyte A.
- a decision matrix uses the measured concentration of one or more interferents to select an appropriate polynomial regression algorithm derived experimentally to "fine tune" the missing concentration of analyte A.
- the acquired data can be further manipulated by applying corrections for sample dilution caused by oxygen and water vapor, statistical smoothing of the data can also be applied at this stage.
- the calibration approximations and mathematical manipulations of the computer program executed in PC 94 are illustrated in flow diagram of FIG. 3.
- the first step is the receipt of electronic count values of the wavelength's set characteristic of analyte A obtained from spectrometer 90 in a subroutine 100.
- Subroutine 102 uses the algorithm derived from Equation A to calculate a signal ratio for the analyte that minimizes spectral interference.
- Subsequently subroutine 104 calculates the concentration of analyte A from instrument response.
- the concentration spectral interference from corresponding instrument responses are then calculated in step or subroutine 106 which then proceeds to calculate the extent of interaction of spectral interferents on the concentration of analyte A (Subroutine 108).
- Subroutine or step 110 then subtracts the interference from the initial concentration of analyte A to provide a first approximation to interference-free analyzer.
- Subroutine or step 112 can be used to improve the modeling of an interference-free concentration of analyte A by performing a second approximation by using a decision matrix and a corresponding experimentally determined algorithm.
- the system through the sophisticated modeling described then provides an output 114 that is an extremely accurate measurement of low levels of the analyte which can be used in a environmental monitoring and process control.
- the algorithms referred to in the flow diagram of FIG. 3 are determined by measuring points on an absorbance spectrum visible on the display in computer 94 (i.e., PC in FIG. 1). For example the signal ratio of an analyte A can be calculated i.e., SR(A) in Equation (A)! from an absorption spectrum on the display received from the spectrometer as shown in FIG. 3(a) or from a corresponding transmission spectrum (inverted absorbance spectrum) using Equation (A).
- the spectrometer display can also be in the "scope mode" representing the UV source emission as well as other effects (e.g., differing detector performance in the array and optical effects such as reflections and absorption by the optical medium).
- R n and R n+1 represent two reference points selected for each M n .
- the spectrometer is calibrated for analyzer response as a function of concentration of analyte "A" both with a non-absorbing carrier (e.g. nitrogen) as well as in the presence of an interferent.
- the decision matrix is a matrix of calibration data determined experimentally, mathematically linking interferent concentrations with the concentrations of analyte "A”.
- the program automatically selects the appropriate algorithm previously derived, to be used from the first approximation of the concentration of analyte "A" (110 in FIG. 3) to refine the measurement.
- the analyzer determines via the first approximation of the concentration that the level of an analyte such as ammonia is around 5 ppm with an interferent concentration of sulfur(IV) oxide of 30 ppm.
- the program selects the closest interferent algorithm, previously derived as discussed above, for example, the algorithm for a concentration of 0-100 ppm of sulfur(IV) oxide at 6 ppm of ammonia.
- the program determines the extent of the interaction which it can now subtract from the concentration of ammonia to give "fine tuned" (i.e. very accurate) results, such as 4.8 ppm.
- Chamber 42 in analyzer cabinet 40 can be used, for example, to add an infrared (IR) analyzer module that can be easily interfaced with the above system, as shown in FIG. 4.
- IR infrared
- the exhaust of pump 58 will be fed through conduit 120 to heated multi-pass cell 122 (e.g., White Cell supplied by Infrared Analysis Inc. and/or Astigmatic cells available from New Focus Inc.) and then either connected to a miniature gas chromatographic instrument 124 by heated line 126 which will be described hereinafter, vented through port 128 to the atmosphere, or recirculated back to stack 10.
- heated multi-pass cell 122 e.g., White Cell supplied by Infrared Analysis Inc. and/or Astigmatic cells available from New Focus Inc.
- Source comprised of mirror 119 and light source 121 irradiates the sample in multi-pass cell 122 which is reflected by mirror 123 to optical filtration system 130 and detector 132 for analysis.
- the principle of operation of the IR system in chamber 42 of analyzer cabinet 40 as a component of the system consists of a multi-gas non-dispersive infrared (NDIR) analyzer such as that disclosed and described in U.S. Pat. No. 4,746,218 of Lord issued May 24, 1988 incorporated herein by reference.
- the source could also consist of a glowing ceramic element (from Oriel Corporation), a diode laser and/or a carbon dioxide laser.
- Gas filtration and detection system 130 and 132 could be replaced by a dispersive Fourier Transform (FT) spectrometer using a mercury cadmium teluride or indium antimonide detectors.
- FT dispersive Fourier Transform
- Other systems that could be used are a rotating diffraction grating mounted to a synchronized motor such as one (available from Reese Instruments Inc.) optically coupled to a detector of choice, a linear circular variable filter (available through Optical Coating Laboratories Inc.) mounted to a digitally controlled stepper motor and aligned with a detector of choice, a system employing photo acoustic spectroscopy or an opto-acoustic filtration system with an appropriate detector.
- a rotating diffraction grating mounted to a synchronized motor such as one (available from Reese Instruments Inc.) optically coupled to a detector of choice
- a linear circular variable filter available through Optical Coating Laboratories Inc.
- the heated gas stream from pump 58 can be fed to the heated multi-pass cell 122 as described previously, and then through heated line 126 to a miniature gas chromatographic (GC) instrument (available from Microsensor Technology, Inc.) can easily be linked into the system either instead of, or along with the IR capabilities described above.
- Gas chromatographic instrument 124 is connected in parallel with sample line 26 and is programmed to sample from the gas stream at regular intervals.
- the invention described herein is the only industrial continuous emission monitoring system that can operate well below 200 nm in the UV spectrum.
- the system operates in the spectral range between 180 and 300 nm; this extension of 20 nm from 200 to 180 nm compared with traditional analyzers, enables the spectroscopic access to a series of strong peaks characteristic of a variety of analytes such as NO and NH 3 .
- Fiber optics may be used if the analyte has appropriate absorption bands at wavelengths above 200 nm (e.g., SO 2 , COS, NO 2 and Cl 2 ).
- the mathematical treatment used here such as the analysis employed to calculate the signal ratio of an analyte and the decision matrix to refine interference compensation, substantially differ from those commonly used.
- Most UV based analyzers employ a deuterium source, whereas a special state of the art xenon source is used here.
- the system described above can also be easily converted into an ambient air quality analyzer to measure parts per billion (ppb) levels of a host of analytes (e.g., ozone, nitrogen (II) oxide, nitrogen (IV) oxide, benzene and toluene).
- the main modification would be in the sampling system which would not require heating to 250° C. Maintaining the gas sample at 10° C. above ambient would be sufficient.
- the optical cell design may preferably include a multi-pass arrangement (e.g., White Cell or Astigmatic cell) to generate sufficiently long path lengths for the required concentration ranges.
- the signals are processed and displayed in the data acquisition system in the fashion previously described.
- Data acquisition system 94 is a personal computer running under an environment such as a Windows operating system having a graphic display such as commercially available from Quinn-Curtis to plot concentrations of desired analytes versus time.
- the program logs data to a storage medium such as a hard disk or floppy disk and allows historical data to be readily accessed and displayed graphically on the screen.
- Non-invasive gas analysis of industrial streams is also possible using the technology described and discussed above.
- the system design is summarized in the schematic diagram of FIG. 5.
- a single or double pass configuration is feasible and depends upon stack diameter and the required instrument measurement range.
- a single strand fiber 136 is interfaced with light source 138 and mounted in cabinet 140 having a power supply 142, a CCD array spectrometer 144 and an industrial PC 146 are connected by cable 148.
- the end of fiber 136 is fitted with collimating lens 150 which is mounted to project a beam across stack 152 where it is collected by a suitable lens 154 and focused onto a second fiber 156 which is coupled to CCD array spectrometer 144.
- Referencing of the signal can be achieved by an additional fiber 155.
- a signal ratio can be obtained in real time employing spectrometer 144 and switching between reference fiber 155 and measurement fiber 150.
- a corrected signal ratio can be obtained in real time if the measurement fiber 138 is connected to a master spectrometer and reference fiber 155 connected to a slave spectrometer.
- the instrument disclosed and described is also capable of operating in an "emission mode" where one or more multiple flames (e.g., utility boilers) can be measured and monitored through emission spectroscopy.
- This method would employ a similar approach as in the "absorption mode” utilizing equation A and related algorithms.
- An important application of this technology would be for utilities to meet upcoming NO X control requirements as described in the publication "Wanted: Advance Instrumentation To Help Clean Air", Robert Iverson & Joseph Weiss, Intech April 1995, pages 79 through 83.
- the emission spectrum of a flame is characteristic of its temperature and therefore, can be used as a control system to adjust the air/field ratio at individual burners so that all operated at a fixed temperature.
- a system similar to that shown and described with respect to FIG. 5 would be used either with or without optical fibers.
- a flame or other emission e.g., hot flue gases
- Equation A and the associated algorithms would then be used to analyze the flame in a manner similar to that disclosed in U.S. Pat. No. 4,043,742 issued to Lord et al, May 17, 1976 incorporated herein by reference. This patent relates to the monitoring of radiation emissions (e.g., analysis of flames).
- the system disclosed and described hereinabove can also be easily adapted to measure low levels of analytes in solutions (either in the aqueous phase or dissolved in an alternate liquid medium not absorbing in the measurement range such as hexane).
- a filtered sample is channeled to analyzer 40 via inert materials and lined, commercially available, solenoid valves lined with inert material.
- Optical cell 54 is used as with sample gases, except a much shorter path length is now required.
- Heated pump 58 would be replaced with a peristaltic pump or other suitable alternative. In most cases, use of optical fibers is desirable. Signals from the system for processing a solution are processed and displayed in the data acquisition system as described hereinabove.
- the system illustrated in FIG. 5 could also be employed as a single-pass system with the exception of choice of particular fiber optic material probes that are exposed to the measured medium for in-situ liquid analysis for environmental monitoring. The signals would then be processed and displayed in the data acquisition system in the fashion described hereinabove.
- Long path/remote sensing gas monitoring e.g., fence line monitoring and leak detection
- a telescope and retro-reflective arrangement can be used to obtain satisfactory results.
- a breath analysis system could be provided to analyze the breath of people for diagnostic purposes.
- the breath of healthy human beings and animals normally contain approximately 60 to 80 volatile compounds produced by endogenous metabolic and catabolic reactions. Individual breath components yield valuable information regarding certain diseases and toxic end points that can be valuable diagnostic tools.
- Expired breath analysis are described in a number of areas in the literature. For example CO monitoring in premature infant breath infected with hyperbilirubinemia or hemolytic disease can be used as an index of bilorubin production. Statistics on measured data can help predict whether the neonate is likely to develop potentially dangerous jaundice or not.
- the system could also be used for non-invasive evaluation of the nutritional status and body composition in pediatric patients for monitoring exhaled 13 CO 2 , following bolus administration of NAH 13 CO 3 urea and 14 C and 13 C-analysis in exhaled breath, follow ingestion of suitably labeled compounds are commonly used to determine the presence of Heliobacteria in the stomach duodenum. This pathogen is implicated as a cause of recurrent duodenal ulcers.
- Current breath analysis techniques have severe restrictions; 14 C is radioactive and 13 C analysis requires a mass spectrometer.
- Patients with pneumonia, COBD exacerbation, cystic fibrosis, undergoing CABG, sclerosis and intravenous nitroglycerine and nitroprusside show uncharacteristic NO levels on their exhaled breath which can be measured with the system of the present invention.
- the system is also useful for non-invasive toxological assessment following chemical administration to laboratory animals.
- a breath analysis system is disclosed and described in the schematic diagram of FIG. 6. Sample handling temperatures around 40° C. would be desirable. Pass-through and re-breathing systems are commonly employed to collect breath samples.
- a sample can be collected in a sterile sealed bag made of a neurosynthetic material fitted with a suitable valve. The bag is filled with exhaled breath by the patient and the valve is then connected to inlet 165 of analyzer 40 for sampling.
- This system would use static sampling rather than dynamic sampling as described with the stack sampling system hereinabove. That is, the sample is collected and then the system is isolated by means of a miniature solenoid valve. The gas mixture is analyzed and purged with zero gas. Multiple measurements are possible in a short period of time for one sample of breath, therefore allowing an internal check of the measured concentration of the toxic analyte.
- the gas sample is then fed to the system through conduit 160 and solenoid value 162 to multi-pass cell 164 and exhausted through conduit 166, solenoid 168 and pump 170.
- Radiation source 172 is reflected off parabolic mirror 174 into multi-pass cell 164 and back out off parabolic mirrors 176 and 178 to CCD detector array 180 as before for processing by industrial PC 182.
- the signal out from industrial PC 182 at 184 is processed by the data acquisition system as before.
- a more elegant sampling method can have the patient breathing directly into inlet 165 of analyzer 40 through conduit 160 with pump 170 being a low power pump to ensure adequate sample turnover rates and to draw a zero gas through the system once measurements have been made.
- the described system is capable of measuring multiple components of a breath sample and a complementary IR module in chamber 186, as described hereinabove, is desirable in many applications to monitor analytes that do not have suitable UV absorption band (e.g., CO, 12 CO 2 and 13 CO 2 ). This may be useful in obtaining higher volume samples that could then be analyzed through astigmatic multi-pass cell at high path lengths and increase sensitivity.
- the system could also be adapted for analysis of human fluids such as saliva, human blood and urine with modifications.
- Human saliva contains a variety of compounds that as in the case of human breath, have a variety of applications for non-invasion diagnostics.
- human blood has a well-documented history of diagnostic value.
- the proposed system closely resembles the system disclosed in FIG. 5 with the exception that no sampling system is required, as all measurements are made in a static mode.
- a sample of human fluid such as saliva, blood or urine is transferred into a disposable cell and inserted into a provided slot in analyzer 40.
- the sample would require anaerobic handling.
- the cell is plugged between the source fiber optic 136 (FIG.
- stack 152 would simply be a housing having a slot for receiving the cell containing the sample.
- optical fibers could be dispersed with altogether and the light beam directed with reflective optics such as those shown in FIG. 2.
Abstract
Description
Claims (43)
Priority Applications (1)
| Application Number | Priority Date | Filing Date | Title |
|---|---|---|---|
| US08/434,527 US5807750A (en) | 1995-05-02 | 1995-05-02 | Optical substance analyzer and data processor |
Applications Claiming Priority (1)
| Application Number | Priority Date | Filing Date | Title |
|---|---|---|---|
| US08/434,527 US5807750A (en) | 1995-05-02 | 1995-05-02 | Optical substance analyzer and data processor |
Publications (1)
| Publication Number | Publication Date |
|---|---|
| US5807750A true US5807750A (en) | 1998-09-15 |
Family
ID=23724595
Family Applications (1)
| Application Number | Title | Priority Date | Filing Date |
|---|---|---|---|
| US08/434,527 Expired - Fee Related US5807750A (en) | 1995-05-02 | 1995-05-02 | Optical substance analyzer and data processor |
Country Status (1)
| Country | Link |
|---|---|
| US (1) | US5807750A (en) |
Cited By (53)
| Publication number | Priority date | Publication date | Assignee | Title |
|---|---|---|---|---|
| WO1999014556A1 (en) * | 1997-09-17 | 1999-03-25 | Alltech Associates, Inc. | Low temperature adaptor for evaporative light detection |
| US6044329A (en) * | 1997-06-19 | 2000-03-28 | Kware Software Systems Inc. | Laser gas analyzer and a method of operating the laser to reduce non-linearity errors |
| WO2000048051A1 (en) * | 1999-02-10 | 2000-08-17 | Schunk Kohlenstofftechnik Gmbh | Method of regulating a high temperature gaseous phase process and use of said method |
| US6150659A (en) * | 1998-04-10 | 2000-11-21 | General Monitors, Incorporated | Digital multi-frequency infrared flame detector |
| US6229605B1 (en) | 2000-03-10 | 2001-05-08 | Alltech Associates, Inc. | Evaporative light scattering device |
| US6248078B1 (en) | 1998-08-31 | 2001-06-19 | Johns Hopkins University | Volatile biomarkers for analysis of hepatic disorders |
| US6412333B2 (en) * | 1999-12-06 | 2002-07-02 | Horiba, Ltd. | Exhaust gas analyzing system |
| US6455851B1 (en) * | 2000-03-28 | 2002-09-24 | Air Instruments And Measurement, Inc. | Spectroscopic remote sensing exhaust emission monitoring system |
| US6486474B1 (en) | 1999-08-13 | 2002-11-26 | Regents Of The University Of Minnesota | Infrared spectrometer for the measurement of isotopic ratios |
| WO2003016899A2 (en) * | 2001-08-16 | 2003-02-27 | Spx Corporation | Method and system for detection of hydrocarbon species in a gas |
| US20030043373A1 (en) * | 2001-08-31 | 2003-03-06 | Respironics, Inc. | Microspectrometer gas analyzer |
| US6539285B1 (en) * | 2000-08-11 | 2003-03-25 | Bruker Optik Gmbh | Method and apparatus for process control using fourier transform infrared spectroscopy |
| US20030082821A1 (en) * | 2001-10-31 | 2003-05-01 | Lanier William Steven | Method and system for monitoring combustion source emissions |
| US6566892B2 (en) * | 2000-06-19 | 2003-05-20 | Siemens Vdo Automotive Corporation | Portable fuel analyzer for analyzing the alcohol content of a mixed fuel |
| US20040036027A1 (en) * | 2002-06-13 | 2004-02-26 | Keith Horton | Apparatus for measuring radiation and method of use |
| EP1398617A1 (en) * | 2002-09-13 | 2004-03-17 | Delphi Technologies, Inc. | Exhaust gas sensor |
| US20050019946A1 (en) * | 2001-12-21 | 2005-01-27 | Tuchman Donald P. | Systems and methods for automated quantitative analysis of digitized spectra |
| US20050084976A1 (en) * | 2003-10-20 | 2005-04-21 | Tom Baldwin | Filter for determination of mercury in exhaust gases |
| US20050117156A1 (en) * | 2002-02-06 | 2005-06-02 | Siepmann Fredrich W. | Method for analysing liquids, in addition to a device therefor |
| US20050287041A1 (en) * | 2003-01-15 | 2005-12-29 | Martin Hahs E G | Gas cell |
| US20060246592A1 (en) * | 2004-04-06 | 2006-11-02 | Arcadis G&M, Inc. | Identification of low vapor pressure toxic chemicals |
| US20070164221A1 (en) * | 2001-08-31 | 2007-07-19 | Russell James T | Microspectrometer gas analyzer |
| DE102006019723A1 (en) * | 2006-03-31 | 2007-10-04 | Alstom Technology Ltd. | Measuring sensor system for detecting exhaust gas parameter, has unit for attaching to exhaust duct of turbine and possesses probe pipe, where pipe has temperature measuring device that is provided for detecting exhaust temperature in duct |
| DE102006024248A1 (en) * | 2006-05-23 | 2007-11-29 | Fev Motorentechnik Gmbh | Method and device for measuring the pollutants in exhaust gases of internal combustion engines |
| US20080165363A1 (en) * | 2007-01-09 | 2008-07-10 | Alex Gusev | Flash photolysis system |
| US20080188002A1 (en) * | 2007-02-02 | 2008-08-07 | Junji Kato | Method and apparatus for removing selenium oxide in a sample, and method and apparatus for measuring mercury in coal combustion exhaust gas by using the same |
| US20090079977A1 (en) * | 2007-08-13 | 2009-03-26 | C8 Medisensors Inc. | Calibrated Analyte Concentration Measurements in Mixtures |
| US20090124918A1 (en) * | 2006-03-17 | 2009-05-14 | Freie Universitaetsmedizin Berlin, | Apparatus For Spectroscopically Analyzing A Gas |
| US20110095189A1 (en) * | 2009-10-26 | 2011-04-28 | Lall Ravinder P | Tactical chemical biological threat detection |
| WO2011067599A1 (en) | 2009-12-01 | 2011-06-09 | University Of Leicester | Apparatus for measuring pollutants and method of operating the same |
| EP2585810A1 (en) * | 2010-06-25 | 2013-05-01 | Siemens Aktiengesellschaft | Non-dispersive gas analyzer |
| US20130125624A1 (en) * | 2010-05-14 | 2013-05-23 | Uwe Gnauert | System and method for determining readings of gases and/or an aerosol for a machine |
| US8502152B1 (en) * | 2013-01-20 | 2013-08-06 | Atmosfir Optics Ltd. | Method for open path detection of air contaminants |
| US20150167972A1 (en) * | 2013-12-17 | 2015-06-18 | Schlumberger Technology Corporation | Real-time burner efficiency control and monitoring |
| US20150377850A1 (en) * | 2014-06-26 | 2015-12-31 | The United States Of America, Represented By The Secretary Of Commerce | Measurement of Total Reactive Nitrogen, NOy, together with NO2, NO, and O3 via Cavity Ring-down Spectroscopy |
| US20160011100A1 (en) * | 2014-07-10 | 2016-01-14 | Airbus Operations Limited | Fuel tank analysis |
| US9291550B1 (en) * | 2012-04-12 | 2016-03-22 | Nicholas Wing | Device and method for instantaneous drug testing in the field |
| WO2016054609A1 (en) * | 2014-10-02 | 2016-04-07 | Mks Technology (D/B/A Snowy Range Instruments) | Spectrometer |
| DE102015102289A1 (en) * | 2015-02-18 | 2016-08-18 | Endress + Hauser Conducta Gesellschaft für Mess- und Regeltechnik mbH + Co. KG | Device for taking samples from a process fluid flowing in a conduit |
| WO2017060853A1 (en) * | 2015-10-07 | 2017-04-13 | Duvas Technologies Limited | Systems for detecting gas and vapor species using a multi-pass absorption cell |
| IT201600093986A1 (en) * | 2016-09-19 | 2018-03-19 | Saipem Spa | SYSTEM AND METHOD OF ANALYSIS OF GASEOUS EFFLUENTS OF A UREA PLANT |
| US9933355B2 (en) | 2013-08-14 | 2018-04-03 | Duvas Technologies Limited | Multipass spectroscopic absorption cell |
| US20180217070A1 (en) * | 2015-07-21 | 2018-08-02 | Fluidsens International Inc. | Particles in liquid detection method and particles in liquid detection system and method to detect particles in the air |
| US10648901B2 (en) * | 2014-08-15 | 2020-05-12 | Tenova Goodfellow Inc. | System and method for analyzing dusty industrial off-gas chemistry |
| CN111609316A (en) * | 2020-05-27 | 2020-09-01 | 中国科学院上海天文台 | Small-sized full-automatic circulating drying gas filling system and operation method thereof |
| US10816468B2 (en) | 2017-05-26 | 2020-10-27 | Gennext Technologies, Inc. | Flash photo-oxidation device and higher order structural analysis |
| CN112295307A (en) * | 2020-11-16 | 2021-02-02 | 西安热工研究院有限公司 | Liquid processor and replacing system thereof |
| US10920982B2 (en) | 2015-09-28 | 2021-02-16 | Schlumberger Technology Corporation | Burner monitoring and control systems |
| CN113189126A (en) * | 2021-04-30 | 2021-07-30 | 河北南玻玻璃有限公司 | Method for detecting and analyzing tiny solid defects of float glass |
| CN113514533A (en) * | 2020-04-10 | 2021-10-19 | 中国石油化工股份有限公司 | Volatile dangerous chemical leakage detector |
| EP3974808A1 (en) * | 2020-09-25 | 2022-03-30 | MIRO Analytical AG | Gas analyser apparatus and method |
| US20220155216A1 (en) * | 2020-11-18 | 2022-05-19 | Kidde Technologies, Inc. | Clean gas curtain to prevent particle buildup during concentration measurement |
| WO2023063136A1 (en) * | 2021-10-12 | 2023-04-20 | 株式会社堀場製作所 | Gas analysis device, gas analysis method, and program for gas analysis device |
Citations (11)
| Publication number | Priority date | Publication date | Assignee | Title |
|---|---|---|---|---|
| US3819945A (en) * | 1971-07-01 | 1974-06-25 | Environmental Data Corp | Spectrometers |
| US4403861A (en) * | 1980-01-23 | 1983-09-13 | Commissariat A L'energie Atomique | Photometric analyzer for automatically studying complex solutions |
| JPS60205336A (en) * | 1984-03-30 | 1985-10-16 | Res Dev Corp Of Japan | System for removing and processing interference spectrum of mixed material in spectrochemical analyzing apparatus |
| US4664522A (en) * | 1984-08-24 | 1987-05-12 | Guided Wave, Inc. | Optical waveguide spectrum analyzer and method |
| US4746218A (en) * | 1984-06-12 | 1988-05-24 | Syconex Corporation | Gas detectors and gas analyzers utilizing spectral absorption |
| US4786171A (en) * | 1986-07-29 | 1988-11-22 | Guided Wave, Inc. | Spectral analysis apparatus and method |
| US4801805A (en) * | 1987-08-19 | 1989-01-31 | Ford Motor Company | Method of measuring multicomponent constituency of gas emission flow |
| US5070246A (en) * | 1989-09-22 | 1991-12-03 | Ada Technologies, Inc. | Spectrometer for measuring the concentration of components in a fluid stream and method for using same |
| US5184193A (en) * | 1989-01-04 | 1993-02-02 | Guided Wave | Dual fiber optic spectrophotometer |
| US5272345A (en) * | 1989-09-22 | 1993-12-21 | Ada Technologies, Inc. | Calibration method and apparatus for measuring the concentration of components in a fluid |
| EP0631137A2 (en) * | 1993-06-25 | 1994-12-28 | Edward W. Stark | Glucose related measurement method and apparatus |
-
1995
- 1995-05-02 US US08/434,527 patent/US5807750A/en not_active Expired - Fee Related
Patent Citations (11)
| Publication number | Priority date | Publication date | Assignee | Title |
|---|---|---|---|---|
| US3819945A (en) * | 1971-07-01 | 1974-06-25 | Environmental Data Corp | Spectrometers |
| US4403861A (en) * | 1980-01-23 | 1983-09-13 | Commissariat A L'energie Atomique | Photometric analyzer for automatically studying complex solutions |
| JPS60205336A (en) * | 1984-03-30 | 1985-10-16 | Res Dev Corp Of Japan | System for removing and processing interference spectrum of mixed material in spectrochemical analyzing apparatus |
| US4746218A (en) * | 1984-06-12 | 1988-05-24 | Syconex Corporation | Gas detectors and gas analyzers utilizing spectral absorption |
| US4664522A (en) * | 1984-08-24 | 1987-05-12 | Guided Wave, Inc. | Optical waveguide spectrum analyzer and method |
| US4786171A (en) * | 1986-07-29 | 1988-11-22 | Guided Wave, Inc. | Spectral analysis apparatus and method |
| US4801805A (en) * | 1987-08-19 | 1989-01-31 | Ford Motor Company | Method of measuring multicomponent constituency of gas emission flow |
| US5184193A (en) * | 1989-01-04 | 1993-02-02 | Guided Wave | Dual fiber optic spectrophotometer |
| US5070246A (en) * | 1989-09-22 | 1991-12-03 | Ada Technologies, Inc. | Spectrometer for measuring the concentration of components in a fluid stream and method for using same |
| US5272345A (en) * | 1989-09-22 | 1993-12-21 | Ada Technologies, Inc. | Calibration method and apparatus for measuring the concentration of components in a fluid |
| EP0631137A2 (en) * | 1993-06-25 | 1994-12-28 | Edward W. Stark | Glucose related measurement method and apparatus |
Non-Patent Citations (40)
| Title |
|---|
| A. Espinosa Mansilla et al. Analyst , 1994, 119, 1183 1188. * |
| A. Espinosa-Mansilla et al. Analyst, 1994, 119, 1183-1188. |
| D.A. Noe et al. Clin. Chem. 1984, 30, 627 630. * |
| D.A. Noe et al. Clin. Chem. 1984, 30, 627-630. |
| E. Bratz et al. Chem. Abstr. 1994, 121, 124103x. * |
| I. Duran Meras et al. Analyst 1993, 118, 807 813. * |
| I. Duran-Meras et al. Analyst 1993, 118, 807-813. |
| J. Workman Chem. Abstr. 1989, 111, 104586x. * |
| J.H. Cho et al. Anal. Chem. 1995, 67, 2858 2863. * |
| J.H. Cho et al. Anal. Chem. 1995, 67, 2858-2863. |
| K.J. Schlager et al. Chem. Abstr. 1994, 120, 181679t. * |
| L.A. Pyles et al. Proc. Soc. Exp. Biol. Med. 1993, 202, 407 419. * |
| L.A. Pyles et al. Proc. Soc. Exp. Biol. Med. 1993, 202, 407-419. |
| L.G. Weyer et al. Appl. Spectrosc. 1987, 41, 786 790. * |
| L.G. Weyer et al. Appl. Spectrosc. 1987, 41, 786-790. |
| M. Gerritsen et al. Chem. Abstr. 1992, 117, 225280a. * |
| M. Gerritsen et al. Chemomet. Intellig. Lab. Sys. 1992, 15, 171 184. * |
| M. Gerritsen et al. Chemomet. Intellig. Lab. Sys. 1992, 15, 171-184. |
| M. Otto Analyst 1990, 115, 685 688. * |
| M. Otto Analyst 1990, 115, 685-688. |
| M.C. Pascual Marti et al. Chem. Abstr. 1994, 120, 68513w. * |
| M.C. Pascual Marti et al. Fresenius J Anal. Chem. 1993, 347, 305 313. * |
| M.C. Pascual-Marti et al. Chem. Abstr. 1994, 120, 68513w. |
| M.C. Pascual-Marti et al. Fresenius J Anal. Chem. 1993, 347, 305-313. |
| M.T. Perlstein et al. Microchem. J. , 1976, 21, 485 495. * |
| M.T. Perlstein et al. Microchem. J., 1976, 21, 485-495. |
| R.A. Morton et al. Analyst 1946, 71, 348 356. * |
| R.A. Morton et al. Analyst 1946, 71, 348-356. |
| S. Foulk et al. Am. Lab. 1987, 19, 52 53. * |
| S. Foulk et al. Am. Lab. 1987, 19, 52-53. |
| S. Foulk et al. Chem. Abstr. 1988, 108, 87201m. * |
| S. Wold et al. Chem. Abstr. 1987, 106, 226419n. * |
| S. Wold et al. J. Chemometrics 1987, 1, 41 56. * |
| S. Wold et al. J. Chemometrics 1987, 1, 41-56. |
| S.J. Kahle et al. Chem. Abstr. 1993, 119, 55557t. * |
| S.J. Kahlei et al. Adv. Instrum. Control 1992, 47, 1287 1294. * |
| S.J. Kahlei et al. Adv. Instrum. Control 1992, 47, 1287-1294. |
| Translation of JP 60 205 336. * |
| Translation of JP 60-205 336. |
| V. Cerda et al. Chem. Abstr. 1993, 119, 261744e. * |
Cited By (93)
| Publication number | Priority date | Publication date | Assignee | Title |
|---|---|---|---|---|
| US6044329A (en) * | 1997-06-19 | 2000-03-28 | Kware Software Systems Inc. | Laser gas analyzer and a method of operating the laser to reduce non-linearity errors |
| US6362880B1 (en) * | 1997-09-17 | 2002-03-26 | Alltech Associates, Inc. | Low temperature adaptor for evaporative light detection |
| WO1999014556A1 (en) * | 1997-09-17 | 1999-03-25 | Alltech Associates, Inc. | Low temperature adaptor for evaporative light detection |
| US7006218B2 (en) * | 1997-09-17 | 2006-02-28 | Alltech Associates, Inc. | Low temperature adaptor for evaporative light detection |
| US6150659A (en) * | 1998-04-10 | 2000-11-21 | General Monitors, Incorporated | Digital multi-frequency infrared flame detector |
| US6248078B1 (en) | 1998-08-31 | 2001-06-19 | Johns Hopkins University | Volatile biomarkers for analysis of hepatic disorders |
| WO2000048051A1 (en) * | 1999-02-10 | 2000-08-17 | Schunk Kohlenstofftechnik Gmbh | Method of regulating a high temperature gaseous phase process and use of said method |
| AU764635B2 (en) * | 1999-02-10 | 2003-08-28 | Schunk Kohlenstofftechnik Gmbh | Method of regulating a high temperature gaseous phase process and use of said method |
| US6596340B1 (en) | 1999-02-10 | 2003-07-22 | Schunk Kohlenstofftechnik Gmbh | Method of regulating a high temperature gaseous phase process and use of said method |
| US6486474B1 (en) | 1999-08-13 | 2002-11-26 | Regents Of The University Of Minnesota | Infrared spectrometer for the measurement of isotopic ratios |
| US6412333B2 (en) * | 1999-12-06 | 2002-07-02 | Horiba, Ltd. | Exhaust gas analyzing system |
| US6229605B1 (en) | 2000-03-10 | 2001-05-08 | Alltech Associates, Inc. | Evaporative light scattering device |
| US6455851B1 (en) * | 2000-03-28 | 2002-09-24 | Air Instruments And Measurement, Inc. | Spectroscopic remote sensing exhaust emission monitoring system |
| US6566892B2 (en) * | 2000-06-19 | 2003-05-20 | Siemens Vdo Automotive Corporation | Portable fuel analyzer for analyzing the alcohol content of a mixed fuel |
| US6539285B1 (en) * | 2000-08-11 | 2003-03-25 | Bruker Optik Gmbh | Method and apparatus for process control using fourier transform infrared spectroscopy |
| US20030069703A1 (en) * | 2001-08-16 | 2003-04-10 | Spx Corporation | Method and system for detection of hydrocarbon species in a gas |
| US6789021B2 (en) | 2001-08-16 | 2004-09-07 | Spx Corporation | Method and system for detection of hydrocarbon species in a gas |
| WO2003016899A2 (en) * | 2001-08-16 | 2003-02-27 | Spx Corporation | Method and system for detection of hydrocarbon species in a gas |
| WO2003016899A3 (en) * | 2001-08-16 | 2003-09-18 | Spx Corp | Method and system for detection of hydrocarbon species in a gas |
| WO2003021211A1 (en) * | 2001-08-31 | 2003-03-13 | Respironics, Inc. | Microspectrometer gas analyzer |
| US20030043373A1 (en) * | 2001-08-31 | 2003-03-06 | Respironics, Inc. | Microspectrometer gas analyzer |
| US7605370B2 (en) | 2001-08-31 | 2009-10-20 | Ric Investments, Llc | Microspectrometer gas analyzer |
| US6791086B2 (en) | 2001-08-31 | 2004-09-14 | Respironics, Inc. | Microspectrometer gas analyzer |
| US20070164221A1 (en) * | 2001-08-31 | 2007-07-19 | Russell James T | Microspectrometer gas analyzer |
| US7157711B1 (en) | 2001-08-31 | 2007-01-02 | Ric Investments, Llc | Microspectrometer gas analyzer |
| US20030082821A1 (en) * | 2001-10-31 | 2003-05-01 | Lanier William Steven | Method and system for monitoring combustion source emissions |
| US7029920B2 (en) * | 2001-10-31 | 2006-04-18 | General Electric Company | Method and system for monitoring combustion source emissions |
| US20050019946A1 (en) * | 2001-12-21 | 2005-01-27 | Tuchman Donald P. | Systems and methods for automated quantitative analysis of digitized spectra |
| US7206701B2 (en) | 2001-12-21 | 2007-04-17 | United States Of America As Represented By The Secretary Of The Department Of Health And Human Services, Centers For Disease Control And Prevention | Systems and methods for automated quantitative analysis of digitized spectra |
| CN1643368B (en) * | 2002-02-06 | 2010-05-26 | 特里达因伊斯科公司 | Method and apparatus for analyzing liquids |
| US7330262B2 (en) * | 2002-02-06 | 2008-02-12 | Endress+Hauser Conducta Gesellschaft Fur Mess - Und Regeltechnik Mbh+Co. Kg | Methods and apparatus for determining the content materials of a liquid employing a piston movable within a measuring chamber |
| US20050117156A1 (en) * | 2002-02-06 | 2005-06-02 | Siepmann Fredrich W. | Method for analysing liquids, in addition to a device therefor |
| US7148488B2 (en) * | 2002-06-13 | 2006-12-12 | University Of Hawaii | Apparatus for measuring radiation and method of use |
| US20040036027A1 (en) * | 2002-06-13 | 2004-02-26 | Keith Horton | Apparatus for measuring radiation and method of use |
| EP1398617A1 (en) * | 2002-09-13 | 2004-03-17 | Delphi Technologies, Inc. | Exhaust gas sensor |
| US20050287041A1 (en) * | 2003-01-15 | 2005-12-29 | Martin Hahs E G | Gas cell |
| US7564558B2 (en) * | 2003-01-15 | 2009-07-21 | Senseair Ab | Gas cell |
| US7368289B2 (en) * | 2003-10-20 | 2008-05-06 | Perma Pure Llc | Filter for determination of mercury in exhaust gases |
| US20080131324A1 (en) * | 2003-10-20 | 2008-06-05 | Perma Pure Llc | Filter for determination of mercury in exhaust gases |
| US20050084976A1 (en) * | 2003-10-20 | 2005-04-21 | Tom Baldwin | Filter for determination of mercury in exhaust gases |
| US7888126B2 (en) | 2003-10-20 | 2011-02-15 | Perma Pure Llc | Filter for determination of mercury in exhaust gases |
| US20060246592A1 (en) * | 2004-04-06 | 2006-11-02 | Arcadis G&M, Inc. | Identification of low vapor pressure toxic chemicals |
| US20090124918A1 (en) * | 2006-03-17 | 2009-05-14 | Freie Universitaetsmedizin Berlin, | Apparatus For Spectroscopically Analyzing A Gas |
| DE102006019723A1 (en) * | 2006-03-31 | 2007-10-04 | Alstom Technology Ltd. | Measuring sensor system for detecting exhaust gas parameter, has unit for attaching to exhaust duct of turbine and possesses probe pipe, where pipe has temperature measuring device that is provided for detecting exhaust temperature in duct |
| US8205481B2 (en) | 2006-05-23 | 2012-06-26 | Fev Gmbh | Method and device for measuring the pollutants in exhaust gases of internal combustion engines |
| DE102006024248A1 (en) * | 2006-05-23 | 2007-11-29 | Fev Motorentechnik Gmbh | Method and device for measuring the pollutants in exhaust gases of internal combustion engines |
| DE102006024248B4 (en) * | 2006-05-23 | 2014-05-08 | Fev Gmbh | Device for measuring the pollutants in exhaust gases of internal combustion engines |
| US20080165363A1 (en) * | 2007-01-09 | 2008-07-10 | Alex Gusev | Flash photolysis system |
| US20080188002A1 (en) * | 2007-02-02 | 2008-08-07 | Junji Kato | Method and apparatus for removing selenium oxide in a sample, and method and apparatus for measuring mercury in coal combustion exhaust gas by using the same |
| US20090079977A1 (en) * | 2007-08-13 | 2009-03-26 | C8 Medisensors Inc. | Calibrated Analyte Concentration Measurements in Mixtures |
| US7961312B2 (en) * | 2007-08-13 | 2011-06-14 | C8 Medisensors Inc. | Calibrated analyte concentration measurements in mixtures |
| US8027033B2 (en) * | 2007-08-13 | 2011-09-27 | C8 Medisensors Inc. | Calibrated analyte concentration measurements in mixtures |
| US20110037977A1 (en) * | 2007-08-13 | 2011-02-17 | C8 Medisensors Inc. | Calibrated Analyte Concentration Measurements in Mixtures |
| US20110095189A1 (en) * | 2009-10-26 | 2011-04-28 | Lall Ravinder P | Tactical chemical biological threat detection |
| US8294102B2 (en) | 2009-10-26 | 2012-10-23 | Lall Ravinder P | Tactical chemical biological threat detection |
| WO2011067599A1 (en) | 2009-12-01 | 2011-06-09 | University Of Leicester | Apparatus for measuring pollutants and method of operating the same |
| US9228893B2 (en) | 2009-12-01 | 2016-01-05 | University Of Leicester | Apparatus for measuring pollutants and method of operating the same |
| US8695400B2 (en) * | 2010-05-14 | 2014-04-15 | Uwe Gnauert | System and method for determining readings of gases and/or an aerosol for a machine |
| US20130125624A1 (en) * | 2010-05-14 | 2013-05-23 | Uwe Gnauert | System and method for determining readings of gases and/or an aerosol for a machine |
| US9030666B2 (en) * | 2010-06-25 | 2015-05-12 | Siemens Aktiengeselschaft | Non-dispersive gas analyzer |
| US20130208280A1 (en) * | 2010-06-25 | 2013-08-15 | Siemens Aktiengesellschaft | Non-Dispersive Gas Analyzer |
| EP2585810A1 (en) * | 2010-06-25 | 2013-05-01 | Siemens Aktiengesellschaft | Non-dispersive gas analyzer |
| US9291550B1 (en) * | 2012-04-12 | 2016-03-22 | Nicholas Wing | Device and method for instantaneous drug testing in the field |
| US8502152B1 (en) * | 2013-01-20 | 2013-08-06 | Atmosfir Optics Ltd. | Method for open path detection of air contaminants |
| US9933355B2 (en) | 2013-08-14 | 2018-04-03 | Duvas Technologies Limited | Multipass spectroscopic absorption cell |
| US20150167972A1 (en) * | 2013-12-17 | 2015-06-18 | Schlumberger Technology Corporation | Real-time burner efficiency control and monitoring |
| US10041672B2 (en) * | 2013-12-17 | 2018-08-07 | Schlumberger Technology Corporation | Real-time burner efficiency control and monitoring |
| US9804138B2 (en) * | 2014-06-26 | 2017-10-31 | The United States Of America | Measurement of total reactive nitrogen, NOy, together with NO2, NO, and O3via cavity ring-down spectroscopy |
| US20150377850A1 (en) * | 2014-06-26 | 2015-12-31 | The United States Of America, Represented By The Secretary Of Commerce | Measurement of Total Reactive Nitrogen, NOy, together with NO2, NO, and O3 via Cavity Ring-down Spectroscopy |
| US20160011100A1 (en) * | 2014-07-10 | 2016-01-14 | Airbus Operations Limited | Fuel tank analysis |
| US10648901B2 (en) * | 2014-08-15 | 2020-05-12 | Tenova Goodfellow Inc. | System and method for analyzing dusty industrial off-gas chemistry |
| WO2016054609A1 (en) * | 2014-10-02 | 2016-04-07 | Mks Technology (D/B/A Snowy Range Instruments) | Spectrometer |
| US10072984B2 (en) | 2014-10-02 | 2018-09-11 | Mks Technology, Inc. | Spectrometer |
| DE102015102289A1 (en) * | 2015-02-18 | 2016-08-18 | Endress + Hauser Conducta Gesellschaft für Mess- und Regeltechnik mbH + Co. KG | Device for taking samples from a process fluid flowing in a conduit |
| US20180217070A1 (en) * | 2015-07-21 | 2018-08-02 | Fluidsens International Inc. | Particles in liquid detection method and particles in liquid detection system and method to detect particles in the air |
| US11119049B2 (en) * | 2015-07-21 | 2021-09-14 | Fluidsens International Inc. | Particles in liquid detection method and particles in liquid detection system and method to detect particles in the air |
| US10920982B2 (en) | 2015-09-28 | 2021-02-16 | Schlumberger Technology Corporation | Burner monitoring and control systems |
| WO2017060853A1 (en) * | 2015-10-07 | 2017-04-13 | Duvas Technologies Limited | Systems for detecting gas and vapor species using a multi-pass absorption cell |
| US10942111B2 (en) | 2015-10-07 | 2021-03-09 | Duvas Technologies Limited | Input and output optical systems for multipass spectroscopic absorption cells |
| US10935487B2 (en) | 2015-10-07 | 2021-03-02 | Duvas Technologies Limited | Input and output optical systems for multipass spectroscopic absorption cells |
| US11243168B2 (en) | 2016-09-19 | 2022-02-08 | Saipem S.P.A. | System and a method for analysis of vent gas of a urea plant |
| IT201600093986A1 (en) * | 2016-09-19 | 2018-03-19 | Saipem Spa | SYSTEM AND METHOD OF ANALYSIS OF GASEOUS EFFLUENTS OF A UREA PLANT |
| WO2018051313A1 (en) * | 2016-09-19 | 2018-03-22 | Saipem S.P.A. | A system and a method for analysis of vent gas of a urea plant |
| US10816468B2 (en) | 2017-05-26 | 2020-10-27 | Gennext Technologies, Inc. | Flash photo-oxidation device and higher order structural analysis |
| CN113514533A (en) * | 2020-04-10 | 2021-10-19 | 中国石油化工股份有限公司 | Volatile dangerous chemical leakage detector |
| CN111609316A (en) * | 2020-05-27 | 2020-09-01 | 中国科学院上海天文台 | Small-sized full-automatic circulating drying gas filling system and operation method thereof |
| EP3974808A1 (en) * | 2020-09-25 | 2022-03-30 | MIRO Analytical AG | Gas analyser apparatus and method |
| CN112295307A (en) * | 2020-11-16 | 2021-02-02 | 西安热工研究院有限公司 | Liquid processor and replacing system thereof |
| CN112295307B (en) * | 2020-11-16 | 2024-01-23 | 西安热工研究院有限公司 | Liquid processor and replacement system thereof |
| US20220155216A1 (en) * | 2020-11-18 | 2022-05-19 | Kidde Technologies, Inc. | Clean gas curtain to prevent particle buildup during concentration measurement |
| US11781969B2 (en) * | 2020-11-18 | 2023-10-10 | Kidde Technologies, Inc. | Clean gas curtain to prevent particle buildup during concentration measurement |
| CN113189126A (en) * | 2021-04-30 | 2021-07-30 | 河北南玻玻璃有限公司 | Method for detecting and analyzing tiny solid defects of float glass |
| WO2023063136A1 (en) * | 2021-10-12 | 2023-04-20 | 株式会社堀場製作所 | Gas analysis device, gas analysis method, and program for gas analysis device |
Similar Documents
| Publication | Publication Date | Title |
|---|---|---|
| US5807750A (en) | Optical substance analyzer and data processor | |
| US5770156A (en) | Gas detection and measurement system | |
| EP0480753B1 (en) | Optical analytical instrument and method | |
| US20220155273A1 (en) | Multi-component gas and vapor monitoring sensor | |
| JP4791625B2 (en) | Spectrophotometric / turbidimetric detection unit | |
| KR20080064817A (en) | Multigas monitoring and detection system | |
| EP1332346B1 (en) | Respiratory gas analyzer | |
| CN1302276C (en) | Gas identification device | |
| JP2003507703A (en) | Infrared spectrometer for measuring isotope ratios | |
| US11519855B2 (en) | Close-coupled analyser | |
| Wang et al. | Detection of nitrous acid by cavity ring-down spectroscopy | |
| US6512230B1 (en) | Method and an arrangement for initiating radiation absorption measurements of gaseous media | |
| KR19990087705A (en) | Multisample Simultaneous Analysis Method and Apparatus | |
| EP3049806B1 (en) | Method and system for gas concentration measurement of gas dissolved in liquids | |
| CN107305184A (en) | Laser detection system and method | |
| WO2004063708A2 (en) | Compensated infrared absorption sensor for carbon dioxide and other infrared absorbing gases | |
| US5818598A (en) | Nondispersive optical monitor for nitrogen-oxygen compounds | |
| TW201335581A (en) | Method and apparatus for siloxane measurements in a biogas | |
| WO1980001609A1 (en) | Gas measuring apparatus with standardization means,and method therefor | |
| CN114729877A (en) | Method and device for analyzing a gaseous sample | |
| WO1998052020A1 (en) | Self normalizing radiant energy monitor and apparatus for gain independent material quantity measurements | |
| Crawley | Application of non-dispersive infrared (NDIR) spectroscopy to the measurement of atmospheric trace gases | |
| Weinstock et al. | In situ stratospheric ozone measurements by long path uv absorption: developments and interpretation | |
| JPS6225239A (en) | Light transmission type measuring instrument | |
| EP4276444A1 (en) | Optical co2 concentration meter based on ir light absorption in gas |
Legal Events
| Date | Code | Title | Description |
|---|---|---|---|
| AS | Assignment |
Owner name: AIR INSTRUMENTS & MEASUREMENTS INC., CALIFORNIA Free format text: ASSIGNMENT OF ASSIGNORS INTEREST;ASSIGNORS:BAUM, MARC M.;LORD, HARRY C.;REEL/FRAME:007528/0413 Effective date: 19950601 |
|
| AS | Assignment |
Owner name: LORD, HARRY C., III, CALIFORNIA Free format text: ASSIGNMENT OF ASSIGNORS INTEREST;ASSIGNOR:AIR INSTRUMENTS AND MEASUREMENTS, INC.;REEL/FRAME:011571/0885 Effective date: 20010203 |
|
| REMI | Maintenance fee reminder mailed | ||
| FPAY | Fee payment |
Year of fee payment: 4 |
|
| SULP | Surcharge for late payment | ||
| AS | Assignment |
Owner name: NUNGARAY-SILVA, MARTHA, CALIFORNIA Free format text: ASSIGNMENT OF ASSIGNORS INTEREST;ASSIGNOR:LORD, HARRY C.;REEL/FRAME:014499/0674 Effective date: 20030714 Owner name: PADILLA, DAVID, CALIFORNIA Free format text: ASSIGNMENT OF ASSIGNORS INTEREST;ASSIGNOR:LORD, HARRY C.;REEL/FRAME:014499/0674 Effective date: 20030714 |
|
| REMI | Maintenance fee reminder mailed | ||
| LAPS | Lapse for failure to pay maintenance fees | ||
| STCH | Information on status: patent discontinuation |
Free format text: PATENT EXPIRED DUE TO NONPAYMENT OF MAINTENANCE FEES UNDER 37 CFR 1.362 |
|
| FP | Lapsed due to failure to pay maintenance fee |
Effective date: 20060915 |