US5696707A - Method of measuring the noise level in the presence of a signal - Google Patents
Method of measuring the noise level in the presence of a signal Download PDFInfo
- Publication number
- US5696707A US5696707A US08/419,999 US41999995A US5696707A US 5696707 A US5696707 A US 5696707A US 41999995 A US41999995 A US 41999995A US 5696707 A US5696707 A US 5696707A
- Authority
- US
- United States
- Prior art keywords
- signal
- wavelength
- noise level
- noise
- measuring
- Prior art date
- Legal status (The legal status is an assumption and is not a legal conclusion. Google has not performed a legal analysis and makes no representation as to the accuracy of the status listed.)
- Expired - Fee Related
Links
Images


Classifications
-
- H—ELECTRICITY
- H04—ELECTRIC COMMUNICATION TECHNIQUE
- H04B—TRANSMISSION
- H04B10/00—Transmission systems employing electromagnetic waves other than radio-waves, e.g. infrared, visible or ultraviolet light, or employing corpuscular radiation, e.g. quantum communication
- H04B10/07—Arrangements for monitoring or testing transmission systems; Arrangements for fault measurement of transmission systems
- H04B10/073—Arrangements for monitoring or testing transmission systems; Arrangements for fault measurement of transmission systems using an out-of-service signal
- H04B10/0731—Testing or characterisation of optical devices, e.g. amplifiers
-
- H—ELECTRICITY
- H01—ELECTRIC ELEMENTS
- H01S—DEVICES USING THE PROCESS OF LIGHT AMPLIFICATION BY STIMULATED EMISSION OF RADIATION [LASER] TO AMPLIFY OR GENERATE LIGHT; DEVICES USING STIMULATED EMISSION OF ELECTROMAGNETIC RADIATION IN WAVE RANGES OTHER THAN OPTICAL
- H01S3/00—Lasers, i.e. devices using stimulated emission of electromagnetic radiation in the infrared, visible or ultraviolet wave range
- H01S3/0014—Monitoring arrangements not otherwise provided for
-
- H—ELECTRICITY
- H04—ELECTRIC COMMUNICATION TECHNIQUE
- H04B—TRANSMISSION
- H04B10/00—Transmission systems employing electromagnetic waves other than radio-waves, e.g. infrared, visible or ultraviolet light, or employing corpuscular radiation, e.g. quantum communication
- H04B10/07—Arrangements for monitoring or testing transmission systems; Arrangements for fault measurement of transmission systems
-
- H—ELECTRICITY
- H04—ELECTRIC COMMUNICATION TECHNIQUE
- H04B—TRANSMISSION
- H04B10/00—Transmission systems employing electromagnetic waves other than radio-waves, e.g. infrared, visible or ultraviolet light, or employing corpuscular radiation, e.g. quantum communication
- H04B10/29—Repeaters
- H04B10/291—Repeaters in which processing or amplification is carried out without conversion of the main signal from optical form
- H04B10/2912—Repeaters in which processing or amplification is carried out without conversion of the main signal from optical form characterised by the medium used for amplification or processing
-
- H—ELECTRICITY
- H01—ELECTRIC ELEMENTS
- H01S—DEVICES USING THE PROCESS OF LIGHT AMPLIFICATION BY STIMULATED EMISSION OF RADIATION [LASER] TO AMPLIFY OR GENERATE LIGHT; DEVICES USING STIMULATED EMISSION OF ELECTROMAGNETIC RADIATION IN WAVE RANGES OTHER THAN OPTICAL
- H01S2301/00—Functional characteristics
- H01S2301/02—ASE (amplified spontaneous emission), noise; Reduction thereof
Definitions
- the invention relates to a method and apparatus for measuring the noise level in the presence of a signal.
- a method and apparatus is used, for example, in noise figure measurements of optical amplifiers.
- Optical amplifiers are used in optical telecommunications systems to provide compensation of losses incurred within the optical transmission network.
- a particularly advantageous type of optical amplifier is the erbium-doped fiber amplifier (EDFA).
- EDFA erbium-doped fiber amplifier
- Important parameters for characterizing an erbium-doped fiber amplifier and other optical amplifiers are gain and noise figure.
- the noise figure is important in comparing the performance of various amplifier designs and for system design. Noise generated in an erbium-doped fiber amplifier will degrade the signal-to-noise ratio at the optoelectronic receiver and thus increase the bit error rate of an optical communications system.
- One source of noise is incoherent radiation which is generated in the erbium-doped fiber amplifier, called amplified spontaneous emission.
- the noise level must be determined at the wavelength (or frequency) of an optical signal, in the presence of the signal. Both signal and noise are usually displayed on an optical spectrum analyzer as a plot of optical intensity versus wavelength. At the wavelength of the signal, the noise and the signal intensities are superimposed so that it is difficult to determine what the actual noise intensity at this wavelength is.
- a known method of solving the mentioned problem is to use interpolation. According to this method, the noise levels to the left and to the right of the signal (at a smaller and at a greater wavelength) are measured and the noise level at the signal wavelength is determined by interpolation. An improvement of this method is also known, i.e., taking several samples at various distances from the signal wavelength on each side of the signal wavelength and interpolating to the signal wavelength by spline approximation or polynomial fitting.
- the optical spectrum analyzer used in the characterization of an erbium-doped fiber amplifier is expected to display, in addition to the signal, amplified spontaneous emission (ASE) only.
- ASE amplified spontaneous emission
- the spontaneous emission of the source (SSE) is also amplified by the erbium-doped fiber amplifier and adds to the amplified spontaneous emission.
- One way of eliminating the spontaneous emission of the source is measuring it before the fiber amplifier is inserted, and subtracting (gain times spontaneous emission of the source) from the displayed spontaneous emission. This method is called "amplified spontaneous emission interpolation/subtraction".
- polarization extinction method Another alternative is the polarization extinction method. This method is based on the fact that the amplified spontaneous emission is completely unpolarized whereas the spontaneous emission of the source is either completely polarized or can be polarized using a polarizer. Then a polarization controller/filter is used to extinguish the polarized spontaneous emission of the source so that only the unpolarized amplified spontaneous emission passes (more precisely, one half of it).
- a problem with this method is that the polarization mode dispersion of the erbium-doped fiber amplifier reduces the amount of suppression of spontaneous emission of the source at wavelengths away from the signal wavelength. The larger the wavelength difference and/or the polarization mode dispersion, the less perfect the suppression. This leads to the--sometimes strong--wavelength dependence of the combined (ASE+ Gain times SSE)-signal (a dip at the signal wavelength) on the optical spectrum analyzer when using the polarization extinction method.
- the known methods of measuring the noise level suffer from limited accuracy, particularly because sometimes the noise level exhibits a strong curvature near the signal wavelength.
- the noise level may have a strong curvature near the signal wavelength as this is an inherent property of this technique. It is apparent that such a curvature makes it difficult to determine the actual noise intensity at the signal wavelength.
- the polarization extinction technique and some other methods for determining noise figure in optical amplifiers are described in D. Baney, C. Hentschel, J. Dupre: "Optical Fiber Amplifiers", Lightwave Symposium 1993.
- the signal wavelength is detuned, using, for example, a tunable laser source, thereby giving access to the true waveshape of the noise at the signal wavelength.
- the absolute noise level is likely to change as a consequence of detuning. However, this effect can be corrected by curve fitting between the original noise curve and the detuned noise curve.
- the noise levels are measured with an optical spectrum analyzer at a plurality of wavelengths before and after detuning and a difference function is derived therefrom describing the difference in noise levels before and after detuning. From the measurement of the noise level at the original signal wavelength and the interpolated value of the difference function at this wavelength, the true noise level is determined.
- Another advantage of the invention consists in the following: For amplifiers with large polarization mode dispersion, the classical polarization extinction method is not perfectly suited to determine the lowest point of the above mentioned dip displayed on the optical spectrum analyzer. With the method according to the invention, the dip is displayed well (the bottom of the dip represents the point where the spontaneous emission of the source is most strongly suppressed).
- FIG. 1 shows an embodiment of an apparatus for performing the invention.
- FIG. 2 shows two optical signal curves for illustrating the principle of the invention.
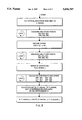
- FIG. 3 shows in block diagram form the steps undertaken in conducting a computer controlled automated noise level measurement.
- FIG. 1 shows an apparatus for measuring the noise level in an erbium-doped fiber amplifier 10.
- Controller 2 is a computer hardware/software subsystem, which under user operation, controls the noise level measurement system. Controller 2 includes standard computer system I/O keyboard and monitor, CPU, memory, and operating system software (not shown). Controller 2 also includes interface units (not shown) for coupling controller 2 to tunable laser source 14 over signal lines 3, to power meter 22 over signal lines 4, to amplifier test set 11 over signal lines 5, and to optical spectrum analyzer 13 over signal lines 6.
- An example of controller 2 is Hewlett-Packard Model No. HP 745i controller.
- An example of such interface units and signal lines 3, 4, 5 and 6 collectively is the HP-IB interface bus, a well known system interconnect for connecting electronic instruments to a computer hardware/software subsystem. Menu driven test system application software integrated into controller 2 allows the user to operate controller 2 using the I/O monitor and keyboard. The operation of controller 2 is described in more detail hereinafter.
- the amplifier 10 is connected via optical fibers 35 and 36 to an amplifier test set 11.
- the connection of the fibers 35 and 36 with the amplifier 10 on the one hand and the test set 11 on the other hand is accomplished by means of optical connectors 40, 41, 42, 43.
- the amplifier test set 11 is connected with an optical fiber 20 to the output of a tunable laser source 14.
- the tunable laser source 14 provides a coherent light beam the wavelength of which can be adjusted to desired value.
- An example of such a tunable laser source is the Hewlett-Packard Model No. HP 8168A Tunable Laser Source.
- the amplifier test set 11 comprises a first optical coupler 15 which directs a certain fraction of the laser light entering the test set 11 to a power meter 22.
- the branched off laser light is transmitted to the power meter 22 via an optical fiber 21.
- the test set 11 further comprises a second optical coupler 16 which directs a certain fraction of the laser light which has been transmitted through the first coupler 15 and then through the erbium-doped fiber amplifier 10 to an output terminal 23.
- the output terminal 23 is connected to a power meter.
- the power meter 22, for example, can be used for this purpose.
- An example of such a power meter is the Hewlett-Packard Model No. HP8153A Power Meter.
- the amplifier gain is determined. According to a practical example, about 1% of the optical intensity incident on the first coupler 15 and about 95% of the optical intensity incident on the second coupler 16 are branched off.
- the amplifier test set 11 further comprises a polarization controller/filter 12 which partly suppresses the signal and the spontaneous emission from the tunable laser source.
- the polarization controller/filter is supposed to suppress the spontaneous emission of the source. It will also suppress the signal, because the spontaneous emission of the source has the same state of polarization as the signal. However, the suppression of the signal is not strong enough to be able to measure directly at the signal wavelength.
- the optical output signal from the polarization controller/filter 12 is transmitted via an optical fiber 24 to an optical spectrum analyzer 13.
- the optical spectrum analyzer provides a display of light intensity versus wavelength (or frequency).
- the optical spectrum analyzer is a Hewlett-Packard Model No. HP 71450A Optical Spectrum Analyzer.
- the optical signal from the amplifier 10 can directly be transmitted to the optical spectrum analyzer 13.
- a switching means 17,18 is provided which allows a bypass of the polarization controller/filter 12 via an optical transmission line 19.
- FIG. 2 is a display of curves on the optical spectrum analyzer 13.
- the horizontal axis is the wavelength of the optical signal, and the vertical axis is the intensity.
- the upper curve 50 comprises a signal peak 51 at the wavelength ⁇ signal .
- the noise level at the wavelength ⁇ signal is to be determined.
- a first step of the invention several noise samples of the curve 50 at predefined wavelengths are measured. These noise samples are labelled with reference numerals 60a, 61a, 62a, 64a, 65a, 66a.
- the entire curve 50 with the signal peak 51 is detuned by a certain wavelength.
- the detuning is accomplished by changing the wavelength of the output signal of the tunable laser source 14 correspondingly. In a practical example, the signal is detuned by about 1-2 nanometers.
- the resulting curve on the optical spectrum analyzer 13 is the curve 52 with the signal peak 53. This curve is shifted relative to the original curve 50 with the signal peak 51 by a certain wavelength interval.
- the noise samples on the detuned curve 52 are measured at the same wavelengths as the noise samples of the original curve 50.
- the noise samples of the detuned curve are labelled with 60b, 61b, 62b, 64b, 65b, 66b.
- the noise sample 63 at the wavelength ⁇ signal of the original signal peak 51 is measured.
- the numerical value of the noise sample 63 will be denoted as N* ( ⁇ signal ).
- the difference function Delta ( ⁇ ) is determined.
- This difference function corresponds to the numerical difference between the noise samples taken at the original curve 50 and those taken at the detuned curve 52 at the same wavelengths, respectively, as a function of the wavelength.
- the value of the function Delta ( ⁇ ) is determined at the wavelength ⁇ signal of the original signal peak 51. This is done either by interpolation or by spline approximation or, according to a preferred embodiment, by polynomial fitting.
- the correct noise level N ( ⁇ signal ) at the wavelength ⁇ signal is determined by adding the value of the difference function at the wavelength a signal to the value of the noise sample 63:
- the above described process can be automated, i.e., the measurement of the noise samples at the original and at the detuned curve as well as the necessary calculations are performed automatically under the control of a computer hardware/software subsystem, such as controller 2 shown in FIG. 1.
- FIG. 3 a start-to-end block diagram flow chart is shown for the steps perfomed in the automated noise level measurement process. These steps include an interaction between the user operating the subsystem through the subsystem's I/O monitor and keyboard and the computer hardware/software interfacing with the various hardware elements shown in FIG. 1 to obtain the data shown in FIG. 2.
- a user desiring to perform the noise level measurement provides the initial "trigger" via the keyboard and the process then begins as shown by START in the FIG. 3, flow diagram.
- the process runs through the block diagram in FIG. 3 several times, each time with a different wavelength which is determined by the contents of a computer memory file which stores wavelegnth and step width information.
- tests results stored in the computer memory can be provided by normal computer subsystem operation for user display, e.g., via an I/O monitor or printer.
- Test result data files can be stored or communicated using standard computer/communication system methodology.
- the described method and apparatus ensures a much improved accuracy in comparison with the prior art methods based on interpolation.
- the improvement in accuracy depends on the amount of spontaneous emission of the source, on the polarization mode dispersion of the fiber amplifier, and on the degree of saturation. According to a practical example, improvements on the order of 0.1 to 0.2 dB are possible.
- the method and apparatus of the invention can also be used in conjunction with the amplified spontaneous emission (ASE) interpolation/subtraction method, because strong curvature of the wavelength dependence of the ASE is a typical problem caused by the physics of erbium-doped fiber amplifiers.
- ASE interpolation/subtraction does not need a polarization controller/filter.
- the method and apparatus of the invention is particularly suited for noise measurements in optical amplifiers, it is understood that it is not limited to this area, but that it can also be used in other applications wherein noise is to be measured in the presence of a signal.
Abstract
Description
N(λ.sub.signal)=Delta (λ.sub.signal)+N* (λ.sub.signal).
Claims (12)
Applications Claiming Priority (2)
| Application Number | Priority Date | Filing Date | Title |
|---|---|---|---|
| EP94105533 | 1994-04-11 | ||
| EP94105533A EP0678988B1 (en) | 1994-04-11 | 1994-04-11 | Method of measuring the noise level in the presence of a signal |
Publications (1)
| Publication Number | Publication Date |
|---|---|
| US5696707A true US5696707A (en) | 1997-12-09 |
Family
ID=8215848
Family Applications (1)
| Application Number | Title | Priority Date | Filing Date |
|---|---|---|---|
| US08/419,999 Expired - Fee Related US5696707A (en) | 1994-04-11 | 1995-04-10 | Method of measuring the noise level in the presence of a signal |
Country Status (4)
| Country | Link |
|---|---|
| US (1) | US5696707A (en) |
| EP (1) | EP0678988B1 (en) |
| JP (1) | JP3549942B2 (en) |
| DE (1) | DE69416396T2 (en) |
Cited By (27)
| Publication number | Priority date | Publication date | Assignee | Title |
|---|---|---|---|---|
| US5825521A (en) * | 1995-07-24 | 1998-10-20 | Lucent Technologies Inc. | Method of determining inter-symbol interference in transmission systems |
| US5969834A (en) * | 1997-09-03 | 1999-10-19 | Ditech Corporation | Method and apparatus for monitoring wavelength multiplexed optical signals |
| US6016213A (en) * | 1996-07-08 | 2000-01-18 | Ditech Corporation | Method and apparatus for optical amplifier gain and noise figure measurement |
| US6226117B1 (en) * | 1997-06-26 | 2001-05-01 | Hewlett-Packard Company | Noise figure measurement of optical amplifiers by power substitution |
| US20020195748A1 (en) * | 2000-08-29 | 2002-12-26 | Farnworth Warren M. | Layer thickness control for stereolithography utilizing variable liquid elevation and laser focal length |
| US6507420B1 (en) * | 1998-07-03 | 2003-01-14 | Telefonaktiebolaget Lm Ericsson (Publ) | Device and method for ascertaining noise power |
| US6538778B1 (en) * | 1998-04-21 | 2003-03-25 | Agilent Technologies, Inc. | Optical component tester |
| US6570894B2 (en) | 2001-01-30 | 2003-05-27 | Tektronix, Inc. | Real-time wavelength calibration for swept lasers |
| US6671429B2 (en) * | 2001-10-03 | 2003-12-30 | Dorsal Networks, Inc. | Balanced coupler for radiation sources |
| US6751012B1 (en) * | 2000-12-14 | 2004-06-15 | Tyco Telecommunications (Us) Inc. | Method and apparatus for measuring noise figure in optical amplifiers |
| US20040246568A1 (en) * | 2003-01-24 | 2004-12-09 | Fujitsu Limited | Optical amplifier having polarization mode dispersion compensation function |
| US20040254665A1 (en) * | 2003-06-10 | 2004-12-16 | Fink Jeffrey E. | Optimal dimensional and mechanical properties of laser sintered hardware by thermal analysis and parameter optimization |
| US20050068612A1 (en) * | 2003-09-30 | 2005-03-31 | Gordon Wilson | Pre-programmable optical filtering / amplifying method and apparatus |
| US6885499B1 (en) * | 1999-08-12 | 2005-04-26 | Fujitsu Limited | Optical amplifying apparatus for amplifying wide-wavelength-band light, optical sending apparatus, optical transmission system, and optical amplifying method |
| US6898001B2 (en) * | 2000-11-28 | 2005-05-24 | Ando Electric Co., Ltd. | Noise figure-measuring device and noise figure-measuring method |
| US20050175340A1 (en) * | 2003-12-23 | 2005-08-11 | Alcatel | Optical transmission network management process |
| US20060198634A1 (en) * | 2005-03-07 | 2006-09-07 | Nettest North America, Inc. | Passive optical network loss test apparatus and method of use thereof |
| US20060221436A1 (en) * | 2005-03-29 | 2006-10-05 | Andreas Benz | Method and system for suppressing ASE noise |
| US7187861B2 (en) * | 2003-10-15 | 2007-03-06 | Exfo Electro-Optical Engineering Inc. | Method and apparatus for testing optical networks |
| US20070065147A1 (en) * | 2005-09-22 | 2007-03-22 | Bti Photonic Systems Inc. | Arrangement, system, and method for accurate power measurements using an optical performance monitor (OPM) |
| US20100174392A1 (en) * | 2003-06-10 | 2010-07-08 | Fink Jeffrey E | Optimal dimensional and mechanical properties of laser sintered hardware by thermal analysis and parameter optimization |
| US20110110658A1 (en) * | 2009-11-10 | 2011-05-12 | Yokogawa Electric Corporation | Spectrum data correction system and spectrum data correction method |
| US8045861B1 (en) * | 2006-11-17 | 2011-10-25 | Hrl Laboratories, Llc | Method and system for spectral suppression of noise in a communication signal |
| US20120300290A1 (en) * | 2011-05-24 | 2012-11-29 | Sumitomo Electric Industries, Ltd. | Pulsed light source |
| US20140177037A1 (en) * | 2012-12-21 | 2014-06-26 | Balakrishnan Sridhar | Extended dynamic range optical amplifier |
| US9831948B2 (en) | 2015-09-22 | 2017-11-28 | Exfo Inc. | Optical power measurement in a passive optical network |
| US10270554B2 (en) | 2015-09-22 | 2019-04-23 | Exfo Inc. | Optical power measurement in a passive optical network |
Families Citing this family (3)
| Publication number | Priority date | Publication date | Assignee | Title |
|---|---|---|---|---|
| JP3216519B2 (en) * | 1996-03-27 | 2001-10-09 | 安藤電気株式会社 | Calibration method for optical fiber amplifier measurement device |
| US6069718A (en) * | 1997-09-19 | 2000-05-30 | Nortel Networks Corporation | Distortion penalty measurement procedure in optical systems using noise loading |
| JP5320011B2 (en) * | 2008-10-10 | 2013-10-23 | 日本電気通信システム株式会社 | Optical signal receiver, optical transmission device, and optical signal abnormality detection method |
Citations (16)
| Publication number | Priority date | Publication date | Assignee | Title |
|---|---|---|---|---|
| US5095281A (en) * | 1990-11-13 | 1992-03-10 | At&T Bell Laboratories | Method and apparatus for determining the absolute noise figure of optical amplifiers |
| US5138483A (en) * | 1989-10-30 | 1992-08-11 | Societa' Cavi Pirelli S.P.A. | Low-noise active fiber optical amplifier with pumping power reflector |
| JPH04370732A (en) * | 1991-06-20 | 1992-12-24 | Ando Electric Co Ltd | Optical pulse tester |
| JPH05133841A (en) * | 1991-11-15 | 1993-05-28 | Sumitomo Electric Ind Ltd | Measuring method and apparatus of noise index |
| EP0588662A1 (en) * | 1992-09-18 | 1994-03-23 | Leader Electronics Corp. | CN ratio measuring apparatus |
| US5340979A (en) * | 1992-09-25 | 1994-08-23 | Hewlett-Packard Company | Technique for determining the amplified spontaneous emission noise of an optical circuit in the presence of an optical signal |
| US5343286A (en) * | 1990-02-15 | 1994-08-30 | British Telecommunications Public Limited Company | OTDR having optically switched amplified output onto test fibre to suppress optical amplifier noise between OTDR pluses |
| US5363234A (en) * | 1993-10-14 | 1994-11-08 | Corning Incorporated | Amplifier having pump fiber filter |
| US5392153A (en) * | 1993-08-31 | 1995-02-21 | At&T Corp. | Optical amplifier |
| US5430572A (en) * | 1993-09-30 | 1995-07-04 | At&T Corp. | High power, high gain, low noise, two-stage optical amplifier |
| US5436759A (en) * | 1994-06-14 | 1995-07-25 | The Regents Of The University Of California | Cross-talk free, low-noise optical amplifier |
| US5471334A (en) * | 1992-10-21 | 1995-11-28 | Nippon Telegraph And Telephone Corporation | Method and apparatus for monitoring noise figure of optical amplifier |
| US5506723A (en) * | 1993-02-26 | 1996-04-09 | Alcatel N.V. | Multistage fiber-optic amplifier |
| US5521751A (en) * | 1994-02-14 | 1996-05-28 | Nippon Telegraph & Telephone Corporation | Noise measurement for optical amplifier and a system therefor |
| US5561551A (en) * | 1994-10-14 | 1996-10-01 | Ando Electric Co., Ltd. | Method and apparatus for determining noise factor of optical amplifier |
| US5574534A (en) * | 1994-10-24 | 1996-11-12 | Ando Electric Co., Ltd. | Apparatus for determining noise factor of optical amplifier |
-
1994
- 1994-04-11 DE DE69416396T patent/DE69416396T2/en not_active Expired - Fee Related
- 1994-04-11 EP EP94105533A patent/EP0678988B1/en not_active Expired - Lifetime
-
1995
- 1995-04-10 US US08/419,999 patent/US5696707A/en not_active Expired - Fee Related
- 1995-04-10 JP JP10908695A patent/JP3549942B2/en not_active Expired - Fee Related
Patent Citations (16)
| Publication number | Priority date | Publication date | Assignee | Title |
|---|---|---|---|---|
| US5138483A (en) * | 1989-10-30 | 1992-08-11 | Societa' Cavi Pirelli S.P.A. | Low-noise active fiber optical amplifier with pumping power reflector |
| US5343286A (en) * | 1990-02-15 | 1994-08-30 | British Telecommunications Public Limited Company | OTDR having optically switched amplified output onto test fibre to suppress optical amplifier noise between OTDR pluses |
| US5095281A (en) * | 1990-11-13 | 1992-03-10 | At&T Bell Laboratories | Method and apparatus for determining the absolute noise figure of optical amplifiers |
| JPH04370732A (en) * | 1991-06-20 | 1992-12-24 | Ando Electric Co Ltd | Optical pulse tester |
| JPH05133841A (en) * | 1991-11-15 | 1993-05-28 | Sumitomo Electric Ind Ltd | Measuring method and apparatus of noise index |
| EP0588662A1 (en) * | 1992-09-18 | 1994-03-23 | Leader Electronics Corp. | CN ratio measuring apparatus |
| US5340979A (en) * | 1992-09-25 | 1994-08-23 | Hewlett-Packard Company | Technique for determining the amplified spontaneous emission noise of an optical circuit in the presence of an optical signal |
| US5471334A (en) * | 1992-10-21 | 1995-11-28 | Nippon Telegraph And Telephone Corporation | Method and apparatus for monitoring noise figure of optical amplifier |
| US5506723A (en) * | 1993-02-26 | 1996-04-09 | Alcatel N.V. | Multistage fiber-optic amplifier |
| US5392153A (en) * | 1993-08-31 | 1995-02-21 | At&T Corp. | Optical amplifier |
| US5430572A (en) * | 1993-09-30 | 1995-07-04 | At&T Corp. | High power, high gain, low noise, two-stage optical amplifier |
| US5363234A (en) * | 1993-10-14 | 1994-11-08 | Corning Incorporated | Amplifier having pump fiber filter |
| US5521751A (en) * | 1994-02-14 | 1996-05-28 | Nippon Telegraph & Telephone Corporation | Noise measurement for optical amplifier and a system therefor |
| US5436759A (en) * | 1994-06-14 | 1995-07-25 | The Regents Of The University Of California | Cross-talk free, low-noise optical amplifier |
| US5561551A (en) * | 1994-10-14 | 1996-10-01 | Ando Electric Co., Ltd. | Method and apparatus for determining noise factor of optical amplifier |
| US5574534A (en) * | 1994-10-24 | 1996-11-12 | Ando Electric Co., Ltd. | Apparatus for determining noise factor of optical amplifier |
Non-Patent Citations (8)
| Title |
|---|
| IEEE Photonics Technology Letters, vol. 5, No. 12, Dec. 1993 New York US, pp. 1436 1438 H. Masuda et al Noise Figure Monitoring of a Cascaded In Line Erbium Doped Fiber Amplifier p. 1438, left column,last paragragh right column, parag. 1; figs. 1 4. * |
| IEEE Photonics Technology Letters, vol. 5, No. 12, Dec. 1993 New York US, pp. 1436-1438 H. Masuda et al `Noise Figure Monitoring of a Cascaded In-Line Erbium-Doped Fiber Amplifier` p. 1438, left column,last paragragh-right column, parag. 1; figs. 1-4. |
| Optical Fiber Amplifiers - Measurement of Gain and Noise Figure 1993 Lightwave Symposium - Hewlett-Packard Company 1993 Automatic Test System for Erbium Doped Fiber Amplifiers Hewlett Packard Company Brochure. |
| Optical Fiber Amplifiers Measurement of Gain and Noise Figure 1993 Lightwave Symposium Hewlett Packard Company 1993 Automatic Test System for Erbium Doped Fiber Amplifiers Hewlett Packard Company Brochure. * |
| Patent Abstracts of Japan vol. 17, No. 254 (P 1538) 19 May 1993 & JP A 04 370 732 (Ando Electric Co) *abstract. * |
| Patent Abstracts of Japan vol. 17, No. 254 (P-1538) 19 May 1993 & JP-A-04 370 732 (Ando Electric Co) *abstract. |
| Patent Abstracts of Japan vol. 17, No. 509 (P 1612) 13 Sep. 1993 & JP A 05 133 841 (Suitomo Electric Ind) *abstract. * |
| Patent Abstracts of Japan vol. 17, No. 509 (P-1612) 13 Sep. 1993 & JP-A-05 133 841 (Suitomo Electric Ind) *abstract. |
Cited By (40)
| Publication number | Priority date | Publication date | Assignee | Title |
|---|---|---|---|---|
| US5825521A (en) * | 1995-07-24 | 1998-10-20 | Lucent Technologies Inc. | Method of determining inter-symbol interference in transmission systems |
| US6016213A (en) * | 1996-07-08 | 2000-01-18 | Ditech Corporation | Method and apparatus for optical amplifier gain and noise figure measurement |
| US6226117B1 (en) * | 1997-06-26 | 2001-05-01 | Hewlett-Packard Company | Noise figure measurement of optical amplifiers by power substitution |
| US5969834A (en) * | 1997-09-03 | 1999-10-19 | Ditech Corporation | Method and apparatus for monitoring wavelength multiplexed optical signals |
| US6538778B1 (en) * | 1998-04-21 | 2003-03-25 | Agilent Technologies, Inc. | Optical component tester |
| US6507420B1 (en) * | 1998-07-03 | 2003-01-14 | Telefonaktiebolaget Lm Ericsson (Publ) | Device and method for ascertaining noise power |
| US6885499B1 (en) * | 1999-08-12 | 2005-04-26 | Fujitsu Limited | Optical amplifying apparatus for amplifying wide-wavelength-band light, optical sending apparatus, optical transmission system, and optical amplifying method |
| US20020195748A1 (en) * | 2000-08-29 | 2002-12-26 | Farnworth Warren M. | Layer thickness control for stereolithography utilizing variable liquid elevation and laser focal length |
| US6898001B2 (en) * | 2000-11-28 | 2005-05-24 | Ando Electric Co., Ltd. | Noise figure-measuring device and noise figure-measuring method |
| US6751012B1 (en) * | 2000-12-14 | 2004-06-15 | Tyco Telecommunications (Us) Inc. | Method and apparatus for measuring noise figure in optical amplifiers |
| US6570894B2 (en) | 2001-01-30 | 2003-05-27 | Tektronix, Inc. | Real-time wavelength calibration for swept lasers |
| US6671429B2 (en) * | 2001-10-03 | 2003-12-30 | Dorsal Networks, Inc. | Balanced coupler for radiation sources |
| US7268936B2 (en) * | 2003-01-24 | 2007-09-11 | Fujitsu Limited | Optical amplifier having polarization mode dispersion compensation function |
| US20040246568A1 (en) * | 2003-01-24 | 2004-12-09 | Fujitsu Limited | Optical amplifier having polarization mode dispersion compensation function |
| US20100174392A1 (en) * | 2003-06-10 | 2010-07-08 | Fink Jeffrey E | Optimal dimensional and mechanical properties of laser sintered hardware by thermal analysis and parameter optimization |
| US20040254665A1 (en) * | 2003-06-10 | 2004-12-16 | Fink Jeffrey E. | Optimal dimensional and mechanical properties of laser sintered hardware by thermal analysis and parameter optimization |
| US20090326706A1 (en) * | 2003-06-10 | 2009-12-31 | Fink Jeffrey E | Optimal dimensional and mechanical properties of laser sintered hardware by thermal analysis and parameter optimization |
| US20050068612A1 (en) * | 2003-09-30 | 2005-03-31 | Gordon Wilson | Pre-programmable optical filtering / amplifying method and apparatus |
| US9654213B2 (en) | 2003-10-15 | 2017-05-16 | Exfo Inc. | Method and apparatus for testing transmission lines normally propagating optical signals |
| US9287974B2 (en) | 2003-10-15 | 2016-03-15 | Exfo Inc. | Method and apparatus for testing transmission lines normally propagating optical signals |
| US7187861B2 (en) * | 2003-10-15 | 2007-03-06 | Exfo Electro-Optical Engineering Inc. | Method and apparatus for testing optical networks |
| US8861953B2 (en) | 2003-10-15 | 2014-10-14 | Exfo Inc. | Method and apparatus for testing transmission lines normally propagating optical signals |
| US7995915B2 (en) | 2003-10-15 | 2011-08-09 | Exfo Inc. | Method and apparatus for testing transmission lines normally propagating optical signals |
| US20050175340A1 (en) * | 2003-12-23 | 2005-08-11 | Alcatel | Optical transmission network management process |
| US7756418B2 (en) | 2005-03-07 | 2010-07-13 | Anritsu Instruments Company | Passive optical network loss test apparatus and method of use thereof |
| US20060198634A1 (en) * | 2005-03-07 | 2006-09-07 | Nettest North America, Inc. | Passive optical network loss test apparatus and method of use thereof |
| US7508577B2 (en) * | 2005-03-29 | 2009-03-24 | Alcatel-Lucent Usa Inc. | Method and system for suppressing ASE noise |
| US20060221436A1 (en) * | 2005-03-29 | 2006-10-05 | Andreas Benz | Method and system for suppressing ASE noise |
| US20070065147A1 (en) * | 2005-09-22 | 2007-03-22 | Bti Photonic Systems Inc. | Arrangement, system, and method for accurate power measurements using an optical performance monitor (OPM) |
| US7457032B2 (en) * | 2005-09-22 | 2008-11-25 | Bti Photonic Systems Inc. | Arrangement, system, and method for accurate power measurements using an optical performance monitor (OPM) |
| US8045861B1 (en) * | 2006-11-17 | 2011-10-25 | Hrl Laboratories, Llc | Method and system for spectral suppression of noise in a communication signal |
| US9074932B2 (en) * | 2009-11-10 | 2015-07-07 | Yokogawa Electric Corporation | Spectrum data correction system and spectrum data correction method |
| US20110110658A1 (en) * | 2009-11-10 | 2011-05-12 | Yokogawa Electric Corporation | Spectrum data correction system and spectrum data correction method |
| US9001416B2 (en) * | 2011-05-24 | 2015-04-07 | Megaopto Co., Ltd. | Pulsed light source |
| US20120300290A1 (en) * | 2011-05-24 | 2012-11-29 | Sumitomo Electric Industries, Ltd. | Pulsed light source |
| US20140177037A1 (en) * | 2012-12-21 | 2014-06-26 | Balakrishnan Sridhar | Extended dynamic range optical amplifier |
| US8873135B2 (en) * | 2012-12-21 | 2014-10-28 | Ciena Corporation | Extended dynamic range optical amplifier |
| US9831948B2 (en) | 2015-09-22 | 2017-11-28 | Exfo Inc. | Optical power measurement in a passive optical network |
| US10270554B2 (en) | 2015-09-22 | 2019-04-23 | Exfo Inc. | Optical power measurement in a passive optical network |
| US10574378B2 (en) | 2015-09-22 | 2020-02-25 | Exfo Inc. | Optical power measurement in a passive optical network |
Also Published As
| Publication number | Publication date |
|---|---|
| EP0678988A1 (en) | 1995-10-25 |
| DE69416396D1 (en) | 1999-03-18 |
| EP0678988B1 (en) | 1999-02-03 |
| JP3549942B2 (en) | 2004-08-04 |
| DE69416396T2 (en) | 1999-06-10 |
| JPH07301580A (en) | 1995-11-14 |
Similar Documents
| Publication | Publication Date | Title |
|---|---|---|
| US5696707A (en) | Method of measuring the noise level in the presence of a signal | |
| Baney et al. | Theory and measurement techniques for the noise figure of optical amplifiers | |
| CA2280020C (en) | Apparatus for measuring characteristics of an optical fibre | |
| CN101688819B (en) | Method and apparatus for determining differential group delay and polarization mode dispersion | |
| US7009691B2 (en) | System and method for removing the relative phase uncertainty in device characterizations performed with a polarimeter | |
| Wuilpart et al. | Measurement of the spatial distribution of birefringence in optical fibers | |
| US20120093501A1 (en) | In-Band Optical Noise Measurement Using Differential Polarization Response | |
| JP3467296B2 (en) | Method and apparatus for measuring amplified spontaneous emission noise | |
| US6067150A (en) | Remote measurement of wavelength dependent information about optical components | |
| US20110091206A1 (en) | In-band optical noise measurement using differential polarization response | |
| US6016213A (en) | Method and apparatus for optical amplifier gain and noise figure measurement | |
| JP2000039378A (en) | Optical loss measuring system, optical fiber coupler and method for measuring optical loss | |
| US5028131A (en) | Lightwave test set for an RF network analyzer system | |
| Fatome et al. | Measurement of nonlinear and chromatic dispersion parameters of optical fibers using modulation instability | |
| US6898001B2 (en) | Noise figure-measuring device and noise figure-measuring method | |
| US7012697B2 (en) | Heterodyne based optical spectrum analysis with controlled optical attenuation | |
| US6317214B1 (en) | Method and apparatus to determine a measurement of optical multiple path interference | |
| Rossaro et al. | Spatially resolved chromatic dispersion measurement by a bidirectional OTDR technique | |
| US5896221A (en) | Optical amplifying system having multiple branching units and method therefor | |
| US6728025B2 (en) | Semiconductor optical amplifier characteristic evaluation method and apparatus | |
| JP4164070B2 (en) | Method and apparatus for measuring polarization mode dispersion distribution in longitudinal direction of optical fiber | |
| JP3492781B2 (en) | Optical amplifier characteristic monitoring method and optical amplifier characteristic monitoring circuit | |
| Ackerman et al. | Characterizing residual reflections within semiconductor lasers, integrated sources, and coupling optics | |
| US6650406B1 (en) | Polarization dependent loss measurement in photonic devices | |
| JP2000216458A (en) | Amplification characteristic measuring device for optical fiber amplifier |
Legal Events
| Date | Code | Title | Description |
|---|---|---|---|
| AS | Assignment |
Owner name: HEWLETT-PACKARD COMPANY, CALIFORNIA Free format text: ASSIGNMENT BY OPERATION OF LAW;ASSIGNORS:HEWLETT-PACKARD GMBH;HENTSCHEL, CHRISTIAN;MUELLER, EMMERICH;AND OTHERS;REEL/FRAME:007493/0168;SIGNING DATES FROM 19950522 TO 19950524 |
|
| AS | Assignment |
Owner name: HEWLETT-PACKARD COMPANY, A DELAWARE CORPORATION, C Free format text: MERGER;ASSIGNOR:HEWLETT-PACKARD COMPANY, A CALIFORNIA CORPORATION;REEL/FRAME:010841/0649 Effective date: 19980520 |
|
| AS | Assignment |
Owner name: AGILENT TECHNOLOGIES INC, CALIFORNIA Free format text: ASSIGNMENT OF ASSIGNORS INTEREST;ASSIGNOR:HEWLETT-PACKARD COMPANY;REEL/FRAME:010977/0540 Effective date: 19991101 |
|
| FEPP | Fee payment procedure |
Free format text: PAYOR NUMBER ASSIGNED (ORIGINAL EVENT CODE: ASPN); ENTITY STATUS OF PATENT OWNER: LARGE ENTITY |
|
| FPAY | Fee payment |
Year of fee payment: 4 |
|
| REMI | Maintenance fee reminder mailed | ||
| LAPS | Lapse for failure to pay maintenance fees | ||
| STCH | Information on status: patent discontinuation |
Free format text: PATENT EXPIRED DUE TO NONPAYMENT OF MAINTENANCE FEES UNDER 37 CFR 1.362 |
|
| FP | Lapsed due to failure to pay maintenance fee |
Effective date: 20051209 |