US5627973A - Method and apparatus for facilitating evaluation of business opportunities for supplying goods and/or services to potential customers - Google Patents
Method and apparatus for facilitating evaluation of business opportunities for supplying goods and/or services to potential customers Download PDFInfo
- Publication number
- US5627973A US5627973A US08/209,471 US20947194A US5627973A US 5627973 A US5627973 A US 5627973A US 20947194 A US20947194 A US 20947194A US 5627973 A US5627973 A US 5627973A
- Authority
- US
- United States
- Prior art keywords
- forms
- value
- sub
- assigning
- practiced
- Prior art date
- Legal status (The legal status is an assumption and is not a legal conclusion. Google has not performed a legal analysis and makes no representation as to the accuracy of the status listed.)
- Expired - Fee Related
Links
Images


Classifications
-
- G—PHYSICS
- G06—COMPUTING; CALCULATING OR COUNTING
- G06Q—INFORMATION AND COMMUNICATION TECHNOLOGY [ICT] SPECIALLY ADAPTED FOR ADMINISTRATIVE, COMMERCIAL, FINANCIAL, MANAGERIAL OR SUPERVISORY PURPOSES; SYSTEMS OR METHODS SPECIALLY ADAPTED FOR ADMINISTRATIVE, COMMERCIAL, FINANCIAL, MANAGERIAL OR SUPERVISORY PURPOSES, NOT OTHERWISE PROVIDED FOR
- G06Q10/00—Administration; Management
-
- G—PHYSICS
- G06—COMPUTING; CALCULATING OR COUNTING
- G06Q—INFORMATION AND COMMUNICATION TECHNOLOGY [ICT] SPECIALLY ADAPTED FOR ADMINISTRATIVE, COMMERCIAL, FINANCIAL, MANAGERIAL OR SUPERVISORY PURPOSES; SYSTEMS OR METHODS SPECIALLY ADAPTED FOR ADMINISTRATIVE, COMMERCIAL, FINANCIAL, MANAGERIAL OR SUPERVISORY PURPOSES, NOT OTHERWISE PROVIDED FOR
- G06Q30/00—Commerce
- G06Q30/02—Marketing; Price estimation or determination; Fundraising
- G06Q30/0201—Market modelling; Market analysis; Collecting market data
- G06Q30/0203—Market surveys; Market polls
Definitions
- a method and apparatus which make the evaluation process much more objective.
- the first advantage is that it allows the vendor (user of the method and apparatus) to much more accurately determine the value of the business that can be obtained from a potential customer, while minimizing the possibility that money could be lost after a contract is signed with the customer due to ineffective evaluation.
- a method of evaluating business opportunities for supplying goods and/or services to potential customers comprises the following steps: (a) In a first computer, inputting a series of questions relating to the level of sophistication of a potential customer's predefined business techniques in a plurality of different categories. (b) Collecting responses to the series of questions from step (a) and inputting the responses into the first computer. (c) Assigning weights and values to the question responses so as to indicate a level of sophistication for each possible response of each business technique for each separate category. (d) Inputting the data from steps (b) and (c) into a second computer.
- step (e) Using the second computer, calculating, taking into account the weights and values, for each separate category a potential customer's score. And, (f) using a computer controlled printer, printing out on sheet material the calculations from step (d) in human readable form, and with sufficient detail so that an evaluation can be made of the potential customer's needs and the ability to fulfill those needs.
- steps (a) through (c) are practiced with at least three of forms design, forms control, forms procurement, forms warehousing and distribution, forms inventory management, and accounts payable, categories.
- steps (a) and (c) are practiced by grouping each category of questions by elements, sub-elements and points, and wherein some of the questions are limited to one choice while others include "choose all that apply”; assigning values at the point level when a response is limited to one choice, and assigning values to combinations of points when a response is "choose all that apply”; and assigning weights at the sub-element and element levels.
- a) In a first computer, inputting a series of questions relating to the level of sophistication of a potential customer's predefined business techniques in a plurality of different categories.
- (b) Collecting responses to the series of questions from step (a) and inputting the responses into the first computer.
- (c) Assigning numerical weights and values to the question responses so as to indicate a level of sophistication for each possible response of each business technique for search separate category.
- (d) Determining a user's score which reflects the user's capability of supplying goods and/or services to the potential customer related to the potential customer's predefined business techniques.
- step (e) Inputting the data from steps (b), (c) and (d) into a second computer.
- (f) Using the second computer, calculating or, taking into account the weights and values, providing for each separate category a potential customer's score, the user's score, and the area of opportunity which is the difference between the potential customer's score and the user's score.
- step (g) using a computer controlled printer, printing out in graphical form on sheet material the calculations of step (f).
- step (f) is also practiced to calculate the area of emerging technology, which is the difference between the user's score and an optimum score
- step (g) is further practiced to print out the area of emerging technology for each category.
- the goods and/or services supplied are paper and electronic business forms and related services
- the categories set forth above are typically utilized, and values are assigned at the point level when a response is limited to one choice, values are assigned to combinations of points when a response is "choose all that apply", and weights are assigned at the sub-element and element levels.
- the step of assigning weights at the element level is practiced by assigning a weight of about 30-40% for a forms control function element, about 15-25% for a forms file element, about 5-15% for a forms numbering element, about 15-25% for a forms catalog element, about 1-10% for a requisitions element, and about 5-15% for an obsolete item identification, resolution, and prevention element.
- the step of assigning weights at the sub-element level may be practiced by: Assigning for the forms control function sub-elements a weight of about 55-65% for a sub-element related to existing procedures for forms control activities, about 15-25% to a sub-element relating to assigned responsibilities for forms control functions, and about 15-25% for a sub-element related to a training program for forms control personnel. Assigning for the forms file element about 5-15% for a sub-element relating to if forms file exists, about 25-35% for a sub-element relating to which of specific elements are included in the forms file, and about 55-65% for a sub-element relating to updating of the forms file.
- Assigning for the forms numbering element about 55-65% for a sub-element relating to the existence of a forms numbering system, and about 35-45% for a sub-element relating to the responsibility for forms numbering.
- Assigning for the forms catalog element about 5-15% for a sub-element relating to the existence of a forms catalog, about 25-35% for a sub-element relating to the characteristics of forms listed in the forms catalog, about 15-25% for a sub-element relating to how the forms catalog is distributed, and about 35-45% for a sub-element relating to how often the forms catalog is updated.
- Assigning for the requisitions element about 40-60% for a sub-element relating to the number of line items per requisition, and about 40-60% for a sub-element relating to the maximum number of lines on the most commonly used requisition form or forms. And assigning for the obsolete item identification, resolution and prevention element a significant weight for a sub-element relating to tools for identifying and remedying obsolete forms.
- the step of assigning weights at the element level is practiced by assigning a weight of about 5-15% for a forms composition element, about 35-45% for a forms analysis element, about 20-30% for a business systems analysis element, and about 20-30% of a manufacturing capabilities and standard specifications element.
- the step of assigning weights at the element level is practiced by assigning a weight of about 50-70% for a procurement process element, about 30-40% for a reorder process element, and about 1-20% for an environmental policy element.
- the step of assigning weights at the element level is practiced by assigning a weight of about 30-40% for a warehouse facility characteristics element, about 30-40% for a requisition process element, about 10-20% for a distribution methods element, and about 10-20% for an inventory turns element.
- the step of assigning weights at the element level is practiced by assigning a weight of about 5-15% for a characteristics element, about 5-15% for an access element, about 1-25% for a system software security element, about 20-40% for a features element, about 5-15% for a customer service element, and about 20-40% for a reports element.
- the step of assigning weights at the element level is practiced by assigning a weight of about 45-65% for an accounts payable procedures element, and about 35-55% for an accounting procedures element.
- Step (g) may be practiced by printing a three-dimensional bar graph having differently shaded or colored areas for a potential customer's score and the user's score for each category and for each element within a category, each bar extending in a y-axis between zero and a maximum value, each bar identified by human readable indicia along an x-axis, and a numerical value corresponding to the graphical representation provided within at least some of the differently shaded or colored areas for at least some of the bars.
- Step (g) may also be practiced to print out analysis information in non-graphical human readable form along with the graphical material.
- the invention also relates to an apparatus for evaluating business opportunities for supplying goods and/or services to potential customers.
- the apparatus preferably comprises: A portable first computer means (e.g. a lap top) including a keyboard, mouse, pen, and/or roller ball, and a disc drive for inputting a series of questions relating to the level of sophistication of a potential customer's predefined business techniques in a plurality of different categories, and for inputting responses to the questions.
- a second computer means e.g.
- a PC including a keyboard and disc drive for inputting in machine readable form data from the first computer means, including the responses to the questions, assigned numerical weights and values, and data regarding the user's capability of supplying goods and/or services to the potential customer related to the potential customer's predefined business techniques
- the second computer means including means for calculating, taking into account the weights and values, for each separate category a potential customers, score, the user's score, and the area of opportunity which is the difference between the potential customer's score and the user's score.
- a computer controlled printer e.g. a laser printer controlled by the second computer means for printing out in human readable form on sheet material the calculations performed by the second computer means.
- Similar techniques can be utilized for implementing and reassessing the supply of goods and/or services after a contract for their supply is entered into by the vendor (user of the system).
- FIG. 1 is a schematic showing the basic inter-relationship between components and events according to the present invention
- FIG. 2 is a schematic showing of exemplary pieces of equipment that are utilized according to the present invention, and in the implementation of the method according to the invention;
- FIG. 3 is a high level flow sheet showing the inter-relationship between various processes and steps in the exemplary practice of a method according to the present invention
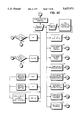
- FIGS. 4A-4R are high level flow sheets showing various exemplary routines and sub-routines for use with the field unit of the invention, for practicing field unit routines;
- FIGS. 5A-5E are schematics of exemplary computer screens utilizable to facilitate practice of various routines and sub-routines as illustrated by some of the flow sheets of FIGS. 4A-4R;
- FIGS. 6A-6AA are high level flow sheets showing various exemplary routines and sub-routines for use with the home unit of the invention, for practicing home unit routines;
- FIGS. 7A-7I are schematics of some exemplary computer screens utilizable to facilitate practice of various routines and sub-routines as illustrated by some of the flow sheets of FIGS. 6A-6AA;
- FIG. 8 is a schematic showing an exemplary graph of each of the categories, printed according to the present invention.
- FIGS. 9 through 14 are graphs similar to those of FIG. 8 for each of the categories showing the breakdown of elements within the category.
- FIG. 1 schematically represents the interaction between computing means that are utilized as part of the apparatus according to the invention, and for practicing the methods according to the present invention.
- a first computer 1 is utilized to collect responses to questions previously formulated in a data base 2 and inputted into a second computer 3, the computers 1, 3 communicating as indicated schematically by lines 4 by modem, and/or by capture onto a disc which is mailed or otherwise delivered.
- the formulated questions in the "create collection device" part of the second computer 3 may be processed and revised as necessary, while the responses collected in the first computer 1 are processed in the "process responses" part of the second computer 3.
- the printed output, as indicated at 5 in FIG. 1, is provided after the responses are processed.
- FIG. 2 is another schematic showing the same basic components of FIG. 1 only in a more diagrammatic form.
- the first computer 1 is shown as a lap top computer having a screen 6 and a keyboard 7, typically with a mouse 8, for inputting data which can be viewed on the screen 6.
- the second computer 3 is shown as a personal computer, having a main housing 9 with hard disc drive, etc., a monitor 10, a keyboard 11, and a mouse 12, the housing 9 including a disc drive opening 13 into which discs may be inserted.
- the computer 3 controls, through conventional cabling 14, a printer 5 which preferably comprises a laser printer.
- FIG. 3 schematically illustrates the dam processing system designed to improve the management of goods and service fulfillment capabilities and to implement and coordinate a goods and service account evaluation.
- the data processing system illustrated in FIG. 3 allows a quantitative evaluation of potential goods and/or services supply contracts to determine how worthwhile the contracts might be, and to assist in obtaining and pricing the contracts.
- the rectangular boxes in FIG. 3 indicate processing steps
- the hexagon indicates additional software packages which may be used for input to resolve specific problems
- the flattened circles are customer interaction boxes
- the rectangular boxes with curved bottoms indicate hard copy printout of data.
- FIG. 3 On the left of FIG. 3 is the initial customer assessment "module" in which an appropriate question set is created as indicated by 15. A potential customer is then interviewed as indicated at 16, the customer's responses to the questions being inputted into the lap top computer 1, and an answer set is created as indicated at 17. The answer set is transmitted to the second computer 3, and as indicated by box 18 in FIG. 3 the answer set is scored and processed.
- Printouts are provided, typically in two different forms.
- the printout 19 is a graphical printout and representation which provides information necessary for evaluation in very readily human readable form on a piece of sheet material, typically paper or transparencies. Other analysis--typically in word (narrative) form--is printed out as indicated at 20.
- the printouts from 19, 20 are presented to the potential customer as indicated at 21 and assuming the customer "buys in” at that stage, comprehensive operational analysis then is performed in another module located in the center in FIG. 3.
- the answer set is further processed as indicated at 22, and detailed discovery questions are printed out as indicated at 23.
- the customer is interviewed again as indicated at 24, a further answer set created as indicated at 25, and utilizing the data typically from other software packages, customer process information is inputted as indicated at 26, and the more detailed answer set then processed as indicated at 27.
- the results printed out at 28 include overheads, financials, answers, current/future operations, tables/graphs, implementation work sheets, measurement of various values, etc. All of this data is then again presented to the customer as indicated at 29, further processed at 30, and a detailed proposal 31 printed out.
- the detailed proposal 31 is presented or transmitted to the customer as indicated at 32. Assuming acceptance by the customer of the presented contract, the contract for the supply of goods and/or services may then be implemented.
- the implementation module Indicated on the right hand side of FIG. 3 is the implementation module. Ongoing evaluation takes place during performance of the contract, after initial implementation at 33, the ongoing measurement indicated at 34 being used to determine what operational changes are required in the customer's business, and suitable ongoing support is provided as indicated at 35. Utilizing all of the data from implementation, which includes re-evaluation of essentially the same questions originally propounded in the initial customer assessment, the supplier's (user's) ability to implement cost-saving solutions is evaluated.
- FIGS. 4A-4R are high level flow charts indicating how field units--such as the lap top computer 1--can be utilized to start the evaluation process, while FIGS. 5A through 5E show some of the "screens" that may appear on the computer screen/monitor 6 during practice of the invention.
- Operation of the first computer 1 in accordance with the method of the invention may be instituted by "clicking" on the main icon, and then subsequently clicking on in the group window, as is conventional in initiating computer 1 operation.
- "Windows" background software is utilized, and the screens of FIGS. 5A-5E are in "Windows" format, however other systems could also be utilized.
- FIG. 5A A first screen is illustrated in FIG. 5A having three basic groups "file”, “diskette”, and “help”, with the menu items for the "file” group indicated in FIG. 5A.
- Those menu items, indicated generally by reference numeral 37 in FIG. 5A are indicated by boxes 38-43 in FIG. 4A, with the detail described in other flow sheets as indicated by the letters with surrounding circles (e.g. FIG. 4B showing the "B" flow sheet which indicates the detailed procedures associated with box 38, etc.).
- the relationships associated with the main menu of FIGS. 4A and 5A have been generally earlier described.
- the question files were created and modified in the second computer 3 and are read-only in the field unit computer 1.
- the answer files are created in the field unit computer 1 and subsequently transmitted and then scored in the second computer 3.
- FIG. 5B shows exemplary screen that appears on the monitor 6 associated with the initial customer assessment which includes, in this particular situation, the various main categories.
- the vital statistics box 44 associated with the first selection item of the items 45 illustrated on the screen of FIG. 5B, is for demographic information about the customer being interviewed.
- the boxes 46-51 are for the main categories that will be evaluated for the supply of business forms and related services, including forms control category 46, forms design 47, procurement 48, warehousing and distribution 49, inventory management 50, and accounts payable 51.
- other categories can also be provided, as indicated by box 52 in FIG. 4C, depending upon the particular goods or services to be supplied, the particular customer, or other variables.
- notes can be taken in an automated way so that they can later be printed out. Notes can be entered in free form and printed in the same form as they are entered, and can be edited and/or deleted by the person utilizing the computer 1 at any time. The notes will not be included in the data that is transmitted by diskette or modem to the "home" computer 3 under most circumstances, but can be provided as additional data to help in making the assessment. After notes are entered the "notepad" will be automatically saved and the user can exit back to the prior windows.
- the vital statistics box 44 implementation as illustrated in FIGS. 4D-1 and 4D-2, and the way that the vital statistics screen may appear is illustrated in FIG. 5C.
- the individual elements thereof are self-explanatory.
- FIGS. 4E-1 through 4E-3 illustrates the elements from box 46, the forms control component.
- the "menu” or “cancel” buttons on the keyboard 7 are used to exit a component.
- decision element 54 different types of questions may be utilized, four different types of questions being indicated in FIG. 4A being preferred. There are two major types of questions, those asking one to "check all responses that apply”, and those requiring “pick one response” only. Within each type there are questions in which the first point must be answered in the affirmative before the remainder of the points are made available, and those where all points are available regardless of the response given to the first point, thus indicating all four types.
- type 1-type 4 questions may be defined as follows:
- Type 1 Display checkboxes for as many questions as are present. As a CheckBox is Clicked, UnCheck the other CheckBoxes for this Sub-Element.
- Type 2 Display Question ⁇ A ⁇ . If ⁇ A ⁇ is checked, ⁇ yes ⁇ , Display the rest of the questions for this Sub-Element. Only 1 of the remaining questions may be selected.
- Type 3 Display Checkboxes for as many questions as are present. Allow any or all of the CheckBoxes to be Checked.
- Type 4 Display Question ⁇ A ⁇ . If ⁇ A ⁇ is checked, ⁇ yes ⁇ , Display the rest of the questions for this Sub-Element. Any or all of the remaining questions maybe selected.
- FIG. 5D A typical screen that is utilized to provide the input of data during the implementation of the flow sheet of FIGS. 4E-1 through 4E-2 is illustrated in FIG. 5D.
- the question illustrated in FIG. 5D is of the type requiring a response at the "A" level before the questions "B-D" come up.
- Each question is answered by clicking on or off at the boxes to the left of each question letter--in the example indicated questions A, B, and D are answered “yes” while question C is answered "no".
- FIG. 4C the flow chart for implementing each of the different categories 47-52 is illustrated in FIG. 4E, only the particular questions associated with each category being different.
- FIG. 4F indicates implementation of the "new" menu selection item from FIG. 4B. This is also indicated by box 39 in FIG. 4A, and relates to the second menu item 37 in FIG. 5A.
- FIG. 4G illustrates the flow chart associated with the box 40 in FIG. 4A, and the third menu item 37 in FIG. 5A.
- FIG. 4H illustrates the flow chart associated with box 41 in FIG. 4A, and the fourth menu item 37 in FIG. 5A.
- FIGS. 41-1 and 41-2 indicates the flow chart associated with the box 42 in FIG. 4A, and the fifth menu item 37 in FIG. 5A.
- FIG. 4J indicates the flow chart associated with the box 43 in FIG. 4A and the last menu item 37 in FIG. 5A.
- FIG. 5A If the "diskette" group is selected, by highlighting and clicking on it when displayed as indicated in FIG. 5A, the boxes indicated at 55-58 in FIG. 4A will come up.
- the flow sheet associated with box 55 is shown in FIG. 4K
- the flow sheet associated with box 56 is shown in FIGS. 4L and 4M
- the flow chart associated with box 57 is illustrated in FIG. 4N
- the flow chart associated with box 58 is illustrated in FIGS. 4O and 4P-1 through 4R-3.
- FIGS. 4L and 4M an exemplary screen that may be associated therewith is illustrated in FIG. 5E, indicating questions and sub-elements, within an element, and within a category (in this case the forms control category).
- the final option available from the main screen of FIG. 5A associated with the "Help" group thereof is illustrated by boxes 59 and 60 in FIG. 4A.
- the flow sheet associated with the box 59 is illustrated in FIG. 4Q, while that associated with box 60 is illustrated in 4R.
- a preferred detailed question set comprising approximately 300 questions, with weights and values assigned for practical inquiry into each of the categories 46 through 51 illustrated in FIG. 4C, is as follows.
- the weight can vary about ten percentage points either way (e.g. 4-5% points either way, such as from 30-40% for a weight designated "35").
- FIG. 6A schematically shows a sign on procedure for the "home” computer 3.
- FIG. 7A shows the first screen that appears on the computer 3 once the sign on procedure of FIG. 6A has been completed, having four basic groups “File”, “Edit”, “Process”, and “Help”.
- FIG. 7A the "File” menu items are displayed, along with "Exit”.
- the menu items 61-63 from FIG. 7A are seen in FIG. 6B.
- the detailed descriptions of the flow sheets as indicated by the letters with surrounding circles are shown in subsequent FIGURES. That is the detailed flow sheet associated with the first menu item "Open Question Set" is illustrated in FIG. 6C-1 and 6C-2, the detailed flow sheet associated with the second menu item 62 is shown in FIG. 6D, and the detailed flow sheet associated with the third menu item 63 is illustrated in FIG. 6E, while the "Exit" flow sheet is illustrated in FIG. 6F.
- FIG. 7B is a schematic illustration of the screen 10 of the "home" computer 3 when menu item 61 is selected.
- FIG. 7C is a schematic of the screen when the "Maintain Questions" function 64 from the screen of FIG. 7B is selected.
- the question file is viewed, edited, or added to by scrolling through the four levels of questions within the question set, namely category, element, sub-element, and point. At each level one may add or edit entries. Typically there are up to 99 elements for each category, up to 99 sub-elements for each element, and up to ten points for each sub-element.
- the detailed flow sheet for element 64 "Maintain Questions" is shown in FIG. 6Y-1 through 6Y-5.
- the "Edit Dependents" selection option 65 on the screen of FIG. 7B is shown schematically in FIG. 6C, and the flow sheet therefor is shown in detail in FIG. 6Z-1 and 6Z-2.
- An exemplary screen for the option 65 is shown in FIG. 7D.
- the selection option 66 in FIG. 7B is shown schematically in FIG. 6C and a flow sheet therefor is shown in detail in FIG. 6D.
- FIG. 6E The detailed flow sheet for the "Print Question Set” selection element 63 of FIGS. 7A and 6B is shown in FIG. 6E.
- FIG. 6F The exit flow sheet for the exit selection element 67 from FIGS. 7A and 6B is shown in FIG. 6F.
- FIG. 6G-1 and 6G-2 The detailed flow sheet for option 69, "Edit Associated Tables", is shown in FIG. 6G-1 and 6G-2.
- FIGS. 6H-1 through 6L-3 Detailed flow sheets relating to individual components thereof are shown in FIGS. 6H-1 through 6L-3, and an exemplary screen corresponding to FIG. 6H is shown in FIG. 7G.
- An exemplary screen for the "Matrix Values" element 76 of FIG. 6G (the detailed flow sheet of which is shown in FIG. 6I) is illustrated in FIG. 7H.
- the "Validate" element 75 from FIG. 6G is not shown by a detailed flow sheet, but rather a selection of the validate button will validate the components, elements, sub-elements, and points.
- the validate process verifies that the component and element weights sum to 100%, and that sub-elements of "Type" "2" or "4" have at least two points.
- An exemplary routine to validate the value set for the standard question set is as follows:
- the routine to validate bullet points for the ICA document for the home unit 3 may be as follows:
- the "Edit Help Associations" selection option 70 is shown by the detailed flow sheet of FIG. 6M.
- the "Edit File Maintenance” selection option 71 is shown by the detailed flow sheet of FIG. 6N, and FIG. 6O.
- a screen for the edit control file selection option 72 is shown in FIG. 7I, and the detailed flow sheet therefor is shown in FIG. 6P.
- the "Edit Salesperson Disabled” selection option 73 is shown in FIG. 6Q, while the "Edit User Security” selection option 74 is shown by the detailed flow sheet of FIG. 6R-1 and 6R-2.
- the "Process Answer Set” selection option 77 from FIG. 6B relates to the "Process” selection option 77' of the screen of FIG. 7A.
- the screen that comes up when the option 77' is selected is shown, as one possible example, in FIG. 7F.
- the "Process Answer Set” selection option 77 flow sheet is shown in FIG. 6S.
- the selection option 77 is selected, the answer set will have been scored by the time this process takes place. The customer score for each sub-element is compared against the low value, high value, and high rating triggers for that sub-element.
- the bullet point (WORD [software package] document) associated with that low value trigger is printed on the ICA document under the opportunities section. If the customer's sub-element score is >than the current situation value trigger, the bullet point (WORD document) associated with that high value trigger is printed on the ICA document under the current situation section. If the sub-element score is >than the high rating trigger, the bullet point (WORD document) associated with that high rating trigger is printed on the ICA document under the opportunity section.
- the component definition WORD document is unique for each component and printed on the ICA document for that component.
- the default current situation WORD document is unique for each component and printed within the current situation portion of the ICA document if no scores are greater than the current situation trigger value.
- the default opportunity WORD document is unique for each component and printed within the opportunities portion of the ICA document if no scores are less than or equal to the opportunity trigger value.
- Page breaks with cover page and introduction, are also preferably provided.
- graphical data is printed out based upon the scoring and processing that is performed in the computer 3.
- data is inputted into the computer 3 that relates to the user's (vendor's) capability of supplying goods and/or services to the potential customer related to the potential customer's predefined business techniques.
- Numerical weights and values are assigned thereto to provide a level of sophistication for each separate category compared to an optimum for the category, or merely using the vendor's capabilities as the top indicator of the category.
- An exemplary calculation from this analysis performed by the computer 3 is illustrated in FIG. 8 for the categories of boxes 46-51 of FIG. 4C.
- Each of the graphs 81 is in the form of a rectangular parallelepiped having three dimensions, and preferably the customer score--as indicated at 82--is printed in a numerical value right on the rectangular parallelepiped graph. Also, the names of each of the categories are printed on the y-axis, as indicated generally by reference numeral 83, and a key is also printed below the categories, as indicated at 84. Numerical values could also be printed for the area of opportunity and emerging technology areas of each graph 81 if desired.
- FIGS. 9 through 14 are graphical representations printed on sheets of paper 85 through 90 showing an exemplary breakdown of each of the elements within each of the categories illustrated in FIG. 8.
- the name of the element is plotted along the x-axis, with the customer's score, area of opportunity, and (except for the warehousing/distribution element of FIG. 12) emerging technologies scores plotted along the y-axis.
- the category is printed as well as the average score for the category, as indicated, for example, at 91 in FIG. 9.
- additional information is printed out after the analysis of the answers to the questions from the customer, made by computer 3.
- tabular or plain narrative information may be printed out describing what is meant by the various graphical representations, providing more detailed information about each of the categories or elements, and estimating a percentage of savings that can be achieved if the customer implements the user's/vendor's program (purchasing goods and/or services). For example one manner that this can be presented on a separate sheet is as follows:
- the printed report could include a cover page, introduction, statements for each component, graphs, customer's current situation and areas of opportunity in a descriptive (narrative) format, etc.
- trigger points can also be utilized where desired.
- a "trigger” value may be assigned to each question and presented by separate category. For example each sub-element can be assigned a maximum of three trigger points, current situation, opportunity trigger, and a "great job” trigger. A sub-element can be skipped and no trigger points assigned where desired. If a trigger point is assigned, a corresponding statement is defined in a "WORD for Windows"TM document associated with the computer 3, as described with respect to the "Process Answer Set" selection 77, 77', above. During processing the value assigned to the responses selected by the customer are compared to the trigger values, and the appropriate statements are located in the proper place on the document.
- the comprehensive operational analysis and implementation modules as illustrated in FIG. 3 will include more detailed analyses of all aspects of the customer's operation, and will include ongoing measurement and support to ensure that the percentage savings estimated are achieved. These modules will also be practiced utilizing a computer and providing data for analysis and processing in the computer, however the details of these modules are not part of the present invention.
- the implementation module may be significantly modified. If there is a collection of an adequate level of subscriber data after use of the system over a long period of time, statistical analyses can be prepared and under some conditions industry "average" from these statistical analyses can be used in place of a data collection step.
- General information based upon the statistical analysis of industry average data for any particular industry for example for banking customers who use business forms, insurance company customers, large multi-location retail establishment customers, etc.
- the customer interview stage 16 will still be necessary.
- a seventh, or additional, separate category can be built into the system (as indicated as 52 in FIG. 4C) that can reflect a vertical market or other designation, and a data base of responses can be retained for comparison of all potential customers as well as sub-sets of potential customers that have additional areas to address on the marketplace continuum.
- This also can be used to assess the user's ability to move a potential customer along the "marketplace continuum". It can provide a pro-active method of assessing the user's needs for building new products and supplying new services for application to the marketplace.
Abstract
Description
______________________________________ Forms Control ______________________________________ Element FormsControl Function 35% (30-40%) Sub-elements 01-60% (55-65%); 02-20% (15-25%) 03-20% (15-25%)Element Form File 20% (15-25%) Sub-elements 01-16% (5-15%); 02-30% (25-35%); 03-60% (55-65%) Element Forms Numbering 10% (5-15%) Sub-elements 01-60% (55-65%); 02-40% (35-45%) Element FormsCatalog 20% (15-25%) Sub-elements 01-10% (5-15%); 02-30% (25-35%); 03-20% (15-25%); 04-40% (35-45%)Element Requisitions 5% (1-10%) Sub-elements 01-50% (40-60%); 02-50% (40-60%) Element Obsolete Item IA, Resolution & 10% (5-15%) Prevention Sub-elements 01-100% (significant) 100% ______________________________________
______________________________________ Forms Design ______________________________________Element Composition 10% (5-15%) Sub-elements 01-5% (1-10%); 02-5% (1-10%); 03-30% (25-35%); 04-15% (10-20%); 05-20% (15-25%); 06-15% (10-20%); 07-10% (5-15%) Element FormsAnalysis 40% (35-45%) Sub-elements 01-50% (40-60%); 02-50% (40-60%) ElementBusiness System Analysis 25% (20-30%) Sub-elements 01-100% (significant) Element Man. Capabilities &Standard 25% (20-30%) Specifications Sub-elements 01-35% (25-45%); 02-65% (55-75%) 100% ______________________________________
______________________________________
WEIGHT
VALUE (%)
______________________________________
01. FORMS CONTROL
01. Forms Control Function 30
01. 60
A. Do procedures exist for
Forms Control activities?
B. Are they published?
C. Are they available to end
users?
D. Is there a formal review
process?
Value:0 NNNN 0.1
Value:1 YNNN 2.0
Value:3 YYNN 4.0
Value:5 YNYN 3.0
Value:7 YYYN 6.0
Value:9 YNNY 3.0
Value:11 YYNY 5.0
Value:13 YNYY 5.0
Value:15 YYYY 8.0
02. 20
A. Is there assigned responsi-
bility for the Forms Control
function?
B. Does it include participating
in design construction
recommendations?
C. Does it include attending
departmental meetings for
development of new forms?
D. Does it include reviewing
forms for consolidation/
elimination?
E. Does it include approving
forms vendor invoices for
payment?
Value:0 NNNNN 01
Value:1 YNNNN 2.0
Value:3 YYNNN 3.0
Value:5 YNYNN 2.5
Value:7 YYYNN 4.0
Value:9 YNNYN 3.0
Value:11 YYNYN 4.5
Value:13 YNYYN 3.5
Value:15 YYYYN 7.0
Value:17 YNNNY 2.0
Value:19 YYNNY 4.0
Value:21 YNYNY 3.0
Value:23 YYYNY 5.0
Value:25 YNNYY 4.0
Value:27 YYNYY 7.0
Value:29 YNYYY 6.0
Value:31 YYYYY 8.0
03. 20
A. Is there a training program
for Forms Control
personnel?
B. Is it an internal program?
C. Is it recognized and
administered through your
corporate training program?
D. Does it include vendor plant
visits and workshops?
Value:0 NNNN 0.1
Value:1 YNNN 2.0
Value:3 YYNN 4.0
Value:5 YNYN 3.0
Value:7 YYYN 6.5
Value:9 YNNY 3.0
Value:11 YYNY 5.0
Value:13 YNYY 3.5
Value:15 YYYY 8.0
02. Forms File 20
01. 10
A. Does a forms file exist?
B. Is it paper based?
C. Is it an electronic forms file?
Value:0 NNN 0.1
Value:3 YYN 4.0
Value:5 YNY 8.0
Value:7 YYY 6.0
02. Which of the following are
30
included in the forms file?
A. Current forms samples
1.5
B. Specifications of the form
1.5
C . Usage history 1.0
D. Information regarding using
0.5
department(s)
E. Revision pending notes
1.0
F. Authorized signatures
1.0
G. Previous P.O.s 0.5
H. Budget/cost center code
0.5
I. Flow chart depicting use of
0.5
form
03. 60
A. Is the forms file updated?
B. Is it updated on a regularly
scheduled basis?
C. Are there control measures
to challenge new items and
reorder quantities?
Value:0 NNN 0.1
Value:1 YNN 2.0
Value:3 YYN 6.0
Value:5 YNY 4.0
Value:7 YYY 8.0
03. Forms Numbering 10
01. 60
A. Does a form numbering system
exist?
B. Form numbers are assigned
sequentially or randomly.
C. Form numbers are assigned using
a scheme that reflects a function
or department.
Value:0 NNN 0.1
Value:1 YNN 2.0
Value:3 YYN 5.0
Value:5 YNY 8.0
Value:7 YYY 5.0
02. Who is responsible for assigning
40
form numbers?
A. Each using department.
B. Form numbers are assigned by
the Inventory Management
System.
C. Purchasing or Forms Control.
D. Vendor and Forms Control
together.
Value:1 YNNN 4.0
Value:2 NYNN 3.0
Value:3 YYNN 2.0
Value:4 NNYN 6.0
Value:5 YNYN 2.0
Value:6 NYYN 2.0
Value:7 YYYN 1.0
Value:8 NNNY 8.0
Value:9 YNNY 2.0
Value:10 NYNY 2.0
Value:11 YYNY 1.0
Value:12 NNYY 3.0
Value:13 YNYY 1.0
Value:14 NYYY 1.0
Value:15 YYYY 1.0
04. Forms Catalog 20
01. 10
A. Do you utilize a forms catalog?
B. Is it manually produced and
updated?
C. Is it produced as a computer
listing?
D. Is it a book format?
E. Is it updated and available for
viewing via an electronic
interface?
Value:0 NNNNN 0.1
Value:3 YYNNN 3.0
Value:5 YNYNN 5.5
Value:11 YYNYN 4.0
Value:13 YNYYN 6.0
Value:17 YNNNY 8.0
Value:21 YNYNY 6.0
Value:25 YNNYY 7.0
Value:29 YNYYY 6.5
02. Which of the following are
30
included in your forms catalog?
A. Form name, description
2.0
B. Form number 2.0
C. Form size (width, length, number
0.1
of parts)
D. Packaging unit 1.5
E. Number of forms per packaging
1.0
unit
F. Pictures of each form
0.5
03. How is the catalog distributed?
20
A. Mailed to end-users based on
4.0
customized/specific needs
B. User requests overnight service
6.0
Print On Demand and mail out
C. Accessed electronically
8.0
D. Catalog is distributed on a
2.0
scheduled basis
E. Catalog is not distributed
0.1
04. How often is the catalog 40
updated?
A. Annually 4.0
B. Quarterly or semi-annually
6.0
C. Monthly 8.0
D. As changes occur 7.0
E. Catalog is not updated
0.1
0.5 Requisitions 5
0.1 What is the average number of
50
line items per requisition?
A. Below 5 4.0
B. 5 or more 8.0
0.2 What is the maximum number of
50
available lines on the most
commonly used requisition form?
A. 1-10 2.0
B. 10-25 5.0
C. Unlimited - as many as they want
8.0
D. A requisition form is not used
0.1
0.6 Obsolete Item ID, Resolution, &
10
Prevention
0.1 100
A. Are there tools to identify and
2.0
remedy obsolete forms?
B. Are these tools automated?
2.0
C. Does an obsolescence review
3.0
program exist?
D. Is the dollar value of obsolete
1.0
inventory tracked continuously?
E. Forms are not reviewed for
0.1
obsolescence
2. FORMS DESIGN 10
01. Composition
01. 5
A. Do you have an in-house
composition program currently in
place?
B. Formal composition procedures
and graphic standards in place.
C. End user with self taught
composition package.
D. Adequately trained personnel in
a centralized function perform
composition.
E. Internal composition and type-
setting department with fully
trained personnel.
Value:0 NNNNN 0.1
Value:1 YNNNN 1.0
Value:3 YYNNN 6.0
Value:5 YNYNN 2.0
Value:7 YYYNN 4.0
Value:9 YNNYN 4.0
Value:11 YYNYN 5.0
Value:13 YNYYN 4.0
Value:15 YYYYN 4.0
Value:17 YNNNY 6.5
Value:19 YYNNY 8.0
Value:21 YNYNY 6.0
Value:23 YYYNY 7.0
Value:25 YNNYY 5.0
Value:27 YYNYY 5.0
Value:29 YNYYY 4.0
Value:31 YYYYY 3.0
02. 5
A. Do you utilize outside resources
to perform the composition
function?
B. End user initiates composition
using outside resources.
C. Composition is performed by the
forms vendor.
Value:0 NNN 0.1
Value:1 YNN 0.1
Value:3 YYN 2.0
Value:5 YNY 8.0
Value:7 YYY 6.0
03. Which of the following is respon-
30
sible for the approval of new
forms, revisions, and proofs:
A. Each user department
B. Forms Design department and
vendor
C. Purchasing
D. Forms Design department
Value:0 NNNN 0.1
Value:1 YNNN 1.0
Value:2 NYNN 8.0
Value:3 YYNN 6.0
Value:4 NNYN 5.0
Value:5 YNYN 2.0
Value:6 NYYN 5.0
Value:7 YYYN 4.0
Value:8 NNNY 7.0
Value:9 YNNY 6.0
Value:10 NYNY 6.0
Value:11 YYNY 2.0
Value:12 NNYY 5.0
Value:13 YNYY 2.0
Value:14 NYYY 4.0
Value:15 YYYY 1.0
04. How are proofs being obtained?
15
A. In house
B. Through manufacturing vendor
C. Third party
Value:0 NNN 0.1
Value:1 YNN 3.0
Value:2 NYN 8.0
Value:3 YYN 4.0
Value:4 NNY 6.0
Value:5 YNY 4.0
Value:6 NYY 5.0
Value:7 YYY 3.5
05. What is the average turn around
20
time for proofs?
A. Six or more days 2.0
B. Two to five days 4.0
C. One day (24 hours) 6.0
D. Less than twenty-four hours
8.0
06. Which best describes your 15
company's awareness regarding
corporate graphic standards?
A. Standards exist 3.0
B. Exist and published 5.0
C. Exist and published with
8.0
adequate compliance
D. No graphic standards exist
0.1
07. Which best describes your 10
company's awareness regarding
postal regulations?
A. Periodically review postal
regulation updates
B. Comply with postal regulations
C. Take advantage of postal
discounts (presorted postal
rates . . .)
D. Postal regulations are not
incorporated into mailing
procedures
Value:0 NNNN 0.1
Value:1 YNNN 2.0
Value:2 NYNN 3.0
Value:3 YYNN 4.0
Value:4 NNYN 3.0
Value:5 YNYN 5.0
Value:6 NYYN 4.0
Value:7 YYYN 6.0
Value:8 NNNY 4.0
Value:9 YNNY 4.0
Value:10 NYNY 4.0
Value:11 YYNY 4.0
Value:12 NNYY 6.0
Value:13 YNYY 4.0
Value:14 NYYY 7.0
Value:15 YYYY 8.0
02. Forms Analysis 40
01. 50
A. Is the Forms Analysis function
0.0
currently being performed?
B. The end user primarily performs
1.0
this function.
C. A part time internal Forms
2.0
Analyst primarily performs this
function.
D. A fully trained internal Forms
4.0
Analyst performs this function.
E. Vendor provides analysis as part
6.0
of service program.
F. A dedicated vendor Forms
8.0
Analyst performs this function.
02. 50
A. Is the forms consolidation
0.0
function currently being
performed?
B. Is it being performed by each end
2.0
user
C. Each department performs this
3.0
function separately.
D. An internal Forms Analyst
7.0
performs this function.
E. A vendor Forms Analyst
8.0
performs this function.
F. Purchasing performs this
4.0
function.
G. Forms Control performs this
5.0
function.
03. Business Systems Analysis 25
0.1 Business systems analysis the
100
study of all system components
and department flow.
A. Is this process currently being
0.0
performed?
B. Informally by the end user
4.0
C. Internally by a full time
6.0
dedicated resource
D. By a dedicated vendor Business
8.0
Systems Analyst with tools and
models.
04. Manuf. Capabilities and Standard
25
Specifications
01. Which best describes the level of
35
awareness and utilization of
industry standards?
A. General understanding of
4.0
industry standards
B. Thorough understanding and use
6.0
of industry standards
C. Industry standards review is a
8.0
part of the order entry process
D. Not aware of industry standards
0.1
02. Which of the following best 65
indicates the level of awareness
of industry capabilities?
A. General knowledge of industry
2.5
capabilities and expertise
B. Knowledge of industry
6.0
capabilities and participate in
focus groups
C. Not aware of industry capabilities
8.0
3. PROCUREMENT
01. Procurement Process 60
01. Which best describes the most
30
commonly used forms procure-
ment process at it exists today?
A. Bid only 2.0
B. Recurring purchasing with the
3.0
same vendor for a portion of the
forms volume
C. End user purchases 4.0
independently
D. Contract purchasing 5.0
E. Buying groups/affiliations
6.0
F. One vendor 8.0
02. Who is responsible for the 10
Procurement function?
A. End user individually
B. Each functional department
C. Centralized purchasing
department
D. Vendor - forms purchasing is
out-sourced
Value:0 NNNN 0.1
Value:1 YNNN 2.0
Value:2 NYNN 4.0
Value:3 YYNN 3.0
Value:4 NNYN 6.0
Value:5 YNYN 4.0
Value:6 NYYN 4.0
Value:7 YYYN 2.0
Value:8 NNNY 8.0
Value:9 YNNY 3.0
Value:10 NYNY 4.0
Value:11 YYNY 3.0
Value:12 NNYY 7.0
Value:13 YNYY 3.0
Value:14 NYYY 2.0
Value:15 YYYY 1.0
03. What is the number one criteria
20
used when choosing a forms
vendor?
A. Relationship 6.0
B. Service 6.0
C. Price 2.0
D. Quality 4.0
E. Value added products and
7.0
services
F. Uses innovative technologies
8.0
G. Environmental standards
7.5
04. How is vendor performance 25
measured?
A. Program in place for vendor
4.0
assessment
B. Vendor assessment based on
5.0
exceptions (i.e. when problem
occurs)
C. Measurement based on product
8.0
quality, delivery, and other
services
D. Vendor's performance is not
0.1
measured
05. Which method is most often used
5
to place an order with a vendor?
A. Manual purchase orders
2.0
B. Standalone PC based purchasing
4.0
system
C. Integrated purchasing system
7.0
D. EDI (Electronic Data
7.5
Interchange)
E. On-line electronic segregation of
8.0
requisitioned items by vendor
06. Are there specific procedures in
5
place for:
A. Reordering existing forms?
2.0
B. Pre-order clearance?
2.0
C. Justification for new forms
2.0
creation?
D. High priority and security items?
2.0
07. How are purchase orders usually
5
tracked?
A. Manually tracked and reported
2.0
B. Standalone Purchasing System
4.0
with reports to identify orders in
process
C. Vendor supplied reports to track
5.0
purchase orders
D. Integrated Purchasing System
7.0
with reports
E. Customer P.O. system with
8.0
interface to vendor's manu-
facturing system
F. P.O.s are not tracked
0.1
02. Reorder Process 35
01. Which of the following best 45
describes the process to identify
items in need of replenishment?
A. Item is reordered when stock is
2.0
depleted
B. Periodic physical inventory
4.0
C. Analysis of computer reports
6.0
D. Use of exception reports
8.0
02. 30
A. Are orders for similar products
0.0
combined to gain economies of
scale?
B. Combinations are manually
3.0
combined.
C. Combinations are combined via
6.0
automated computer reporting.
D. Combinations are identified via
8.0
computer-generated low stock
notices.
03. What is the average duration of
10
the reorder process:
A. 46 days or more 2.0
B. 20-45 days 4.0
C. 11-19 days 6.0
D. 10 days or less 8.0
0.4 How are repeat orders 15
approved?
A. By the user department
B. By Forms Control
C. By Purchasing
D. Mandatory preorder clearance
E. Master P.O. with numbered
"authorized releases"
Value:0 NNNNN 0.1
Value:1 YNNNN 2.0
Value:2 NYNNN 4.0
Value:3 YYNNN 4.0
Value:4 NNYNN 6.0
Value:5 YNYNN 5.0
Value:6 NYYNN 4.0
Value:7 YYYNN 3.0
Value:8 NNNYN 7.0
Value:9 YNNYN 4.0
Value:10 NYNYN 5.0
Value:11 YYNYN 3.0
Value:12 NNYYN 6.0
Value:13 YNYYN 3.0
Value:14 NYYYN 3.0
Value:15 YYYYN 2.0
Value:16 NNNNY 8.0
Value:17 YNNNY 6.0
Value:18 NYNNY 6.0
Value:19 YYNNY 3.0
Value:20 NNYNY 7.0
Value:21 YNYNY 3.0
Value:22 NYYNY 3.0
Value:23 YYYNY 2.0
Value:24 NNNYY 7.0
Value:25 YNNYY 3.0
Value:26 NYNYY 3.0
Value:27 YYNYY 2.0
Value:28 NNYYY 3.0
Value:29 YNYYY 2.0
Value:30 NYYYY 3.0
Value:31 YYYYY 1.0
03. Environmental Policy 5
01. 50
A. Is there currently a corporate or
community environmental
awareness program?
B. With a Coordinator position
requiring knowledge of environ-
mental laws?
C. Measurement of progress and
impact of environmental
programs?
D. A corporate advertising
program?
Value:0 NNNN 0.1
Value:1 YNNN 2.0
Value:3 YYNN 4.0
Value:5 YNYN 4.0
Value:7 YYYN 7.0
Value:9 YNNY 4.0
Value:11 YYNY 7.0
Value:13 YNYY 5.0
Value:15 YYYY 8.0
02. 50
A. Is there a forms purchasing
0.0
policy in regard to recyclable
products?
B. Is it practiced by the Purchasing
0.5
department only?
C. Does it encompass the entire
2.0
company?
D. Are recycled product purchases
1.0
based on price?
E. Is it for specific product lines
1.5
only?
F. Does it include converting to
3.0
recycled product in all product
lines?
4. WAREHOUSING & DISTRIBUTION
01. Warehouse Facility Character-
35
istics
01. 5
A. Is an outside warehouse being
0.0
utilized for forms related
storage?
B. Are less than 20% of all forms
4.0
being stored in this facility?
C. Are 20-50% of all forms being
5.0
stored in this facility?
D. Are 51-80% of all forms being
6.0
stored in this facility?
E. Are 81-99% of all forms being
8.0
stored in this facility?
F. Are 100% of all forms being
6.0
stored in this facility?
02. 5
A. Does your company own or
operate an internal forms storage
facility?
B. Departmental supply room/closet
C. Central company storage location
accessible by all departments
D. Multiple warehouses within close
proximity to most end users
E. Nationwide/international ware-
housing capabilities
Value:0 NNNNN 0.1
Value:1 YNNNN 1.0
Value:3 YYNNN 2.0
Value:5 YNYNN 2.0
Value:7 YYYNN 3.0
Value:9 YNNYN 3.0
Value:11 YYNYN 3.0
Value:13 YNYYN 3.0
Value:15 YYYYN 6.0
Value:17 YNNNY 3.0
Value:19 YYNNY 3.0
Value:21 YNYNY 3.0
Value:23 YYYNY 4.0
Value:25 YNNYY 3.0
Value:27 YYNYY 3.0
Value:29 YNYYY 4.0
Value:31 YYYYY 7.0
Value:33 YNNNN 4.0
Value:35 YYNNN 3.0
Value:37 YNYNN 3.0
Value:39 YYYNN 4.0
Value:41 YNNYN 3.0
Value:43 YYNYN 4.0
Value:45 YNYYN 4.0
Value:47 YYYYN 5.0
Value:49 YNNNY 3.0
Value:51 YYNNY 4.0
Value:53 YNYNY 4.0
Value:55 YYYNY 6.0
Value:57 YNNYY 4.0
Value:59 YYNYY 6.0
Value:61 YNYYY 7.0
Value:63 YYYYY 8.0
03. 5
A. Is a computer system used to
manage inventory in this
warehouse operation?
B. Does it generate receipts?
C. Does it generate pick tickets?
D. Does it generate bills of lading?
E. Does it calculate freight charges?
F. Does it prepare carton labels?
Value:0 NNNNNN 0.1
Value:1 YNNNNN 1.0
Value:3 YYNNNN 2.0
Value:5 YNYNNN 2.0
Value:7 YYYNNN 3.0
Value:9 YNNYNN 3.0
Value:11 YYNYNN 3.0
Value:13 YNYYNN 3.0
Value:15 YYYYNN 6.0
Value:17 YNNNYN 3.0
Value:19 YYNNYN 3.0
Value:21 YNYNYN 3.0
Value:23 YYYNYN 4.0
Value:25 YNNYYN 3.0
Value:27 YYNYYN 3.0
Value:29 YNYYYN 4.0
Value:31 YYYYYN 7.0
Value:33 YNNNNY 4.0
Value:35 YYNNNY 3.0
Value:37 YNYNNY 3.0
Value:39 YYYNNY 4.0
Value:41 YNNYNY 3.0
Value:43 YYNYNY 4.0
Value:45 YNYYNY 4.0
Value:47 YYYYNY 5.0
Value:49 YNNNYY 3.0
Value:51 YYNNYY 4.0
Value:53 YNYNYY 4.0
Value:55 YYYNYY 6.0
Value:57 YNNYYY 4.0
Value:59 YYNYYY 6.0
Value:61 YNYYYY 7.0
Value:63 YYYYYY 8.0
04. 15
A. Are there formal procedures
regarding warehousing
operations?
B. Are these procedures published?
C. Is there a formal operational
training process including
orientation for new employees?
Value:0 NNN 0.1
Value:1 YNN 3.0
Value:3 YYN 4.0
Value:5 YNY 7.0
Value:7 YYY 8.0
05. Does this warehousing facility
20
include any of the following?
A. Vertical pallet racking
1.0
B. Warehouse clearance height
2.0
more than 14 feet high
C. Motor driven vehicles for
2.5
materials handling
D. Wire guidance system/robotics/
2.5
high bay pick system
06. Which of the following are char-
20
acteristics of this warehouse
facility?
A. There is a personnel screening
1.0
process for entry into the
warehouse facility.
B. The warehouse facility is
2.0
equipped with an alarm system.
C. There are special provisions for
1.0
high security items.
D. The facility is equipped with a
1.0
sprinkler system.
E. Warehouse personnel are
1.0
bonded.
F. There are formal procedures for
2.0
disaster recovery.
07. How are the majority of 5
requisition shipping labels
generated in this facility?
A. Hand written 2.0
B. Typed/Stenciled 3.0
C. Preprinted by vendor
5.0
D. Computer generated without bar
6.0
codes
E. Computer generated with bar
8.0
codes
F. Shipping labels are not generated
0.1
08. How are orders located in this
20
warehouse?
A. Each form is designated a single
3.0
specific warehouse "bin"
location.
B. Each form is placed and pulled
6.0
randomly with manually
maintained records.
C. Each form is placed and pulled
8.0
randomly with computer-
generated support.
09. 5
A. Are there quality standards,
0.0
measurements, and objectives in
place in this warehouse?
B. Are errors manually logged and
2.0
reviewed?
C. Are computer records used to
2.0
track and report?
D. Are quality focus groups created
2.0
to recommend preventative
action?
E. Are there individual employee
2.0
productivity standards?
02. Requisition Process 35
01. How are requisitions typically
50
received in this warehouse?
A. Mail, phone, fax on a random
3.0
basis
B. Mail, phone, fax on a scheduled
6.0
basis
C. Electronically using EDI
8.0
02. What is the average time to fill a
50
requisition once it is received at
this warehouse?
A. More than 6 working days
3.0
B. 3-5 working days 5.0
C. Within 48 hours or less
8.0
03. Distribution Methods 15
0.1 Which of the following product
40
distribution methods describe the
current capabilities?
A. Full carton
B. Pick and Pack
C. Manual mass distribution (mass
mailings)
D. Automated mass distribution
E. Freight merging capabilities
Value:1 YNNNN 1.0
Value:2 NYNNN 2.0
Value:3 YYNNN 3.0
Value:5 YNYNN 2.0
Value:6 NYYNN 2.0
Value:7 YYYNN 7.0
Value:9 YNNYN 3.0
Value:10 NYNYN 3.0
Value:11 YYNYN 7.0
Value:17 YNNNY 3.0
Value:18 NYNNY 20
Value:19 YYNNY 4.0
Value:20 NNYNY 2.0
Value:21 YNYNY 4.0
Value:22 NYYNY 4.0
Value:23 YYYNY 6.0
Value:25 YNNYY 5.0
Value:26 NYNYY 5.0
Value:27 YYNYY 8.0
02. How is the master bill of lading
10
typically prepared?
A. Manually 3.0
B . Computer-generated 8.0
C. Master bill of lading is not
0.1
utilized
03. 30
A. Is a commercial carrier utilized
0.0
for freight distribution from this
location?
B. Are freight charges based on a
3.0
pre-negotiated contract?
C. Are freight calculations
2.0
automated?
D. Are carriers automatically
3.0
selected by a computer based on
freight costs?
04. 20
A. Are there formal procedures for
1.0
returning items to this
warehouse?
B. Is there a central contact for
1.0
return authorization?
C. Is a fixed dollar value set for
1.0
determination of feasibility of
product return?
D. Do time limitations exist for
1.0
return of product?
E. Is returned product recorded
2.0
back into inventory, with auto-
matic credit?
F. Is product reviewed with respect
1.0
to obsolescence or revision upon
return?
G. Is an 800 number or voice mail
1.0
used to support end-user
inquiries?
04. Inventory Turns 15
01. What is the average number of
100
inventory turns of items per
year?
A. 1 1.0
B. 2 3.0
C. 3 6.0
D. 4 or more 8.0
5. INVENTORY MANAGEMENT SYSTEM
01. Characteristics 10
01. How is your forms inventory 35
currently being managed?
A. In an automated fashion.
B. On a standalone system.
C. On an integrated mainframe
supported system.
D. On an internally developed
system.
E. On a system that is on-line to the
vendor's IMS (Inventory
Management System).
Value:0 NNNNN 0.1
Value:3 YYNNN 3.5
Value:5 YNYNN 7.0
Value:7 YYYNN 4.0
Value:11 YYNYN 4.0
Value:13 YNYYN 6.5
Value:15 YYYYN 3.0
Value:19 YYNNY 6.5
Value:21 YNYNY 9.0
Value:23 YYYNY 4.0
Value:27 YYNYY 6.0
Value:29 YNYYY 8.0
Value:31 YYYYY 4.5
02. Who is primarily responsible for
65
managing and maintaining forms
inventory?
A. End-Users 2.0
B. Each Department 3.0
C. Warehouse Personnel 5.0
D. Purchasing Department
6.0
E. Forms Control Personnel
8.0
02. Access 10
01. Who has access to the inventory
60
management system?
A. End users
B. Each department
C. Warehouse
D. Purchasing
E. Forms Control
Value:0 NNNNN 0.1
Value:1 YNNNN 3.0
Value:2 NYNNN 4.0
Value:3 YYNNN 4.0
Value:4 NNYNN 6.0
Value:5 YNYNN 6.0
Value:6 NYYNN 5.0
Value:7 YYYNN 5.0
Value:8 NNNYN 3.0
Value:9 YNNYN 3.0
Value:10 NYNYN 4.0
Value:11 YYNYN 5.0
Value:12 NNYYN 5.0
Value:13 YNYYN 7.0
Value:14 NYYYN 5.0
Value:15 YYYYN 4.0
Value:16 NNNNY 3.0
Value:17 YNNNY 4.0
Value:18 NYNNY 4.0
Value:19 YYNNY 5.0
Value:20 NNYNY 8.0
Value:21 YNYNY 7.5
Value:22 NYYNY 6.0
Value:23 YYYNY 4.0
Value:24 NNNYY 6.0
Value:25 YNNYY 4.0
Value:26 NYNYY 5.0
Value:27 YYNYY 4.0
Value:28 NNYYY 7.0
Value:29 YNYYY 4.0
Value:30 NYYYY 5.0
Value:31 YYYYY 3.0
02. How do users typically access the
40
inventory management system?
A. No direct access, only reports are
1.5
available
B. Batched processing 4.0
C. Interactive access using dial up,
7.0
leased line or direct connect
D. Access is not available to users
0.1
03. System Software Security 10
01. 100
A. Are passwords used as a security
0.0
feature within your inventory
management system?
B. Is there a standard entry
2.0
password for all users?
C. Are there standard entry
4.0
passwords used by each
department?
D. Are there individually assigned
5.0
passwords?
E. Are individual passwords
8.0
periodically reissued?
04. Features 30
01. Which of the following are 100
features of the inventory
management system?
A. Basic editing - form number,
1.5
quantity
B. Minimum/maximum levels
0.3
C. Rationing 0.3
D. Back-ordering 1.5
E. Control of critical numbered
1.5
forms
F. Automated carrier selection
0.3
G. System supported physical
0.5
inventory
H. Usage history by item
1.5
I. Reports 0.6
05. Customer Service 10
01. 100
A. Are customer service personnel
available to answer forms
distribution inquiries?
B. Are these customer service
positions full-time?
C. Are the proper tools and training
available to these personnel?
06. Reports 30
01. Which best describes the report-
100
ing capabilities associated with
the inventory management
system?
A. Reports generated by spread-
1.0
sheet/software package
B. Standard reports - not modifiable
2.0
C. Standard reports with select/
4.0
sort/print Ad Hoc reports
D. Query (what if) using on-line
5.0
access
E. Reports, query, and economic
8.0
order quantity calculation
capabilities
F. Reports are not available
0.1
6. ACCOUNTS PAYABLE
01. Accounts Payable 55
01. How are invoices typically 50
received?
A. Paper invoice received for each
2.0
individual purchase order
B. Paper based summary billing
4.0
C. Magnetic media exchange
6.0
D. EDI transmissions 8.0
02. How are bills usually authorized
25
for payment?
A. Individually by end users
2.0
B. Centrally by Accounts Payable
4.0
C. Centrally by Purchasing or
5.0
Forms Control
C. Matched electronically with
9.9
exception comparisons
03. How do you usually remit 25
payment?
A. Checks written manually
2.0
B. Checks printed through
4.0
automated system
C. Credit cards 5.0
D. Electronic funds transfer
8.0
02. Accounting 45
01. Which best describes the current
40
cost allocation process?
A. Manual cost allocation process
4.0
by individual invoice (re-key
entries)
B. Manual cost allocation by
6.0
monthly summary (re-key
entries)
C. Computer program allocations
8.0
cost from vendor supplied
magnetic media
D. Cost allocation does not occur
1.0
02. 60
A. Is the Accounts Payable system
2.0
automated?
B. Is it integrated with the
2.0
Purchasing system?
C. Is it integrated with the ware-
2.0
housing operation system?
D. Is it integrated with the
2.0
Inventory Management System?
______________________________________
______________________________________
                  Current
       Opportunity/
                  Situation
                           High Rating
Customer
       Trigger    Trigger  Trigger  Statement
Value  Value      Value    Value    Printed
______________________________________
2.0    0.1        2        6        Current
                                    Situation
4.0    0.1        2        6        Current
                                    Situation
5.0    0.1        2        6        Current
                                    Situation
7.0    0.1        2        6        Opportunity
8.0    0.1        2        6        Opportunity
0.1    0.1        2        6        Opportunity
______________________________________
______________________________________ CUSTOMER X ESTIMATED PERCENTAGE SAVINGS BYCATEGORY 1 Area of Category Opportunity Estimated % Savings ______________________________________ FORMS CONTROL 5.9 2.0% FORMS DESIGN 5.9 11.2% PROCUREMENT 4.1 2.0% WAREHOUSE/ 6.5 over 12.0% DISTRIBUTION INVENTORY 4.9 1.0% MANAGEMENT SYSTEM ACCOUNTS 5.4 4.0% PAYABLE ______________________________________ These percentages are estimates based on our initial assessment of your operation. In order to provide exact dollar savings, we will work closely with your organization to conduct a term analysis study and establish current baselines.
Claims (22)
Priority Applications (2)
| Application Number | Priority Date | Filing Date | Title |
|---|---|---|---|
| US08/209,471 US5627973A (en) | 1994-03-14 | 1994-03-14 | Method and apparatus for facilitating evaluation of business opportunities for supplying goods and/or services to potential customers |
| CA002119399A CA2119399A1 (en) | 1994-03-14 | 1994-03-18 | System and method for analyzing service fulfillment data |
Applications Claiming Priority (1)
| Application Number | Priority Date | Filing Date | Title |
|---|---|---|---|
| US08/209,471 US5627973A (en) | 1994-03-14 | 1994-03-14 | Method and apparatus for facilitating evaluation of business opportunities for supplying goods and/or services to potential customers |
Publications (1)
| Publication Number | Publication Date |
|---|---|
| US5627973A true US5627973A (en) | 1997-05-06 |
Family
ID=22778880
Family Applications (1)
| Application Number | Title | Priority Date | Filing Date |
|---|---|---|---|
| US08/209,471 Expired - Fee Related US5627973A (en) | 1994-03-14 | 1994-03-14 | Method and apparatus for facilitating evaluation of business opportunities for supplying goods and/or services to potential customers |
Country Status (2)
| Country | Link |
|---|---|
| US (1) | US5627973A (en) |
| CA (1) | CA2119399A1 (en) |
Cited By (151)
| Publication number | Priority date | Publication date | Assignee | Title |
|---|---|---|---|---|
| US5765138A (en) * | 1995-08-23 | 1998-06-09 | Bell Atlantic Network Services, Inc. | Apparatus and method for providing interactive evaluation of potential vendors |
| US5893904A (en) * | 1996-06-14 | 1999-04-13 | Electronic Data Systems Corporation | System and method for brokering the allocation of an item of business property |
| WO1999034313A3 (en) * | 1997-12-31 | 1999-08-19 | Comparative Visual Assessments | Comparative visual assessment method & system |
| WO1999059096A1 (en) * | 1998-05-13 | 1999-11-18 | Customer Cast, Inc. | Customer survey system and method |
| US6014633A (en) * | 1997-09-24 | 2000-01-11 | Deroyal Business Systems, L.L.C. | Method for the analysis and standardization of bills of resources |
| WO2000041114A1 (en) * | 1999-01-04 | 2000-07-13 | David Saul Glass | Environmental impact and business analysis method using a strategic information system |
| US6092060A (en) * | 1994-12-08 | 2000-07-18 | Tech-Metrics International, Inc. | Computer-aided methods and apparatus for assessing an organizational process or system |
| US6119098A (en) * | 1997-10-14 | 2000-09-12 | Patrice D. Guyot | System and method for targeting and distributing advertisements over a distributed network |
| WO2000026836A3 (en) * | 1998-11-02 | 2000-10-05 | Vividence Corp | Full-service research bureau and test center method and apparatus |
| US6161101A (en) * | 1994-12-08 | 2000-12-12 | Tech-Metrics International, Inc. | Computer-aided methods and apparatus for assessing an organization process or system |
| WO2000077966A2 (en) * | 1999-06-15 | 2000-12-21 | Virtual Advisors, L.L.C. | System and method for internet-based business valuations |
| US6253186B1 (en) * | 1996-08-14 | 2001-06-26 | Blue Cross Blue Shield Of South Carolina | Method and apparatus for detecting fraud |
| US6301471B1 (en) | 1998-11-02 | 2001-10-09 | Openwave System Inc. | Online churn reduction and loyalty system |
| US20020072953A1 (en) * | 2000-12-08 | 2002-06-13 | Michlowitz Eric S. | Process, a method, a system and software architecture for evaluating supplier performance |
| US20020103689A1 (en) * | 2001-01-27 | 2002-08-01 | Hornick Randall F. | Methods and systems for identifying prospective customers and managing deals |
| US20020107778A1 (en) * | 2001-02-08 | 2002-08-08 | Sean Daly | Methods and systems for funding purchase transactions |
| WO2002065232A2 (en) * | 2000-11-10 | 2002-08-22 | The Procter & Gamble Company | Method and system for facilitating assessments |
| US20020123958A1 (en) * | 2000-06-07 | 2002-09-05 | Yoshinobu Hara | Business partner overall power judging system |
| US20020137015A1 (en) * | 2001-03-22 | 2002-09-26 | Guinta Lawrence R. | Computer-aided methods and apparatus for assessing an organizational process or system |
| US20020138332A1 (en) * | 2001-02-14 | 2002-09-26 | Ncr Corporation | Computer implemented customer value model in airline industry |
| US20020143606A1 (en) * | 2001-03-30 | 2002-10-03 | International Business Machines Corporation | Method and system for assessing information technology service delivery |
| US20020169650A1 (en) * | 2001-01-27 | 2002-11-14 | Dougherty Karen Ann | Methods and systems for identifying prospective customers and managing deals |
| US20020187829A1 (en) * | 2001-06-07 | 2002-12-12 | Takashi Hasegawa | Cooperation service method of contents viewing/listening and an attraction, and contents receiver and attraction system which are used for this method |
| US20020194127A1 (en) * | 2001-04-30 | 2002-12-19 | Randell Wayne L. | Method and system for processing invoices |
| US20020194055A1 (en) * | 2001-04-26 | 2002-12-19 | Honda Giken Kogyo Kabushiki Kaisha | Computer system for analyzing customer needs |
| US20020194126A1 (en) * | 2001-04-30 | 2002-12-19 | Randell Wayne L. | Method and system for handling invoices |
| US6501473B1 (en) * | 1999-03-18 | 2002-12-31 | Lucent Technologies Inc. | Method and system for theory of constraints buffer graphing, tracking and management |
| US20030046217A1 (en) * | 2001-09-06 | 2003-03-06 | Deaderick Barry Thomas | Procurement negotiation method |
| US20030046137A1 (en) * | 2001-08-28 | 2003-03-06 | International Business Machines Corporation | Method and system for generating a value proposition for a company in an industry |
| US20030050830A1 (en) * | 2001-09-13 | 2003-03-13 | William Troyer | Method and apparatus for evaluating relative performance of a business in an association of the same or similar businesses |
| US20030101117A1 (en) * | 2001-11-29 | 2003-05-29 | International Business Machines Coproation | Generating contract requirements for software suppliers based upon assessing the quality levels of quality attributes of the suppliers |
| US6574621B1 (en) * | 1997-09-23 | 2003-06-03 | Unisys Corporation | Survey analysis system and method |
| WO2003058383A2 (en) * | 2001-12-31 | 2003-07-17 | Ge Financial Assurance Holdings, Inc. (A Richmond Corporation) | Process for optimization of insurance underwriting suitable for use by an automated system |
| US20030139970A1 (en) * | 2001-08-31 | 2003-07-24 | Badura Teresa B. | Electronic method for determining procurement business strategy |
| US20030140053A1 (en) * | 2002-01-21 | 2003-07-24 | Vasey Philip Edgar | Document generation |
| US20030149611A1 (en) * | 2002-02-06 | 2003-08-07 | Alvin Wong | Supplier performance reporting |
| US20030154115A1 (en) * | 1999-09-17 | 2003-08-14 | International Business Machine Corporation | Method, system, and program for processing a job in an event driven workflow environment |
| US20030167198A1 (en) * | 2002-02-22 | 2003-09-04 | Northcott Michael B. | Identifying potential business opportunities |
| US20030177081A1 (en) * | 2002-03-15 | 2003-09-18 | Woehr William A. | Method and system for selling to accounts using TOC |
| US20030187702A1 (en) * | 2001-12-31 | 2003-10-02 | Bonissone Piero Patrone | System for optimization of insurance underwriting suitable for use by an automated system |
| US20030229526A1 (en) * | 2002-04-04 | 2003-12-11 | Gallacci Jeffery K. | Computer-implemented system and method for assessing supply chain solutions |
| US20040064375A1 (en) * | 2002-09-30 | 2004-04-01 | Randell Wayne L. | Method and system for generating account reconciliation data |
| US20040073496A1 (en) * | 2002-09-30 | 2004-04-15 | Marc-David Cohen | Computer-implemented offer optimization system and method |
| US20040093296A1 (en) * | 2002-04-30 | 2004-05-13 | Phelan William L. | Marketing optimization system |
| US20040122718A1 (en) * | 2002-12-18 | 2004-06-24 | International Business Machines Corporation | Method, system and program product for selecting a supplier |
| US20040133462A1 (en) * | 2002-09-05 | 2004-07-08 | Smith Claude D. | Computer system and method for producing integrated product forecasts |
| US20040172322A1 (en) * | 2001-10-16 | 2004-09-02 | I2 Technologies Us, Inc. | Providing decision support through visualization of participant past performance in an electronic commerce environment |
| US20040186748A1 (en) * | 2003-03-18 | 2004-09-23 | Spx Corporation | Method and apparatus for automating multi-national insurance information requests |
| US6810383B1 (en) * | 2000-01-21 | 2004-10-26 | Xactware, Inc. | Automated task management and evaluation |
| US20040220824A1 (en) * | 2002-06-17 | 2004-11-04 | Hiroaki Imai | Method and apparatus for providing services in recycling products |
| US6820060B1 (en) * | 1996-06-24 | 2004-11-16 | Jack Eisner | Apparatus for generating sales probability |
| US20050033628A1 (en) * | 2003-08-05 | 2005-02-10 | Alverson David J. | Contractor certification system |
| US6873992B1 (en) | 1999-09-07 | 2005-03-29 | Robolaw Corporation | Method and system for automated document generation |
| US6895386B1 (en) * | 1997-10-15 | 2005-05-17 | Citibank, N.A. | Stock credit card |
| US6915266B1 (en) * | 2000-07-31 | 2005-07-05 | Aysha Saeed | Method and system for providing evaluation data from tracked, formatted administrative data of a service provider |
| US6925441B1 (en) * | 1997-10-27 | 2005-08-02 | Marketswitch Corp. | System and method of targeted marketing |
| US20050209907A1 (en) * | 2004-03-17 | 2005-09-22 | Williams Gary A | 3-D customer demand rating method and apparatus |
| US20050228711A1 (en) * | 1999-10-21 | 2005-10-13 | International Business Machines Corporation | Database driven workflow management system for generating output material based on customer input |
| US20050234937A1 (en) * | 2004-04-15 | 2005-10-20 | International Business Machines Corporation | System and method for rating performance of computing grid service providers |
| US20050288990A1 (en) * | 2004-06-24 | 2005-12-29 | International Business Machines Corporation | Computer-implemented method, system and program product for modeling a consumer decision process |
| US20060005181A1 (en) * | 2004-04-15 | 2006-01-05 | International Business Machines Corporation | System and method for dynamically building application environments in a computational grid |
| US7047208B1 (en) * | 2001-08-16 | 2006-05-16 | Honda Motor Co., Ltd. | System and method for detecting supplier instability |
| US7054827B1 (en) * | 1997-09-24 | 2006-05-30 | Unisys Corporation | Method and apparatus for validating a survey database |
| US7058197B1 (en) | 1999-11-04 | 2006-06-06 | Board Of Trustees Of The University Of Illinois | Multi-variable model for identifying crop response zones in a field |
| US20060195332A1 (en) * | 2005-02-28 | 2006-08-31 | International Business Machines Corporation | Method and computer program product for generating a lightweight ontological data model |
| US7113914B1 (en) | 2000-04-07 | 2006-09-26 | Jpmorgan Chase Bank, N.A. | Method and system for managing risks |
| US20060229957A1 (en) * | 2005-04-06 | 2006-10-12 | International Business Machines Corporation | System and method for evaluating potential suppliers |
| US20060259427A1 (en) * | 2001-05-01 | 2006-11-16 | Randell Wayne L | Method and system for handling disputes in an electronic invoice management system |
| US20070050282A1 (en) * | 2005-08-25 | 2007-03-01 | Sas Institute Inc. | Financial risk mitigation optimization systems and methods |
| US20070192358A1 (en) * | 1999-08-31 | 2007-08-16 | International Business Machines Corporation | Workflow management system for generating output material based on customer input |
| US20070226090A1 (en) * | 2006-03-08 | 2007-09-27 | Sas Institute Inc. | Systems and methods for costing reciprocal relationships |
| US20070244766A1 (en) * | 2003-10-24 | 2007-10-18 | Sachin Goel | System for concurrent optimization of business economics and customer value |
| US20070265969A1 (en) * | 2006-05-15 | 2007-11-15 | Apple Computer, Inc. | Computerized management of media distribution agreements |
| US20080046859A1 (en) * | 2006-08-18 | 2008-02-21 | Samantha Pineda Velarde | System and method for evaluating adherence to a standardized process |
| US20080052185A1 (en) * | 2003-10-24 | 2008-02-28 | Sachin Goel | System for concurrent optimization of business economics and customer value |
| US20080065435A1 (en) * | 2006-08-25 | 2008-03-13 | John Phillip Ratzloff | Computer-implemented systems and methods for reducing cost flow models |
| US20080082458A1 (en) * | 2006-09-29 | 2008-04-03 | International Business Machines Corporation | Client Savings Modeling Tool |
| US20080091514A1 (en) * | 2006-10-17 | 2008-04-17 | International Business Machines Corporation | Determining an Executable Growth Strategy |
| US20080140514A1 (en) * | 2006-12-11 | 2008-06-12 | Grant Thornton Llp | Method and system for risk evaluation and management |
| US7392258B2 (en) | 2005-02-25 | 2008-06-24 | International Business Machines Corporation | Method and computer program product for dynamic weighting of an ontological data model |
| US7418409B1 (en) | 2003-10-24 | 2008-08-26 | Sachin Goel | System for concurrent optimization of business economics and customer value satisfaction |
| US20080215419A1 (en) * | 2004-11-15 | 2008-09-04 | International Business Machines Corporation | Method, system, and storage medium for implementing a multi-stage, multi-classification sales opportunity modeling system |
| US20080262899A1 (en) * | 2003-10-24 | 2008-10-23 | Sachin Goel | System for concurrent optimization of business economics and customer value |
| US7451106B1 (en) | 1998-11-30 | 2008-11-11 | E-Lynxx Corporation | System and method for competitive pricing and procurement of customized goods and services |
| US20090018880A1 (en) * | 2007-07-13 | 2009-01-15 | Bailey Christopher D | Computer-Implemented Systems And Methods For Cost Flow Analysis |
| US20090048876A1 (en) * | 2003-04-30 | 2009-02-19 | Piero Patrone Bonissone | System and process for a fusion classification for insurance underwriting suitable for use by an automated system |
| US20090129377A1 (en) * | 2007-11-19 | 2009-05-21 | Simon Chamberlain | Service for mapping ip addresses to user segments |
| US7567917B2 (en) | 2002-03-14 | 2009-07-28 | Kenneth Miller | Product design methodology |
| US20090222343A1 (en) * | 2008-02-28 | 2009-09-03 | Palo Alto Research Center Incorporated | Incentive mechanism for developing activity-based triggers of advertisement presentation |
| US20090248479A1 (en) * | 1995-10-30 | 2009-10-01 | Sfa System, Llc | Sales force automation system and method |
| US20090276332A1 (en) * | 2008-05-05 | 2009-11-05 | Sam Gharabally | Network-based distribution of application products |
| US20090307683A1 (en) * | 2008-06-08 | 2009-12-10 | Sam Gharabally | Network-Based Update of Application Programs |
| US20100049535A1 (en) * | 2008-08-20 | 2010-02-25 | Manoj Keshavmurthi Chari | Computer-Implemented Marketing Optimization Systems And Methods |
| US20100073373A1 (en) * | 2008-09-23 | 2010-03-25 | International Business Machines Corporation | System and method to model application maturity |
| US7698159B2 (en) | 2004-02-13 | 2010-04-13 | Genworth Financial Inc. | Systems and methods for performing data collection |
| US20100191663A1 (en) * | 2003-05-28 | 2010-07-29 | Gross John N | Method of testing item availability and delivery performance of an e-commerce site |
| US20100235254A1 (en) * | 2009-03-16 | 2010-09-16 | Payam Mirrashidi | Application Products with In-Application Subsequent Feature Access Using Network-Based Distribution System |
| US20100235889A1 (en) * | 2009-03-16 | 2010-09-16 | Michael Kuohao Chu | Application products with in-application subsequent feature access using network-based distribution system |
| US7801748B2 (en) | 2003-04-30 | 2010-09-21 | Genworth Financial, Inc. | System and process for detecting outliers for insurance underwriting suitable for use by an automated system |
| US20100250329A1 (en) * | 2009-03-26 | 2010-09-30 | Tugrul Sanli | Systems And Methods For Markdown Optimization When Inventory Pooling Level Is Above Pricing Level |
| US7813945B2 (en) | 2003-04-30 | 2010-10-12 | Genworth Financial, Inc. | System and process for multivariate adaptive regression splines classification for insurance underwriting suitable for use by an automated system |
| US7818186B2 (en) | 2001-12-31 | 2010-10-19 | Genworth Financial, Inc. | System for determining a confidence factor for insurance underwriting suitable for use by an automated system |
| US20100299246A1 (en) * | 2007-04-12 | 2010-11-25 | Experian Marketing Solutions, Inc. | Systems and methods for determining thin-file records and determining thin-file risk levels |
| US20100299219A1 (en) * | 2009-05-25 | 2010-11-25 | Cortes Ricardo D | Configuration and Management of Add-ons to Digital Application Programs for Network-Based Distribution |
| US7844476B2 (en) | 2001-12-31 | 2010-11-30 | Genworth Financial, Inc. | Process for case-based insurance underwriting suitable for use by an automated system |
| US7844477B2 (en) | 2001-12-31 | 2010-11-30 | Genworth Financial, Inc. | Process for rule-based insurance underwriting suitable for use by an automated system |
| US20110004594A1 (en) * | 2006-05-15 | 2011-01-06 | Jason Robert Suitts | Media Package Format for Submission to a Media Distribution System |
| US20110035353A1 (en) * | 2003-10-17 | 2011-02-10 | Bailey Christopher D | Computer-Implemented Multidimensional Database Processing Method And System |
| US20110035257A1 (en) * | 2009-08-06 | 2011-02-10 | Rajendra Singh Solanki | Systems And Methods For Generating Planograms In The Presence Of Multiple Objectives |
| US20110035508A1 (en) * | 2009-08-07 | 2011-02-10 | Jason Robert Fosback | Automatic transport discovery for media submission |
| US20110060776A1 (en) * | 2009-09-08 | 2011-03-10 | Jason Robert Suitts | Digital asset validation prior to submission for network-based distribution |
| US20110072161A1 (en) * | 2003-10-15 | 2011-03-24 | Gregory Robbin | Techniques and Systems for Electronic Submission of Media for Network-based Distribution |
| US7930200B1 (en) | 2007-11-02 | 2011-04-19 | Sas Institute Inc. | Computer-implemented systems and methods for cross-price analysis |
| US7962404B1 (en) | 2007-11-07 | 2011-06-14 | Experian Information Solutions, Inc. | Systems and methods for determining loan opportunities |
| US7983956B1 (en) | 2003-10-24 | 2011-07-19 | Sachin Goel | System and method for providing options on products including flights |
| US8000996B1 (en) | 2007-04-10 | 2011-08-16 | Sas Institute Inc. | System and method for markdown optimization |
| US8005693B2 (en) | 2001-12-31 | 2011-08-23 | Genworth Financial, Inc. | Process for determining a confidence factor for insurance underwriting suitable for use by an automated system |
| US20110238631A1 (en) * | 2006-05-15 | 2011-09-29 | Ricardo Cortes | Submission of metadata content and media content to a media distribution system |
| US8140399B1 (en) | 2003-10-24 | 2012-03-20 | Sachin Goel | System for concurrent optimization of business economics and customer value |
| US20120072262A1 (en) * | 2010-09-20 | 2012-03-22 | Bank Of America Corporation | Measurement System Assessment Tool |
| US8145536B1 (en) | 2003-10-24 | 2012-03-27 | Sachin Goel | System for concurrent optimization of business economics and customer value |
| US8160917B1 (en) | 2007-04-13 | 2012-04-17 | Sas Institute Inc. | Computer-implemented promotion optimization methods and systems |
| US20120144381A1 (en) * | 2003-08-05 | 2012-06-07 | James Brentano | Method and system for managing digital goods |
| US8200518B2 (en) | 2008-02-25 | 2012-06-12 | Sas Institute Inc. | Computer-implemented systems and methods for partial contribution computation in ABC/M models |
| US8370419B2 (en) | 2006-05-15 | 2013-02-05 | Apple Inc. | Processing of metadata content and digital content received by a media distribution system |
| US20130110589A1 (en) * | 2009-04-17 | 2013-05-02 | Hartford Fire Insurance Company | Processing and display of service provider performance data |
| US8515835B2 (en) | 2010-08-30 | 2013-08-20 | Sas Institute Inc. | Systems and methods for multi-echelon inventory planning with lateral transshipment |
| US20130246229A1 (en) * | 2005-07-19 | 2013-09-19 | Michael C. Mountz | Method and system for storing inventory holders |
| US8606626B1 (en) | 2007-01-31 | 2013-12-10 | Experian Information Solutions, Inc. | Systems and methods for providing a direct marketing campaign planning environment |
| US8660872B1 (en) * | 2012-10-18 | 2014-02-25 | BoomTown, LLC | Systems and method for prioritizing real estate opportunities in a lead handling system based on lead quality and opportunity scores |
| US8688497B2 (en) | 2011-01-10 | 2014-04-01 | Sas Institute Inc. | Systems and methods for determining pack allocations |
| US8732004B1 (en) | 2004-09-22 | 2014-05-20 | Experian Information Solutions, Inc. | Automated analysis of data to generate prospect notifications based on trigger events |
| US8788315B2 (en) | 2011-01-10 | 2014-07-22 | Sas Institute Inc. | Systems and methods for determining pack allocations |
| US8793146B2 (en) | 2001-12-31 | 2014-07-29 | Genworth Holdings, Inc. | System for rule-based insurance underwriting suitable for use by an automated system |
| US8812338B2 (en) | 2008-04-29 | 2014-08-19 | Sas Institute Inc. | Computer-implemented systems and methods for pack optimization |
| US8966649B2 (en) | 2009-05-11 | 2015-02-24 | Experian Marketing Solutions, Inc. | Systems and methods for providing anonymized user profile data |
| US8990188B2 (en) | 2012-11-30 | 2015-03-24 | Apple Inc. | Managed assessment of submitted digital content |
| US20150134407A1 (en) * | 2013-11-11 | 2015-05-14 | Poplicus Inc. | Organization and contract scoring for procurement opportunities |
| US9076176B2 (en) | 2008-05-05 | 2015-07-07 | Apple Inc. | Electronic submission of application programs for network-based distribution |
| US9087341B2 (en) | 2013-01-11 | 2015-07-21 | Apple Inc. | Migration of feedback data to equivalent digital assets |
| US9152727B1 (en) | 2010-08-23 | 2015-10-06 | Experian Marketing Solutions, Inc. | Systems and methods for processing consumer information for targeted marketing applications |
| US9203624B2 (en) | 2012-06-04 | 2015-12-01 | Apple Inc. | Authentication and notification heuristics |
| US9406068B2 (en) | 2003-04-25 | 2016-08-02 | Apple Inc. | Method and system for submitting media for network-based purchase and distribution |
| US9582507B2 (en) | 2003-04-25 | 2017-02-28 | Apple Inc. | Network based purchase and distribution of media |
| US9767309B1 (en) | 2015-11-23 | 2017-09-19 | Experian Information Solutions, Inc. | Access control system for implementing access restrictions of regulated database records while identifying and providing indicators of regulated database records matching validation criteria |
| US10339574B2 (en) | 2008-05-05 | 2019-07-02 | Apple Inc. | Software program ratings |
| US10402757B1 (en) * | 2007-03-16 | 2019-09-03 | Devfactory Fz-Llc | System and method for outsourcing projects |
| US10678894B2 (en) | 2016-08-24 | 2020-06-09 | Experian Information Solutions, Inc. | Disambiguation and authentication of device users |
| US10810605B2 (en) | 2004-06-30 | 2020-10-20 | Experian Marketing Solutions, Llc | System, method, software and data structure for independent prediction of attitudinal and message responsiveness, and preferences for communication media, channel, timing, frequency, and sequences of communications, using an integrated data repository |
| US11257117B1 (en) | 2014-06-25 | 2022-02-22 | Experian Information Solutions, Inc. | Mobile device sighting location analytics and profiling system |
| US11682041B1 (en) | 2020-01-13 | 2023-06-20 | Experian Marketing Solutions, Llc | Systems and methods of a tracking analytics platform |
Families Citing this family (2)
| Publication number | Priority date | Publication date | Assignee | Title |
|---|---|---|---|---|
| EP1285381A1 (en) * | 2000-05-22 | 2003-02-26 | Adaytum Software, Inc. | Revenue forecasting and sales force management using statistical analysis |
| US7130822B1 (en) | 2000-07-31 | 2006-10-31 | Cognos Incorporated | Budget planning |
Citations (13)
| Publication number | Priority date | Publication date | Assignee | Title |
|---|---|---|---|---|
| US4937439A (en) * | 1988-05-13 | 1990-06-26 | National Computer Systems, Inc. | Method and system for creating and scanning a customized survey form |
| US5041972A (en) * | 1988-04-15 | 1991-08-20 | Frost W Alan | Method of measuring and evaluating consumer response for the development of consumer products |
| US5063506A (en) * | 1989-10-23 | 1991-11-05 | International Business Machines Corp. | Cost optimization system for supplying parts |
| US5084819A (en) * | 1988-11-10 | 1992-01-28 | Response Technologies Inc. | Data collection, analysis, and response system and method |
| US5101352A (en) * | 1989-06-29 | 1992-03-31 | Carolina Cipher | Material requirements planning system |
| US5148365A (en) * | 1989-08-15 | 1992-09-15 | Dembo Ron S | Scenario optimization |
| US5191525A (en) * | 1990-01-16 | 1993-03-02 | Digital Image Systems, Corporation | System and method for extraction of data from documents for subsequent processing |
| US5198642A (en) * | 1990-03-06 | 1993-03-30 | Deniger David B | Response form processing system |
| US5208765A (en) * | 1990-07-20 | 1993-05-04 | Advanced Micro Devices, Inc. | Computer-based method and system for product development |
| US5216593A (en) * | 1991-01-24 | 1993-06-01 | International Business Machines Corporation | Method and apparatus for discrete activity resourse allocation through cardinality constraint generation |
| US5241464A (en) * | 1990-08-17 | 1993-08-31 | Moore Business Forms, Inc. | Desktop forms order system |
| US5406477A (en) * | 1991-08-30 | 1995-04-11 | Digital Equipment Corporation | Multiple reasoning and result reconciliation for enterprise analysis |
| US5496175A (en) * | 1991-02-01 | 1996-03-05 | Hitachi, Ltd. | Questionnaire system |
-
1994
- 1994-03-14 US US08/209,471 patent/US5627973A/en not_active Expired - Fee Related
- 1994-03-18 CA CA002119399A patent/CA2119399A1/en not_active Abandoned
Patent Citations (13)
| Publication number | Priority date | Publication date | Assignee | Title |
|---|---|---|---|---|
| US5041972A (en) * | 1988-04-15 | 1991-08-20 | Frost W Alan | Method of measuring and evaluating consumer response for the development of consumer products |
| US4937439A (en) * | 1988-05-13 | 1990-06-26 | National Computer Systems, Inc. | Method and system for creating and scanning a customized survey form |
| US5084819A (en) * | 1988-11-10 | 1992-01-28 | Response Technologies Inc. | Data collection, analysis, and response system and method |
| US5101352A (en) * | 1989-06-29 | 1992-03-31 | Carolina Cipher | Material requirements planning system |
| US5148365A (en) * | 1989-08-15 | 1992-09-15 | Dembo Ron S | Scenario optimization |
| US5063506A (en) * | 1989-10-23 | 1991-11-05 | International Business Machines Corp. | Cost optimization system for supplying parts |
| US5191525A (en) * | 1990-01-16 | 1993-03-02 | Digital Image Systems, Corporation | System and method for extraction of data from documents for subsequent processing |
| US5198642A (en) * | 1990-03-06 | 1993-03-30 | Deniger David B | Response form processing system |
| US5208765A (en) * | 1990-07-20 | 1993-05-04 | Advanced Micro Devices, Inc. | Computer-based method and system for product development |
| US5241464A (en) * | 1990-08-17 | 1993-08-31 | Moore Business Forms, Inc. | Desktop forms order system |
| US5216593A (en) * | 1991-01-24 | 1993-06-01 | International Business Machines Corporation | Method and apparatus for discrete activity resourse allocation through cardinality constraint generation |
| US5496175A (en) * | 1991-02-01 | 1996-03-05 | Hitachi, Ltd. | Questionnaire system |
| US5406477A (en) * | 1991-08-30 | 1995-04-11 | Digital Equipment Corporation | Multiple reasoning and result reconciliation for enterprise analysis |
Cited By (262)
| Publication number | Priority date | Publication date | Assignee | Title |
|---|---|---|---|---|
| US6161101A (en) * | 1994-12-08 | 2000-12-12 | Tech-Metrics International, Inc. | Computer-aided methods and apparatus for assessing an organization process or system |
| US6092060A (en) * | 1994-12-08 | 2000-07-18 | Tech-Metrics International, Inc. | Computer-aided methods and apparatus for assessing an organizational process or system |
| US5765138A (en) * | 1995-08-23 | 1998-06-09 | Bell Atlantic Network Services, Inc. | Apparatus and method for providing interactive evaluation of potential vendors |
| US20110264486A1 (en) * | 1995-10-30 | 2011-10-27 | Jerome Dale Johnson | Sales force automation system and method |
| US8271355B2 (en) | 1995-10-30 | 2012-09-18 | Sfa Systems, Llc | Sales force automation system and method |
| US7941341B2 (en) | 1995-10-30 | 2011-05-10 | Sfa Systems, Llc | Sales force automation system and method |
| US20090248479A1 (en) * | 1995-10-30 | 2009-10-01 | Sfa System, Llc | Sales force automation system and method |
| US5893904A (en) * | 1996-06-14 | 1999-04-13 | Electronic Data Systems Corporation | System and method for brokering the allocation of an item of business property |
| US6820060B1 (en) * | 1996-06-24 | 2004-11-16 | Jack Eisner | Apparatus for generating sales probability |
| US6253186B1 (en) * | 1996-08-14 | 2001-06-26 | Blue Cross Blue Shield Of South Carolina | Method and apparatus for detecting fraud |
| US6574621B1 (en) * | 1997-09-23 | 2003-06-03 | Unisys Corporation | Survey analysis system and method |
| US6014633A (en) * | 1997-09-24 | 2000-01-11 | Deroyal Business Systems, L.L.C. | Method for the analysis and standardization of bills of resources |
| US7054827B1 (en) * | 1997-09-24 | 2006-05-30 | Unisys Corporation | Method and apparatus for validating a survey database |
| US6119098A (en) * | 1997-10-14 | 2000-09-12 | Patrice D. Guyot | System and method for targeting and distributing advertisements over a distributed network |
| US6895386B1 (en) * | 1997-10-15 | 2005-05-17 | Citibank, N.A. | Stock credit card |
| US6925441B1 (en) * | 1997-10-27 | 2005-08-02 | Marketswitch Corp. | System and method of targeted marketing |
| US6008817A (en) * | 1997-12-31 | 1999-12-28 | Comparative Visual Assessments, Inc. | Comparative visual assessment system and method |
| WO1999034313A3 (en) * | 1997-12-31 | 1999-08-19 | Comparative Visual Assessments | Comparative visual assessment method & system |
| WO1999059096A1 (en) * | 1998-05-13 | 1999-11-18 | Customer Cast, Inc. | Customer survey system and method |
| US6301471B1 (en) | 1998-11-02 | 2001-10-09 | Openwave System Inc. | Online churn reduction and loyalty system |
| US6597903B1 (en) | 1998-11-02 | 2003-07-22 | Openwave Systems Inc. | Online churn reduction and loyalty system |
| US6741967B1 (en) | 1998-11-02 | 2004-05-25 | Vividence Corporation | Full service research bureau and test center method and apparatus |
| WO2000026836A3 (en) * | 1998-11-02 | 2000-10-05 | Vividence Corp | Full-service research bureau and test center method and apparatus |
| AU759270B2 (en) * | 1998-11-02 | 2003-04-10 | Vividence Corporation | Full-service research bureau and test center method and apparatus |
| US7451106B1 (en) | 1998-11-30 | 2008-11-11 | E-Lynxx Corporation | System and method for competitive pricing and procurement of customized goods and services |
| US20090125415A1 (en) * | 1998-11-30 | 2009-05-14 | E-Lynxx Corporation | System and method for competitive pricing and procurement of customized goods and services |
| US7788143B2 (en) | 1998-11-30 | 2010-08-31 | E-Lynxx Corporation | System and method for competitive pricing and procurement of customized goods and services |
| US20100325010A1 (en) * | 1998-11-30 | 2010-12-23 | E-Lynxx Corporation | System And Method For Competitive Pricing And Procurement Of Customized Goods And Services |
| US8209227B2 (en) | 1998-11-30 | 2012-06-26 | E-Lynxx Corporation | System and method for competitive pricing and procurement of customized goods and services |
| US10289663B2 (en) | 1998-12-14 | 2019-05-14 | Robolaw Corporation | Method and system for formation of electronic documents |
| WO2000041114A1 (en) * | 1999-01-04 | 2000-07-13 | David Saul Glass | Environmental impact and business analysis method using a strategic information system |
| US6501473B1 (en) * | 1999-03-18 | 2002-12-31 | Lucent Technologies Inc. | Method and system for theory of constraints buffer graphing, tracking and management |
| WO2000077966A3 (en) * | 1999-06-15 | 2001-07-26 | Virtual Advisors L L C | System and method for internet-based business valuations |
| WO2000077966A2 (en) * | 1999-06-15 | 2000-12-21 | Virtual Advisors, L.L.C. | System and method for internet-based business valuations |
| US20070192358A1 (en) * | 1999-08-31 | 2007-08-16 | International Business Machines Corporation | Workflow management system for generating output material based on customer input |
| US8452809B2 (en) | 1999-08-31 | 2013-05-28 | International Business Machines Corporation | Workflow management system for generating output material based on customer input |
| US7302430B1 (en) | 1999-08-31 | 2007-11-27 | International Business Machines Corporation | Workflow management system for generating output material based on customer input |
| US7844569B2 (en) | 1999-09-07 | 2010-11-30 | Robolaw Corporation | Method and system for electronic negotiation of documents |
| US20130198616A1 (en) * | 1999-09-07 | 2013-08-01 | C. Douglass Thomas | Method and system for formation of electronic documents |
| US20100332974A1 (en) * | 1999-09-07 | 2010-12-30 | Thomas C Douglass | Method and System for Formation of Electronic Documents |
| US20050240529A1 (en) * | 1999-09-07 | 2005-10-27 | Thomas C Douglass | Method and system for electronic negotiation of documents |
| US6873992B1 (en) | 1999-09-07 | 2005-03-29 | Robolaw Corporation | Method and system for automated document generation |
| US7028303B2 (en) | 1999-09-17 | 2006-04-11 | International Business Machines Corporation | Method, system, and program for processing a job in an event driven workflow environment |
| US20030154115A1 (en) * | 1999-09-17 | 2003-08-14 | International Business Machine Corporation | Method, system, and program for processing a job in an event driven workflow environment |
| US7171373B2 (en) | 1999-10-21 | 2007-01-30 | International Business Machines Corporation | Database driven workflow management system for generating output material based on customer input |
| US20050228711A1 (en) * | 1999-10-21 | 2005-10-13 | International Business Machines Corporation | Database driven workflow management system for generating output material based on customer input |
| US20060173905A1 (en) * | 1999-10-21 | 2006-08-03 | International Business Machines Corporation | Database Driven Workflow Management System for Generating Output Material Based on Customer Input |
| US7499867B2 (en) | 1999-10-21 | 2009-03-03 | Infoprint Solutions Company Llc | Database driven workflow management system for generating output material based on customer input |
| US7058197B1 (en) | 1999-11-04 | 2006-06-06 | Board Of Trustees Of The University Of Illinois | Multi-variable model for identifying crop response zones in a field |
| US20050102394A1 (en) * | 2000-01-21 | 2005-05-12 | Loveland James B. | Automated task management and evaluation |
| US6810383B1 (en) * | 2000-01-21 | 2004-10-26 | Xactware, Inc. | Automated task management and evaluation |
| US7113914B1 (en) | 2000-04-07 | 2006-09-26 | Jpmorgan Chase Bank, N.A. | Method and system for managing risks |
| US20020123958A1 (en) * | 2000-06-07 | 2002-09-05 | Yoshinobu Hara | Business partner overall power judging system |
| US6915266B1 (en) * | 2000-07-31 | 2005-07-05 | Aysha Saeed | Method and system for providing evaluation data from tracked, formatted administrative data of a service provider |
| WO2002065232A2 (en) * | 2000-11-10 | 2002-08-22 | The Procter & Gamble Company | Method and system for facilitating assessments |
| WO2002065232A3 (en) * | 2000-11-10 | 2004-03-25 | Procter & Gamble | Method and system for facilitating assessments |
| US20020072953A1 (en) * | 2000-12-08 | 2002-06-13 | Michlowitz Eric S. | Process, a method, a system and software architecture for evaluating supplier performance |
| US20020161602A1 (en) * | 2001-01-27 | 2002-10-31 | Dougherty Karen Ann | Methods and systems for identifying prospective customers and managing deals |
| US7430535B2 (en) | 2001-01-27 | 2008-09-30 | General Electric Capital Corporation | Methods and systems for identifying prospective customers and managing deals |
| US20020103689A1 (en) * | 2001-01-27 | 2002-08-01 | Hornick Randall F. | Methods and systems for identifying prospective customers and managing deals |
| US20020169650A1 (en) * | 2001-01-27 | 2002-11-14 | Dougherty Karen Ann | Methods and systems for identifying prospective customers and managing deals |
| US20020107778A1 (en) * | 2001-02-08 | 2002-08-08 | Sean Daly | Methods and systems for funding purchase transactions |
| US7801757B2 (en) | 2001-02-14 | 2010-09-21 | Teradata Us, Inc. | Computer implemented customer value model in airline industry |
| US20020138332A1 (en) * | 2001-02-14 | 2002-09-26 | Ncr Corporation | Computer implemented customer value model in airline industry |
| US7693738B2 (en) | 2001-03-22 | 2010-04-06 | Guinta Lawrence R | Computer-aided methods and apparatus for assessing an organizational process or system |
| US20020137015A1 (en) * | 2001-03-22 | 2002-09-26 | Guinta Lawrence R. | Computer-aided methods and apparatus for assessing an organizational process or system |
| US20020143606A1 (en) * | 2001-03-30 | 2002-10-03 | International Business Machines Corporation | Method and system for assessing information technology service delivery |
| US7406430B2 (en) * | 2001-03-30 | 2008-07-29 | International Business Machines Corporation | Method and system for assessing information technology service delivery |
| US20020194055A1 (en) * | 2001-04-26 | 2002-12-19 | Honda Giken Kogyo Kabushiki Kaisha | Computer system for analyzing customer needs |
| US20020194127A1 (en) * | 2001-04-30 | 2002-12-19 | Randell Wayne L. | Method and system for processing invoices |
| US20020194126A1 (en) * | 2001-04-30 | 2002-12-19 | Randell Wayne L. | Method and system for handling invoices |
| US20060259427A1 (en) * | 2001-05-01 | 2006-11-16 | Randell Wayne L | Method and system for handling disputes in an electronic invoice management system |
| US20020187829A1 (en) * | 2001-06-07 | 2002-12-12 | Takashi Hasegawa | Cooperation service method of contents viewing/listening and an attraction, and contents receiver and attraction system which are used for this method |
| US7047208B1 (en) * | 2001-08-16 | 2006-05-16 | Honda Motor Co., Ltd. | System and method for detecting supplier instability |
| US7711595B2 (en) | 2001-08-28 | 2010-05-04 | International Business Machines Corporation | Method and system for generating a value proposition for a company in an industry |
| US20030046137A1 (en) * | 2001-08-28 | 2003-03-06 | International Business Machines Corporation | Method and system for generating a value proposition for a company in an industry |
| US20030139970A1 (en) * | 2001-08-31 | 2003-07-24 | Badura Teresa B. | Electronic method for determining procurement business strategy |
| US20030046217A1 (en) * | 2001-09-06 | 2003-03-06 | Deaderick Barry Thomas | Procurement negotiation method |
| US20030050830A1 (en) * | 2001-09-13 | 2003-03-13 | William Troyer | Method and apparatus for evaluating relative performance of a business in an association of the same or similar businesses |
| US20040172322A1 (en) * | 2001-10-16 | 2004-09-02 | I2 Technologies Us, Inc. | Providing decision support through visualization of participant past performance in an electronic commerce environment |
| US7620566B2 (en) * | 2001-10-16 | 2009-11-17 | I2 Technologies Us, Inc. | Providing decision support through visualization of participant past performance in an electronic commerce environment |
| US20030101117A1 (en) * | 2001-11-29 | 2003-05-29 | International Business Machines Coproation | Generating contract requirements for software suppliers based upon assessing the quality levels of quality attributes of the suppliers |
| US7899688B2 (en) | 2001-12-31 | 2011-03-01 | Genworth Financial, Inc. | Process for optimization of insurance underwriting suitable for use by an automated system |
| US20030187702A1 (en) * | 2001-12-31 | 2003-10-02 | Bonissone Piero Patrone | System for optimization of insurance underwriting suitable for use by an automated system |
| WO2003058383A3 (en) * | 2001-12-31 | 2005-03-10 | Ge Financial Assurance Holding | Process for optimization of insurance underwriting suitable for use by an automated system |
| US7818186B2 (en) | 2001-12-31 | 2010-10-19 | Genworth Financial, Inc. | System for determining a confidence factor for insurance underwriting suitable for use by an automated system |
| US7895062B2 (en) | 2001-12-31 | 2011-02-22 | Genworth Financial, Inc. | System for optimization of insurance underwriting suitable for use by an automated system |
| US8005693B2 (en) | 2001-12-31 | 2011-08-23 | Genworth Financial, Inc. | Process for determining a confidence factor for insurance underwriting suitable for use by an automated system |
| WO2003058383A2 (en) * | 2001-12-31 | 2003-07-17 | Ge Financial Assurance Holdings, Inc. (A Richmond Corporation) | Process for optimization of insurance underwriting suitable for use by an automated system |
| US20030187701A1 (en) * | 2001-12-31 | 2003-10-02 | Bonissone Piero Patrone | Process for optimization of insurance underwriting suitable for use by an automated system |
| US7844477B2 (en) | 2001-12-31 | 2010-11-30 | Genworth Financial, Inc. | Process for rule-based insurance underwriting suitable for use by an automated system |
| US7844476B2 (en) | 2001-12-31 | 2010-11-30 | Genworth Financial, Inc. | Process for case-based insurance underwriting suitable for use by an automated system |
| US8793146B2 (en) | 2001-12-31 | 2014-07-29 | Genworth Holdings, Inc. | System for rule-based insurance underwriting suitable for use by an automated system |
| US20030140053A1 (en) * | 2002-01-21 | 2003-07-24 | Vasey Philip Edgar | Document generation |
| US9122667B2 (en) * | 2002-01-21 | 2015-09-01 | Business Integrity Limited | Partially customized document generation |
| US20030149611A1 (en) * | 2002-02-06 | 2003-08-07 | Alvin Wong | Supplier performance reporting |
| US20060111966A1 (en) * | 2002-02-06 | 2006-05-25 | Accenture Global Services Gmbh | Supplier performance reporting |
| US7010496B2 (en) * | 2002-02-06 | 2006-03-07 | Accenture Global Services Gmbh | Supplier performance reporting |
| US20030167198A1 (en) * | 2002-02-22 | 2003-09-04 | Northcott Michael B. | Identifying potential business opportunities |
| US7567917B2 (en) | 2002-03-14 | 2009-07-28 | Kenneth Miller | Product design methodology |
| US20030177081A1 (en) * | 2002-03-15 | 2003-09-18 | Woehr William A. | Method and system for selling to accounts using TOC |
| US20030229526A1 (en) * | 2002-04-04 | 2003-12-11 | Gallacci Jeffery K. | Computer-implemented system and method for assessing supply chain solutions |
| US20040093296A1 (en) * | 2002-04-30 | 2004-05-13 | Phelan William L. | Marketing optimization system |
| US7904327B2 (en) | 2002-04-30 | 2011-03-08 | Sas Institute Inc. | Marketing optimization system |
| US20040220824A1 (en) * | 2002-06-17 | 2004-11-04 | Hiroaki Imai | Method and apparatus for providing services in recycling products |
| US20040133462A1 (en) * | 2002-09-05 | 2004-07-08 | Smith Claude D. | Computer system and method for producing integrated product forecasts |
| US20040064375A1 (en) * | 2002-09-30 | 2004-04-01 | Randell Wayne L. | Method and system for generating account reconciliation data |
| US20040073496A1 (en) * | 2002-09-30 | 2004-04-15 | Marc-David Cohen | Computer-implemented offer optimization system and method |
| US20090204519A1 (en) * | 2002-09-30 | 2009-08-13 | Canadian National Railway Company | Method and system for generating account reconciliation data |
| US7536325B2 (en) | 2002-09-30 | 2009-05-19 | Canadian National Railway Company | Method and system for generating account reconciliation data |
| US20080208679A1 (en) * | 2002-12-18 | 2008-08-28 | Baumann Gerald W | System and program product for selecting a supplier |
| US8055520B2 (en) | 2002-12-18 | 2011-11-08 | International Business Machines Corporation | System and program product for selecting a lower cost supplier based on total cost and forecasted demand |
| US20040122718A1 (en) * | 2002-12-18 | 2004-06-24 | International Business Machines Corporation | Method, system and program product for selecting a supplier |
| US7389248B2 (en) | 2002-12-18 | 2008-06-17 | International Business Machines Corporation | System, method, and program product for selecting a lower cost supplier based on total cost and forecasted demand |
| US20040186748A1 (en) * | 2003-03-18 | 2004-09-23 | Spx Corporation | Method and apparatus for automating multi-national insurance information requests |
| US7933784B2 (en) * | 2003-03-18 | 2011-04-26 | Spx Corporation | Method and apparatus for automating multi-national insurance information requests |
| US9406068B2 (en) | 2003-04-25 | 2016-08-02 | Apple Inc. | Method and system for submitting media for network-based purchase and distribution |
| US9582507B2 (en) | 2003-04-25 | 2017-02-28 | Apple Inc. | Network based purchase and distribution of media |
| US8214314B2 (en) | 2003-04-30 | 2012-07-03 | Genworth Financial, Inc. | System and process for a fusion classification for insurance underwriting suitable for use by an automated system |
| US20090048876A1 (en) * | 2003-04-30 | 2009-02-19 | Piero Patrone Bonissone | System and process for a fusion classification for insurance underwriting suitable for use by an automated system |
| US7813945B2 (en) | 2003-04-30 | 2010-10-12 | Genworth Financial, Inc. | System and process for multivariate adaptive regression splines classification for insurance underwriting suitable for use by an automated system |
| US7801748B2 (en) | 2003-04-30 | 2010-09-21 | Genworth Financial, Inc. | System and process for detecting outliers for insurance underwriting suitable for use by an automated system |
| US20100191663A1 (en) * | 2003-05-28 | 2010-07-29 | Gross John N | Method of testing item availability and delivery performance of an e-commerce site |
| US8249955B2 (en) * | 2003-05-28 | 2012-08-21 | John Nicholas Gross | Method of testing item availability and delivery performance of an e-commerce site |
| WO2005017679A2 (en) * | 2003-08-05 | 2005-02-24 | Abrw Associates, Inc. | Contractor certification system |
| WO2005017679A3 (en) * | 2003-08-05 | 2005-05-12 | Abrw Associates Inc | Contractor certification system |
| US8499009B2 (en) * | 2003-08-05 | 2013-07-30 | Flexera Software Llc | Method and system for managing digital goods |
| US20120144381A1 (en) * | 2003-08-05 | 2012-06-07 | James Brentano | Method and system for managing digital goods |
| US20050033628A1 (en) * | 2003-08-05 | 2005-02-10 | Alverson David J. | Contractor certification system |
| US8359348B2 (en) | 2003-10-15 | 2013-01-22 | Apple Inc. | Techniques and systems for electronic submission of media for network-based distribution |
| US20110072161A1 (en) * | 2003-10-15 | 2011-03-24 | Gregory Robbin | Techniques and Systems for Electronic Submission of Media for Network-based Distribution |
| US20110035353A1 (en) * | 2003-10-17 | 2011-02-10 | Bailey Christopher D | Computer-Implemented Multidimensional Database Processing Method And System |
| US8065262B2 (en) | 2003-10-17 | 2011-11-22 | Sas Institute Inc. | Computer-implemented multidimensional database processing method and system |
| US7472080B2 (en) | 2003-10-24 | 2008-12-30 | Sachin Goel | Methods and associated systems for an airline to enhance customer experience and provide options on flights |
| US7983956B1 (en) | 2003-10-24 | 2011-07-19 | Sachin Goel | System and method for providing options on products including flights |
| US7418409B1 (en) | 2003-10-24 | 2008-08-26 | Sachin Goel | System for concurrent optimization of business economics and customer value satisfaction |
| US8145535B2 (en) | 2003-10-24 | 2012-03-27 | Sachin Goel | Computer implemented methods for providing options on products |
| US8275667B1 (en) | 2003-10-24 | 2012-09-25 | Sachin Goel | System for concurrent optimization of business economics and customer value satisfaction |
| US20080052185A1 (en) * | 2003-10-24 | 2008-02-28 | Sachin Goel | System for concurrent optimization of business economics and customer value |
| US8145536B1 (en) | 2003-10-24 | 2012-03-27 | Sachin Goel | System for concurrent optimization of business economics and customer value |
| US20080262899A1 (en) * | 2003-10-24 | 2008-10-23 | Sachin Goel | System for concurrent optimization of business economics and customer value |
| US8140399B1 (en) | 2003-10-24 | 2012-03-20 | Sachin Goel | System for concurrent optimization of business economics and customer value |
| US20080270222A1 (en) * | 2003-10-24 | 2008-10-30 | Sachin Goel | System for concurrent optimization of business economics and customer value |
| US20070244766A1 (en) * | 2003-10-24 | 2007-10-18 | Sachin Goel | System for concurrent optimization of business economics and customer value |
| US8165920B2 (en) | 2003-10-24 | 2012-04-24 | Sachin Goel | System for concurrent optimization of business economics and customer value |
| US7698159B2 (en) | 2004-02-13 | 2010-04-13 | Genworth Financial Inc. | Systems and methods for performing data collection |
| US20050209907A1 (en) * | 2004-03-17 | 2005-09-22 | Williams Gary A | 3-D customer demand rating method and apparatus |
| US20060005181A1 (en) * | 2004-04-15 | 2006-01-05 | International Business Machines Corporation | System and method for dynamically building application environments in a computational grid |
| US9471380B2 (en) * | 2004-04-15 | 2016-10-18 | International Business Machines Corporation | Dynamically building application environments in a computational grid |
| US8966473B2 (en) | 2004-04-15 | 2015-02-24 | International Business Machines Corporation | Dynamically building application environments in a computational grid |
| US20150127506A1 (en) * | 2004-04-15 | 2015-05-07 | International Business Machines Corporation | Dynamically Building Application Environments in a Computational Grid |
| US8458691B2 (en) | 2004-04-15 | 2013-06-04 | International Business Machines Corporation | System and method for dynamically building application environments in a computational grid |
| US20050234937A1 (en) * | 2004-04-15 | 2005-10-20 | International Business Machines Corporation | System and method for rating performance of computing grid service providers |
| US20050288990A1 (en) * | 2004-06-24 | 2005-12-29 | International Business Machines Corporation | Computer-implemented method, system and program product for modeling a consumer decision process |
| US11657411B1 (en) | 2004-06-30 | 2023-05-23 | Experian Marketing Solutions, Llc | System, method, software and data structure for independent prediction of attitudinal and message responsiveness, and preferences for communication media, channel, timing, frequency, and sequences of communications, using an integrated data repository |
| US10810605B2 (en) | 2004-06-30 | 2020-10-20 | Experian Marketing Solutions, Llc | System, method, software and data structure for independent prediction of attitudinal and message responsiveness, and preferences for communication media, channel, timing, frequency, and sequences of communications, using an integrated data repository |
| US8732004B1 (en) | 2004-09-22 | 2014-05-20 | Experian Information Solutions, Inc. | Automated analysis of data to generate prospect notifications based on trigger events |
| US11373261B1 (en) | 2004-09-22 | 2022-06-28 | Experian Information Solutions, Inc. | Automated analysis of data to generate prospect notifications based on trigger events |
| US11861756B1 (en) | 2004-09-22 | 2024-01-02 | Experian Information Solutions, Inc. | Automated analysis of data to generate prospect notifications based on trigger events |
| US11562457B2 (en) | 2004-09-22 | 2023-01-24 | Experian Information Solutions, Inc. | Automated analysis of data to generate prospect notifications based on trigger events |
| US10586279B1 (en) | 2004-09-22 | 2020-03-10 | Experian Information Solutions, Inc. | Automated analysis of data to generate prospect notifications based on trigger events |
| US20080215419A1 (en) * | 2004-11-15 | 2008-09-04 | International Business Machines Corporation | Method, system, and storage medium for implementing a multi-stage, multi-classification sales opportunity modeling system |
| US20080183761A1 (en) * | 2005-02-25 | 2008-07-31 | International Business Machines Corporation | Method and Computer Program Product for Dynamic Weighting of an Ontological Data Model |
| US20080256134A1 (en) * | 2005-02-25 | 2008-10-16 | International Business Machines Corporation | Method and Computer Program Product for Dynamic Weighting of an Ontological Data Model |
| US7844635B2 (en) | 2005-02-25 | 2010-11-30 | International Business Machines Corporation | Method and computer program product for dynamic weighting of an ontological data model |
| US7392258B2 (en) | 2005-02-25 | 2008-06-24 | International Business Machines Corporation | Method and computer program product for dynamic weighting of an ontological data model |
| US8131771B2 (en) | 2005-02-25 | 2012-03-06 | International Business Machines Corporation | Method and computer program product for dynamic weighting of an ontological data model |
| US20060195332A1 (en) * | 2005-02-28 | 2006-08-31 | International Business Machines Corporation | Method and computer program product for generating a lightweight ontological data model |
| US7809754B2 (en) | 2005-02-28 | 2010-10-05 | International Business Machines Corporation | Method and computer program product for generating a lightweight ontological data model |
| US20060229957A1 (en) * | 2005-04-06 | 2006-10-12 | International Business Machines Corporation | System and method for evaluating potential suppliers |
| US20130246229A1 (en) * | 2005-07-19 | 2013-09-19 | Michael C. Mountz | Method and system for storing inventory holders |
| US9582783B2 (en) * | 2005-07-19 | 2017-02-28 | Amazon Technologies, Inc. | Method and system for storing inventory holders |
| US7624054B2 (en) | 2005-08-25 | 2009-11-24 | Sas Institute Inc. | Financial risk mitigation optimization systems and methods |
| US20070050282A1 (en) * | 2005-08-25 | 2007-03-01 | Sas Institute Inc. | Financial risk mitigation optimization systems and methods |
| US7634431B2 (en) | 2006-03-08 | 2009-12-15 | Sas Institute Inc. | Systems and methods for costing reciprocal relationships |
| US20070226090A1 (en) * | 2006-03-08 | 2007-09-27 | Sas Institute Inc. | Systems and methods for costing reciprocal relationships |
| US8880712B2 (en) | 2006-05-15 | 2014-11-04 | Apple Inc. | Submission of metadata content and media content to a media distribution system |
| US20110004594A1 (en) * | 2006-05-15 | 2011-01-06 | Jason Robert Suitts | Media Package Format for Submission to a Media Distribution System |
| US20110238631A1 (en) * | 2006-05-15 | 2011-09-29 | Ricardo Cortes | Submission of metadata content and media content to a media distribution system |
| US8473479B2 (en) | 2006-05-15 | 2013-06-25 | Apple Inc. | Media package format for submission to a media distribution system |
| US8370419B2 (en) | 2006-05-15 | 2013-02-05 | Apple Inc. | Processing of metadata content and digital content received by a media distribution system |
| US20070265969A1 (en) * | 2006-05-15 | 2007-11-15 | Apple Computer, Inc. | Computerized management of media distribution agreements |
| US8635599B2 (en) * | 2006-08-18 | 2014-01-21 | International Business Machines Corporation | System and method for evaluating adherence to a standardized process |
| US20080046859A1 (en) * | 2006-08-18 | 2008-02-21 | Samantha Pineda Velarde | System and method for evaluating adherence to a standardized process |
| US20080065435A1 (en) * | 2006-08-25 | 2008-03-13 | John Phillip Ratzloff | Computer-implemented systems and methods for reducing cost flow models |
| US7813948B2 (en) | 2006-08-25 | 2010-10-12 | Sas Institute Inc. | Computer-implemented systems and methods for reducing cost flow models |
| US20080082458A1 (en) * | 2006-09-29 | 2008-04-03 | International Business Machines Corporation | Client Savings Modeling Tool |
| US20080091514A1 (en) * | 2006-10-17 | 2008-04-17 | International Business Machines Corporation | Determining an Executable Growth Strategy |
| US20080140514A1 (en) * | 2006-12-11 | 2008-06-12 | Grant Thornton Llp | Method and system for risk evaluation and management |
| US10311466B1 (en) | 2007-01-31 | 2019-06-04 | Experian Information Solutions, Inc. | Systems and methods for providing a direct marketing campaign planning environment |
| US10692105B1 (en) | 2007-01-31 | 2020-06-23 | Experian Information Solutions, Inc. | Systems and methods for providing a direct marketing campaign planning environment |
| US9916596B1 (en) | 2007-01-31 | 2018-03-13 | Experian Information Solutions, Inc. | Systems and methods for providing a direct marketing campaign planning environment |
| US11803873B1 (en) | 2007-01-31 | 2023-10-31 | Experian Information Solutions, Inc. | Systems and methods for providing a direct marketing campaign planning environment |
| US9508092B1 (en) | 2007-01-31 | 2016-11-29 | Experian Information Solutions, Inc. | Systems and methods for providing a direct marketing campaign planning environment |
| US8606626B1 (en) | 2007-01-31 | 2013-12-10 | Experian Information Solutions, Inc. | Systems and methods for providing a direct marketing campaign planning environment |
| US11176570B1 (en) | 2007-01-31 | 2021-11-16 | Experian Information Solutions, Inc. | Systems and methods for providing a direct marketing campaign planning environment |
| US10402757B1 (en) * | 2007-03-16 | 2019-09-03 | Devfactory Fz-Llc | System and method for outsourcing projects |
| US10984353B1 (en) * | 2007-03-16 | 2021-04-20 | Devfactory Innovations Fz-Llc | System and method for outsourcing projects |
| US8000996B1 (en) | 2007-04-10 | 2011-08-16 | Sas Institute Inc. | System and method for markdown optimization |
| US8738515B2 (en) | 2007-04-12 | 2014-05-27 | Experian Marketing Solutions, Inc. | Systems and methods for determining thin-file records and determining thin-file risk levels |
| US20100299246A1 (en) * | 2007-04-12 | 2010-11-25 | Experian Marketing Solutions, Inc. | Systems and methods for determining thin-file records and determining thin-file risk levels |
| US8024264B2 (en) | 2007-04-12 | 2011-09-20 | Experian Marketing Solutions, Inc. | Systems and methods for determining thin-file records and determining thin-file risk levels |
| US8271378B2 (en) | 2007-04-12 | 2012-09-18 | Experian Marketing Solutions, Inc. | Systems and methods for determining thin-file records and determining thin-file risk levels |
| US8160917B1 (en) | 2007-04-13 | 2012-04-17 | Sas Institute Inc. | Computer-implemented promotion optimization methods and systems |
| US20090018880A1 (en) * | 2007-07-13 | 2009-01-15 | Bailey Christopher D | Computer-Implemented Systems And Methods For Cost Flow Analysis |
| US8024241B2 (en) | 2007-07-13 | 2011-09-20 | Sas Institute Inc. | Computer-implemented systems and methods for cost flow analysis |
| US7930200B1 (en) | 2007-11-02 | 2011-04-19 | Sas Institute Inc. | Computer-implemented systems and methods for cross-price analysis |
| US7962404B1 (en) | 2007-11-07 | 2011-06-14 | Experian Information Solutions, Inc. | Systems and methods for determining loan opportunities |
| US9058340B1 (en) | 2007-11-19 | 2015-06-16 | Experian Marketing Solutions, Inc. | Service for associating network users with profiles |
| US7996521B2 (en) | 2007-11-19 | 2011-08-09 | Experian Marketing Solutions, Inc. | Service for mapping IP addresses to user segments |
| US20090129377A1 (en) * | 2007-11-19 | 2009-05-21 | Simon Chamberlain | Service for mapping ip addresses to user segments |
| US8533322B2 (en) | 2007-11-19 | 2013-09-10 | Experian Marketing Solutions, Inc. | Service for associating network users with profiles |
| US8200518B2 (en) | 2008-02-25 | 2012-06-12 | Sas Institute Inc. | Computer-implemented systems and methods for partial contribution computation in ABC/M models |
| US20090222343A1 (en) * | 2008-02-28 | 2009-09-03 | Palo Alto Research Center Incorporated | Incentive mechanism for developing activity-based triggers of advertisement presentation |
| US8812338B2 (en) | 2008-04-29 | 2014-08-19 | Sas Institute Inc. | Computer-implemented systems and methods for pack optimization |
| US10339574B2 (en) | 2008-05-05 | 2019-07-02 | Apple Inc. | Software program ratings |
| US10255580B2 (en) | 2008-05-05 | 2019-04-09 | Apple Inc. | Network-based distribution of application products |
| US20090276332A1 (en) * | 2008-05-05 | 2009-11-05 | Sam Gharabally | Network-based distribution of application products |
| US9076176B2 (en) | 2008-05-05 | 2015-07-07 | Apple Inc. | Electronic submission of application programs for network-based distribution |
| US20090307683A1 (en) * | 2008-06-08 | 2009-12-10 | Sam Gharabally | Network-Based Update of Application Programs |
| US20090307682A1 (en) * | 2008-06-08 | 2009-12-10 | Sam Gharabally | Techniques for Acquiring Updates for Application Programs |
| US8296182B2 (en) | 2008-08-20 | 2012-10-23 | Sas Institute Inc. | Computer-implemented marketing optimization systems and methods |
| US20100049535A1 (en) * | 2008-08-20 | 2010-02-25 | Manoj Keshavmurthi Chari | Computer-Implemented Marketing Optimization Systems And Methods |
| US20100073373A1 (en) * | 2008-09-23 | 2010-03-25 | International Business Machines Corporation | System and method to model application maturity |
| US20100235254A1 (en) * | 2009-03-16 | 2010-09-16 | Payam Mirrashidi | Application Products with In-Application Subsequent Feature Access Using Network-Based Distribution System |
| US20100235889A1 (en) * | 2009-03-16 | 2010-09-16 | Michael Kuohao Chu | Application products with in-application subsequent feature access using network-based distribution system |
| US8271318B2 (en) | 2009-03-26 | 2012-09-18 | Sas Institute Inc. | Systems and methods for markdown optimization when inventory pooling level is above pricing level |
| US20100250329A1 (en) * | 2009-03-26 | 2010-09-30 | Tugrul Sanli | Systems And Methods For Markdown Optimization When Inventory Pooling Level Is Above Pricing Level |
| US20130110589A1 (en) * | 2009-04-17 | 2013-05-02 | Hartford Fire Insurance Company | Processing and display of service provider performance data |
| US8966649B2 (en) | 2009-05-11 | 2015-02-24 | Experian Marketing Solutions, Inc. | Systems and methods for providing anonymized user profile data |
| US9595051B2 (en) | 2009-05-11 | 2017-03-14 | Experian Marketing Solutions, Inc. | Systems and methods for providing anonymized user profile data |
| US20100299219A1 (en) * | 2009-05-25 | 2010-11-25 | Cortes Ricardo D | Configuration and Management of Add-ons to Digital Application Programs for Network-Based Distribution |
| US20110035257A1 (en) * | 2009-08-06 | 2011-02-10 | Rajendra Singh Solanki | Systems And Methods For Generating Planograms In The Presence Of Multiple Objectives |
| US20110035508A1 (en) * | 2009-08-07 | 2011-02-10 | Jason Robert Fosback | Automatic transport discovery for media submission |
| US9729609B2 (en) | 2009-08-07 | 2017-08-08 | Apple Inc. | Automatic transport discovery for media submission |
| US8935217B2 (en) | 2009-09-08 | 2015-01-13 | Apple Inc. | Digital asset validation prior to submission for network-based distribution |
| US20110060776A1 (en) * | 2009-09-08 | 2011-03-10 | Jason Robert Suitts | Digital asset validation prior to submission for network-based distribution |
| US9152727B1 (en) | 2010-08-23 | 2015-10-06 | Experian Marketing Solutions, Inc. | Systems and methods for processing consumer information for targeted marketing applications |
| US8515835B2 (en) | 2010-08-30 | 2013-08-20 | Sas Institute Inc. | Systems and methods for multi-echelon inventory planning with lateral transshipment |
| US20120072262A1 (en) * | 2010-09-20 | 2012-03-22 | Bank Of America Corporation | Measurement System Assessment Tool |
| US8688497B2 (en) | 2011-01-10 | 2014-04-01 | Sas Institute Inc. | Systems and methods for determining pack allocations |
| US8788315B2 (en) | 2011-01-10 | 2014-07-22 | Sas Institute Inc. | Systems and methods for determining pack allocations |
| US10353693B2 (en) | 2012-06-04 | 2019-07-16 | Apple Inc. | Authentication and notification heuristics |
| US9203624B2 (en) | 2012-06-04 | 2015-12-01 | Apple Inc. | Authentication and notification heuristics |
| US9710252B2 (en) | 2012-06-04 | 2017-07-18 | Apple Inc. | Authentication and notification heuristics |
| US8660872B1 (en) * | 2012-10-18 | 2014-02-25 | BoomTown, LLC | Systems and method for prioritizing real estate opportunities in a lead handling system based on lead quality and opportunity scores |
| US8666792B1 (en) * | 2012-10-18 | 2014-03-04 | BoomTown, LLC | System and method for prioritizing real estate opportunities in a lead handling system based on weighted lead quality scores |
| US8990188B2 (en) | 2012-11-30 | 2015-03-24 | Apple Inc. | Managed assessment of submitted digital content |
| US10489734B2 (en) | 2012-11-30 | 2019-11-26 | Apple Inc. | Managed assessment of submitted digital content |
| US10459945B2 (en) | 2013-01-11 | 2019-10-29 | Apple Inc. | Migration of feedback data to equivalent digital assets |
| US9977822B2 (en) | 2013-01-11 | 2018-05-22 | Apple Inc. | Migration of feedback data to equivalent digital assets |
| US9087341B2 (en) | 2013-01-11 | 2015-07-21 | Apple Inc. | Migration of feedback data to equivalent digital assets |
| US20150134407A1 (en) * | 2013-11-11 | 2015-05-14 | Poplicus Inc. | Organization and contract scoring for procurement opportunities |
| US11257117B1 (en) | 2014-06-25 | 2022-02-22 | Experian Information Solutions, Inc. | Mobile device sighting location analytics and profiling system |
| US11620677B1 (en) | 2014-06-25 | 2023-04-04 | Experian Information Solutions, Inc. | Mobile device sighting location analytics and profiling system |
| US10019593B1 (en) | 2015-11-23 | 2018-07-10 | Experian Information Solutions, Inc. | Access control system for implementing access restrictions of regulated database records while identifying and providing indicators of regulated database records matching validation criteria |
| US9767309B1 (en) | 2015-11-23 | 2017-09-19 | Experian Information Solutions, Inc. | Access control system for implementing access restrictions of regulated database records while identifying and providing indicators of regulated database records matching validation criteria |
| US10685133B1 (en) | 2015-11-23 | 2020-06-16 | Experian Information Solutions, Inc. | Access control system for implementing access restrictions of regulated database records while identifying and providing indicators of regulated database records matching validation criteria |
| US11748503B1 (en) | 2015-11-23 | 2023-09-05 | Experian Information Solutions, Inc. | Access control system for implementing access restrictions of regulated database records while identifying and providing indicators of regulated database records matching validation criteria |
| US11550886B2 (en) | 2016-08-24 | 2023-01-10 | Experian Information Solutions, Inc. | Disambiguation and authentication of device users |
| US10678894B2 (en) | 2016-08-24 | 2020-06-09 | Experian Information Solutions, Inc. | Disambiguation and authentication of device users |
| US11682041B1 (en) | 2020-01-13 | 2023-06-20 | Experian Marketing Solutions, Llc | Systems and methods of a tracking analytics platform |
Also Published As
| Publication number | Publication date |
|---|---|
| CA2119399A1 (en) | 1995-09-15 |
Similar Documents
| Publication | Publication Date | Title |
|---|---|---|
| US5627973A (en) | Method and apparatus for facilitating evaluation of business opportunities for supplying goods and/or services to potential customers | |
| US7552059B2 (en) | Material ordering and reporting expediter (MORE) | |
| Novack et al. | The industrial procurement process: a supply chain perspective | |
| Wireman | Computerized maintenance management systems | |
| CA2404941A1 (en) | System and method for managing purchasing contracts | |
| Bragg | Inventory accounting: a comprehensive guide | |
| Jaramillo | The basic functions of national trade promotion organizations | |
| Gelinas Jr et al. | Norwood Office Supplies, Inc.: A Teaching Case to Integrate Computer‐Assisted uditing Techniques into the Auditing Course | |
| Zimak | Cost of Quality (COQ): Which collection system should be used? | |
| US20050182646A1 (en) | Method and system for reporting economic impact | |
| Schneiderman | Metrics for the order fulfillment process (part 2) | |
| Zinszer | Customer service as an element of the marketing mix: the evaluation of a descriptive model of customer service. | |
| Kilduff | Inventory Practice and Material Control | |
| Blanding | Practical Handbook of Customer Service Operations | |
| Sinkkonen | Identifying business processes for, and challenges to, electronic supply chain management: A case study in a small business in North-West Tasmania, Australia | |
| Shaw | UNIVERSAL PRODUCT CODE SCANNING SYSTEMS: THE RETAIL EXPERIENCE 1974-1976. | |
| Boyd | Production planning and control and cost accounting systems: effects on management decision making and firm performance | |
| Gkougkoulia | Implementation of business scenarios in ERP Microsoft Dynamics 365 | |
| Palmer et al. | ITT Automotive North America: A case study requiring use of benchmarking, activity/process analysis, and reengineering concepts | |
| Waltz | A study of data processing in specified retail and wholesale firms | |
| Krentzman | Managing for profits | |
| Summerour Jr et al. | Automated contracting: a productivity study | |
| Kline | Management audit for small manufacturers | |
| Lederer | Computer feasibility for fresh fruit and vegetable wholesalers | |
| Summerour Jr | AD-A241 822 NAVAL POSTGRADUATE SCHOOL |
Legal Events
| Date | Code | Title | Description |
|---|---|---|---|
| AS | Assignment |
Owner name: MOORE BUSINESS FORMS, INC., NEW YORK Free format text: ASSIGNMENT OF ASSIGNORS INTEREST;ASSIGNORS:ARMSTRONG, HUGH E.;BAILEY, BRAD B.;LYNCH, GREGORY T.;AND OTHERS;REEL/FRAME:007003/0238;SIGNING DATES FROM 19940426 TO 19940506 |
|
| AS | Assignment |
Owner name: MOORE BUSINESS FORMS, INC., NEW YORK Free format text: ASSIGNMENT OF ASSIGNORS INTEREST;ASSIGNORS:SCHWEINZGER, KAREN L.;SCHWEINZGER, GREGORY C.;REEL/FRAME:007095/0303;SIGNING DATES FROM 19940628 TO 19940701 |
|
| FEPP | Fee payment procedure |
Free format text: PAYOR NUMBER ASSIGNED (ORIGINAL EVENT CODE: ASPN); ENTITY STATUS OF PATENT OWNER: LARGE ENTITY |
|
| FPAY | Fee payment |
Year of fee payment: 4 |
|
| REMI | Maintenance fee reminder mailed | ||
| LAPS | Lapse for failure to pay maintenance fees | ||
| STCH | Information on status: patent discontinuation |
Free format text: PATENT EXPIRED DUE TO NONPAYMENT OF MAINTENANCE FEES UNDER 37 CFR 1.362 |
|
| FP | Lapsed due to failure to pay maintenance fee |
Effective date: 20050506 |