US5467767A - Method for determining if tissue is malignant as opposed to non-malignant using time-resolved fluorescence spectroscopy - Google Patents
Method for determining if tissue is malignant as opposed to non-malignant using time-resolved fluorescence spectroscopy Download PDFInfo
- Publication number
- US5467767A US5467767A US08/112,291 US11229193A US5467767A US 5467767 A US5467767 A US 5467767A US 11229193 A US11229193 A US 11229193A US 5467767 A US5467767 A US 5467767A
- Authority
- US
- United States
- Prior art keywords
- tissue
- malignant
- human breast
- light
- tissue sample
- Prior art date
- Legal status (The legal status is an assumption and is not a legal conclusion. Google has not performed a legal analysis and makes no representation as to the accuracy of the status listed.)
- Expired - Lifetime
Links
- 230000003211 malignant effect Effects 0.000 title claims abstract description 92
- 238000000034 method Methods 0.000 title claims abstract description 35
- 238000001685 time-resolved fluorescence spectroscopy Methods 0.000 title description 9
- 210000000481 breast Anatomy 0.000 claims abstract description 45
- 230000001678 irradiating effect Effects 0.000 claims abstract 7
- 239000000835 fiber Substances 0.000 claims description 32
- 238000005259 measurement Methods 0.000 claims description 12
- 230000003595 spectral effect Effects 0.000 claims description 8
- 210000004072 lung Anatomy 0.000 claims description 7
- 230000002611 ovarian Effects 0.000 claims description 7
- 230000003287 optical effect Effects 0.000 claims description 4
- 238000006243 chemical reaction Methods 0.000 claims description 2
- 238000001161 time-correlated single photon counting Methods 0.000 claims description 2
- 206010028980 Neoplasm Diseases 0.000 abstract description 33
- 230000005284 excitation Effects 0.000 abstract description 20
- 238000001514 detection method Methods 0.000 abstract description 4
- 230000002159 abnormal effect Effects 0.000 abstract description 3
- 230000036210 malignancy Effects 0.000 abstract description 2
- 210000001519 tissue Anatomy 0.000 description 198
- 239000000523 sample Substances 0.000 description 83
- 238000001228 spectrum Methods 0.000 description 26
- 201000011510 cancer Diseases 0.000 description 20
- 238000002189 fluorescence spectrum Methods 0.000 description 10
- 238000001069 Raman spectroscopy Methods 0.000 description 9
- 206010006187 Breast cancer Diseases 0.000 description 7
- 208000026310 Breast neoplasm Diseases 0.000 description 7
- 238000004020 luminiscence type Methods 0.000 description 6
- 239000013307 optical fiber Substances 0.000 description 6
- 238000010586 diagram Methods 0.000 description 5
- 230000002123 temporal effect Effects 0.000 description 5
- 210000004027 cell Anatomy 0.000 description 4
- 238000001727 in vivo Methods 0.000 description 4
- 238000003780 insertion Methods 0.000 description 4
- 230000037431 insertion Effects 0.000 description 4
- 210000003734 kidney Anatomy 0.000 description 4
- 229930027945 nicotinamide-adenine dinucleotide Natural products 0.000 description 4
- 238000001237 Raman spectrum Methods 0.000 description 3
- 238000013461 design Methods 0.000 description 3
- 238000000695 excitation spectrum Methods 0.000 description 3
- 150000002211 flavins Chemical class 0.000 description 3
- 238000000338 in vitro Methods 0.000 description 3
- 210000004185 liver Anatomy 0.000 description 3
- BOPGDPNILDQYTO-NNYOXOHSSA-N nicotinamide-adenine dinucleotide Chemical compound C1=CCC(C(=O)N)=CN1[C@H]1[C@H](O)[C@H](O)[C@@H](COP(O)(=O)OP(O)(=O)OC[C@@H]2[C@H]([C@@H](O)[C@@H](O2)N2C3=NC=NC(N)=C3N=C2)O)O1 BOPGDPNILDQYTO-NNYOXOHSSA-N 0.000 description 3
- 230000001681 protective effect Effects 0.000 description 3
- 238000005070 sampling Methods 0.000 description 3
- 239000004065 semiconductor Substances 0.000 description 3
- 241001455445 Alfaro Species 0.000 description 2
- IJGRMHOSHXDMSA-UHFFFAOYSA-N Atomic nitrogen Chemical compound N#N IJGRMHOSHXDMSA-UHFFFAOYSA-N 0.000 description 2
- 102000008186 Collagen Human genes 0.000 description 2
- 108010035532 Collagen Proteins 0.000 description 2
- 102000016942 Elastin Human genes 0.000 description 2
- 108010014258 Elastin Proteins 0.000 description 2
- QIVBCDIJIAJPQS-VIFPVBQESA-N L-tryptophane Chemical compound C1=CC=C2C(C[C@H](N)C(O)=O)=CNC2=C1 QIVBCDIJIAJPQS-VIFPVBQESA-N 0.000 description 2
- QIVBCDIJIAJPQS-UHFFFAOYSA-N Tryptophan Natural products C1=CC=C2C(CC(N)C(O)=O)=CNC2=C1 QIVBCDIJIAJPQS-UHFFFAOYSA-N 0.000 description 2
- 238000004458 analytical method Methods 0.000 description 2
- 238000013459 approach Methods 0.000 description 2
- 210000004556 brain Anatomy 0.000 description 2
- 229920001436 collagen Polymers 0.000 description 2
- 229920002549 elastin Polymers 0.000 description 2
- 210000002216 heart Anatomy 0.000 description 2
- 238000001748 luminescence spectrum Methods 0.000 description 2
- 238000012986 modification Methods 0.000 description 2
- 230000004048 modification Effects 0.000 description 2
- 210000000056 organ Anatomy 0.000 description 2
- 210000000496 pancreas Anatomy 0.000 description 2
- 210000002307 prostate Anatomy 0.000 description 2
- 238000005086 pumping Methods 0.000 description 2
- 239000010453 quartz Substances 0.000 description 2
- VYPSYNLAJGMNEJ-UHFFFAOYSA-N silicon dioxide Inorganic materials O=[Si]=O VYPSYNLAJGMNEJ-UHFFFAOYSA-N 0.000 description 2
- 210000002784 stomach Anatomy 0.000 description 2
- 201000001320 Atherosclerosis Diseases 0.000 description 1
- RYGMFSIKBFXOCR-UHFFFAOYSA-N Copper Chemical compound [Cu] RYGMFSIKBFXOCR-UHFFFAOYSA-N 0.000 description 1
- 208000000913 Kidney Calculi Diseases 0.000 description 1
- 241001465754 Metazoa Species 0.000 description 1
- 206010029148 Nephrolithiasis Diseases 0.000 description 1
- NINIDFKCEFEMDL-UHFFFAOYSA-N Sulfur Chemical compound [S] NINIDFKCEFEMDL-UHFFFAOYSA-N 0.000 description 1
- 239000005864 Sulphur Substances 0.000 description 1
- 238000002679 ablation Methods 0.000 description 1
- 210000004204 blood vessel Anatomy 0.000 description 1
- 210000005013 brain tissue Anatomy 0.000 description 1
- 210000003679 cervix uteri Anatomy 0.000 description 1
- 210000001072 colon Anatomy 0.000 description 1
- 239000012141 concentrate Substances 0.000 description 1
- 230000021615 conjugation Effects 0.000 description 1
- 229910052802 copper Inorganic materials 0.000 description 1
- 239000010949 copper Substances 0.000 description 1
- 239000013078 crystal Substances 0.000 description 1
- 230000001419 dependent effect Effects 0.000 description 1
- 238000003745 diagnosis Methods 0.000 description 1
- 239000006185 dispersion Substances 0.000 description 1
- 210000001508 eye Anatomy 0.000 description 1
- 210000001035 gastrointestinal tract Anatomy 0.000 description 1
- 239000011521 glass Substances 0.000 description 1
- 239000003365 glass fiber Substances 0.000 description 1
- 238000011835 investigation Methods 0.000 description 1
- 208000032839 leukemia Diseases 0.000 description 1
- 210000000265 leukocyte Anatomy 0.000 description 1
- 239000000463 material Substances 0.000 description 1
- 229950006238 nadide Drugs 0.000 description 1
- -1 nicotinamide adenine dinucleotide hydride Chemical class 0.000 description 1
- 229910052757 nitrogen Inorganic materials 0.000 description 1
- 239000002773 nucleotide Substances 0.000 description 1
- 125000003729 nucleotide group Chemical group 0.000 description 1
- 230000010355 oscillation Effects 0.000 description 1
- PYWVYCXTNDRMGF-UHFFFAOYSA-N rhodamine B Chemical compound [Cl-].C=12C=CC(=[N+](CC)CC)C=C2OC2=CC(N(CC)CC)=CC=C2C=1C1=CC=CC=C1C(O)=O PYWVYCXTNDRMGF-UHFFFAOYSA-N 0.000 description 1
- 230000002269 spontaneous effect Effects 0.000 description 1
- 238000012731 temporal analysis Methods 0.000 description 1
- 238000012360 testing method Methods 0.000 description 1
- 238000002604 ultrasonography Methods 0.000 description 1
- 210000003932 urinary bladder Anatomy 0.000 description 1
- 230000000007 visual effect Effects 0.000 description 1
Images


Classifications
-
- G—PHYSICS
- G01—MEASURING; TESTING
- G01N—INVESTIGATING OR ANALYSING MATERIALS BY DETERMINING THEIR CHEMICAL OR PHYSICAL PROPERTIES
- G01N21/00—Investigating or analysing materials by the use of optical means, i.e. using sub-millimetre waves, infrared, visible or ultraviolet light
- G01N21/62—Systems in which the material investigated is excited whereby it emits light or causes a change in wavelength of the incident light
- G01N21/63—Systems in which the material investigated is excited whereby it emits light or causes a change in wavelength of the incident light optically excited
- G01N21/64—Fluorescence; Phosphorescence
- G01N21/6408—Fluorescence; Phosphorescence with measurement of decay time, time resolved fluorescence
-
- A—HUMAN NECESSITIES
- A61—MEDICAL OR VETERINARY SCIENCE; HYGIENE
- A61B—DIAGNOSIS; SURGERY; IDENTIFICATION
- A61B1/00—Instruments for performing medical examinations of the interior of cavities or tubes of the body by visual or photographical inspection, e.g. endoscopes; Illuminating arrangements therefor
- A61B1/04—Instruments for performing medical examinations of the interior of cavities or tubes of the body by visual or photographical inspection, e.g. endoscopes; Illuminating arrangements therefor combined with photographic or television appliances
- A61B1/043—Instruments for performing medical examinations of the interior of cavities or tubes of the body by visual or photographical inspection, e.g. endoscopes; Illuminating arrangements therefor combined with photographic or television appliances for fluorescence imaging
-
- A—HUMAN NECESSITIES
- A61—MEDICAL OR VETERINARY SCIENCE; HYGIENE
- A61B—DIAGNOSIS; SURGERY; IDENTIFICATION
- A61B5/00—Measuring for diagnostic purposes; Identification of persons
- A61B5/0059—Measuring for diagnostic purposes; Identification of persons using light, e.g. diagnosis by transillumination, diascopy, fluorescence
- A61B5/0071—Measuring for diagnostic purposes; Identification of persons using light, e.g. diagnosis by transillumination, diascopy, fluorescence by measuring fluorescence emission
-
- A—HUMAN NECESSITIES
- A61—MEDICAL OR VETERINARY SCIENCE; HYGIENE
- A61B—DIAGNOSIS; SURGERY; IDENTIFICATION
- A61B5/00—Measuring for diagnostic purposes; Identification of persons
- A61B5/0059—Measuring for diagnostic purposes; Identification of persons using light, e.g. diagnosis by transillumination, diascopy, fluorescence
- A61B5/0082—Measuring for diagnostic purposes; Identification of persons using light, e.g. diagnosis by transillumination, diascopy, fluorescence adapted for particular medical purposes
- A61B5/0084—Measuring for diagnostic purposes; Identification of persons using light, e.g. diagnosis by transillumination, diascopy, fluorescence adapted for particular medical purposes for introduction into the body, e.g. by catheters
-
- A—HUMAN NECESSITIES
- A61—MEDICAL OR VETERINARY SCIENCE; HYGIENE
- A61B—DIAGNOSIS; SURGERY; IDENTIFICATION
- A61B5/00—Measuring for diagnostic purposes; Identification of persons
- A61B5/0059—Measuring for diagnostic purposes; Identification of persons using light, e.g. diagnosis by transillumination, diascopy, fluorescence
- A61B5/0082—Measuring for diagnostic purposes; Identification of persons using light, e.g. diagnosis by transillumination, diascopy, fluorescence adapted for particular medical purposes
- A61B5/0091—Measuring for diagnostic purposes; Identification of persons using light, e.g. diagnosis by transillumination, diascopy, fluorescence adapted for particular medical purposes for mammography
-
- A—HUMAN NECESSITIES
- A61—MEDICAL OR VETERINARY SCIENCE; HYGIENE
- A61B—DIAGNOSIS; SURGERY; IDENTIFICATION
- A61B5/00—Measuring for diagnostic purposes; Identification of persons
- A61B5/43—Detecting, measuring or recording for evaluating the reproductive systems
- A61B5/4306—Detecting, measuring or recording for evaluating the reproductive systems for evaluating the female reproductive systems, e.g. gynaecological evaluations
- A61B5/4312—Breast evaluation or disorder diagnosis
-
- B—PERFORMING OPERATIONS; TRANSPORTING
- B23—MACHINE TOOLS; METAL-WORKING NOT OTHERWISE PROVIDED FOR
- B23K—SOLDERING OR UNSOLDERING; WELDING; CLADDING OR PLATING BY SOLDERING OR WELDING; CUTTING BY APPLYING HEAT LOCALLY, e.g. FLAME CUTTING; WORKING BY LASER BEAM
- B23K26/00—Working by laser beam, e.g. welding, cutting or boring
- B23K26/02—Positioning or observing the workpiece, e.g. with respect to the point of impact; Aligning, aiming or focusing the laser beam
- B23K26/06—Shaping the laser beam, e.g. by masks or multi-focusing
- B23K26/062—Shaping the laser beam, e.g. by masks or multi-focusing by direct control of the laser beam
- B23K26/0622—Shaping the laser beam, e.g. by masks or multi-focusing by direct control of the laser beam by shaping pulses
- B23K26/0624—Shaping the laser beam, e.g. by masks or multi-focusing by direct control of the laser beam by shaping pulses using ultrashort pulses, i.e. pulses of 1ns or less
-
- G—PHYSICS
- G01—MEASURING; TESTING
- G01N—INVESTIGATING OR ANALYSING MATERIALS BY DETERMINING THEIR CHEMICAL OR PHYSICAL PROPERTIES
- G01N21/00—Investigating or analysing materials by the use of optical means, i.e. using sub-millimetre waves, infrared, visible or ultraviolet light
- G01N21/62—Systems in which the material investigated is excited whereby it emits light or causes a change in wavelength of the incident light
- G01N21/63—Systems in which the material investigated is excited whereby it emits light or causes a change in wavelength of the incident light optically excited
- G01N21/64—Fluorescence; Phosphorescence
- G01N21/6486—Measuring fluorescence of biological material, e.g. DNA, RNA, cells
-
- A—HUMAN NECESSITIES
- A61—MEDICAL OR VETERINARY SCIENCE; HYGIENE
- A61B—DIAGNOSIS; SURGERY; IDENTIFICATION
- A61B5/00—Measuring for diagnostic purposes; Identification of persons
- A61B5/0059—Measuring for diagnostic purposes; Identification of persons using light, e.g. diagnosis by transillumination, diascopy, fluorescence
- A61B5/0075—Measuring for diagnostic purposes; Identification of persons using light, e.g. diagnosis by transillumination, diascopy, fluorescence by spectroscopy, i.e. measuring spectra, e.g. Raman spectroscopy, infrared absorption spectroscopy
-
- A—HUMAN NECESSITIES
- A61—MEDICAL OR VETERINARY SCIENCE; HYGIENE
- A61B—DIAGNOSIS; SURGERY; IDENTIFICATION
- A61B5/00—Measuring for diagnostic purposes; Identification of persons
- A61B5/0059—Measuring for diagnostic purposes; Identification of persons using light, e.g. diagnosis by transillumination, diascopy, fluorescence
- A61B5/0082—Measuring for diagnostic purposes; Identification of persons using light, e.g. diagnosis by transillumination, diascopy, fluorescence adapted for particular medical purposes
- A61B5/0084—Measuring for diagnostic purposes; Identification of persons using light, e.g. diagnosis by transillumination, diascopy, fluorescence adapted for particular medical purposes for introduction into the body, e.g. by catheters
- A61B5/0086—Measuring for diagnostic purposes; Identification of persons using light, e.g. diagnosis by transillumination, diascopy, fluorescence adapted for particular medical purposes for introduction into the body, e.g. by catheters using infrared radiation
-
- G—PHYSICS
- G01—MEASURING; TESTING
- G01N—INVESTIGATING OR ANALYSING MATERIALS BY DETERMINING THEIR CHEMICAL OR PHYSICAL PROPERTIES
- G01N21/00—Investigating or analysing materials by the use of optical means, i.e. using sub-millimetre waves, infrared, visible or ultraviolet light
- G01N21/62—Systems in which the material investigated is excited whereby it emits light or causes a change in wavelength of the incident light
- G01N21/63—Systems in which the material investigated is excited whereby it emits light or causes a change in wavelength of the incident light optically excited
- G01N21/64—Fluorescence; Phosphorescence
- G01N2021/6417—Spectrofluorimetric devices
Definitions
- the present invention relates generally to methods for detecting malignant tissue and more particularly to a method for detecting malignant tissue using time-resolved fluorescence spectroscopy.
- malignant (i.e. cancerous) tissue is often a prerequisite to its treatment.
- the carcinomatoid status of the tissue in question By determining the waylengths at which maximum intensities are attained for the tissue in question and by comparing these peak wavelengths, either visually or electronically, to the peak wavelengths derived from a known non-cancerous tissue, or by comparing the spectrum of the excited tissue with the spectrum of a known noncancerous tissue one can determine the carcinomatoid status of the tissue in question.
- the invention is based on the discovery that the visible luminescence spectra for cancerous and non-cancerous tissue are substantially different and that the differences are such that visible luminescence from tissue can be used to detect the presence of cancer.
- the tissue in question By determining the wavelengths at which maximum intensities are attained for the tissue in question and by comparing these peak wavelengths, either visually or electronically, to the peak wavelengths derived from a known non-cancerous tissue, or by comparing the luminescence spectrum of the excited tissue with the luminescence spectrum of a known noncancerous tissue and/or known cancerous tissue or the excitation spectrum of the excited tissue with the excitation spectra of known cancerous and/or known non-cancerous tissues one can determine the carcinomatoid status of the tissue in question. Once it has been determined that the tissue is cancerous, it may be destroyed by ablation by exposing it to a beam of light from a high power laser.
- the invention is based on the discovery that the visible luminescence spectra for cancerous and non-cancerous tissues are substantially different and that the differences are such that visible luminescence from the tissue can be used to detect the presence of cancer and also on the discovery that the spectral profiles of excitation spectra are similarly different.
- the method of the present Invention comprises the steps of directing a laser beam onto various samples, analyzing the spontaneous emission caused in the samples, and analyzing the change in the physical characteristics of the samples.
- Various laser beams such as the single wave or tunable laser pulse or continuous-mode oscillation laser, are applicable for the excitation of the sample cells.
- various spectra are used, such as the wave spectrum, time resolved spectrum, fluorescence spectrum, Raman spectrum and polarized light spectrum. The use of a single spectrum as well as a combination of two or more of the spectra is possible.
- the invention is based on the discovery that when cancerous tissue is excited with monochromatic light at about 300 nm, the native fluorescence spectrum over the region from about 320 nm to 600 nm is substantially different from the native fluorescence spectrum that would result if the tissue were either benign or normal.
- the technique is useful in vivo and in vitro testing of human as well as animal tissue.
- a diagnostic apparatus for intrinsic fluorescence of malignant tumors and a method for using the apparatus for diagnosis employs an ultraviolet light source with an emitting waveband of 3000A-4000A.
- Light from the light source is transmitted through a bundle of quartz optic fibers to the surface of the tumor, whether benign or malignant, to stimulate it, which then generates a specific intrinsic fluorescence spectrum.
- the intrinsic fluorescence spectrum reflected from the surface of the tumor is transmitted by a second bundle of glass fibers placed near it to a color resolution means, then processed by a scanning means and a circuit means, and displayed recorded by a display recording means.
- the display may be a graphic presentation of the intrinsic fluorescence spectrum of the tumor that is tested. If the graphic presentation displayed includes a single peak within the range of the blue color band, it indicates that the tumor being tested is bengin. If however, a second peak appears within the range of the red color band of the graphic presentation it is a characteristic peak of malignancy, indicating the existence of a malignant tumor. The presence of the red color can be established by eye rather than a complex resolution system.
- the present Invention is based on the surprising discovery that the time-resolved fluorescence spectra obtained from malignant tissues are distinguishable, in many instances, from the time-resolved fluorescence spectra obtained from corresponding non-malignant tissues (i.e., benign tumor tissues, benign tissues, or normal tissues). This was demonstrated, in one instance, by exciting various samples of malignant human breast tissue, benign human breast tumor tissue, benign human breast tissue, and normal human breast tissue with picosecond light pulses having a wavelength of about 310 nm, measuring the time-resolved native fluorescence emitted therefrom at a wavelength of about 340 nm, and comparing the respective spectra.
- differences in the respective spectra of malignant human breast tissue samples and benign human breast tumor tissue samples were also observed by exciting the tissue samples with picosecond light pulses at a wavelength of about 353 nm and then measuring the time-resolved native fluorescence emitted therefrom at wavelengths of about 400 nm, about 450 nm and about 500 nm. Examples of distinguishing features included differences in the respective fast components ( ⁇ 1 ) and slow components ( ⁇ 2 ) of the various spectra.
- differences in the respective spectra of malignant human breast tissue samples and normal human breast tissue samples were also observed by exciting the tissue samples with picosecond light pulses at a wavelength of about 530 nm and then measuring the time-resolved native fluorescence emitted therefrom at a wavelength of about 600 nm.
- An example of a distinguishing feature included differences in the respective fast components ( ⁇ 1 ) of the various spectra.
- time-resolved fluorescence spectroscopy can also be used to detect cancer in tissues located, for example, in the cervix, the colon, the kidneys, the brain, the gastrointestinal tract, the prostatee, the bladder, the liver, the pancreas, the heart, and the stomach.
- time-resolved fluorescence spectroscopy can be used to detect diseased states in various biomedical materials, such as atherosclerosis in blood vessels, leukemia in white blood cells, kidney stones in kidneys, etc.
- FIG. 1 is a schematic diagram of one embodiment of a time-resolved fluorescence spectroscopy system which may be used to perform the method of the present invention
- FIG. 2 is a schematic diagram of a second embodiment of a time-resolved fluorescence spectroscopy system which may be used to perform the method of the present invention
- FIGS. 3(a) through 3(d) are time-resolved fluorescence profiles of several malignant human breast tissue samples, the profiles being obtained by exciting the samples with light at a wavelength of about 353 nm and then measuring for a period of time the native fluorescence emitted therefrom at a wavelength of about 450 nm;
- FIGS. 4(a) through 4(d) are time-resolved fluorescence profiles of the malignant human breast tissue samples of FIGS. 3(a) through 3(d), respectively, the profiles being obtained by exciting the samples with light at a wavelength of about 353 nm and then measuring for a period of time the total native fluorescence emitted therefrom;
- FIGS. 5(a) and 5(b) are time-resolved fluorescence profiles of two benign human breast tumor tissue samples, the profiles being obtained by exciting the samples with light at a wavelength of about 353 nm and then measuring for a period of time the native fluorescence emitted therefrom at a wavelength of about 450 nm;
- FIGS. 6(a) and 6(b) are time-resolved fluorescence profiles of the two benign human breast tumor tissue samples of FIGS. 5(a) and 5(b), the profiles being obtained by exciting the samples with light at a wavelength of about 353 nm and then measuring for a period of time the total native fluorescence emitted therefrom;
- FIG. 7 is a representative time-resolved fluorescence profile of a malignant human breast tissue sample, the profile being obtained by exciting the sample with light at a wavelength of about 310 nm and then measuring for a period of time the native fluorescence emitted therefrom at a wavelength of about 340 nm;
- FIG. 8 is a representative time-resolved fluorescence profile of a benign human breast tumor tissue sample, the profile being obtained by exciting the sample with light at a wavelength of about 310 nm and then measuring for a period of time the native fluorescence emitted therefrom at a wavelength of about 340 nm;
- FIG. 9 is a representative time-resolved fluorescence profile of a benign human breast tissue sample, the profile being obtained by exciting the sample with light at a wavelength of about 310 nm and then measuring the native fluorescence emitted therefrom at a wavelength of about 340 nm;
- FIG. 10 is a representative time-resolved fluorescence profile of a normal human breast tissue sample, the profile being obtained by exciting the sample with light at a wavelength of about 310 nm and then measuring the native fluorescence emitted therefrom at a wavelength of about 340 nm;
- FIG. 11 is a histogram of the ratio of amplitudes of the fast components of fluorescence decay from malignant and non-malignant human breast tissues in the 340 nm emission band following excitation with light at a wavelength of about 310 nm;
- FIG. 12 is a histogram of the slow component of fluorescence lifetimes from malignant and non-malignant human breast tissues in the 340 nm emission band following excitation with light at a wavelength of about 310 nm;
- FIG. 13 is a time-resolved fluorescence profile of a malignant human lung tissue sample, the profile being obtained by exciting the sample with light at a wavelength of about 530 nm and then measuring the native fluorescence emitted therefrom at a wavelength of about 600 nm;
- FIG. 14 is a time-resolved fluorescence profile of a normal human lung tissue sample, the profile being obtained by exciting the sample with light at a wavelength of about 530 nm and then measuring the native fluorescence emitted therefrom at a wavelength of about 600 nm;
- FIG. 15 is a time-resolved fluorescence profile of a malignant human ovarian tissue sample, the profile being obtained by exciting the sample with light at a wavelength of about 351 nm and then measuring the native fluorescence emitted therefrom at a wavelength of about 450 nm;
- FIG. 16 is a time-resolved fluorescence profile of a normal human ovarian tissue sample, the profile being obtained by exciting the sample with light at a wavelength of about 351 nm and then measuring the native fluorescence emitted therefrom at a wavelength of about 450 nm.
- FIG. 17 is a block diagram of the invention.
- FIG. 18 is a diagram of an embodiment of the invention using an optical fiber bundle/endoscope combination
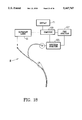
- FIG. 19 is a more detailed view of the optical fiber bundle/endoscope shown in FIG. 18;
- FIG. 20 is a more detailed view of the probe end of the endoscope shown in FIG. 19;
- FIG. 21 is a view of a hypodermic needle optical fiber set for use in practicing the invention.
- FIG. 22 is a more detailed view of the hypodermic needle shown in FIG. 21;
- FIG. 22(a) is a fragmentary side view of the probe tip shown in FIG. 22;
- FIG. 23(a), (b) and (c) are views of variations of the tip end of the needle shown in FIG. 22;
- FIG. 24 is a view showing the needle fiber cable probe inserted into an endoscope.
- FIGS. 25(a) through 25(e) are views showing five different applications of the invention.
- the present invention is directed to a new method for determining if tissue is malignant as opposed to non-malignant (i.e., benign tumor, benign tissue, or normal).
- This method is premised on the discovery that, under certain conditions, the time-resolved fluorescence profile of a malignant tissue is distinguishable from that of a corresponding non-malignant tissue.
- the present inventors believe that such differences are attributable, at least in part, to microenvironmental changes which take piece within malignant cells and which affect the time-resolved fluorescence properties of naturally-occurring fluorophores present within the cells.
- fluorophores which are believed to be affected in the manner described above include tryptophan, various nucleotides, particularly nicotinamide adenine dinucleotide hydride (NADH), flavins, collagen, and elastin.
- NADH nicotinamide adenine dinucleotide hydride
- flavins collagen, and elastin.
- Such molecules are present, to some extent, in virtually every type of tissue although the amount of any given type of molecule typically varies from tissue to tissue.
- steady-state fluorescence of tryptophan and, to a lesser extent, NADH, elastin, and collagen can be achieved by excitation with light at a wavelength of about 300 nm.
- excitation with light at a wavelength of about 350 nm typically causes both NADH and flavins to fluoresce.
- excitation with light at a wavelength of about 530 nm typically causes flavins to fluoresce. Consequently, excitation with light at one or more of the above-mentioned wavelengths is a good starting point for selection of an appropriate excitation wavelength that will permit one to detect differences in the time-resolved fluorescence of malignant and non-malignant tissues. (As will be seen below, an appropriate fluorescence wavelength must also be selected.) It should be understood that other excitation wavelengths, besides the three described above, may also be appropriate and, furthermore, that additional fluorophores may exist, which may or may not be excited at the above-mentioned wavelengths.
- FIG. 1 there is shown a schematic diagram of one embodiment of a time-resolved fluorescence spectroscopy system which may be used to perform the method of the present invention, the system being represented by reference numeral 11.
- System 11 includes a light source 13, such as a laser, for generating light used to excite the tissue sample S.
- light source 13 produces ultrafast pulses of light, such as picosecond or femtosecond light pulses.
- the light emitted from light source 13 preferably is substantially monochromatic and preferably has a wavelength ranging from about 300 nm to about 850 nm.
- Examples of lasers suitable for use as light source 13 include picosecond semiconductor lasers with and without the second harmonic generation (SHG), picosecond YAG or glass lasers with SHG, picosecond nitrogen lasers, picosecond dye lasers, semiconductor laser pump+YAG laser+SHG, semiconductor pumped YAG laser+SHG+dye laser, and picosecond quantum well laser with and without SHG.
- SHG second harmonic generation
- picosecond YAG or glass lasers with SHG picosecond nitrogen lasers
- picosecond dye lasers semiconductor laser pump+YAG laser+SHG
- semiconductor pumped YAG laser+SHG+dye laser semiconductor pumped YAG laser+SHG+dye laser
- picosecond quantum well laser with and without SHG preferably emits light at a wavelength of about 310 nm, about 353 nm, or about 530 nm.
- System 11 also includes a lens 15 for focusing the light emitted by source 13 onto the tissue sample S, which is mounted on a holder 17.
- the fluorescent light emitted by tissue sample S is then collected by a lens 19 and passed through a filter 21, which is selective for light of certain predetermined wavelength(s).
- Filter 21 may be, for example, a narrow band filter having a bandwidth of about 10 nm or a wide band filter having a bandwidth of about 40 nm.
- the wavelength(s) of the fluorescent light passed through filter 21 is(are) different from the wavelength(s) of the light emitted by source 13 so as to ensure the detection of fluorescent light only.
- Other devices, besides filter 21, which may be used to select only certain predetermined wavelengths of the fluorescent light include a spectrograph or a zero dispersion spectrometer.
- System 11 additionally includes a streak camera 23 for temporally resolving the fluorescent light which passes through filter 21.
- streak camera 23 is capable of operating in either the single pulse or synchrosan modes.
- Other devices, besides streak camera 21, which may be used to temporally resolve the fluorescent light include an optical Kerr gate, an up-conversion gate, a time-correlated single photon counting instrument, a phase fluorimeter, and an oscilloscope with a fast photodetector.
- System 11 further includes a camera 25, such as a SIT video camera or a CCD video camera, for converting the temporally resolved light signal from streak camera 23 into a corresponding electrical signal.
- a camera 25 such as a SIT video camera or a CCD video camera
- This signal is then transmitted from camera 23 through a line 27 to a computer 29.
- Computer 29 processes the signal and compares it to standards obtained from malignant and non-malignant tissues. Such standards may be derived from a histogram of the type shown in FIGS. 11 and 12. The results of the comparison are then displayed on a monitor 31 or printed on hard copy using a printer 33.
- the signal from camera 23 could simply be displayed as a profile either on monitor 31 or using printer 33, in which case the user would visually compare the displayed profile to standards obtained from malignant and non-malignant tissues.
- signature features include the shape of the fluorescence profile, its relaxation lifetime, and the amplitude(s) (or ratio of amplitudes) of the relaxation component(s).
- FIG. 2 A second embodiment of a time-resolved fluorescence spectroscopy system constructed according to the teachings of the present invention is shown in FIG. 2, the system being represented generally by reference numeral 51.
- the excitation wavelength used was about 530 nm, and the native fluorescence emitted from the tissue samples was measured after passage through either a wide band 600 nm filter (WB600) or no filter (WHOLE BAND). The results are set forth below in Table 1.
- the fast component ( ⁇ 1 ) of the malignant human breast tissue is considerably faster than the fast component ( ⁇ 1 ) of the normal human breast tissue (100 ps vs. 200 ps) whereas the slow components ( ⁇ 2 ) of the two tissues are about the same (approx, 1.6 ns).
- Other differences in the respective spectra include variations in amplitudes A 1 and A 2 of the malignant and normal tissues.
- the excitation wavelength used was about 350 nm, and the fluorescence emitted from the tissue samples was measured after passage through either a wide band 400 nm filter (WB400), a wide band 450 nm filter (W8450), a wide band 500 nm filter (W8500) or no filter (WHOLE BAND).
- Table 2 the results are set forth below in Table 2.
- the fast components ( ⁇ 1 ) of the malignant tissues are less than about 150 ps while the fast components ( ⁇ 1 ) of the benign tumor tissues are greater than 200 ps.
- the slow components ( ⁇ 2 ) of the malignant tissues are greater than 2.4 ns whereas the slow components ( ⁇ 2 ) of the benign tumor tissues are less than 2.4 ns. Consequently, using these signature differences, one can accurately characterize tumorous tissue as being either malignant or benign.
- Ultrafast 100 fs laser pulses (repetition rate--82 MHz; wavelength--620 ⁇ 7 nm; beam diameter--3 mm) of 0.1 nJ per pulse were generated from a colliding pulse mode-locked dye laser system. These laser pulses were amplified by a sulphur rhodamine gain medium pumped by a copper vapor laser at 6.5 kHz. Laser pulses at 310 nm wavelength were obtained by focusing the 620 nm beam into a KDP crystal to generate the second harmonic. Breast tissue samples were put into quartz cells and excited at 310 nm. The pulse energy at the sample site was 0.5 uJ and the results were an average of a few tens of thousand pulses.
- the fluorescence was collected into a synchroscan streak camera with a temporal resolution of 16 ps.
- the sampling volume was a few hundred microns in area and 1 mm in depth.
- the tissue fluorescence was collected at the emission band of 340 nm ⁇ 5 nm and 440 nm ⁇ 5 nm using narrow band filters.
- Time-resolved fluorescence measurements were performed on 18 samples of human breast tissue from different sources--6 malignant tumors, 5 benign tissues, 5 normal tissues, and 2 benign tumors.
- Table 3 the fluorescence profiles for representative malignant, benign tumor, benign tissue and normal samples are shown in FIGS. 7 through 10, respectively.
- the measurements taken using the 340 nm filter show significant differences in the fluorescence lifetimes and amplitudes of the malignant tissue samples as compared to the non-malignant tissue samples (i.e., benign tumor, benign tissue, and normal samples).
- the slow component ( ⁇ 2 ) for the non-malignant tissue samples is typically less than about 1.6 ns whereas the slow component ( ⁇ 2 ) for the malignant tissue samples is typically greater than about 1.6 ns.
- the mean for the slow component of the non-malignant tissue samples is about 1.16 ⁇ 0.27 ns whereas the mean for the slow component of the malignant tissue samples is about 1.91 ⁇ 0.16 ns.
- the ratio of fast to slow amplitudes (A 1 /A 2 ) for the non-malignant tissue samples is typically greater than about 0.85 whereas the ratios of fast to slow amplitudes (A 1 /A 2 ) for the malignant tissues is typically less than about 0.6.
- This data is also expressed in the form of a histogram in FIG. 12, where it can be seen that the mean for the ratio of amplitudes for the non-malignant tissue samples is about 1.29 ⁇ 0.51 whereas the mean for the ratio of amplitudes for the malignant tissue samples is about 0.39 ⁇ 0.17.
- the measurements taken at 440 nm do not appear to show any significant differences in the fluorescence lifetimes or amplitudes of the malignant tissue samples as compared to the non-malignant tissue samples.
- FIGS. 13 and 14 illustrate the time-resolved fluorescence profiles of a normal human lung tissue sample and a cancerous human lung tissue sample, respectively, the profiles being obtained by exciting the respective samples with light at a wavelength of about 530 nm and then measuring the native fluorescence emitted therefrom at a wavelength of about 600 nm.
- the fast component ( ⁇ 1 ) of the malignant tissue was appreciably faster (120 ps vs. 220 ps) than that of the normal tissue.
- FIGS. 15 and 16 illustrate the time-resolved fluorescence profiles of a malignant human ovarian tissue sample and a normal human ovarian tissue sample, respectively, the profiles being obtained by exciting the sample with light at a wavelength of about 351 nm and then measuring the native fluorescence emitted therefrom at a wavelength of about 450 nm.
- the profiles were fitted to the double exponential equation described above, it was observed that the fast component ( ⁇ 1 ) of the malignant tissue was appreciably faster (178 ps vs. 218) than that of the normal tissue whereas the slow component ( ⁇ 2 ) of the malignant tissue was appreciably slower (2.77 ns vs. 2.55 ns) than that of the normal tissue.
- the above-described technique may also be applied to differentiating other abnormal or diseased states, besides cancer, from normal states in various types of tissues.
- optical instruments may be used to deliver the excitation light to the tissue sample and/or to collect the fluorescent light emitted therefrom for in vivo and/or in vitro applications.
- Such instruments may include lenses, endoscopes, optical fibers with hypodermic needles, microscopes, and the like.
- FIG. 17 displays the general set-up of the invention with light from a laser source 41 reaching the sample S after passing through the required optics 43 (lens, fibers or an endoscope).
- the emission from the sample is then collected by the collection optics 45 (lens, fibers, endoscope or a microscope).
- the emission is then analyzed in a certain spectral band using a spectrum analyzer and time-resolved in a time analyzer 49 and imaged by a camera 51.
- the resulting profile is displayed on a monitor 53.
- a computer 55 is used to determine the lifetimes and amplitudes of the different components of the fluorescence decay profile by the least square method of fitting.
- a laser beam from a laser 61 passes through an optical fiber bundle/endoscope 63 to excite the tissues inside the body.
- the fluorescence from the tissue is collected through the fiber to spectral and temporal analyzers 65 and 67, respectively.
- the output of analyzer 67 is fed into a computer 69 and displayed on a display 71.
- the endoscope used is described in FIG. 5. In this case the lifetimes and amplitudes are measured in vivo.
- An optical fiber bundle array can be used to deliver excitation pulse to the sample and collect fluorescence for temporal analysis.
- FIG. 19 displays the pumping/probing fiber cable set in FIG. 18.
- the excitation end 63-1 is adapted to be connected to the laser to excite the sample tissue.
- the monochromator end 63-2 of the fiber is adapted to be connected to the spectrum analyzer and the temporal analyzer to analyse the temporal and spectral data of the fluorescence.
- the single section of the bifurcated fiber is inserted into the operational channel of the endoscope 64.
- the probe end 64-1 of the cable is located at the bottom end plane of the endoscope probe (see FIG. 20).
- FIG. 20 displays the design of the probe end 64-1 in more detail.
- the probe end 64-1 consists of: (1) jacket 64-2, (2) focussing/collecting lens 64-3, (3) fiber end 64-4.
- Lens (2) is mounted inside the hard jacket that is glued to the fiber cable. The lens should be in a good position so as to concentrate the pump beam at the jacket output plane and collect as much fluorescence as possible into the bundle fiber.
- the end view shows the fiber bundle cross section where the fiber at the center is for the laser beam to pass into the body.
- the fibers surrounding this central fiber receive the fluorescene from the tissue and are allowed out of the body through the fiber, to the spectral and temporal analyzers for analysis of fluorescence lifetimes and spectra.
- FIG. 21 displays a hypodermic needle fiber cable set (probe) 71 combination according to this invention for insertion into body parts or used with an endoscope.
- the bifurcated fiber cable portion 73 has three terminal points.
- the single section 75 of the bifurcated fiber is inserted into a hypodermic needle 77 which serves to excite and to collect fluorescence from the sample for measurements of fluorescence spectral or lifetimes.
- the collection and focussing optics are placed in the needle tip-79.
- the input excitation end 81 has an SMA connector 83.
- the output monochromator end 85 is terminated in an in-line slit bundle 87 or circular bundle.
- the needle 77 can be placed inside an endoscope or outside an endoscope for direct use.
- a protective sleeve 89 is used as shown in FIG. 22.
- a protective sleeve is pulled back exposing an optical window 91 for measurements to be made.
- the light path could be 90 degrees or collinear to the fiber or can be reflected off mirror/plug 90 as shown in FIG. 22(a).
- Possible design for protective sleeve 89 can be made to expose the probe window 91 by rotation or retraction of sleeve 89.
- a straight-through pump-probe design is also possible as shown in probe end 64-6 in FIG. 23(b).
- a quart window of 1 or 2 mm thickness replaces the mirror plug.
- the needle tip and window are cut at Brewsters angle to minimize reflection losses.
- FIG. 24 displays the needle fiber cable probe 71 inserted in an instrument channel of an endoscope 81 (for visual convenience as well as fluorescence time and spectra measurements).
- Hypodermic needle fiber probe can be used separately to investigate the time-resolved fluorescence spectroscopy of a tumor inside the body where the endoscope cannot be simply used (breast, kidney, liver, bladder, heart, pancreas, prostate, brain, eye, ear).
- the position of the needle during investigation can be used in conjugation with ultrasonic survey or X-ray.
- Fluorescence collection is maximized by the short distance between fiber end and the collecting focussing optics end.
- FIGS. 25(a) through 25(e) display insertion of a hypodermic needle into the body for measurements in organs not accessible by an endoscope alone and endoscope insertion by itself into the body for measurements.
- FIG. 25(a) shows a hypodermic needle/fiber probe/endoscope combination 91 for sampling tissue in the prostate gland.
- FIG. 25(b) shows a hypodermic needle/probe combination 93 for sampling tissue in the breast.
- FIG. 25(c) shows a hypodermic needle/fiber probe 95 used to sample brain tissue.
- FIG. 25(d) shows two hypodermic needle/fiber probes; one 95 for examining the liver and the other 97 for examining the stomach.
- FIG. 25(e) shows a hypodermic needle/fiber probe 99 for examining the kidney and a fiber probe 101 for examining the bladder.
Abstract
A method for determining if tissue is malignant as opposed to non-malignant (i.e., benign tumor tissue, benign tissue, or normal tissue). In one embodiment, the method comprises irradiating a human breast tissue sample with light at a wavelength of about 310 nm and measuring the time-resolved fluorescence emitted therefrom at about 340 nm. The time-resolved fluorescence profile is then compared to similar profiles obtained from known malignant and non-malignant human breast tissues. By fitting the profiles to the formula I(t)=A1 e.sup.(-t/τ 1.sup.) +A2 e.sup.(-t/τ 2.sup.), one can quantify the differences between tissues of various conditions. For example, non-malignant human breast tissues exhibit a slow component (τ2) which is less than 1.6 ns whereas malignant human breast tissues exhibit a slow component (τ2) which is greater than 1.6 ns. In addition, non-malignant human breast tissues exhibit a ratio of fast to slow amplitudes (A1 /A2) which is greater than 0.85 whereas malignant human breast tissues exhibit a ratio of fast to slow amplitudes (A1 /A2) which is less than 0.6. This technique can be used with different excitation and/or emission wavelengths, and can be applied to the detection of malignancies (or other abnormal states) in tissues other than human breast tissue.
Description
This application is a continuation-in-part of U.S. patent application Ser. No. 797,723 filed on Nov. 25, 1991 now U.S. Pat. No. 5,348,018 in the names of R. Alfano, A. Pradham, G. Tank, L. Wang, Y. Budansky and B. Das.
The present invention relates generally to methods for detecting malignant tissue and more particularly to a method for detecting malignant tissue using time-resolved fluorescence spectroscopy.
As can readily be appreciated, the detection of malignant (i.e. cancerous) tissue is often a prerequisite to its treatment.
In U.S. Pat. No. 4,930,516, which is issued on Jun. 5, 1990 with Alfaro et el. as inventors, a method and an apparatus for detecting the presence of cancerous tissue using visible luminescence are described. According to the teachings of this patent, the tissue to be examined is excited with a beam of monochromatic light that causes the tissue to fluoresce over a spectrum of wavelengths. The intensity at which the excited tissue fluoresces can be measured either over a spectrum or at a predetermined number of preselected wavelengths. By determining the waylengths at which maximum intensities are attained for the tissue in question and by comparing these peak wavelengths, either visually or electronically, to the peak wavelengths derived from a known non-cancerous tissue, or by comparing the spectrum of the excited tissue with the spectrum of a known noncancerous tissue one can determine the carcinomatoid status of the tissue in question. The invention is based on the discovery that the visible luminescence spectra for cancerous and non-cancerous tissue are substantially different and that the differences are such that visible luminescence from tissue can be used to detect the presence of cancer.
In U.S. Pat. No. 5,042,494, which issued on Aug. 27, 1991 with Alfaro as inventor, a method and an apparatus for detecting the presence of cancerous tissue using native visible luminescence are described. The tissue to be examined is excited with a beam of monochromatic light that causes the tissue to fluoresce over a spectrum of wavelengths. The intensity at which the excited tissue fluoresces can be measured either over a spectrum or at a predetermined number of preselected wavelengths. By determining the wavelengths at which maximum intensities are attained for the tissue in question and by comparing these peak wavelengths, either visually or electronically, to the peak wavelengths derived from a known non-cancerous tissue, or by comparing the luminescence spectrum of the excited tissue with the luminescence spectrum of a known noncancerous tissue and/or known cancerous tissue or the excitation spectrum of the excited tissue with the excitation spectra of known cancerous and/or known non-cancerous tissues one can determine the carcinomatoid status of the tissue in question. Once it has been determined that the tissue is cancerous, it may be destroyed by ablation by exposing it to a beam of light from a high power laser. The invention is based on the discovery that the visible luminescence spectra for cancerous and non-cancerous tissues are substantially different and that the differences are such that visible luminescence from the tissue can be used to detect the presence of cancer and also on the discovery that the spectral profiles of excitation spectra are similarly different.
In Japanese Pat. No. Hei2-22331, which was laid open on Jul. 13, 1983 and which issued on May 18, 1990 with Nishizaka et al. as inventors, a method and a device for detecting abnormal tissue, such as cancerous tissue, by spectroanalysis are described. The method of the present Invention comprises the steps of directing a laser beam onto various samples, analyzing the spontaneous emission caused in the samples, and analyzing the change in the physical characteristics of the samples. Various laser beams, such as the single wave or tunable laser pulse or continuous-mode oscillation laser, are applicable for the excitation of the sample cells. In addition, various spectra are used, such as the wave spectrum, time resolved spectrum, fluorescence spectrum, Raman spectrum and polarized light spectrum. The use of a single spectrum as well as a combination of two or more of the spectra is possible.
In copending and commonly assigned U.S. patent application Ser. No. 07/468,633, filed on Jan. 22, 1990 with Alfano et el. as inventors, a method and an apparatus for distinguishing cancerous tumor tissue from benign tumor tissue, benign tissue and normal tissue using native fluorescence are described. The tissue to be examined is excited with a beam of monochromatic light at about 300 nm. The intensity of the native fluorescence emitted from the tissue is measured at about 340 and 440 nm. The ratio of the two intensities is then calculated and used as a basis for determining if the tissue is cancerous as opposed to benign or normal. The invention is based on the discovery that when cancerous tissue is excited with monochromatic light at about 300 nm, the native fluorescence spectrum over the region from about 320 nm to 600 nm is substantially different from the native fluorescence spectrum that would result if the tissue were either benign or normal. The technique is useful in vivo and in vitro testing of human as well as animal tissue.
In U.S. Pat. No. 4,957,114, which issued on Sep. 18, 1990 with Zeng et el. as inventors, a diagnostic apparatus for intrinsic fluorescence of malignant tumors and a method for using the apparatus for diagnosis are described. The apparatus employs an ultraviolet light source with an emitting waveband of 3000A-4000A. Light from the light source is transmitted through a bundle of quartz optic fibers to the surface of the tumor, whether benign or malignant, to stimulate it, which then generates a specific intrinsic fluorescence spectrum. The intrinsic fluorescence spectrum reflected from the surface of the tumor is transmitted by a second bundle of glass fibers placed near it to a color resolution means, then processed by a scanning means and a circuit means, and displayed recorded by a display recording means. The display may be a graphic presentation of the intrinsic fluorescence spectrum of the tumor that is tested. If the graphic presentation displayed includes a single peak within the range of the blue color band, it indicates that the tumor being tested is bengin. If however, a second peak appears within the range of the red color band of the graphic presentation it is a characteristic peak of malignancy, indicating the existence of a malignant tumor. The presence of the red color can be established by eye rather than a complex resolution system.
In copending and commonly assigned U.S. patent application Ser. No. 07/651,449 filed on Feb. 7, 1991 with Alfano et el. inventors, a method for determining if a tissue is a malignant tumor tissue, a benign tumor tissue, or a benign or normal tissue using Raman spectroscopy is described. The method is based on the discovery that, when irradiated with a beam of infrared, monochromatic light, malignant tumor tissue, benign tumor tissue, and normal or benign tissue produce distinguishable Raman spectra. For human breast tissue, some salient differences in the respective Raman spectra are the presence of four Raman bands at a Raman shift of about 1079, 1300, 1445 and 1659 cm-1 for normal or benign tissue, the presence of three Raman bands at a Raman shift of about 1240, 1445 and 1659 cm-1 for benign tumor tissue, and the presence of two Raman bands at a Raman shift of about 1445 and 1859 cm-1 for malignant tumor tissue. In addition, it was discovered that for human breast tissue the ratio of intensities of the Raman bands at a Raman shift of about 1445 and 1659 cm-1 is about 1.25 for normal or benign tissue, about 0.93 for benign tumor tissue, and about 0.87 for malignant tumor tissue.
It is an object of the present invention to provide a new method for determining if tissue is malignant as opposed to non-malignant (i.e., benign tumor, benign, or normal).
It is another object of the present invention to provide a new method for determining if tumorous tissue is malignant as opposed to benign.
It is yet another object of the present invention to provide a method for detecting malignant tumor tissue which does not require the use of X-ray sensitive plates, photodetectors or ultrasound.
It is still another object of the present invention to provide a method for detecting malignant tissue which can be used either in vivo or in vitro.
The present Invention is based on the surprising discovery that the time-resolved fluorescence spectra obtained from malignant tissues are distinguishable, in many instances, from the time-resolved fluorescence spectra obtained from corresponding non-malignant tissues (i.e., benign tumor tissues, benign tissues, or normal tissues). This was demonstrated, in one instance, by exciting various samples of malignant human breast tissue, benign human breast tumor tissue, benign human breast tissue, and normal human breast tissue with picosecond light pulses having a wavelength of about 310 nm, measuring the time-resolved native fluorescence emitted therefrom at a wavelength of about 340 nm, and comparing the respective spectra. As a means of quantifying some of the differences in the respective spectra, the profiles were fitted to the double exponential I(t)=A1 e.sup.(-t/τ 1.sup.) +A2 e.sup.(-t/τ 2.sup.) by the least square method and differences were noted in the respective slow components (τ2) and in the respective ratios of fast amplitude (A1) to slow amplitude (A2).
Additionally, differences in the respective spectra of malignant human breast tissue samples and benign human breast tumor tissue samples were also observed by exciting the tissue samples with picosecond light pulses at a wavelength of about 353 nm and then measuring the time-resolved native fluorescence emitted therefrom at wavelengths of about 400 nm, about 450 nm and about 500 nm. Examples of distinguishing features included differences in the respective fast components (τ1) and slow components (τ2) of the various spectra.
Furthermore, differences in the respective spectra of malignant human breast tissue samples and normal human breast tissue samples were also observed by exciting the tissue samples with picosecond light pulses at a wavelength of about 530 nm and then measuring the time-resolved native fluorescence emitted therefrom at a wavelength of about 600 nm. An example of a distinguishing feature included differences in the respective fast components (τ1) of the various spectra.
Differences in the time-resolved spectra for malignant and non-malignant lung and overran tissue samples were also observed. For example, when malignant and normal lung tissue samples were excited with picosecond light pulses at a wavelength of about 530 nm and then measured over time at a wavelength of about 600 nm, an appreciable difference was discovered in their respective fast components (τ1). Similarly, when malignant and normal ovarian tissue samples were excited with picosecond light pulses at a wavelength of about 351 nm and then measured at a wavelength of about 450 nm, differences were discovered in both the respective fast components (τ1) and slow components (τ1).
As can readily be appreciated, it is expected that time-resolved fluorescence spectroscopy can also be used to detect cancer in tissues located, for example, in the cervix, the colon, the kidneys, the brain, the gastrointestinal tract, the prostatee, the bladder, the liver, the pancreas, the heart, and the stomach. In addition, it is also expected that time-resolved fluorescence spectroscopy can be used to detect diseased states in various biomedical materials, such as atherosclerosis in blood vessels, leukemia in white blood cells, kidney stones in kidneys, etc.
Other objects, features, and advantages of the present invention will be set forth in part in the description which follows, and in part will be obvious from the description or may be learned by practice of the invention. The objects, features and advantages of the present invention may be realized and attained by means of the instrumentalities and combinations particularly pointed out in the appended claims.
The accompanying drawings, which are hereby incorporated into and constitute a part of this specification, illustrate the preferred embodiments of the invention and, together with the description, serve to explain the principles of the invention. In these drawings wherein like reference numerals represent like parts:
FIG. 1 is a schematic diagram of one embodiment of a time-resolved fluorescence spectroscopy system which may be used to perform the method of the present invention;
FIG. 2 is a schematic diagram of a second embodiment of a time-resolved fluorescence spectroscopy system which may be used to perform the method of the present invention;
FIGS. 3(a) through 3(d) are time-resolved fluorescence profiles of several malignant human breast tissue samples, the profiles being obtained by exciting the samples with light at a wavelength of about 353 nm and then measuring for a period of time the native fluorescence emitted therefrom at a wavelength of about 450 nm;
FIGS. 4(a) through 4(d) are time-resolved fluorescence profiles of the malignant human breast tissue samples of FIGS. 3(a) through 3(d), respectively, the profiles being obtained by exciting the samples with light at a wavelength of about 353 nm and then measuring for a period of time the total native fluorescence emitted therefrom;
FIGS. 5(a) and 5(b) are time-resolved fluorescence profiles of two benign human breast tumor tissue samples, the profiles being obtained by exciting the samples with light at a wavelength of about 353 nm and then measuring for a period of time the native fluorescence emitted therefrom at a wavelength of about 450 nm;
FIGS. 6(a) and 6(b) are time-resolved fluorescence profiles of the two benign human breast tumor tissue samples of FIGS. 5(a) and 5(b), the profiles being obtained by exciting the samples with light at a wavelength of about 353 nm and then measuring for a period of time the total native fluorescence emitted therefrom;
FIG. 7 is a representative time-resolved fluorescence profile of a malignant human breast tissue sample, the profile being obtained by exciting the sample with light at a wavelength of about 310 nm and then measuring for a period of time the native fluorescence emitted therefrom at a wavelength of about 340 nm;
FIG. 8 is a representative time-resolved fluorescence profile of a benign human breast tumor tissue sample, the profile being obtained by exciting the sample with light at a wavelength of about 310 nm and then measuring for a period of time the native fluorescence emitted therefrom at a wavelength of about 340 nm;
FIG. 9 is a representative time-resolved fluorescence profile of a benign human breast tissue sample, the profile being obtained by exciting the sample with light at a wavelength of about 310 nm and then measuring the native fluorescence emitted therefrom at a wavelength of about 340 nm;
FIG. 10 is a representative time-resolved fluorescence profile of a normal human breast tissue sample, the profile being obtained by exciting the sample with light at a wavelength of about 310 nm and then measuring the native fluorescence emitted therefrom at a wavelength of about 340 nm;
FIG. 11 is a histogram of the ratio of amplitudes of the fast components of fluorescence decay from malignant and non-malignant human breast tissues in the 340 nm emission band following excitation with light at a wavelength of about 310 nm;
FIG. 12 is a histogram of the slow component of fluorescence lifetimes from malignant and non-malignant human breast tissues in the 340 nm emission band following excitation with light at a wavelength of about 310 nm;
FIG. 13 is a time-resolved fluorescence profile of a malignant human lung tissue sample, the profile being obtained by exciting the sample with light at a wavelength of about 530 nm and then measuring the native fluorescence emitted therefrom at a wavelength of about 600 nm;
FIG. 14 is a time-resolved fluorescence profile of a normal human lung tissue sample, the profile being obtained by exciting the sample with light at a wavelength of about 530 nm and then measuring the native fluorescence emitted therefrom at a wavelength of about 600 nm;
FIG. 15 is a time-resolved fluorescence profile of a malignant human ovarian tissue sample, the profile being obtained by exciting the sample with light at a wavelength of about 351 nm and then measuring the native fluorescence emitted therefrom at a wavelength of about 450 nm;
FIG. 16 is a time-resolved fluorescence profile of a normal human ovarian tissue sample, the profile being obtained by exciting the sample with light at a wavelength of about 351 nm and then measuring the native fluorescence emitted therefrom at a wavelength of about 450 nm.
FIG. 17 is a block diagram of the invention;
FIG. 18 is a diagram of an embodiment of the invention using an optical fiber bundle/endoscope combination;
FIG. 19 is a more detailed view of the optical fiber bundle/endoscope shown in FIG. 18;
FIG. 20 is a more detailed view of the probe end of the endoscope shown in FIG. 19;
FIG. 21 is a view of a hypodermic needle optical fiber set for use in practicing the invention;
FIG. 22 is a more detailed view of the hypodermic needle shown in FIG. 21;
FIG. 22(a) is a fragmentary side view of the probe tip shown in FIG. 22;
FIG. 23(a), (b) and (c) are views of variations of the tip end of the needle shown in FIG. 22;
FIG. 24 is a view showing the needle fiber cable probe inserted into an endoscope; and
FIGS. 25(a) through 25(e) are views showing five different applications of the invention.
The present invention is directed to a new method for determining if tissue is malignant as opposed to non-malignant (i.e., benign tumor, benign tissue, or normal). This method is premised on the discovery that, under certain conditions, the time-resolved fluorescence profile of a malignant tissue is distinguishable from that of a corresponding non-malignant tissue. The present inventors believe that such differences are attributable, at least in part, to microenvironmental changes which take piece within malignant cells and which affect the time-resolved fluorescence properties of naturally-occurring fluorophores present within the cells. Examples of fluorophores which are believed to be affected in the manner described above include tryptophan, various nucleotides, particularly nicotinamide adenine dinucleotide hydride (NADH), flavins, collagen, and elastin. Such molecules are present, to some extent, in virtually every type of tissue although the amount of any given type of molecule typically varies from tissue to tissue. Generally speaking, steady-state fluorescence of tryptophan and, to a lesser extent, NADH, elastin, and collagen can be achieved by excitation with light at a wavelength of about 300 nm. In addition, excitation with light at a wavelength of about 350 nm typically causes both NADH and flavins to fluoresce. Moreover, excitation with light at a wavelength of about 530 nm typically causes flavins to fluoresce. Consequently, excitation with light at one or more of the above-mentioned wavelengths is a good starting point for selection of an appropriate excitation wavelength that will permit one to detect differences in the time-resolved fluorescence of malignant and non-malignant tissues. (As will be seen below, an appropriate fluorescence wavelength must also be selected.) It should be understood that other excitation wavelengths, besides the three described above, may also be appropriate and, furthermore, that additional fluorophores may exist, which may or may not be excited at the above-mentioned wavelengths.
Referring now to FIG. 1, there is shown a schematic diagram of one embodiment of a time-resolved fluorescence spectroscopy system which may be used to perform the method of the present invention, the system being represented by reference numeral 11.
In analyzing the fluorescence profile of a sample tissue, it is often helpful to look at certain signature features that appear differently in the profiles of malignant tissues than in the profiles of non-malignant tissues. Such signature features include the shape of the fluorescence profile, its relaxation lifetime, and the amplitude(s) (or ratio of amplitudes) of the relaxation component(s). In many instances, these features may be quantified by fitting the fluorescence profile to the equation I(t)=ΣAi e.sup.(-t/τ i.sup.) wherein τ is dependent upon the number of fluorophores being excited, the number of different environments in which a single fluorophore is being excited, the re-radiation of an excited fluorophore after a time lag, or the like.
A second embodiment of a time-resolved fluorescence spectroscopy system constructed according to the teachings of the present invention is shown in FIG. 2, the system being represented generally by reference numeral 51.
Time-resolved fluorescence profiles for a malignant human breast tissue sample and a normal human breast tissue sample were obtained and fitted to the equation I(t)=A1 e.sup.(-tτ 1.sup.) +A2 e.sup.(-t/τ 2.sup.) using the general set-up of system 51, The excitation wavelength used was about 530 nm, and the native fluorescence emitted from the tissue samples was measured after passage through either a wide band 600 nm filter (WB600) or no filter (WHOLE BAND). The results are set forth below in Table 1.
              TABLE 1
______________________________________
            WHOLE BAND  WB600
              τ.sub.1
                       τ.sub.2
                                τ.sub.1
                                      τ.sub.2
SAMPLE        A.sub.1  A.sub.2  A.sub.1
                                      A.sub.2
______________________________________
Normal Human  210 ps   1.7 ns   190 ps
                                      1.6 ns
Breast Tissue 80.6     137.8    62    145
Malignant Human
              170 ps   1.6 ns   110 ps
                                      1.6 ns
Breast Tumor Tissue
              112      120      52.8  178
______________________________________
As can be seen, the fast component (τ1) of the malignant human breast tissue is considerably faster than the fast component (τ1) of the normal human breast tissue (100 ps vs. 200 ps) whereas the slow components (τ2) of the two tissues are about the same (approx, 1.6 ns). Other differences in the respective spectra include variations in amplitudes A1 and A2 of the malignant and normal tissues.
Time-resolved fluorescence profiles for various malignant human breast tissue samples and benign human breast tumor tissue samples were obtained using the general set-up of system 51 and fitted to the equation I(t)=A1 e.sup.(-t/τ 1.sup.) +A2 e.sup.(-t/τ 2.sup.). The excitation wavelength used was about 350 nm, and the fluorescence emitted from the tissue samples was measured after passage through either a wide band 400 nm filter (WB400), a wide band 450 nm filter (W8450), a wide band 500 nm filter (W8500) or no filter (WHOLE BAND). The results are set forth below in Table 2. (In addition, the fluorescence profiles for each of the tissue samples listed below using either a wide band 450 nm filter or no filter are shown in FIGS. 3 through 6.)
                                  TABLE 2
__________________________________________________________________________
         WHOLE BAND
                  WB400   WB450   WB500
         τ.sub.1
             τ.sub.2
                  τ.sub.1
                      τ.sub.2
                          τ.sub.1
                              τ.sub.2
                                  τ.sub.1
                                      τ.sub.2
SAMPLE   A.sub.1
             A.sub.2
                  A.sub.1
                      A.sub.2
                          A.sub.1
                              A.sub.2
                                  A.sub.1
                                      A.sub.2
__________________________________________________________________________
Malignant Tumor
         120 ps
             2.3 ns
                  117 ps
                      2.5 ns
                          117 ps
                              2.5 ns
                                  117 ps
                                      2.4 ns
Tissue Sample
         2.6 4.3  2.6 5.1 2.2 4.8 2.4 5.4
LB96 p1
Malignant Tumor
         144 ps
             2.3 ns
                  80 ps
                      2.5 ns
                          99 ps
                              2.7 ns
                                  123 ps
                                      2.7 ns
Tissue Sample
         4.6 4.2  3.5 5.2 3.5 4.4 2.4 3.8
LB96 p2
Malignant Tumor
         206 ps
             2.2 ns
                  79 ps
                      2.6 ns
                          52 ps
                              2.77 ns
                                  76 ps
                                      2.8 ns
Tissue Sample
         4   4.7  2.7 6.6 2.3 4.3 2.8 4.7
LB99 p1
Malignant Tumor
         83 ps
             2.7 ns
                  82 ps
                      2.8 ns
                          42 ps
                              3 ns
                                  68 ps
                                      3 ns
Tissue Sample
         2   4.8  2.9 5.7 2   4.2 2.3 4
LB99 p2
Benign Tumor
         288 ps
             2.1 ns
                  --  --  236 ps
                              2.1 ns
                                  226 ps
                                      1.6 ns
Tissue Sample
         4.3 4.3  --  --  3.9 5   3.4 4.4
LB98 p1
Benign Tumor
         206 ps
             2.2 ns
                  --  --  189 ps
                              2.2 ns
                                  285 ps
                                      2.2 ns
Tissue Sample
         3.6 4.9  --  --  3.1 4   3   3.1
LB98 p2
__________________________________________________________________________
As can be seen, the fast components (τ1) of the malignant tissues are less than about 150 ps while the fast components (τ1) of the benign tumor tissues are greater than 200 ps. In addition, the slow components (τ2) of the malignant tissues are greater than 2.4 ns whereas the slow components (τ2) of the benign tumor tissues are less than 2.4 ns. Consequently, using these signature differences, one can accurately characterize tumorous tissue as being either malignant or benign.
Ultrafast 100 fs laser pulses (repetition rate--82 MHz; wavelength--620±7 nm; beam diameter--3 mm) of 0.1 nJ per pulse were generated from a colliding pulse mode-locked dye laser system. These laser pulses were amplified by a sulphur rhodamine gain medium pumped by a copper vapor laser at 6.5 kHz. Laser pulses at 310 nm wavelength were obtained by focusing the 620 nm beam into a KDP crystal to generate the second harmonic. Breast tissue samples were put into quartz cells and excited at 310 nm. The pulse energy at the sample site was 0.5 uJ and the results were an average of a few tens of thousand pulses. The fluorescence was collected into a synchroscan streak camera with a temporal resolution of 16 ps. The sampling volume was a few hundred microns in area and 1 mm in depth. The tissue fluorescence was collected at the emission band of 340 nm±5 nm and 440 nm±5 nm using narrow band filters. Time-resolved fluorescence measurements were performed on 18 samples of human breast tissue from different sources--6 malignant tumors, 5 benign tissues, 5 normal tissues, and 2 benign tumors. The profiles were then fitted to the equation I(t)=A1 e.sup.(-t/τ 1.sup.) +A2 e.sup.(-t/τ 2.sup.). The results are set forth below in Table 3. (In addition, the fluorescence profiles for representative malignant, benign tumor, benign tissue and normal samples are shown in FIGS. 7 through 10, respectively.)
              TABLE 3
______________________________________
         340 nm       440 nm
SAMPLE     τ.sub.1
                  τ.sub.2
                          A.sub.1 /A.sub.2
                                τ.sub.1
                                      τ.sub.2
                                           A.sub.1 /A.sub.2
______________________________________
Benign Tumor
           49     0.894   1.52  79    1.93 0.21
Tissue Sample
LB 114
Benign     46     1.14    1.2   69    1.22 0.97
Tissue Sample
LB 117
Benign Tumor
           59     0.889   2.58  65    1.41 0.81
Tissue Sample
LB 118
Benign     60     1.1     1.04  80    1.05 0.74
Tissue Sample
LB 119
Benign     50     1.34    1.1   72    1.6  0.5
Tissue Sample
LB 155
Benign     60     1.1     0.9   --    --   --
Tissue Sample
LB 156
Benign     102    1.12    0.85  49    1.4  0.5
Tissue Sample
LB 163
Normal Tissue
           103    1.34    1.35  --    --   --
Sample BR1
Normal Tissue
           75     1.65    0.78  --    --   --
Sample BR3
Normal Tissue
           81     1.36    0.9   --    --   --
Sample BR6
Normal Tissue
           114    0.616   1.47  --    --   --
Sample BR7
Normal Tissue
           85     1.38    1.83  89    1.7  0.86
Sample BR11
Malignant  54     2.06    0.46  39    1.64 0.2
Tissue Sample
LB109
Malignant
Tissue Sample
           65     2.06    0.11  --    --   --
LB110
Malignant  79     1.99    0.5   66.8  1.35 1.8
Tissue Sample
LB113
Malignant  110    1.93    0.26  --    --   --
Tissue Sample
LB148
Malignant  20.5   1.64    0.46  52    1.7  0.66
Tissue Sample
LB162
Malignant  77     1.8     0.56  93    1.8  0.74
Tissue Sample
LB169
______________________________________
As can be seen, the measurements taken using the 340 nm filter show significant differences in the fluorescence lifetimes and amplitudes of the malignant tissue samples as compared to the non-malignant tissue samples (i.e., benign tumor, benign tissue, and normal samples). For example, the slow component (τ2) for the non-malignant tissue samples is typically less than about 1.6 ns whereas the slow component (τ2) for the malignant tissue samples is typically greater than about 1.6 ns. (This data is expressed in the form of a histogram in FIG. 11, where it can be seen that the mean for the slow component of the non-malignant tissue samples is about 1.16±0.27 ns whereas the mean for the slow component of the malignant tissue samples is about 1.91±0.16 ns.) In addition, the ratio of fast to slow amplitudes (A1 /A2) for the non-malignant tissue samples is typically greater than about 0.85 whereas the ratios of fast to slow amplitudes (A1 /A2) for the malignant tissues is typically less than about 0.6. (This data is also expressed in the form of a histogram in FIG. 12, where it can be seen that the mean for the ratio of amplitudes for the non-malignant tissue samples is about 1.29±0.51 whereas the mean for the ratio of amplitudes for the malignant tissue samples is about 0.39±0.17.)
In contrast with the series of measurements taken at about 340 nm, the measurements taken at 440 nm do not appear to show any significant differences in the fluorescence lifetimes or amplitudes of the malignant tissue samples as compared to the non-malignant tissue samples.
As can readily be appreciated, the above examples are not intended to be limiting, and it is envisioned that additional differences in the time-resolved fluorescence spectra of malignant human breast tissues and non-malignant human breast tissues may be found by using different excitation and/or emission wavelengths. Some guidance for selecting the appropriate excitation and/or emission wavelengths may be derived from those excitation and/or emission wavelengths which produce a discernible difference in the steady-state fluorescence spectra of malignant human breast tissues and non-malignant human breast tissues. (This approach, however, is not foolproof as can be seen above from the results of the measurements taken at 440 nm.).
As can also be appreciated, the approach discussed above can also be applied to detecting cancer in tissues other than human breast tissue. For example, FIGS. 13 and 14 illustrate the time-resolved fluorescence profiles of a normal human lung tissue sample and a cancerous human lung tissue sample, respectively, the profiles being obtained by exciting the respective samples with light at a wavelength of about 530 nm and then measuring the native fluorescence emitted therefrom at a wavelength of about 600 nm. When the profiles were fitted to the double exponential equation described above, it was observed that the fast component (τ1) of the malignant tissue was appreciably faster (120 ps vs. 220 ps) than that of the normal tissue.
The above-described technique was also applied to the detection of cancer in ovarian tissue as seen in FIGS. 15 and 16, which illustrate the time-resolved fluorescence profiles of a malignant human ovarian tissue sample and a normal human ovarian tissue sample, respectively, the profiles being obtained by exciting the sample with light at a wavelength of about 351 nm and then measuring the native fluorescence emitted therefrom at a wavelength of about 450 nm. When the profiles were fitted to the double exponential equation described above, it was observed that the fast component (τ1) of the malignant tissue was appreciably faster (178 ps vs. 218) than that of the normal tissue whereas the slow component (τ2) of the malignant tissue was appreciably slower (2.77 ns vs. 2.55 ns) than that of the normal tissue.
Finally, the above-described technique may also be applied to differentiating other abnormal or diseased states, besides cancer, from normal states in various types of tissues.
It is to be understood that various different types of optical instruments may be used to deliver the excitation light to the tissue sample and/or to collect the fluorescent light emitted therefrom for in vivo and/or in vitro applications. Such instruments may include lenses, endoscopes, optical fibers with hypodermic needles, microscopes, and the like.
FIG. 17 displays the general set-up of the invention with light from a laser source 41 reaching the sample S after passing through the required optics 43 (lens, fibers or an endoscope). The emission from the sample is then collected by the collection optics 45 (lens, fibers, endoscope or a microscope). The emission is then analyzed in a certain spectral band using a spectrum analyzer and time-resolved in a time analyzer 49 and imaged by a camera 51. The resulting profile is displayed on a monitor 53. A computer 55 is used to determine the lifetimes and amplitudes of the different components of the fluorescence decay profile by the least square method of fitting.
In FIG. 18, a laser beam from a laser 61 passes through an optical fiber bundle/endoscope 63 to excite the tissues inside the body. The fluorescence from the tissue is collected through the fiber to spectral and temporal analyzers 65 and 67, respectively. The output of analyzer 67 is fed into a computer 69 and displayed on a display 71. The endoscope used is described in FIG. 5. In this case the lifetimes and amplitudes are measured in vivo. An optical fiber bundle array can be used to deliver excitation pulse to the sample and collect fluorescence for temporal analysis.
FIG. 19 displays the pumping/probing fiber cable set in FIG. 18. The excitation end 63-1 is adapted to be connected to the laser to excite the sample tissue. The monochromator end 63-2 of the fiber is adapted to be connected to the spectrum analyzer and the temporal analyzer to analyse the temporal and spectral data of the fluorescence. The single section of the bifurcated fiber is inserted into the operational channel of the endoscope 64. The probe end 64-1 of the cable is located at the bottom end plane of the endoscope probe (see FIG. 20).
FIG. 20 displays the design of the probe end 64-1 in more detail. The probe end 64-1 consists of: (1) jacket 64-2, (2) focussing/collecting lens 64-3, (3) fiber end 64-4. Lens (2) is mounted inside the hard jacket that is glued to the fiber cable. The lens should be in a good position so as to concentrate the pump beam at the jacket output plane and collect as much fluorescence as possible into the bundle fiber. The end view shows the fiber bundle cross section where the fiber at the center is for the laser beam to pass into the body. The fibers surrounding this central fiber receive the fluorescene from the tissue and are allowed out of the body through the fiber, to the spectral and temporal analyzers for analysis of fluorescence lifetimes and spectra.
FIG. 21 displays a hypodermic needle fiber cable set (probe) 71 combination according to this invention for insertion into body parts or used with an endoscope. The bifurcated fiber cable portion 73 has three terminal points.
The single section 75 of the bifurcated fiber is inserted into a hypodermic needle 77 which serves to excite and to collect fluorescence from the sample for measurements of fluorescence spectral or lifetimes. The collection and focussing optics are placed in the needle tip-79.
The input excitation end 81 has an SMA connector 83.
The output monochromator end 85 is terminated in an in-line slit bundle 87 or circular bundle.
The needle 77 can be placed inside an endoscope or outside an endoscope for direct use.
To prevent obstruction of the probe window tip during insertion into body tissue or organ to be studied a protective sleeve 89 is used as shown in FIG. 22. When the needle is inserted, a protective sleeve is pulled back exposing an optical window 91 for measurements to be made.
The light path could be 90 degrees or collinear to the fiber or can be reflected off mirror/plug 90 as shown in FIG. 22(a).
Possible design for protective sleeve 89 can be made to expose the probe window 91 by rotation or retraction of sleeve 89.
It is possible to use a curved mirror 92 for focussing and collection of fluorescence from tissue, prism to reflect light outside as shown in FIG. 23(a).
A straight-through pump-probe design is also possible as shown in probe end 64-6 in FIG. 23(b). A quart window of 1 or 2 mm thickness replaces the mirror plug. The needle tip and window are cut at Brewsters angle to minimize reflection losses.
FIG. 24 displays the needle fiber cable probe 71 inserted in an instrument channel of an endoscope 81 (for visual convenience as well as fluorescence time and spectra measurements).
Hypodermic needle fiber probe can be used separately to investigate the time-resolved fluorescence spectroscopy of a tumor inside the body where the endoscope cannot be simply used (breast, kidney, liver, bladder, heart, pancreas, prostate, brain, eye, ear).
The position of the needle during investigation can be used in conjugation with ultrasonic survey or X-ray.
By using a tapered fiber for the pumping of the system, collection from the excitation source is maximized and the diameter of the pump beam is minimized without losing any power.
Fluorescence collection is maximized by the short distance between fiber end and the collecting focussing optics end.
FIGS. 25(a) through 25(e) display insertion of a hypodermic needle into the body for measurements in organs not accessible by an endoscope alone and endoscope insertion by itself into the body for measurements. FIG. 25(a) shows a hypodermic needle/fiber probe/endoscope combination 91 for sampling tissue in the prostate gland. FIG. 25(b) shows a hypodermic needle/probe combination 93 for sampling tissue in the breast. FIG. 25(c) shows a hypodermic needle/fiber probe 95 used to sample brain tissue. FIG. 25(d) shows two hypodermic needle/fiber probes; one 95 for examining the liver and the other 97 for examining the stomach. FIG. 25(e) shows a hypodermic needle/fiber probe 99 for examining the kidney and a fiber probe 101 for examining the bladder.
The embodiments of the present invention are intended to be merely exemplary and those skilled in the art shall be able to make numerous variations and modifications to it without departing from the spirit of the present invention. All such variations and modifications are intended to be within the scope of the present invention as defined in the appended claims.
Claims (5)
1. A method for determining if a human breast tissue sample is malignant as opposed to non-malignant comprising:
a) irradiating the human breast tissue sample with light at a wavelength of about 310 nm whereby native time-resolved fluorescence is emitted therefrom;
b) measuring the native time-resolved fluorescence emitted therefrom at a wavelength of about 340 nm; and
c) comparing the native time-resolved fluorescence emitted from the human breast tissue sample to that emitted from known malignant and non-malignant human breast tissues;
d) the irradiating and measuring steps being performed using a fiber optic bundle in combination with a hypodermic needle to convey the light to and from the human breast tissue.
2. The method as claimed in claim 1 wherein said measuring step is performed with a measuring device selected from the group consisting of a streak camera, an optical Kerr gate, an up-conversion gate, a time-correlated single photon counting instrument, a phase fluorimeter, and an oscilloscope with a fast photodetector.
3. The method as claimed in claim 1 wherein said measuring step is performed with a streak camera.
4. A method for determining if a tissue sample selected from the group consisting of human breast tissue and human ovarian tissue is malignant as opposed to non-malignant comprising:
a) irradiating the tissue sample with light at a wavelength of about 353 nm;
b) measuring a native time-resolved fluorescence emitted therefrom over one or more wavelengths in a spectral band from about 400 nm to about 500 nm; and
c) determining the condition of the tissue sample in accordance with said measurement;
d) the irradiating and measuring steps being performed using a fiber optic bundle in combination with a hypodermic needle to convey the light to and from the tissue sample.
5. A method for determining if a tissue sample selected from the group consisting of human breast tissue and human lung tissue is malignant as opposed to non-malignant comprising:
a) irradiating the tissue sample with light at a wavelength of about 530 nm;
b) measuring a native time-resolved fluorescence emitted therefrom over one or more wavelengths in a spectral band from about 500 nm to about 600 nm; and
c) determining the condition of the tissue sample in accordance with said measurement;
d) the irradiating and measuring steps being performed using a fiber optic bundle in combination with a hypodermic needle to convey the light to and from the tissue sample.
Priority Applications (1)
| Application Number | Priority Date | Filing Date | Title |
|---|---|---|---|
| US08/112,291 US5467767A (en) | 1991-11-25 | 1993-08-27 | Method for determining if tissue is malignant as opposed to non-malignant using time-resolved fluorescence spectroscopy |
Applications Claiming Priority (2)
| Application Number | Priority Date | Filing Date | Title |
|---|---|---|---|
| US07/797,723 US5348018A (en) | 1991-11-25 | 1991-11-25 | Method for determining if tissue is malignant as opposed to non-malignant using time-resolved fluorescence spectroscopy |
| US08/112,291 US5467767A (en) | 1991-11-25 | 1993-08-27 | Method for determining if tissue is malignant as opposed to non-malignant using time-resolved fluorescence spectroscopy |
Related Parent Applications (1)
| Application Number | Title | Priority Date | Filing Date |
|---|---|---|---|
| US07/797,723 Continuation-In-Part US5348018A (en) | 1991-11-25 | 1991-11-25 | Method for determining if tissue is malignant as opposed to non-malignant using time-resolved fluorescence spectroscopy |
Publications (1)
| Publication Number | Publication Date |
|---|---|
| US5467767A true US5467767A (en) | 1995-11-21 |
Family
ID=46248097
Family Applications (1)
| Application Number | Title | Priority Date | Filing Date |
|---|---|---|---|
| US08/112,291 Expired - Lifetime US5467767A (en) | 1991-11-25 | 1993-08-27 | Method for determining if tissue is malignant as opposed to non-malignant using time-resolved fluorescence spectroscopy |
Country Status (1)
| Country | Link |
|---|---|
| US (1) | US5467767A (en) |
Cited By (77)
| Publication number | Priority date | Publication date | Assignee | Title |
|---|---|---|---|---|
| US5842995A (en) * | 1996-06-28 | 1998-12-01 | Board Of Regents, The Univerisity Of Texas System | Spectroscopic probe for in vivo measurement of raman signals |
| US5919140A (en) * | 1995-02-21 | 1999-07-06 | Massachusetts Institute Of Technology | Optical imaging using time gated scattered light |
| US5921926A (en) * | 1997-07-28 | 1999-07-13 | University Of Central Florida | Three dimensional optical imaging colposcopy |
| US5984861A (en) * | 1997-09-29 | 1999-11-16 | Boston Scientific Corporation | Endofluorescence imaging module for an endoscope |
| US5991653A (en) * | 1995-03-14 | 1999-11-23 | Board Of Regents, The University Of Texas System | Near-infrared raman spectroscopy for in vitro and in vivo detection of cervical precancers |
| WO1999060377A1 (en) | 1998-05-19 | 1999-11-25 | Spectrx, Inc. | Apparatus and method for determining tissue characteristics |
| US6008889A (en) * | 1997-04-16 | 1999-12-28 | Zeng; Haishan | Spectrometer system for diagnosis of skin disease |
| US6013024A (en) * | 1997-01-20 | 2000-01-11 | Suzuki Motor Corporation | Hybrid operation system |
| US6021344A (en) * | 1996-12-04 | 2000-02-01 | Derma Technologies, Inc. | Fluorescence scope system for dermatologic diagnosis |
| US6026319A (en) * | 1997-02-13 | 2000-02-15 | Fuji Photo Film Co., Ltd. | Fluorescence detecting system |
| US6055451A (en) | 1997-12-12 | 2000-04-25 | Spectrx, Inc. | Apparatus and method for determining tissue characteristics |
| US6066102A (en) * | 1998-03-09 | 2000-05-23 | Spectrascience, Inc. | Optical biopsy forceps system and method of diagnosing tissue |
| US6070096A (en) * | 1996-03-06 | 2000-05-30 | Fuji Photo Film Co., Ltd. | Fluorescence detecting apparatus |
| US6070583A (en) * | 1995-02-21 | 2000-06-06 | Massachusetts Institute Of Technology | Optical imaging of tissue using inelastically scattered light |
| US6095982A (en) * | 1995-03-14 | 2000-08-01 | Board Of Regents, The University Of Texas System | Spectroscopic method and apparatus for optically detecting abnormal mammalian epithelial tissue |
| US6096065A (en) * | 1997-09-29 | 2000-08-01 | Boston Scientific Corporation | Sheath for tissue spectroscopy |
| US6119031A (en) * | 1996-11-21 | 2000-09-12 | Boston Scientific Corporation | Miniature spectrometer |
| US6144791A (en) * | 1995-11-20 | 2000-11-07 | Cirrex Corp. | Beam steering for optical fibers and other related devices |
| US6174291B1 (en) | 1998-03-09 | 2001-01-16 | Spectrascience, Inc. | Optical biopsy system and methods for tissue diagnosis |
| US6185443B1 (en) | 1997-09-29 | 2001-02-06 | Boston Scientific Corporation | Visible display for an interventional device |
| US6201989B1 (en) | 1997-03-13 | 2001-03-13 | Biomax Technologies Inc. | Methods and apparatus for detecting the rejection of transplanted tissue |
| US6208783B1 (en) | 1997-03-13 | 2001-03-27 | Cirrex Corp. | Optical filtering device |
| US6243484B1 (en) | 1997-03-21 | 2001-06-05 | Dobi Medical Systems, Llc | Dynamic-functional imaging of biological objects using a non-rigid object holder |
| US20010003800A1 (en) * | 1996-11-21 | 2001-06-14 | Steven J. Frank | Interventional photonic energy emitter system |
| US6258576B1 (en) | 1996-06-19 | 2001-07-10 | Board Of Regents, The University Of Texas System | Diagnostic method and apparatus for cervical squamous intraepithelial lesions in vitro and in vivo using fluorescence spectroscopy |
| US6289229B1 (en) | 1998-01-20 | 2001-09-11 | Scimed Life Systems, Inc. | Readable probe array for in vivo use |
| US6304771B1 (en) * | 1993-10-29 | 2001-10-16 | The Trustees Of The University Of Pennsylvania | Systems and methods for imaging fluorophores |
| US6317624B1 (en) | 1997-05-05 | 2001-11-13 | The General Hospital Corporation | Apparatus and method for demarcating tumors |
| US6324418B1 (en) | 1997-09-29 | 2001-11-27 | Boston Scientific Corporation | Portable tissue spectroscopy apparatus and method |
| US6370406B1 (en) | 1995-11-20 | 2002-04-09 | Cirrex Corp. | Method and apparatus for analyzing a test material by inducing and detecting light-matter interactions |
| US6377842B1 (en) | 1998-09-22 | 2002-04-23 | Aurora Optics, Inc. | Method for quantitative measurement of fluorescent and phosphorescent drugs within tissue utilizing a fiber optic probe |
| US6405073B1 (en) | 1997-07-22 | 2002-06-11 | Scimed Life Systems, Inc. | Miniature spectrometer system and method |
| US6411838B1 (en) * | 1998-12-23 | 2002-06-25 | Medispectra, Inc. | Systems and methods for optical examination of samples |
| US6424858B1 (en) * | 1998-11-12 | 2002-07-23 | John L. Williams | Apparatus and method for viewing vasculature of a human being |
| US20020107668A1 (en) * | 2000-12-15 | 2002-08-08 | Costa Peter J. | System for normalizing spectra |
| US6444970B1 (en) | 1998-06-26 | 2002-09-03 | Scimed Life Systems, Inc. | Miniature low-noise photodiode system |
| US6545260B1 (en) * | 1999-11-19 | 2003-04-08 | Olympus Optical Co., Ltd. | Light scanning optical device which acquires a high resolution two-dimensional image without employing a charge-coupled device |
| US6571119B2 (en) | 1996-03-06 | 2003-05-27 | Fuji Photo Film Co., Ltd. | Fluorescence detecting apparatus |
| US6580935B1 (en) | 1999-03-12 | 2003-06-17 | Cirrex Corp. | Method and system for stabilizing reflected light |
| US6587578B2 (en) | 1997-03-21 | 2003-07-01 | Dobi Medical Systems, Inc. | Dynamic-functional imaging of biological objects using a non-rigid object holder |
| US20030130562A1 (en) * | 2002-01-09 | 2003-07-10 | Scimed Life Systems, Inc. | Imaging device and related methods |
| US6631289B2 (en) * | 2000-01-20 | 2003-10-07 | Research Foundation Of Cuny | System and method of fluorescence spectroscopic imaging for characterization and monitoring of tissue damage |
| US6665556B1 (en) * | 1999-01-29 | 2003-12-16 | Robert R. Alfano | Method and apparatus for examining a tissue using the spectral wing emission therefrom induced by visible to infrared photoexcitation |
| US20040006275A1 (en) * | 2002-07-05 | 2004-01-08 | The Regents Of The University Of California | Near-infrared spectroscopic tissue imaging for medical applications |
| US20040006276A1 (en) * | 2002-07-05 | 2004-01-08 | The Regents Of The University Of California | Autofluorescence detection and imaging of bladder cancer realized through a cystoscope |
| US6697666B1 (en) | 1999-06-22 | 2004-02-24 | Board Of Regents, The University Of Texas System | Apparatus for the characterization of tissue of epithelial lined viscus |
| US20040039268A1 (en) * | 2002-04-06 | 2004-02-26 | Barbour Randall L. | System and method for quantifying the dynamic response of a target system |
| US20040064053A1 (en) * | 2002-09-30 | 2004-04-01 | Chang Sung K. | Diagnostic fluorescence and reflectance |
| US20040077951A1 (en) * | 2002-07-05 | 2004-04-22 | Wei-Chiang Lin | Apparatus and methods of detection of radiation injury using optical spectroscopy |
| US20040092807A1 (en) * | 2002-11-07 | 2004-05-13 | Amos Breskin | System and method for cancer detection |
| US6763262B2 (en) * | 2000-05-19 | 2004-07-13 | Tuilaser Ag | Method and apparatus for detecting tumorous tissue |
| US6768918B2 (en) | 2002-07-10 | 2004-07-27 | Medispectra, Inc. | Fluorescent fiberoptic probe for tissue health discrimination and method of use thereof |
| US6818903B2 (en) | 2002-07-09 | 2004-11-16 | Medispectra, Inc. | Method and apparatus for identifying spectral artifacts |
| US6826422B1 (en) | 1997-01-13 | 2004-11-30 | Medispectra, Inc. | Spectral volume microprobe arrays |
| US20050190982A1 (en) * | 2003-11-28 | 2005-09-01 | Matsushita Electric Industrial Co., Ltd. | Image reducing device and image reducing method |
| US20080267472A1 (en) * | 2002-07-05 | 2008-10-30 | Demos Stavros G | Simultaneous acquisition of differing image types |
| US20090030279A1 (en) * | 2007-07-27 | 2009-01-29 | Zander Dennis R | Method and system for managing power consumption in a compact diagnostic capsule |
| US20090292211A1 (en) * | 2002-07-05 | 2009-11-26 | Vanderbilt University | Methods and Apparatus for Optical Spectroscopic Detection of Cell and Tissue Death |
| US20100305436A1 (en) * | 2007-09-14 | 2010-12-02 | Light Sciences Oncology , Inc. | Systems, devices, and methods for photoactive assisted resection |
| US20110213252A1 (en) * | 1999-01-26 | 2011-09-01 | Fulghum Stephen F | Autofluorescence imaging system for endoscopy |
| US8328877B2 (en) | 2002-03-19 | 2012-12-11 | Boston Scientific Scimed, Inc. | Stent retention element and related methods |
| JP2013000387A (en) * | 2011-06-17 | 2013-01-07 | Konica Minolta Advanced Layers Inc | Endoscope |
| US20130197371A1 (en) * | 2010-10-07 | 2013-08-01 | Kyushu University, National University Corporation | Diagnostic system |
| US8580054B2 (en) | 2012-04-04 | 2013-11-12 | Lawrence Livermore National Security, Llc | Melt-castable energetic compounds comprising oxadiazoles and methods of production thereof |
| EP2699904A1 (en) * | 2011-04-20 | 2014-02-26 | IM Co., Ltd. | Prostate cancer diagnosis device using fractal dimension value |
| US20140293651A1 (en) * | 2011-12-13 | 2014-10-02 | Olympus Corporation | Light source system having light guide routes |
| US8872125B2 (en) | 2009-04-03 | 2014-10-28 | Lawrence Livermore National Security, Llc | Solution-grown crystals for neutron radiation detectors, and methods of solution growth |
| WO2015113113A1 (en) * | 2014-02-03 | 2015-08-06 | The University Of Western Australia | A medical device for insertion into a material to obtain a material sample and a method thereof |
| US9121947B2 (en) | 2012-01-23 | 2015-09-01 | Lawrence Livermore National Security, Llc | Stress reduction for pillar filled structures |
| US9274237B2 (en) | 2013-07-26 | 2016-03-01 | Lawrence Livermore National Security, Llc | Lithium-containing scintillators for thermal neutron, fast neutron, and gamma detection |
| US9309456B2 (en) | 2011-04-15 | 2016-04-12 | Lawrence Livermore National Security, Llc | Plastic scintillator with effective pulse shape discrimination for neutron and gamma detection |
| US9429663B2 (en) | 2009-04-03 | 2016-08-30 | Lawrence Livermore National Security, Llc | Compounds for neutron radiation detectors and systems thereof |
| US9650564B2 (en) | 2012-05-14 | 2017-05-16 | Lawrence Livermore National Security, Llc | System and plastic scintillator for discrimination of thermal neutron, fast neutron, and gamma radiation |
| WO2017212307A1 (en) | 2016-06-06 | 2017-12-14 | Hajdu Imre | Diagnostic medical device |
| US10101268B2 (en) * | 2014-12-23 | 2018-10-16 | Max-Planck-Gesellschaft Zur Foerderung Der Wissenschaften E.V. | Method and apparatus for measuring a spectral sample response |
| JP2021501883A (en) * | 2017-11-01 | 2021-01-21 | ザ リージェンツ オブ ザ ユニバーシティ オブ カリフォルニア | Imaging methods and systems for intraoperative evaluation of excised edges |
| US11857373B2 (en) | 2016-10-04 | 2024-01-02 | The Regents Of The University Of California | Multi-frequency harmonic acoustography for target identification and border detection |
Citations (14)
| Publication number | Priority date | Publication date | Assignee | Title |
|---|---|---|---|---|
| US3941121A (en) * | 1974-12-20 | 1976-03-02 | The University Of Cincinnati | Focusing fiber-optic needle endoscope |
| US3961621A (en) * | 1974-02-06 | 1976-06-08 | Akademiet For De Tekniske Videnskaber, Svejsecentralen | Surgical tool for taking biological samples |
| US4311138A (en) * | 1980-03-10 | 1982-01-19 | Sugarman Edward D | Illuminated hypodermic needle |
| US4410020A (en) * | 1980-04-23 | 1983-10-18 | Contraves Ag | Sensor syringe |
| JPS58222331A (en) * | 1982-06-21 | 1983-12-24 | Sony Corp | Reproducer of character information |
| US4502487A (en) * | 1983-04-29 | 1985-03-05 | Dubrucq Denyse C | Optical thermodetector |
| US4532935A (en) * | 1982-11-01 | 1985-08-06 | Wang Ko P | Bronchoscopic needle assembly |
| US4566438A (en) * | 1984-10-05 | 1986-01-28 | Liese Grover J | Fiber-optic stylet for needle tip localization |
| US4622974A (en) * | 1984-03-07 | 1986-11-18 | University Of Tennessee Research Corporation | Apparatus and method for in-vivo measurements of chemical concentrations |
| US4930516A (en) * | 1985-11-13 | 1990-06-05 | Alfano Robert R | Method for detecting cancerous tissue using visible native luminescence |
| US4957114A (en) * | 1985-04-01 | 1990-09-18 | Kun Zeng | Diagnostic apparatus for intrinsic fluorescence of malignant tumor |
| US5042494A (en) * | 1985-11-13 | 1991-08-27 | Alfano Robert R | Method and apparatus for detecting cancerous tissue using luminescence excitation spectra |
| US5131398A (en) * | 1990-01-22 | 1992-07-21 | Mediscience Technology Corp. | Method and apparatus for distinguishing cancerous tissue from benign tumor tissue, benign tissue or normal tissue using native fluorescence |
| US5280788A (en) * | 1991-02-26 | 1994-01-25 | Massachusetts Institute Of Technology | Devices and methods for optical diagnosis of tissue |
-
1993
- 1993-08-27 US US08/112,291 patent/US5467767A/en not_active Expired - Lifetime
Patent Citations (15)
| Publication number | Priority date | Publication date | Assignee | Title |
|---|---|---|---|---|
| US3961621A (en) * | 1974-02-06 | 1976-06-08 | Akademiet For De Tekniske Videnskaber, Svejsecentralen | Surgical tool for taking biological samples |
| US3941121A (en) * | 1974-12-20 | 1976-03-02 | The University Of Cincinnati | Focusing fiber-optic needle endoscope |
| US4311138A (en) * | 1980-03-10 | 1982-01-19 | Sugarman Edward D | Illuminated hypodermic needle |
| US4410020A (en) * | 1980-04-23 | 1983-10-18 | Contraves Ag | Sensor syringe |
| JPS58222331A (en) * | 1982-06-21 | 1983-12-24 | Sony Corp | Reproducer of character information |
| US4532935A (en) * | 1982-11-01 | 1985-08-06 | Wang Ko P | Bronchoscopic needle assembly |
| US4502487A (en) * | 1983-04-29 | 1985-03-05 | Dubrucq Denyse C | Optical thermodetector |
| US4622974A (en) * | 1984-03-07 | 1986-11-18 | University Of Tennessee Research Corporation | Apparatus and method for in-vivo measurements of chemical concentrations |
| US4566438A (en) * | 1984-10-05 | 1986-01-28 | Liese Grover J | Fiber-optic stylet for needle tip localization |
| US4957114A (en) * | 1985-04-01 | 1990-09-18 | Kun Zeng | Diagnostic apparatus for intrinsic fluorescence of malignant tumor |
| US4930516A (en) * | 1985-11-13 | 1990-06-05 | Alfano Robert R | Method for detecting cancerous tissue using visible native luminescence |
| US5042494A (en) * | 1985-11-13 | 1991-08-27 | Alfano Robert R | Method and apparatus for detecting cancerous tissue using luminescence excitation spectra |
| US4930516B1 (en) * | 1985-11-13 | 1998-08-04 | Laser Diagnostic Instr Inc | Method for detecting cancerous tissue using visible native luminescence |
| US5131398A (en) * | 1990-01-22 | 1992-07-21 | Mediscience Technology Corp. | Method and apparatus for distinguishing cancerous tissue from benign tumor tissue, benign tissue or normal tissue using native fluorescence |
| US5280788A (en) * | 1991-02-26 | 1994-01-25 | Massachusetts Institute Of Technology | Devices and methods for optical diagnosis of tissue |
Non-Patent Citations (4)
| Title |
|---|
| D. B. Tata et al., "Fluorescence Polarization Spectroscopy and Time-Resolved Fluorescence Kinetics of Native Cancerous and Normal Rat Kidney Tissue", Biophys. J., vol. 50, pp. 463-469, Sep. 1986. |
| D. B. Tata et al., Fluorescence Polarization Spectroscopy and Time Resolved Fluorescence Kinetics of Native Cancerous and Normal Rat Kidney Tissue , Biophys. J., vol. 50, pp. 463 469, Sep. 1986. * |
| Edholm et al., "Tissue Identification During Needle Puncture By Reflection Spectrophotometry", Med. & Biol. Engng., vol. 6, pp. 409-413, 1968. |
| Edholm et al., Tissue Identification During Needle Puncture By Reflection Spectrophotometry , Med. & Biol. Engng., vol. 6, pp. 409 413, 1968. * |
Cited By (107)
| Publication number | Priority date | Publication date | Assignee | Title |
|---|---|---|---|---|
| US6304771B1 (en) * | 1993-10-29 | 2001-10-16 | The Trustees Of The University Of Pennsylvania | Systems and methods for imaging fluorophores |
| US5919140A (en) * | 1995-02-21 | 1999-07-06 | Massachusetts Institute Of Technology | Optical imaging using time gated scattered light |
| US6070583A (en) * | 1995-02-21 | 2000-06-06 | Massachusetts Institute Of Technology | Optical imaging of tissue using inelastically scattered light |
| US6321111B1 (en) * | 1995-02-21 | 2001-11-20 | Massachusetts Institute Of Technology | Optical imaging using time gated scattered light |
| US6095982A (en) * | 1995-03-14 | 2000-08-01 | Board Of Regents, The University Of Texas System | Spectroscopic method and apparatus for optically detecting abnormal mammalian epithelial tissue |
| US5991653A (en) * | 1995-03-14 | 1999-11-23 | Board Of Regents, The University Of Texas System | Near-infrared raman spectroscopy for in vitro and in vivo detection of cervical precancers |
| US6144791A (en) * | 1995-11-20 | 2000-11-07 | Cirrex Corp. | Beam steering for optical fibers and other related devices |
| US6222970B1 (en) | 1995-11-20 | 2001-04-24 | Cirrex Corp. | Methods and apparatus for filtering an optical fiber |
| US6370406B1 (en) | 1995-11-20 | 2002-04-09 | Cirrex Corp. | Method and apparatus for analyzing a test material by inducing and detecting light-matter interactions |
| US6070096A (en) * | 1996-03-06 | 2000-05-30 | Fuji Photo Film Co., Ltd. | Fluorescence detecting apparatus |
| US6571119B2 (en) | 1996-03-06 | 2003-05-27 | Fuji Photo Film Co., Ltd. | Fluorescence detecting apparatus |
| US6258576B1 (en) | 1996-06-19 | 2001-07-10 | Board Of Regents, The University Of Texas System | Diagnostic method and apparatus for cervical squamous intraepithelial lesions in vitro and in vivo using fluorescence spectroscopy |
| US5842995A (en) * | 1996-06-28 | 1998-12-01 | Board Of Regents, The Univerisity Of Texas System | Spectroscopic probe for in vivo measurement of raman signals |
| US8126531B2 (en) | 1996-11-21 | 2012-02-28 | Boston Scientific Scimed, Inc. | Miniature spectrometer |
| US6343227B1 (en) | 1996-11-21 | 2002-01-29 | Boston Scientific Corporation | Miniature spectrometer |
| US8660637B2 (en) | 1996-11-21 | 2014-02-25 | Boston Scientific Scimed, Inc. | Miniature spectrometer |
| US6119031A (en) * | 1996-11-21 | 2000-09-12 | Boston Scientific Corporation | Miniature spectrometer |
| US20010003800A1 (en) * | 1996-11-21 | 2001-06-14 | Steven J. Frank | Interventional photonic energy emitter system |
| US6021344A (en) * | 1996-12-04 | 2000-02-01 | Derma Technologies, Inc. | Fluorescence scope system for dermatologic diagnosis |
| US6826422B1 (en) | 1997-01-13 | 2004-11-30 | Medispectra, Inc. | Spectral volume microprobe arrays |
| US6013024A (en) * | 1997-01-20 | 2000-01-11 | Suzuki Motor Corporation | Hybrid operation system |
| US6026319A (en) * | 1997-02-13 | 2000-02-15 | Fuji Photo Film Co., Ltd. | Fluorescence detecting system |
| US6201989B1 (en) | 1997-03-13 | 2001-03-13 | Biomax Technologies Inc. | Methods and apparatus for detecting the rejection of transplanted tissue |
| US6208783B1 (en) | 1997-03-13 | 2001-03-27 | Cirrex Corp. | Optical filtering device |
| US6243484B1 (en) | 1997-03-21 | 2001-06-05 | Dobi Medical Systems, Llc | Dynamic-functional imaging of biological objects using a non-rigid object holder |
| US6587578B2 (en) | 1997-03-21 | 2003-07-01 | Dobi Medical Systems, Inc. | Dynamic-functional imaging of biological objects using a non-rigid object holder |
| US6069689A (en) * | 1997-04-16 | 2000-05-30 | Derma Technologies, Inc. | Apparatus and methods relating to optical systems for diagnosis of skin diseases |
| US6008889A (en) * | 1997-04-16 | 1999-12-28 | Zeng; Haishan | Spectrometer system for diagnosis of skin disease |
| US6317624B1 (en) | 1997-05-05 | 2001-11-13 | The General Hospital Corporation | Apparatus and method for demarcating tumors |
| US6405073B1 (en) | 1997-07-22 | 2002-06-11 | Scimed Life Systems, Inc. | Miniature spectrometer system and method |
| US6072765A (en) * | 1997-07-28 | 2000-06-06 | University Of Central Florida | Optical disk readout method using optical coherence tomography and spectral interferometry |
| US5921926A (en) * | 1997-07-28 | 1999-07-13 | University Of Central Florida | Three dimensional optical imaging colposcopy |
| US6141577A (en) * | 1997-07-28 | 2000-10-31 | University Of Central Florida | Three dimensional optical imaging colposcopy |
| US6324418B1 (en) | 1997-09-29 | 2001-11-27 | Boston Scientific Corporation | Portable tissue spectroscopy apparatus and method |
| US6364831B1 (en) | 1997-09-29 | 2002-04-02 | Boston Scientific Corporation | Endofluorescence imaging module for an endoscope |
| US6882875B1 (en) | 1997-09-29 | 2005-04-19 | Boston Scientific Corporation | Visible display for an interventional device |
| US5984861A (en) * | 1997-09-29 | 1999-11-16 | Boston Scientific Corporation | Endofluorescence imaging module for an endoscope |
| US6383209B1 (en) | 1997-09-29 | 2002-05-07 | Boston Scientific Corporation | Sheath for tissue spectroscopy |
| US6096065A (en) * | 1997-09-29 | 2000-08-01 | Boston Scientific Corporation | Sheath for tissue spectroscopy |
| US6185443B1 (en) | 1997-09-29 | 2001-02-06 | Boston Scientific Corporation | Visible display for an interventional device |
| US6055451A (en) | 1997-12-12 | 2000-04-25 | Spectrx, Inc. | Apparatus and method for determining tissue characteristics |
| US6289229B1 (en) | 1998-01-20 | 2001-09-11 | Scimed Life Systems, Inc. | Readable probe array for in vivo use |
| US8140148B2 (en) | 1998-01-20 | 2012-03-20 | Boston Scientific Scimed Ltd. | Readable probe array for in vivo use |
| US7302289B2 (en) | 1998-01-20 | 2007-11-27 | Scimed Life Systems, Inc. | Readable probe array for in-vivo use |
| US6066102A (en) * | 1998-03-09 | 2000-05-23 | Spectrascience, Inc. | Optical biopsy forceps system and method of diagnosing tissue |
| US6174291B1 (en) | 1998-03-09 | 2001-01-16 | Spectrascience, Inc. | Optical biopsy system and methods for tissue diagnosis |
| WO1999060377A1 (en) | 1998-05-19 | 1999-11-25 | Spectrx, Inc. | Apparatus and method for determining tissue characteristics |
| US6444970B1 (en) | 1998-06-26 | 2002-09-03 | Scimed Life Systems, Inc. | Miniature low-noise photodiode system |
| US6377842B1 (en) | 1998-09-22 | 2002-04-23 | Aurora Optics, Inc. | Method for quantitative measurement of fluorescent and phosphorescent drugs within tissue utilizing a fiber optic probe |
| US6424858B1 (en) * | 1998-11-12 | 2002-07-23 | John L. Williams | Apparatus and method for viewing vasculature of a human being |
| US6411838B1 (en) * | 1998-12-23 | 2002-06-25 | Medispectra, Inc. | Systems and methods for optical examination of samples |
| US6760613B2 (en) | 1998-12-23 | 2004-07-06 | Medispectra, Inc. | Substantially monostatic, substantially confocal optical systems for examination of samples |
| US20110213252A1 (en) * | 1999-01-26 | 2011-09-01 | Fulghum Stephen F | Autofluorescence imaging system for endoscopy |
| US8764643B2 (en) * | 1999-01-26 | 2014-07-01 | Hoya Corporation | Autofluorescence imaging system for endoscopy |
| US6665556B1 (en) * | 1999-01-29 | 2003-12-16 | Robert R. Alfano | Method and apparatus for examining a tissue using the spectral wing emission therefrom induced by visible to infrared photoexcitation |
| US6580935B1 (en) | 1999-03-12 | 2003-06-17 | Cirrex Corp. | Method and system for stabilizing reflected light |
| US6697666B1 (en) | 1999-06-22 | 2004-02-24 | Board Of Regents, The University Of Texas System | Apparatus for the characterization of tissue of epithelial lined viscus |
| US6545260B1 (en) * | 1999-11-19 | 2003-04-08 | Olympus Optical Co., Ltd. | Light scanning optical device which acquires a high resolution two-dimensional image without employing a charge-coupled device |
| US6631289B2 (en) * | 2000-01-20 | 2003-10-07 | Research Foundation Of Cuny | System and method of fluorescence spectroscopic imaging for characterization and monitoring of tissue damage |
| US6763262B2 (en) * | 2000-05-19 | 2004-07-13 | Tuilaser Ag | Method and apparatus for detecting tumorous tissue |
| US20020107668A1 (en) * | 2000-12-15 | 2002-08-08 | Costa Peter J. | System for normalizing spectra |
| US20030130562A1 (en) * | 2002-01-09 | 2003-07-10 | Scimed Life Systems, Inc. | Imaging device and related methods |
| US8423110B2 (en) | 2002-01-09 | 2013-04-16 | Boston Scientific Scimed, Inc. | Imaging device and related methods |
| US8328877B2 (en) | 2002-03-19 | 2012-12-11 | Boston Scientific Scimed, Inc. | Stent retention element and related methods |
| US7778693B2 (en) * | 2002-04-06 | 2010-08-17 | The United States Of America As Represented By The Department Of Health And Human Services | System and method for quantifying the dynamic response of a target system |
| US20040039268A1 (en) * | 2002-04-06 | 2004-02-26 | Barbour Randall L. | System and method for quantifying the dynamic response of a target system |
| US20090292211A1 (en) * | 2002-07-05 | 2009-11-26 | Vanderbilt University | Methods and Apparatus for Optical Spectroscopic Detection of Cell and Tissue Death |
| US7979107B2 (en) | 2002-07-05 | 2011-07-12 | Vanderbilt University | System and method for differentiation of normal and malignant in vivo liver tissues |
| US7149567B2 (en) | 2002-07-05 | 2006-12-12 | The Regents Of The University Of California | Near-infrared spectroscopic tissue imaging for medical applications |
| US7257437B2 (en) | 2002-07-05 | 2007-08-14 | The Regents Of The University Of California | Autofluorescence detection and imaging of bladder cancer realized through a cystoscope |
| US20040077951A1 (en) * | 2002-07-05 | 2004-04-22 | Wei-Chiang Lin | Apparatus and methods of detection of radiation injury using optical spectroscopy |
| US20080267472A1 (en) * | 2002-07-05 | 2008-10-30 | Demos Stavros G | Simultaneous acquisition of differing image types |
| US7016717B2 (en) | 2002-07-05 | 2006-03-21 | The Regents Of The University Of California | Near-infrared spectroscopic tissue imaging for medical applications |
| US8285015B2 (en) | 2002-07-05 | 2012-10-09 | Lawrence Livermore Natioonal Security, LLC | Simultaneous acquisition of differing image types |
| US20040006276A1 (en) * | 2002-07-05 | 2004-01-08 | The Regents Of The University Of California | Autofluorescence detection and imaging of bladder cancer realized through a cystoscope |
| US10182708B2 (en) | 2002-07-05 | 2019-01-22 | Lawrence Livermore National Security, Llc | Simultaneous acquisition of differing image types |
| US20040006275A1 (en) * | 2002-07-05 | 2004-01-08 | The Regents Of The University Of California | Near-infrared spectroscopic tissue imaging for medical applications |
| US6818903B2 (en) | 2002-07-09 | 2004-11-16 | Medispectra, Inc. | Method and apparatus for identifying spectral artifacts |
| US8005527B2 (en) | 2002-07-10 | 2011-08-23 | Luma Imaging Corporation | Method of determining a condition of a tissue |
| US6768918B2 (en) | 2002-07-10 | 2004-07-27 | Medispectra, Inc. | Fluorescent fiberoptic probe for tissue health discrimination and method of use thereof |
| US20040064053A1 (en) * | 2002-09-30 | 2004-04-01 | Chang Sung K. | Diagnostic fluorescence and reflectance |
| WO2004041060A3 (en) * | 2002-11-07 | 2006-02-02 | Yeda Res & Dev | System and method for cancer detection |
| US20040092807A1 (en) * | 2002-11-07 | 2004-05-13 | Amos Breskin | System and method for cancer detection |
| WO2004041060A2 (en) * | 2002-11-07 | 2004-05-21 | Yeda Research And Development Co. Ltd. | System and method for cancer detection |
| US20050190982A1 (en) * | 2003-11-28 | 2005-09-01 | Matsushita Electric Industrial Co., Ltd. | Image reducing device and image reducing method |
| US20090030279A1 (en) * | 2007-07-27 | 2009-01-29 | Zander Dennis R | Method and system for managing power consumption in a compact diagnostic capsule |
| US20100305436A1 (en) * | 2007-09-14 | 2010-12-02 | Light Sciences Oncology , Inc. | Systems, devices, and methods for photoactive assisted resection |
| US9429663B2 (en) | 2009-04-03 | 2016-08-30 | Lawrence Livermore National Security, Llc | Compounds for neutron radiation detectors and systems thereof |
| US8872125B2 (en) | 2009-04-03 | 2014-10-28 | Lawrence Livermore National Security, Llc | Solution-grown crystals for neutron radiation detectors, and methods of solution growth |
| US20130197371A1 (en) * | 2010-10-07 | 2013-08-01 | Kyushu University, National University Corporation | Diagnostic system |
| US9468381B2 (en) * | 2010-10-07 | 2016-10-18 | Kyushu University, National University Corporation | Diagnostic system |
| US9309456B2 (en) | 2011-04-15 | 2016-04-12 | Lawrence Livermore National Security, Llc | Plastic scintillator with effective pulse shape discrimination for neutron and gamma detection |
| US10266761B2 (en) | 2011-04-15 | 2019-04-23 | Lawrence Livermore National Security, Llc | Plastic scintillator with effective pulse shape discrimination for neutron and gamma detection |
| EP2699904A1 (en) * | 2011-04-20 | 2014-02-26 | IM Co., Ltd. | Prostate cancer diagnosis device using fractal dimension value |
| EP2699904A4 (en) * | 2011-04-20 | 2014-10-01 | Im Co Ltd | Prostate cancer diagnosis device using fractal dimension value |
| JP2013000387A (en) * | 2011-06-17 | 2013-01-07 | Konica Minolta Advanced Layers Inc | Endoscope |
| US20140293651A1 (en) * | 2011-12-13 | 2014-10-02 | Olympus Corporation | Light source system having light guide routes |
| US9121947B2 (en) | 2012-01-23 | 2015-09-01 | Lawrence Livermore National Security, Llc | Stress reduction for pillar filled structures |
| US8580054B2 (en) | 2012-04-04 | 2013-11-12 | Lawrence Livermore National Security, Llc | Melt-castable energetic compounds comprising oxadiazoles and methods of production thereof |
| US9650564B2 (en) | 2012-05-14 | 2017-05-16 | Lawrence Livermore National Security, Llc | System and plastic scintillator for discrimination of thermal neutron, fast neutron, and gamma radiation |
| US9274237B2 (en) | 2013-07-26 | 2016-03-01 | Lawrence Livermore National Security, Llc | Lithium-containing scintillators for thermal neutron, fast neutron, and gamma detection |
| US10052086B2 (en) | 2014-02-03 | 2018-08-21 | The University Of Western Australia | Medical device for insertion into a material to obtain a material sample and a method thereof |
| WO2015113113A1 (en) * | 2014-02-03 | 2015-08-06 | The University Of Western Australia | A medical device for insertion into a material to obtain a material sample and a method thereof |
| US10101268B2 (en) * | 2014-12-23 | 2018-10-16 | Max-Planck-Gesellschaft Zur Foerderung Der Wissenschaften E.V. | Method and apparatus for measuring a spectral sample response |
| WO2017212307A1 (en) | 2016-06-06 | 2017-12-14 | Hajdu Imre | Diagnostic medical device |
| US11857373B2 (en) | 2016-10-04 | 2024-01-02 | The Regents Of The University Of California | Multi-frequency harmonic acoustography for target identification and border detection |
| JP2021501883A (en) * | 2017-11-01 | 2021-01-21 | ザ リージェンツ オブ ザ ユニバーシティ オブ カリフォルニア | Imaging methods and systems for intraoperative evaluation of excised edges |
Similar Documents
| Publication | Publication Date | Title |
|---|---|---|
| US5467767A (en) | Method for determining if tissue is malignant as opposed to non-malignant using time-resolved fluorescence spectroscopy | |
| US5348018A (en) | Method for determining if tissue is malignant as opposed to non-malignant using time-resolved fluorescence spectroscopy | |
| US5042494A (en) | Method and apparatus for detecting cancerous tissue using luminescence excitation spectra | |
| US5303026A (en) | Apparatus and method for spectroscopic analysis of scattering media | |
| US8417324B2 (en) | Fluorescence lifetime spectrometer (FLS) and methods of detecting diseased tissue | |
| KR100352689B1 (en) | Advanced synchronous luminescence system | |
| KR100415850B1 (en) | Cancer Diagnosis Device Using Laser-Induced Differential Normalized Fluorescence Spectrum | |
| US5293872A (en) | Method for distinguishing between calcified atherosclerotic tissue and fibrous atherosclerotic tissue or normal cardiovascular tissue using Raman spectroscopy | |
| Kapadia et al. | Laser-induced fluorescence spectroscopy of human colonic mucosa: detection of adenomatous transformation | |
| US4930516A (en) | Method for detecting cancerous tissue using visible native luminescence | |
| US5813987A (en) | Spectral volume microprobe for analysis of materials | |
| Zângaro et al. | Rapid multiexcitation fluorescence spectroscopy system for in vivo tissue diagnosis | |
| JP3773921B2 (en) | Method for measuring tissue properties by fluorescence | |
| US6839586B2 (en) | Use of multiphoton excitation through optical fibers for fluorescence spectroscopy in conjunction with optical biopsy needles and endoscopes | |
| US5713364A (en) | Spectral volume microprobe analysis of materials | |
| US6665556B1 (en) | Method and apparatus for examining a tissue using the spectral wing emission therefrom induced by visible to infrared photoexcitation | |
| US7103402B2 (en) | Advanced synchronous luminescence imaging for chemical and medical diagnostics | |
| Andersson-Engels et al. | Time-resolved laser-induced fluorescence spectroscopy for enhanced demarcation of human atherosclerotic plaques | |
| Nishioka | Laser-induced fluorescence spectroscopy | |
| DE102005036147A1 (en) | Measuring head arrangement, for combined reception of remission and fluorescent spectrums and images used in dermatology, has perforated mirror connected to spectroscopic fibers arranged in selected locally fixed position on skin fabric | |
| KR20090104224A (en) | Multi-modality early cancer detection apparatus merged multi-wavelength fluorescence spectroscopy and optical coherence imaging and method using thereof | |
| Katz et al. | Optical biopsy-detecting cancer with light | |
| Popenda et al. | Fluorescence lifetime measurements with all-fiber optical setup for non-invasive in-vivo diagnostics | |
| KR100443812B1 (en) | Apparatus of fluorescence endoscope and spectrum analysis | |
| Cubeddu et al. | TIME-GATED FLUORESCENCE IMAGING OF BIOLOGICAL SAMPLES |
Legal Events
| Date | Code | Title | Description |
|---|---|---|---|
| STCF | Information on status: patent grant |
Free format text: PATENTED CASE |
|
| REMI | Maintenance fee reminder mailed | ||
| FPAY | Fee payment |
Year of fee payment: 4 |
|
| SULP | Surcharge for late payment | ||
| FPAY | Fee payment |
Year of fee payment: 8 |
|
| FPAY | Fee payment |
Year of fee payment: 12 |