US5178151A - System for non-invasive detection of changes of cardiac volumes and aortic pulses - Google Patents
System for non-invasive detection of changes of cardiac volumes and aortic pulses Download PDFInfo
- Publication number
- US5178151A US5178151A US07/759,862 US75986291A US5178151A US 5178151 A US5178151 A US 5178151A US 75986291 A US75986291 A US 75986291A US 5178151 A US5178151 A US 5178151A
- Authority
- US
- United States
- Prior art keywords
- signal
- segmental
- transducer
- cardiac
- waveform
- Prior art date
- Legal status (The legal status is an assumption and is not a legal conclusion. Google has not performed a legal analysis and makes no representation as to the accuracy of the status listed.)
- Expired - Lifetime
Links
Images


Classifications
-
- A—HUMAN NECESSITIES
- A61—MEDICAL OR VETERINARY SCIENCE; HYGIENE
- A61B—DIAGNOSIS; SURGERY; IDENTIFICATION
- A61B5/00—Measuring for diagnostic purposes; Identification of persons
- A61B5/103—Detecting, measuring or recording devices for testing the shape, pattern, colour, size or movement of the body or parts thereof, for diagnostic purposes
- A61B5/11—Measuring movement of the entire body or parts thereof, e.g. head or hand tremor, mobility of a limb
- A61B5/113—Measuring movement of the entire body or parts thereof, e.g. head or hand tremor, mobility of a limb occurring during breathing
- A61B5/1135—Measuring movement of the entire body or parts thereof, e.g. head or hand tremor, mobility of a limb occurring during breathing by monitoring thoracic expansion
-
- A—HUMAN NECESSITIES
- A61—MEDICAL OR VETERINARY SCIENCE; HYGIENE
- A61B—DIAGNOSIS; SURGERY; IDENTIFICATION
- A61B5/00—Measuring for diagnostic purposes; Identification of persons
- A61B5/72—Signal processing specially adapted for physiological signals or for diagnostic purposes
- A61B5/7235—Details of waveform analysis
- A61B5/7239—Details of waveform analysis using differentiation including higher order derivatives
Definitions
- This invention pertains to non-invasive monitors, and more particularly to non-invasive monitoring of cardiac function.
- EKG electrocardiogram
- the electrocardiogram has been the primary non-invasive device for continuously monitoring activity of the heart in clinical medicine, it reflects solely electrical activation of cardiac muscle and provides no information on the mechanical characteristics of the cardiac pump. Consequently, the EKG may show normal or near normal waveforms in the presence of greatly impaired blood pumping capacity of the heart. Conversely, the EKG waveform may be abnormal despite normal or near normal pumping action. In terms of life support, adequate circulation of blood from the heart to the tissues, as reflected by the blood pumping capacity of the heart, is of paramount importance.
- Invasive techniques generally have as their basis a catheter, such as a Swan-Ganz catheter, placed such that its tip lays within the pulmonary artery. This provides continuous recording of pressures in the pulmonary artery, and in certain instances pressures in the right ventricle, right atrium and indirectly the left atrium (pulmonary capillary wedge pressure). Injection of inert dye or cold saline from the catheter allows discrete measurements of cardiac output by dye dilution method or thermodilution, respectively. Alternatively, sampling blood for oxygen content in the pulmonary artery and a systemic artery together with measurement of oxygen consumption permits calculation of cardiac output by the Fick principle.
- insertion of a cardiac catheter into the body may be hazardous. Its use can lead to death, which occurs in 1% of cases, and morbidity, which occurs in 33% of cases, as a result of infection and/or damage to the heart valves, cardiac arrhythmias, and pulmonary thromboembolism. Errors of technique, measurement, judgment and interpretation are common. It has been estimated that one-half million Swan-Ganz catheters used in the United States in 1986 resulted in the death of as many as 1000 or more patients. Furthermore, cardiac catheters cannot be kept in place for more than a few days owing to hazards from infection. They are also costly and laborintensive since catheterized patients require intensive care units which cost two to five times more than standard semi-private beds. In addition, health care workers face the risk of AIDS acquired virus and hepatitis virus as a result of exposure to blood of the infected patient during catheter introduction and subsequent maintenance.
- cardiac catheters do not directly provide measurement of change in ventricular volume. While such measurements can be indirectly obtained in conjunction with injection of radiopaque dye and roentgenographic imaging, this technique is time-consuming and costly, and dangerous hypotension and bradycardia may be induced by the dye. Furthermore, the number of studies in a given patient is limited by the hazards of x-ray exposure and radiopaque dye injections.
- Angiographic techniques provide the most widely accepted means for measuring ventricular volumes. They allow calculation of the extent and velocity of wall shortening and of regional abnormalities of wall motion. When they are combined with measurement of pressure, both ventricular compliance and afterload (i.e., the forces acting within the wall that oppose shortening) can be determined. When the results are expressed in units corrected for muscle length or circumferences of the ventricle, comparisons can be made between individuals with widely differing heart sizes.
- Cineangiography provides a large number of sequential observations per unit of time, typically 30 to 60 frames per second.
- contrast material can be injected into the pulmonary artery and left atrium, the left ventricle is outlined more clearly when dye is directly injected into the ventricular cavity. Therefore, the latter approach is used in most patients, except in those with severe aortic regurgitation in whom the contrast material may be injected into the aorta, with the resultant reflux of contrast material outlining the left ventricular cavity.
- non-invasive methods of assessing cardiac performance. Such methods are needed particularly in detecting serial changes in cardiac function and in evaluating both acute and chronic effects of interventions such as drug therapy and cardiac operations.
- the five principal non-invasive methods for assessing cardiac performance are: systolic time intervals, M-mode and two-dimensional echocardiography, radionuclide angiography, gated computerized tomography (CT scanning), and gated magnetic resonance imaging (MRI). All but the first of these are alternatives to angiography for measurement of ventricular volumes and/or dimensions and therefore permit the non-invasive estimation of ejection phase indices.
- wall stress can be estimated from a combination of systemic arterial pressure, ventricular radius, and wall thickness. All four non-invasive imaging methods allow estimation of ventricular systolic and diastolic volumes; none, however, is satisfactory for continuous or near-continuous monitoring of critically ill patients.
- Systolic time intervals have been usually obtained with the combination of an external transducer on the carotid artery in the neck to display its pulsations, a microphone over the heart to record heart sounds, and the electrocardiogram.
- This technique has never enjoyed wide popularity because of both technical and physiologic reasons: (1) reliable, reproducible recordings are difficult to obtain, (2) prominent internal jugular venous pulsations in the horizontal body posture may be superimposed on the carotid artery pulsations rendering interpretation of the carotid arterial waveform difficult, (3) accurate recording of heart sounds may be difficult to obtain particularly in patients with obesity or emphysema, (4) systolic time intervals are sensitive to many pharmacologic and hemodynamic influences including changes in left ventricular preload and afterload which may introduce misleading values, (5) changes in duration of systolic time intervals can be influenced by patient posture and time of day when recordings are made, (6) carotid pulse contours to calculate systolic time intervals can be difficult
- Echocardiography involves ultrasonic imaging of ventricular wall motion to monitor cardiac function. With this technique, the dynamics of ventricular wall contraction and the internal dimensions of the cardiac chambers can be recorded.
- the apparatuses used for echocardiography encompass a wide variety of increasingly sophisticated and computer-aided imaging and analysis systems.
- the transducer placements on the chest require the services of skilled technicians and incorrect placements lead to misleading information.
- these systems are quite expensive, not readily portable, require that the patient be studied in the left lateral decubitus posture, and are not intended for continuous monitoring of critically ill patients throughout the day or during exercise.
- echocardiography has several inherent limitations. For example, all ultrasonic beams have a defined breadth and height comparable to the size of the crystal transducer face. Beyond its focal point, the beam's cross-sectional area enlarges in direct proportion to the distance from the transducer face. Therefore, in M-mode (single transducer) echocardiography, two laterally separated structures may appear in direct anteroposterior relationship.
- Two-dimensional electrocardiographic techniques also produce distortions, which increase with increasing distance between the target and the central beam axis.
- axial resolution 1-2 mm
- lateral resolution 4-5 mm
- artifacts may appear as intracardiac masses to the casual observer.
- delineation of the endocardium of the left ventricle in its entirety is achieved only 70 to 80% of the time.
- respiratory interference limits the ability to obtain continuous beat to beat recordings, particularly during exercise.
- the ventricle being examined does in fact approximate the geometry of an ellipsoid, both in diastole and systole; (2) the septal-posterolateral dimension measured coincides with the minor axis of the ellipsoid; (3) the orthogonal minor axis is equal to the measured minor axis; and (4) the major axis is twice the length of the minor axes. While good correlations between angiographic and echo left ventricular volumes have been obtained, correlations are poor in patients who have asynergetic ventricular wall motion, which occurs in patients with coronary artery disease in whom damaged areas of the left ventricular wall do not move in phase with the normal areas. Also, because ventricular volume curves as a function of time cannot be derived without utilization of several assumptions and approximations, they are not usually reported.
- Two-dimensional echocardiography offers considerable advantage for estimation of left ventricular volume because it allows direct measurement of all three hemiaxes on the ellipsoid model and also allows application of other volume formulations, such as Simpson's rule. Studies have shown that correlations between echocardiographic and angiographic volumes are substantially improved when two-dimensional methods are used, and good correlations have been obtained even in the presence of ventricular asynergy. The greatest disadvantage to quantitative two-dimensional echocardiography is the inability to obtain technically satisfactory images in all patients and the labor involved in analyzing the studies. This technique, as with the M-mode, does not readily provide dynamic changes of ventricular volume over time.
- Echocardiography has also been employed to estimate the velocity of ventricular circumferential fiber shortening (Vcf).
- Vcf ventricular circumferential fiber shortening
- This echo measurement is analogous to the derivative of change in ventricular volume during systole and serves as a measure of ventricular contractility. Its application in M-mode echocardiography assumes that the left ventricular internal dimension is measured at the midventricular level.
- the mean rate of shortening is determined by dividing the calculated circumference expression by the left ventricular ejection time (ET), which may be measured from the concomitant carotid pulse tracing or from the time duration of echocardiographic aortic valve opening.
- Peak Vcf can be similarly derived by extrapolation from the maximum systolic slope of posterior and septal walls. Vcf is inaccurate in patients with asynergetic movement of the left ventricle as in patients with ischemic heart disease.
- Mean velocity of circumferential fiber shortening can be determined simply from measurements of end-diastolic and end-systolic dimensions by echocardiography, CT scanning, or MRI. Since the ventricle is approximately circular at its minor axis the circumference is equal to diameter (D). Mean V cf (in circumference/sec) is therefore the difference between end-diastolic and end-systolic circumference (in cm) divided by the product of the duration of ejection (in sec) and the end-diastolic circumference. Values of V cf obtained by echocardiography compare closely with those determined from cineangiograms.
- Echocardiography has also been employed to estimate stroke volume (SV), which is the difference between end-diastolic volume and end-systolic volume.
- SV stroke volume
- This technique suffers from the inherent lack of accuracy in volume estimations and, clinically, stroke volume varies widely with different physiologic circumstances such as body size, heart rate, posture and exercise. It is, therefore, not as useful a measurement as contractility. Nevertheless, provided that subjects with left ventricular asynergy are excluded from analysis, fair correlations have been reported between stroke volume derived from M-mode echocardiographic and two dimensional echo techniques on the one hand, and both thermodilution and angiographic stroke volume measurements on the other.
- apex cardiogram which is obtained by employing a transducer over the maximal cardiac impulse on the anterior surface of the left hemithorax in combination with the electrocardiogram.
- This technique is of limited usefulness for several reasons.
- the recording of the apex cardiogram is strongly affected by the characteristics of the recording transducer and coupling of the transducer to the skin surface.
- the apex cardiogram cannot be obtained.
- interpretation of the apex cardiogram waveform for heodynamic measurements is even more problematic than systolic time intervals.
- Another non-invasive device for monitoring cardiac function in the kinetocardiograph This device records localized chest wall movements with a transducer consisting of a small metal arm attached to a flat end piece which directly contacts the chest wall. Motion of the metal arm is transmitted to a bellows, connected to a piezoelectric or strain gauge transducer.
- the bellows and pickup are mounted from a crossbar over the bed, and the end piece can be placed perpendicular to any location on the chest.
- the amplified signal denoted the kinetocardiogram (KCG)
- KCG kinetocardiogram
- the KCG measures low frequency inward and outward chest movements, which range from 5 microns in the left axilla to 200 microns directly over the precordium.
- Kinetocardiography differs from apex cardiography in which outward movements are accentuated by an air displacement funnel transducer placed over the apex of the heart (a position where pulsations can be felt by the examiner).
- the KCG senses true displacements of the precordium because of its external crossbar frame of reference, whereas the apex cardiogram senses relative rib cage interspace motion.
- the KCG is sufficiently sensitive so that records can be obtained from many points over the precordium and not just at the apex as with the apex cardiograph.
- KCG recordings in humans were initially described in locations where the precordial electrocardiographic electrode leads were conventionally positioned. In these locations, the KCG generally depicts inward motion of the chest wall following the QRS wave of the electrocardiogram followed by a large number of low frequency vibrations superimposed upon an upward, outward motion.
- the investigators who initially described the KCG attributed the chest movements to a combination of the following factors: (1) movements due to the cardiac impact against the chest wall, (2) changes in the intrathoracic blood volume as the result of ejection or filling of the heart, (3) impact of blood in the great vessels against the chest wall and (4) positional and shape changes of the contracting and relaxing heart.
- Tracings of KCG over the anterior and posterior rib cage reveal: (1) a carotojugular type of pulse tracing in the infraclavicular area (attributed by the investigators to a mixed arterial venous pulse transmitted from the subclavian or axillary blood vessels), (2) with the subject prone, a waveform configuration similar posteriorly to the V 4 electrocardiographic electrode placement position, and (3) with upright posture, a smaller amplitude, noisy opposite deflection signal at a posterior position corresponding to the anterior KCG signal. The investigators attributed these findings to a combination of the factors listed above.
- the KCG depicts precordial outward systolic bulges in approximately 66% of patients with known myocardial infarctions. The largest outward motion is found most often at the V 3 electrocardiographic electrode placement position. Outward precordial bulges occur during exercise in about 30% of patients who develop anginal pain.
- the KCG appears to provide useful information on the mechanical properties of heart muscle, it has never received widespread clinical acceptance. This is probably because of: (1) the unwieldy transducer to patient interface; (2) restriction of patient movement and need for breathholding during recording; (3) noisy, often uninterpretable signals; (4) requirement of a great deal of skill to interpret recordings from different locations on the rib cage; and (5) lack of quantitation of the KCG waveforms with respect to changes of ventricular volume events obtained from analysis of the recordings.
- CKG cardiokymograph
- This device available from Cardiokinetics, Seattle, Wash., consists of a circular, flat capacitive plate mounted in a plastic ring strapped to the chest. Tissue motion beneath the transducer distorts an induced electromagnetic field which in turn alters the frequency of the oscillator plate. This change of frequency is converted to a change of voltage proportional to the chest wall motion at the transducer site and then displayed as an analog waveform.
- the CKG provides waveforms during breathholding quite similar in appearance to the kinetocardiogram. It depicts left ventricular wall motion abnormalities just like the KCG and therefore can be used to improve the diagnostic accuracy of exercise testing as an additional marker of myocardial ischemia.
- the cardiokymogram suffers from the same limitations as the kinetocardiogram, namely, (1) an unwieldy transducer to patient interface; (2) restriction of patient movement and need for breathholding during recording; (3) noisy, often uninterpretable signals; (4) requirement of a great deal of skill to interpret recordings from different locations on the rib cage; and (5) lack of quantitation of the CKG waveforms with respect to changes of ventricular volume events obtained from analysis of the recordings.
- Electrokymography and radarkymography are still other techniques for non-invasively monitoring cardiac function.
- the motions of the borders of the cardiovascular shadow obtained with roentgen rays can be visualized directly on a fluoroscope by using a photomultiplier tube to give a phasic analog signal from cyclic variations in light produced by movement of the underlying heart border (electrokymography), or from a video monitor of the fluoroscopic image and similar tracking technology (radarkymography).
- a graphic record of the segmental motion on the left heart border provides recordings which closely resemble the contour curve of changes in left ventricular volume over time.
- Such technology can be utilized to diagnose localized segmental dysfunction of the ventricular wall.
- radarkymography has been used to diagnose ventricular wall abnormalities, including asynergistic and akinetic motion, associated with acute myocardial infarction. Radarkymography compares favorably with left ventricular cineangiography in the diagnosis of asynergistic myocardial contraction.
- radarkymography and electrokymography can be used only where an interface is visualized between the cardiac silhouette and adjacent structures. Poor visualization is encountered in pulmonary fibrosis, pulmonary edema, pleural fibrosis and bony distortions of the rib cage. Dyspneic patients are difficult to study since extraneous motions of the heart caused by respiration introduce artifacts. Finally, both methods subject the patient to exposure to Roentgen rays and this hazard prevents their use in situations requiring long term monitoring.
- a still further non-invasive technique for monitoring cardiac function is impedance cardiography. It has long been recognized that the passage of a high frequency, low electrical current signal between electrodes placed on the heart or directed through the heart across the intact thorax produces changes of electrical impedance which varies directly with the length and inversely with the cross-sectional area of the conductor.
- Cardiogenic flow pulses have been attributed to direct beating of the heart against the pulmonary parenchyma. Although artifactually induced vascular pressure pulses produce flow oscillations in the airways, these oscillations can still be seen in an airway of a lobe to which the lobar branch of the pulmonary artery has been entirely obstructed. Furthermore, injection of 25-50 ml of saline into the canine pericardial sac markedly diminishes all cardiogenic oscillations within intrapulmonary conducting airways despite the presence of normal pulmonary arterial pulsations. These observations suggest that neither pulmonary vascular pulsations nor volume changes of the heart, which should not be affected by a small pericardial effusion, were responsible for cardiogenic flow oscillations.
- the heart has an irregular shape and contracts with a twisting action; this results in a forceful thrust to some parts of the adjoining lung, whereas other parts follow the inward movement of the myocardium. It is these localized transient inflations and deflations which appear to produce intrapulmonary to-and-fro flow oscillations.
- Pericardial fluid tends to make the external surface of the pericardial sac more spherical so that rotation or twisting of the heart no longer produces a thrust against the lung, thereby diminishing cardiogenic oscillations of the air columns.
- the actual redistribution of the flow pulse among intrapulmonary airways originating from the heart depends upon relative impedance of the airways. Its magnitude depends upon the force and acceleration of the cardiac movement. However, apart from the heart movement, intrapulmonary factors must also influence the pattern and extent of transmission of the pressure impulse and the zonal volume changes that it causes. Thus, whether a zone adjacent to the heart deflates or not, giving rise to a flow pulse in the airways subtending it, depends upon its time constant. The smaller its compliance and resistance, the more likely it is to respond to the cardiogenic pressure impulse by emptying. In contrast, if the time constant is high (e.g., due to increased airway resistance), minimal emptying occurs during the time of the pressure cycle, resulting in smaller or absent flow pulses in the airways.
- Luisada in 1942 reviewed the historical background for the designation, "pneumocardiogram", and defined it as the recording of pressure changes which occur in the air passages of the lung as a consequence of the heart beat. He noted that graphic recordings of this phenomenon were published as early as 1861 in animals and in humans in 1876. He utilized a pressure sensing transducer from one nostril while the subject breathed normally and employed electronic filtering to eliminate the slower respiratory waves.
- Wasserman and Comroe believed that the cardiogenic oscillations observed with their method reflected changes in thoracic blood volume. They did not consider the oscillations to be related to changes in ventricular volume. The present inventor accepted the interpretation given by Wasserman and Comroe to the cardiogenic oscillations observed with their technique and used Wasserman and Comroe's results in a review paper on measurement of cardiac output by alveolar gas exchange.
- Bosman and Lee utilized a body plethysmograph-flowmeter method "to study the effects of cardiac contraction upon changes in lung gas volumes during breathholding both with the glottis open and closed.” They reported and depicted curves with multiple rises and falls from the body plethysmograph and pneumotachograph. They interpreted these complex waveforms as showing an excess of aortic outflow over venous inflow to the thorax during systole and a reverse during diastole. Using more sophisticated technology, their work confirmed the findings of Blair and Wedd.
- the present invention which is sometimes referred to herein as the thoracocardiograph or TCG, is based upon the discovery that during breathholding, small oscillations detected by sensors placed on the rib cage (RC) and abdominal (AB) surfaces and ordinarily used to monitor breathing patterns closely resemble ventricular volume curves and aortic pressure pulses depending upon their respective placements on these surfaces.
- These sensors include those which measures changes of rib cage and abdominal dimensions, such as the respiratory inductive plethysmograph which measures changes in cross-sectional area; the inductance circumferential transducer which measures partial cross-sectional area; the mercury in silastic strain gauge, bellows pneumograph, and differential linear transformer which measure circumference and partial circumference; magnetometers which measure diameters; and partitioned pressure, volume and capacitance body plethysmographs which measure volumes.
- the respiratory inductive plethysmograph which measures changes in cross-sectional area
- the inductance circumferential transducer which measures partial cross-sectional area
- the mercury in silastic strain gauge, bellows pneumograph, and differential linear transformer which measure circumference and partial circumference
- magnetometers which measure diameters
- partitioned pressure, volume and capacitance body plethysmographs which measure volumes.
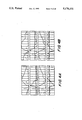
- FIGS. 1A and 1B are diagrammatic representations showing the placement of wide band (left panel) and narrow band (right panel) transducers about the human torso;
- FIG. 2 is a graphic representation showing waveforms derived in accordance with the present invention in the supine (left panel) and standing (right panel) postures;
- FIG. 3 is a graphic representation similar to the left panel in FIG. 2;
- FIGS. 4A and 4B are recordings from a semirecumbent normal subject using ensemble averaging to display an averaged vascular pulse and a ventricular volume curve with their corresponding derivatives;
- FIG. 5 is a graphic representation showing the use of curve fitting techniques to extract cardiogenic waveforms from raw data derived in accordance with the present invention
- FIG. 6 compares waveforms derived using a narrow band sensor and a single bellows pneumograph
- FIG. 7 compares waveforms derived with a narrow band sensor and a surface inductive plethysmograph
- FIG. 8 shows waveforms derived, for different horizontal postures, using a wide band sensor at the lower rib cage and another wide band sensor at the mid-abdominal level;
- FIG. 9 illustrates waveforms derived using wide band sensors at the upper and lower rib cage placements and showing the effect of lung volume on ventricular volume curves
- FIG. 10 shows the effect of the Valsalva maneuver on ventricular volume curves derived in accordance with the present invention
- FIG. 11 depicts waveforms showing the effect of exercise on stroke volumes
- FIG. 12 depicts waveforms showing the effect of exercise on stroke volume with the subject in the supine posture
- FIG. 13 shows the effect of amyl nitrite on ventricular volume curves derived in accordance with the present invention
- FIG. 14 is a recording of a carotid arterials waveform and a left ventricular volume curve in a subject with ischemic heart disease
- FIG. 15 is a waveform derived in accordance with the present invention and showing dyskinetic motion of a ventricle segment resulting from pulmonary hypertension;
- FIG. 16 is a graphic representation of a comparison of stroke volume measurements derived in accordance with the present invention and in accordance with the thermodilution method;
- FIG. 17 depicts waveforms derived using narrow band sensors in accordance with the present invention and showing ventricular volume curves derived from dogs with various band placements and body postures;
- FIG. 18 is a graphic representation comparing stroke volume as determined in accordance with the present invention and as derived using impedance cardiography;
- FIG. 19 is a graphic representation of cardiac output as derived from impedance cardiography upon injection with terbutaline and saline;
- FIG. 20 is a graphic representation for comparison with FIG. 19 and showing cardiac output as derived in accordance with the present invention upon injection of terbutaline and saline;
- FIG. 21 is a series of recordings showing the effect of externally pacing the right ventricle on the ventricular volume curve of a mechanically ventilated, anesthetized dog.
- FIGS. 22A and 22B compare waveforms measured during breathing of room air (left panel) and an hypoxic mixture (right panel).
- cardiogenic oscillations derived from sensors placed on the rib cage and abdomen surfaces for displaying breathing movements differ in waveform configuration depending upon the location enclosed by the vertical height of the sensor.
- the invention will be particularly described with reference to the respiratory inductive plethysmograph and its associated sensors, though as noted above, the present invention may be practiced with other devices used for measuring dimensional changes at the rib cage and abdomen.
- the respiratory inductive plethysmograph is commercially available from Non-Invasive Monitoring Systems, Inc. (NIMS) under the trade names Respigraph and Respitrak and is described in U.S. Pat. No. 4,308,872, the entire content of which is incorporated herein by reference.
- this apparatus comprises two coils of Teflon-insulated wire sewn onto elastic cloth bands encircling the rib cage and abdomen.
- the leads from the wires are connected to LC oscillator modules, or preferably a shared module, such that the inductance of the wires comprises the inductance element of the oscillator.
- Changes in the cross-sectional area of the rib cage and abdominal compartments result in changes in the inductance of the wires and hence changes in the oscillation frequency of the oscillator.
- the resulting signals for the rib cage and abdominal compartments are demodulated and displayed as analog voltage signals. In respiration applications, these signals can be calibrated and summed to reflect absolute tidal volume.
- FIG. 1 shows placements of sensors employed with the respiratory inductive plethysmograph.
- the left-hand panel in FIG. 1 illustrates the placement of commercially available wide band (WB) sensors, 10 cm in height, on the upper and lower rib cage (RC) and mid-abdomen (AB).
- WB wide band
- RC upper and lower rib cage
- AB mid-abdomen
- the respiratory inductive plethysmograph was used with modified sensors.
- sensors as employed in the present invention were only 2.5 cm in height, such that each sensor subtended a narrower portion of the torso than the commercial wide band sensors shown in the left-hand panel in FIG. 1.
- the narrow band (NB) sensors used with the present invention are shown in the right-hand panel in FIG. 1.
- the xiphoid process of the sternum has been taken as the arbitrary point of reference for placement for the NB sensors employed with the present invention, as it is an easily recognized anatomic location which demarcates the caudal limit of the bony thoracic cage in the midline from the cranial limit of the soft tissues of the abdomen. While the invention will be described herein in conjunction with the NB sensors, it will be apparent as this description progresses that sensors of any height may be employed, depending upon the information being sought.
- FIG. 2 shows, for a normal adult, waveforms traced from polygraph recordings of the electrocardiogram (EKG) and the analog voltage signal from a narrow band sensor employed with a respiratory inductive plethysmograph as taken during sequential breathholds.
- the QRS complex of the EKG labeled R in FIG. 2, marks electrical activation of the ventricles of the heart, which precedes ventricular muscular contraction.
- contraction of the ventricle causes ventricular volume to decrease as blood is ejected (systole) from the ventricles into the thoracic aorta and pulmonary artery.
- a single narrow band sensor was moved either above or below the xiphoid process at 2.5 cm intervals before each sequential breathhold.
- the trial was repeated in both the supine and standing positions, left and right-hand panels in FIG. 2, respectively.
- the uppermost cranial border of the rib cage in a normal adult 187 cm in height, whose waveforms are depicted in FIG. 2, was situated+25 cm above the xiphoid process.
- the multiple tracings at the xiphoid process denote repetitive tracings of sequential breathholds from polygraph recordings at this site and demonstrate good reproducibility of the measurement.
- the tracings at the xiphoid process were taken with a narrow band sensor disposed between the "-2.5 cm” and “+2.5 cm” positions, i.e. over the xiphoid process, the xiphoid process tracings being shown between the "+22.5 cm” and "+25 cm” in FIG. 2 simply as a matter of convenience.
- the narrow band sensors were placed such that recordings were ultimately obtained from almost all horizontal cross-sectional regions of the rib cage surface in the supine and standing postures.
- the cardiogenic signals from bands disposed at the level of the xiphoid process show a rapid decrease in volume (systole) following the R wave of the EKG, which reached its nadir shortly before or after termination of the T wave of the EKG, depending upon the precise location of the band.
- the diastolic phase of ventricular muscular relaxation is marked, at the xiphoid process, by a brief initial rapid increase in ventricular volume to a more gradual rise before reaching a peak plateau coincident with the next R wave. This plateau continues slightly past the R wave before the downstroke of systole repeats itself.
- the configurations of the cardiogenic oscillations shown in FIG. 2 are, as shown, extremely dependent upon location of the sensor both in the supine and standing postures.
- the waveforms taken at the xiphoid as depicted in FIG. 2 closely resemble the ventricular volume waveform as measured by sensors of length, diameter or volume surgically installed on the hearts of dogs, or from a cardiometer enclosing the isolated heart.
- the band placed+25 cm above the xiphoid depicts an upgoing deflection following the R wave rather than a downgoing deflection as detected at the xiphoid process. It more closely resembles the waveform of the descending aortic pressure pulse as detected in the prior art using other techniques. From+2.5 to+17.5 cm above the xiphoid, the amplitudes of the signals in the supine posture diminish but still resemble ventricular volume curves. There are less marked variations of amplitude in the standing posture.
- the amplitude of the waveform recorded with a band placed+10 cm above the xiphoid in the standing position is approximately equivalent in amplitude to the waveform at the xiphoid process.
- the timing of the systolic downstroke following the R wave and its slope varies among the recordings taken at different locations above the xiphoid.
- the waveforms of cardiogenic oscillations in the supine posture show an initial upward systolic deflection at the xiphoid location which is more pronounced -2.5 and -5 cm below the xiphoid.
- This upward deflection denotes the period of isovolumetric contraction, a well documented phenomenon.
- the mid-anterior sections of the band lie on the abdominal surface but the lateral and posterior sections overly the rib cage. Therefore, changes in left ventricular volume are primarily recorded at these locations because the cardiac apex of the left ventricular wall is located at the lowermost portion of the rib cage. Further, the slope of systolic ejection appears to be steeper at these locations below the xiphoid than above it. This is consistent with prior art observations that apical segments display a higher velocity of contraction than basilar segments.
- the circumferential and length waveforms from the canine left ventricle as reported in the literature display prominent isovolumetric contraction which is strikingly similar to the human isovolumetric contraction waveform from bands placed from-2.5 to-10 cm below the xiphoid (See FIGS. 1 and 2).
- the upward isovolumetric deflections are less marked in the standing posture presumably because greater longitudinal orientation of the heart due to gravity produces a lesser spherical cardiac shape at the onset of systole than in the supine posture.
- FIG. 2 The timing sequence in FIG. 2 is consistent with fluoroscopic imaging of the heart in which the observer perceives a wave of muscular contraction from the cardiac base to apex. Similar timing of the initial changes in ventricular volume with systole has also been described with dimensions recorded during biplane coronary cineangiograms. FIG. 2 also shows that the amplitude of the change in ventricular volume is less at the cranial than the caudal portions of the rib cage. Since the base of the heart is located more cranially than the apex, the finding of lesser changes of volume is consistent with the conclusion that the band measures the horizontal sector of cardiac volume changes subtended by the height of the band.
- FIG. 3 shows tracings from the bands 2.5 cm in height in the same subject whose waveforms are depicted in FIG. 2, but taken one week later at locations ranging from 15 cm below to 10 cm above the xiphoid process.
- the appearance of the waveforms is consistent for recordings taken at the same locations, but one week apart, evidencing good reproducibility of the results.
- the bands placed-12.5 cm and-15 cm below the xiphoid on the abdominal surface show deflections more closely resembling the abdominal aortic pressure pulse. It should be noted that the-15 cm location was 2.5 cm above the umbilicus.
- FIG. 4 shows the ventricular volume curve together with the electrocardiograph and also the descending aortic pressure pulse from the upper rib cage with the electrocardiogram using an average of 50 heart beats.
- the first panel shows the carotid arterial waveform; the second panel shows the carotid arterial waveform derivative; the third panel shows the ventricular volume curve from TCG just below the xiphoid process; and the fourth panel shows the derivative of TCG.
- the first panel shows the descending thoracic aortic pulse obtained from TCG just above nipple level on the RC; the second panel shows its corresponding derivative; and the third and fourth panels show, respectively, the left ventricular volume curve from TCG just below the xiphoid process, and the corresponding derivative.
- the finding of an aortic pressure pulse on the recordings shown on the right side of this Figure demonstrates heterogenicity of cardiogenic oscillations from different thoracic sites.
- the hatched line depicts the EKG; the lowest panel displays the second derivative of the EKG.
- the signal from a whole body plethysmograph represents the sum of both positive and negative deflections from the rib cage added to positive deflections from the abdominal compartment.
- Similar mixing of signals is displayed on the sum signal from the rib cage and abdominal signals utilizing the respiratory inductive plethysmograph or bellows pneumograph in which transducers are placed upon both the rib cage and abdominal surfaces.
- FIG. 5 illustrates a further technique for obtaining waveforms in accordance with the present invention during breathing.
- the irregular waveform in the upper tracing shows the signal detected during breathing from a single narrow band sensor connected to a respiratory inductive plethysmograph, with the band positioned at the xiphoid, which indicates that the band is positioned over the ventricles.
- This raw signal includes both a larger amplitude respiration component, and a smaller one due to cardiac function, the latter being the one of interest here.
- the raw signal in the upper tracing of FIG. 5 is matched, using a conventional curve fitting equation with a cubic spline over sequential cycles, each of which comprises two cardiac beats.
- the electrical gain of respiratory excursions of these bands was adjusted to be equivalent to the band at REF and the amplitude of their cardiac waveforms was compared to the cardiac waveform of the REF band.
- the cardiac waveforms had the contour of ventricular volume curves. More cephalad, waveforms tended to have complex oscillations.
- waveforms resembled descending aortic-pressure pulses. Amplitudes of waveforms were generally smaller at the+6 and+9 cm sites compared to the REF band in all postures, viz. 41% to 70% of REF (p ⁇ 0.01).
- TCG appears to reflect changes in cross-sectional area of the cardiovascular structures underlying the transducer. Since respiratory airflow and regional lung expansion may be altered by different density gases filling the lungs, we investigated whether or not the TCG waveform was influenced by this factor.
- PEP/LVET was obtained as a carotid systolic time interval (STI).
- STI carotid systolic time interval
- FIG. 6 illustrates this point.
- the waveforms shown in FIG. 6 were obtained by placing narrow bands connected to a respiratory inductive plethysmograph at the xiphoid and+25 cm above it, and a single bellows pneumograph (BP)+7.5 cm above the xiphoid process.
- BP bellows pneumograph
- NIP denotes the recording from a neck inductive plethysmograph which provides a non-invasive waveform of the carotid arterial pressure pulse as described in U.S. Pat. Nos.
- FIG. 6 shows that the waveform from the bellows pneumograph (BP) closely resembles the ventricular volume curve obtained using the respiratory inductive plethysmograph.
- BP bellows pneumograph
- FIG. 7 a recording taken with a surface inductive plethysmograph (SIP) placed on the rib cage over the left border of the heart is shown together with the EKG and a recording taken with the respiratory inductive plethysmograph at the xiphoid.
- SIP surface inductive plethysmograph
- the SIP also provides a recording depicting ventricular volume changes, though the waveform appears slightly distorted compared to the corresponding waveforms obtained from cross-sectional slices around the rib cage as recorded with the respiratory inductive plethysmograph using a band placed at the xiphoid process.
- FIG. 8 depicts, for different horizontal postures, ventricular volume waveforms recorded with a wide band placed at the lower rib cage placement shown in the left panel in FIG. 1, and the abdominal aortic pressure pulse recorded with a wide band placed at the mid-abdominal level shown in FIG. 1.
- the EKG is also shown in FIG. 8.
- the ventricular volume curves show similar configurations among the various postures, but there is accentuation of the isovolumetric contraction period of the systolic part of the ventricular volume curve in the left lateral decubitus and the prone postures. Slight alterations in configuration with changes of posture are not unexpected since the heart is free to rotate and elongate in the rib cage as a function of gravity.
- the sector of the heart subtended by the externally placed band or a similar external monitoring device would change if the heart became oriented in a different plane.
- the abdominal aortic pressure pulse tracing is clearly recognizable in the supine posture and completely absent in the prone posture. This is probably because the supine posture permits maximum transmission of the aortic pulse through the more compliant anterior abdominal wall whereas in the prone posture, aortic pressure pulse transmissions to the anterior wall are highly damped leaving only the back and the sides of the abdomen for transmission of vascular oscillations and the large amount of muscle mass present in the back and sides of the abdomen causes compliance (increased stiffness) of these regions which damps the aortic pulse pressure waveforms. Since compliance of the entire rib cage is much higher than the heavily muscled lower back, satisfactory recordings of ventricular volume curves are obtained in all horizontal postures.
- Devices other than the respiratory inductive plethysmograph which are utilized to measure breathing patterns by changes of partial circumferences are conventionally placed on the anterior surface of the rib cage and abdomen compartments. These include the bellows pneumograph, mercury in silastic strain gauges, and the linear differential transformer. They are incapable of accurately monitoring breathing movements in the prone position because motion of the anterior surface of the transducer on the rib cage is restricted owing to the interposition of the transducer between tissues of the rib cage and the horizontal surface of the bed. Since these devices do not generally provide accurate measures of lateral and posterior motion, they cannot display ventricular volume curves when the subject assumes the prone posture.
- Magnetometers which are conventionally placed to measure changes of anteroposterior diameters of the rib cage and abdomen compartments with respiration, do not produce accurate representations of changes of respiration nor ventricular volume when the subject assumes the lateral decubitus postures owing to exclusion of lateral rib cage movements which go undetected by the transducer.
- FIG. 9 depicts the effect of lung volume on ventricular volume curves obtained in accordance with the present invention.
- near TLC indicates near total lung capacity signifying that the subject inspired a deep breath almost to the limit of vital capacity and breathheld with a closed airway at this lung volume level.
- FRC signifies functional residual capacity, i.e. lung volume at the end of normal expiration
- FRC & TLC in FIG. 9 signifies a moderately deep inspiration followed by a breathhold at this level.
- RV connotes residual volume, i.e. lung volume after full expiration
- “near RV” in FIG. 9 indicates breathholding at a lung volume near the lower limits of vital capacity.
- Between FRC and RV signifies breathholding after a moderately deep expiration.
- the configuration of the diastolic slope of the ventricular volume curve is altered by the lung volume level such that the terminal slope is flat at the high lung volumes and slopes upward at low lung volumes. Furthermore, the slope of initial ventricular systole is more gradual at the high lung volume ("near TLC” and “between FRC & TLC”) than the steeper slopes at the low lung volumes (“near RV” and “between FRC & RV”). There are minimal differences in the amplitudes of ventricular volume curves at the various lung volume levels except for a slight increase at the level "between FRC & RV".
- FIG. 10 the effect of the Valsalva maneuver on ventricular volume curves derived in accordance with the present invention is shown.
- the Valsalva maneuver consists of straining against either a closed glottis or an occluded airway.
- FIG. 10 depicts such a maneuver with wide bands placed at the upper and lower rib cage placements depicted in the left-hand panel in FIG. 1.
- Waveforms derived from the neck inductive plethysmograph (NIP) for recording carotid arterial pressure pulses and the bellows pneumograph (BP) placed+7.5 cm above xiphoid for recording ventricular volume are also displayed, as is the EKG.
- NIP neck inductive plethysmograph
- BP bellows pneumograph
- stroke volume The effect of exercise upon stroke volume depends upon the body posture in which exercise is carried out. In normal adults, utilization of dye dilution techniques for cardiac output allows calculation of stroke volume by dividing cardiac output by heart rate.
- heart rate rose from a baseline of 87 b/m to 115 b/m and stroke volume increased 69%. Stroke volume continued to rise slightly with more strenuous exercise up to a maximum of 84% above baseline at a heart rate of 171 b/m.
- stroke volume increased only 6% during mild exercise, from a baseline heart rate of 71 b/m to 119 b/m.
- FIG. 13 shows the effect of this drug on the ventricular volume curve in a supine normal adult as reflected by measurements taken with a respiratory inductive plethysmograph with a wide band place at the lower rib cage placement and on the abdominal aortic pressure pulse as reflected by measurements taken with a wide band at the mid-abdominal placement.
- stroke volume increased 39% above baseline and heart rate rose from the baseline of 54 b/m to 84 b/m.
- Myocardial contractility markedly increased as indicated by the more rapid slope of systolic ejection after amyl nitrite. There was also a more rapid rise in filling during the diastolic portion of the ventricular volume curve. The increased rate of myocardial contractility was also present 27 seconds after amyl nitrite administration when the heart rate had slowed to 67 b/m. Thirty seconds after amyl nitrite administration, the heart rate was slower than baseline at 48 b/m and myocardial contractility returned to baseline value.
- measurement of ventricular volume curves with the respiratory inductive plethysmography in accordance with the invention provides a beat by beat recording during breathholding of the alterations expected from a drug which increases myocardial contractility and cardiac output.
- this information could also be derived during breathing by employing ensemble averaging or the curve fitting technique as more fully described above.
- Ventricular wall dyskinesis is shown in the third recording from the top. Note that the time from the R wave of the EKG to Peak Ejection Rate (PER) is markedly prolonged to 520 ms. Identical findings were obtained with echocardiography. Dyskinetic motion also may be present in patients with pulmonary hypertension in whom right ventricular enlargement is present. This event has been detected with bands located 5 cm above the reference band (placed just below the xiphoid process) which showed a normal left ventricular volume curve contour (FIG. 15).
- Cardiac output can be measured by the thermal dilution method using a Swan-Ganz cardiac catheter whose tip is placed within the pulmonary artery. Stroke volume is calculated by dividing the cardiac output by heart rate. This value can be used to calibrate the systolic portion of the ventricular volume curve (obtained with a narrow band sensor or similar transducer) to an absolute volume value in the baseline period. Thereafter, this value can be utilized for all subsequent calculations of stroke volume from the ventricular volume curves to ascertain both the absolute volume variations and to establish the validity of the non-invasive measurement.
- thermodilution method or other cardiac output method
- the accuracy of the latter depends upon the assumption that the ventricle can be considered as moving with one degree of freedom but this assumption can only be proven by comparing the thermodilution method (or other cardiac output method) to the measurements made with the non-invasive TCG technique.
- This experiment was carried out in six anesthetized dogs. Baseline values were obtained by simultaneous collection of narrow band derived (TCG) and thermodilution values of stroke volume and cardiac output. The animals were then give 50 ml infusions of a 10% dextran 40 solution every 15 minutes with repeated simultaneous measurements at each time interval until cardiac output by the thermodilution method no longer increased with further dextran 40 infusions. Stroke volume by the thermodilution method rose to a maximum of 40% above the baseline value.
- FIG. 17 depicts recordings of bands placed around the upper rib cage of the dog just underneath the axilla with variations of placement approximately 1 to 2 cm upward or downward.
- the left panels depict recordings when the dog was in the left lateral decubitus position on a flat table.
- the upper left panel shows a typical ventricular volume curve along with a superimposed rounded upward wave of atrial diastole at the nadir of ventricular systole.
- the mid-abdominal band on the upper right panel showed a typical waveform of the abdominal aortic pressure pulse with an easily recognizable dicrotic notch. Other band placements also gave abdominal aortic pressure pulses.
- waveforms of ventricular volumes and aortic pulses at different cardiac cycle length, and at various points in the lung volume level and airflow, can also be obtained.
- the technology described herein carries major implications in terms of physiologic, pharmacologic and clinical understanding of cardiac function and diagnosis of heart disease in adults, babies, and animals.
- the configuration of the ventricular volume curve provides indices of systolic and diastolic function of the heart. For systolic function, these intervals and volume ratios were compared to systolic time intervals which are well known timing measures of the carotid arterial pulse, to establish relationships for systolic function between these two different measurements of cardiac contractility. In the first series of experiments, effects of terbutaline were investigated.
- Terbutaline has been purported to be a beta-2 adrenergic agonist but its administration is associated with a marked, sustained increase of cardiac output (CO). The latter is attributed to systemic vasodilation and possibly enhanced ventricular contractility. See Chest, volume 68, pages 616 et seq., 1975. To further characterize its action, several non-invasive cardiovascular monitoring techniques were employed. The left ventricular volume curve (LVVC) was displayed as an averaged cardiogenic oscillation with the thoracocardiograph (TCG). The respiratory signal was eliminated by an ensemble-averaging method.
- LVVC left ventricular volume curve
- TCG thoracocardiograph
- systolic and diastolic volumes from LVVC TCG
- HR heart rate
- BP blood pressure
- the systolic amplitude of the ventricular volume curve can be utilized to estimate trends in stroke volume, and in conjunction with an invasive technique such as thermal dilution or dye dilution, or a non-invasive technique such as impedance cardiography or echocardiography, etc., the ventricular volume waveform can be calibrated to an absolute volume. Measurements can be obtained with the standard (wide) or narrow band transducers of the respiratory inductive plethysmograph, but alternatively other non-invasive sensing devices that have been utilized for measuring breathing movements can also capture cardiovascular events as a function of the height subtended by their transducers.
- the respiratory inductive plethysmograph is preferable to other such devices because it can provide accurate display of ventricular volume curves independent of postural changes in the horizontal plane, whereas other respiratory monitoring devices generally cannot accurately record ventricular volume curves in the prone or lateral decubitus postures.
- the product of heart rate times stroke volume equals cardiac output.
- cardiac output measurements can be obtained at rest and exercise in both normal and diseased subjects. These measurements can be recorded during breathholding on a beat by beat basis or during breathing with display of the average ventricular volume curve by ensemble-averaging using the QRS wave of the electrocardiogram or upstroke of a systemic arterial pulse as a trigger, or by using curve fitting or adaptive digital filtering techniques as described above to extract the cardiogenic waveform from the respiratory waveform.
- ventricular volume curves can be recorded in sleeping humans or animals during spontaneous central apneas, obstructive apneas or during breathing. This should permit analsis of the effect of such entities as Obstructive Sleep Apnea Syndrome on cardiac performance and guide therapeutic interventions.
- the electronics of any of the sensors mentioned above can be miniaturized such that they can be incorporated into a tape recorder, compact disc, etc.--Holter monitoring device to carry out ambulatory monitoring for both electrical activation of the heart through the electrocardiogram and its mechanical response as detected by the present invention for non-invasively recording ventricular volume waveforms and aortic pressure pulse. This should be useful in characterizing cardiac arrhythmias and the effects of cardiac ischemia on cardiac performance.
- FIG. 21 illustrates the effects of externally pacing the right ventricle on the ventricular volume curve of a mechanically ventilated, anesthetized dog.
- the data were obtained by ensemble-averaging using the QRS wave of the EKG as the trigger signal.
- the uppermost tracing depicts the unpaced ("UP") EKG and ventricular volume curve; here the heart rate was 112 beats/minute.
- UP unpaced
- VP ventricular pacing
- the ventricular volume waveform has a similar appearance and timing relation to the QRS as the unpaced recording.
- the recording of both the electrocardiogram and the ventricular volume waveform might help to differentiate supraventricular tachycardia with aberrant electrical conduction from ventricular tachycardia in which the QRS complex is indistinguishable.
- These two arrhythmias require different modes of management, as the ventricular tachycardia is an immediate life-threatening cardiac arrhythmia whereas supraventricular tachycardia with aberrant conduction is not.
- the differentiation may be possible by three means: 1) recording of atrial diastole from a band placed 10 to 15 cm above xiphoid (FIGS.
- Measurement of changes of cardiac output in patients who are critically ill should help to guide therapeutic decisions, either through the use of appropriate doses of drugs and fluids, or with surgical interventions.
- the utilization of ventricular volume waveforms to estimate stroke volume in critically ill patients provides information regarding the effects of intravenous fluid challenge, i.e., if intravenous fluids are given and cardiac output increases, then the therapeutic intervention probably is appropriate. On the other hand, if intravenous fluid is administered and cardiac output remains the same or falls, then the fluid challenge is probably inappropriate.
- This algorithm might diminish the utilization of invasive Swan Ganz catheters placed in the pulmonary artery which are also used to ascertain whether fluid challenges are appropriate through cardiac output measurement and pulmonary arterial and left atrial (wedge) pressure recordings.
- Non-invasive monitoring in accordance with the present invention poses no hazards to the patient nor health care workers while still providing similar hemodynamic information.
- the ventricular volume waveforms along with the electrocardiogram can be obtained at the bedside or transmitted to a video-based central station computerized display for data processing either through hard wire connections or telemetry.
- DO 2 is defined as the product of cardiac output and arterial oxygen content. It signifies the volume of oxyqenated blood delivered to the tissues. A fall in DO 2 produced either by decreased cardiac output, decreased arterial oxygen content or both can cause tissue ischemia and tissue death. Since arterial oxygen capacity is a function of the amount of hemoglobin in the blood, viz. 1.34 ml of oxygen can combine with 1 gm of hemoglobin, one can calculate oxygen content by multiplying the oxygen capacity of the blood by arterial oxygen saturation. The latter can be obtained non-invasively by means of a commercially available device, the pulse oximeter. If hemoglobin content of the blood is stable, then relative changes in DO 2 can be obtained by multiplying arterial oxygen saturation by cardiac output. Thus, trends of DO 2 can be monitored non-invasively using pulse oximetry and TCG.
- TCG derived ventricular volume curve may not accurately reflect the fall in stroke volume owing to changes in the volume-motion coefficient of the rib cage with major changes of body posture as in changing from supine to upright postures.
- the configuration of the curve is altered in an expected way and provides useful information on contractility, viz. instead of a shortening of the R-PER interval as in hypoxia and after terbutaline injection, head-up tilting causes the R-PER interval to lengthen, a finding consistent with decreased cardiac contractility.
- Evaluation of appropriate cardiac pacing rates and the effects of different pacing sequences on stroke volume is an important consideration in cardiac pacemaker therapy. This can be accomplished by analysis of beat to beat stroke volume estimations from ventricular volume waveforms obtained with external sensors placed on the rib cage. In addition, control of optimal pacing rates through a servo loop can be accomplished by monitoring stroke volume to reset the pacing rate for optimal stroke volume performance during exercise. This has already been carried out on a research basis with an intracardiac placed catheter for beat to beat changes of cardiac impedance.
- the monitoring of ventricular volume curves should also be useful in evaluating changes of cardiac output in subjects confined to inaccessible environments such as the magnetic resonance imaging device, space capsules, diving bells, diving suits, high and low pressure chambers etc.
- Measurements of stroke volume during various mechanical ventilatory modalities should help to establish mechanical ventilator settings which least deleteriously affect cardiac output.
- the ventricular volume waveform measured with external sensors on the rib cage can be obtained during mechanical ventilation by the ensemble-averaging, curve fitting and other adaptive digital filtering techniques as described above to extract the cardiac waveform.
- the Valsalva maneuver viz. straining with a closed glottis decreases stroke volume as shown above from measurements of the ventricular waveform in a normal subject.
- the stroke volume normally increases after the straining maneuver is halted and the glottis is opened. Such a response may not occur in patients with heart disease and therefore the maneuver may help to differentiate normal subjects from patients with heart disease.
- the invention provides a mechanical indication of cardiac performance, it will be useful in establishing a timely diagnosis of death from cardiac standstill even though electrical activity of the heart may still be present.
- the rapidity of ventricular emptying as a measure of myocardial contractility can be obtained as the slope of the ventricular volume waveform from the external sensing device placed on the rib cage during systole or by taking an electrical analog or digital derivative of this waveform.
- the slope of rapid filling for the ventricular volume curve at the end of isovolumetric relaxation provides a measure of the mechanical characteristics of ventricular muscle.
- the slope of late diastole provides a measure as to whether the heart is filled, has limited diastolic reserve, or has a great deal of diastolic reserve as indicated by a upward sloping deflection of this portion of the curve. All the situations discussed in the preceding sections, regarding cardiac output and stroke volume, apply for the importance of analyzing the configuration of the ventricular volume waveform to assess cardiac performance.
- the configurations of the ventricular volume and aortic pressure pulses may be abnormal in patients with heart disease at rest, exercise, sleep, and with environmental stresses, e.g. temperature, humidity, etc.
- the waveform of the ventricular volume curve in patients with valvular heart disease has distinctive characteristics. For example, in patients with aortic stenosis the rate of systolic ejection of the ventricular volume curve is diminished whereas in patients with mitral stenosis the rate of diastolic filling is diminished.
- the upstroke of the aortic pressure pulse is also diminished in aortic stenosis.
- Patients with coronary artery disease may have limited ventricular wall motion due to ventricular compliance and have slow filling of diastole. Patients with constricted pericarditis or restrictive myocardiopathy may show diastolic plateaus as a result of these defects.
- a long flat diastolic plateau has been observed in the ventricular volume curve obtained with the present invention in a patient with pulmonary edema, a pulmonary arterial wedge pressure of 27 mmHg, and an enlarged heart on the chest roentgenogram.
- This type of waveform presumably indicates ventricular distention and might serve as a non-invasive monitor of left atrial pressure in such patients.
- Abnormal ventricular motion takes place with stunned myocardium after myocardial ischemia secondary to occlusion of a coronary vessel or with therapeutic angioplasty in which brief occlusion of the coronary artery supplying a region of ventricular muscle produces abnormal wall motion of this part.
- abnormal wall function during myocardial ischemia precedes electrocardiographic abnormalities and is a more sensitive diagnostic sign.
- Acute myocardial infarction produces abnormal ventricular volume waveforms which may be reversed by administration of thrombolytic agents. This phenomenon is best studied with segmental sensors over a large height of the rib cage rather than a wide band sensor enclosing the entire ventricle since small regions of abnormal motion might be missed under these circumstances.
- the configuration of the ventricular volume curve during the Valsalva maneuver in which systolic ejection and stroke volume are markedly diminished in normal subjects, and is followed by an increase of these parameters after release of straining, may not occur in patients with heart disease and thus offers criteria for distinguishing normals from patients with heart disease.
- changing the configuration of the ventricular volume curve by tilting the subject from the supine to upright postures and vice-versa produces characteristic alterations in the configuration of the ventricular volume waveform. For example, in the standing posture, the terminal diastolic portion of the ventricular volume curve normally slopes upwards whereas in the supine posture terminal diastole has a flat plateau. This signifies that the heart is well filled in the supine but not the upright posture, which might not occur in patients with heart disease.
- ventricular volume waveforms at different portions of the ventricle can be recorded such that timing and motion analysis between the segments can be carried out.
- This should prove useful in assessing the effects of acute ischemia and myocardial infarction on configuration of the ventricular volume waveform since it is well known that ventricular wall motion is impaired in these circumstances. This can result in dyskinetic, akinetic or hypokinetic motion of segmental portions of the ventricular wall with consequent abnormalities of the segmental ventricular volume waveforms.
- Using the non-invasive method of the invention with sensors on the rib cage to display segmental ventricular volume waveforms should make possible the diagnosis of such abnormalities and to ascertain the effectiveness of treatment either with intravenous administration of thrombolytic agents or angioplasty of the appropriate coronary artery.
- segmental ventricular volume configuration with such interventions as cardiac pacing, exercise, Valsalva maneuver, tilt, and drug administration, etc. should enhance its diagnostic effectiveness.
- the effects of anesthesia agents on ventricular volume waveforms should help to guide decisions on cardiovascular status during surgery.
- ambulatory Holter monitoring using the electrocardiograph and segmental ventricular waveform analysis with separation of curves into histograms of cardiac lengths and electrical abnormalities such as the ST-T wave depressions or inversions can be utilized to correlate electrical and mechanical events during arrhythmias and periods of potential myocardial ischemia.
- ventricular pressure-volume curves can be constructed to attain a definitive understanding of ventricular performance.
- the analysis of the thoracic aortic and the abdominal aortic pressure pulses should provide useful information on diagnosis of valvular heart disease such as aortic stenosis and a convenient non-invasive means to follow the outcome after surgical valvular repair.
- valvular heart disease such as aortic stenosis
- the upstroke of the aortic pressure curve will diminish with aortic stenosis.
- Abnormal aortic pressure pulses occur with stable and dissecting aneurysms of the thoracic and abdominal aorta and should help in establishing their diagnosis.
- the utilization of the non-invasive method of the invention for recording ventricular volume waveforms either globally or segmentally together with analysis of aortic pressure pulses is an important advance in clinical and research cardiology.
- the electrocardiogram has served a highly useful purpose as an indicator of normal and abnormal electrical activity of the heartbeat, but provides no information on the mechanical responses to electrical activation.
- the invention described herein is the first known to continuously non-invasively monitor mechanical performance of the heart by display of segmental characteristics. It is also the first known invention to quantitatively continuously monitor changes in stroke volume. Further, the same external transducer for cardiac monitoring can be utilized to non-invasively, continuously monitor the breathing pattern.
Abstract
Description
______________________________________
F.sub.I O.sub.2
      SaO.sub.2
             HR     SV    CO   EF   R-PER  V.sub.I
                                                DO.sub.2
______________________________________
.17   90*    1.03   1.01  1.03 1.02 .97*   1.06  .98
.15   88*    1.05*  1.04  1.07 1.05*
                                    .96*   1.16  .99
.12   76*    1.19*  1.10* 1.30*
                               1.08*
                                    .90*   1.22*
                                                1.03
.10   67*    1.27*  1.19* 1.48*
                               1.08*
                                    .87*   1.20*
                                                1.03
______________________________________
Claims (60)
Priority Applications (1)
| Application Number | Priority Date | Filing Date | Title |
|---|---|---|---|
| US07/759,862 US5178151A (en) | 1988-04-20 | 1991-09-16 | System for non-invasive detection of changes of cardiac volumes and aortic pulses |
Applications Claiming Priority (3)
| Application Number | Priority Date | Filing Date | Title |
|---|---|---|---|
| US18377388A | 1988-04-20 | 1988-04-20 | |
| US32615989A | 1989-03-20 | 1989-03-20 | |
| US07/759,862 US5178151A (en) | 1988-04-20 | 1991-09-16 | System for non-invasive detection of changes of cardiac volumes and aortic pulses |
Related Parent Applications (1)
| Application Number | Title | Priority Date | Filing Date |
|---|---|---|---|
| US32615989A Continuation | 1988-04-20 | 1989-03-20 |
Publications (1)
| Publication Number | Publication Date |
|---|---|
| US5178151A true US5178151A (en) | 1993-01-12 |
Family
ID=27391745
Family Applications (1)
| Application Number | Title | Priority Date | Filing Date |
|---|---|---|---|
| US07/759,862 Expired - Lifetime US5178151A (en) | 1988-04-20 | 1991-09-16 | System for non-invasive detection of changes of cardiac volumes and aortic pulses |
Country Status (1)
| Country | Link |
|---|---|
| US (1) | US5178151A (en) |
Cited By (128)
| Publication number | Priority date | Publication date | Assignee | Title |
|---|---|---|---|---|
| US5309917A (en) * | 1991-09-12 | 1994-05-10 | Drexel University | System and method of impedance cardiography and heartbeat determination |
| US5388575A (en) * | 1992-09-25 | 1995-02-14 | Taube; John C. | Adaptive controller for automatic ventilators |
| US5402779A (en) * | 1994-04-29 | 1995-04-04 | Chen; William X. | Method for the non-invasive detection of an intravascular injection of an anesthetic by the use of an indicator dye |
| US5423326A (en) * | 1991-09-12 | 1995-06-13 | Drexel University | Apparatus and method for measuring cardiac output |
| US5540725A (en) * | 1995-07-11 | 1996-07-30 | Pacesetter, Inc. | Upper rate response for implantable pacemaker based on atrial lock interval pacing |
| US5640149A (en) * | 1993-08-31 | 1997-06-17 | Ulco Engineering Pty. Ltd. | Ventilator disconnect alarm |
| US5772601A (en) * | 1996-08-26 | 1998-06-30 | Colin Corporation | Apparatus for evaluating cardiac function of living subject |
| US6029665A (en) * | 1993-11-05 | 2000-02-29 | Resmed Limited | Determination of patency of airway |
| EP0940155A3 (en) * | 1998-02-04 | 2000-05-17 | Medtronic, Inc. | Apparatus for management of sleep apnea |
| US6079412A (en) * | 1997-04-18 | 2000-06-27 | Meier; Bernd Horst | Process and device for controlling and assisting natural breathing and mechanical respiration |
| US6104949A (en) * | 1998-09-09 | 2000-08-15 | Vitatron Medical, B.V. | Medical device |
| US6171263B1 (en) * | 1994-11-24 | 2001-01-09 | The Institute Of Respiratory Medicine Limited | Foetal circulatory impedance monitor |
| US6186956B1 (en) * | 1998-05-28 | 2001-02-13 | University Of South Carolina | Method and system for continuously monitoring cardiac output |
| WO2001019427A2 (en) * | 1999-09-16 | 2001-03-22 | The Johns Hopkins University | Distributed architecture for apparatus used in a high magnetic field and/or rf environment |
| US20020107453A1 (en) * | 1997-12-25 | 2002-08-08 | Nihon Kohden Corporation | Biological signal transmission apparatus |
| WO2001078577A3 (en) * | 2000-04-17 | 2003-01-09 | Vivometrics Inc | Systems and methods for ambulatory monitoring of physiological signs |
| US6602201B1 (en) | 2000-07-10 | 2003-08-05 | Cardiodynamics International Corporation | Apparatus and method for determining cardiac output in a living subject |
| US20030163058A1 (en) * | 2001-10-11 | 2003-08-28 | Osypka Markus J. | Method and apparatus for determining the left-ventricular ejection time TLVE of a heart of a subject |
| US6626842B2 (en) * | 2000-08-09 | 2003-09-30 | Colin Corporation | Heart-sound analyzing apparatus |
| WO2003082099A1 (en) | 2002-03-26 | 2003-10-09 | Vivometrics, Inc. | Method and system for extracting cardiac parameters from plethysmographic signals |
| US20030188757A1 (en) * | 2002-04-03 | 2003-10-09 | Koninklijke Philips Electronics N.V. | CT integrated respiratory monitor |
| US20040030220A1 (en) * | 2002-08-09 | 2004-02-12 | Scimed Life Systems, Inc. | Device with infusion holes for imaging inside a blood vessel |
| US20040059183A1 (en) * | 2000-10-03 | 2004-03-25 | Jansen Jozef Reinier Cornelis | Apparatus for controlling heart assist devices |
| US6726635B1 (en) | 2000-05-12 | 2004-04-27 | Lasala Anthony F. | Cardiac impulse detector |
| US20040122334A1 (en) * | 2002-09-19 | 2004-06-24 | Alfred E. Mann Institute For Biomedical Engineering At The University Of Southern | Vantilation and volume change measurements using permanent magnet and magnet sensor affixed to body |
| US20040123866A1 (en) * | 1993-11-05 | 2004-07-01 | Michael Berthon-Jones | Determination of patency of the airway |
| US20040249299A1 (en) * | 2003-06-06 | 2004-12-09 | Cobb Jeffrey Lane | Methods and systems for analysis of physiological signals |
| US20040260193A1 (en) * | 2000-05-12 | 2004-12-23 | Lasala Anthony F. | Cardiac impulse detector |
| US20040261460A1 (en) * | 2001-05-30 | 2004-12-30 | Roba Giacomo Stefano | Method and burner for manufacturing a glass optical fibre preform by vapour deposition |
| US20040267142A1 (en) * | 2003-06-25 | 2004-12-30 | Cardiac Pacemakers, Inc. | Method and apparatus for trending a physiological cardiac parameter |
| US20050012414A1 (en) * | 2003-07-18 | 2005-01-20 | Osypka Medical Gmbh | Method and apparatus for isolated transformation of a first voltage into a second voltage for measurement of electrical bioimpedances or bioconductances |
| US20050059880A1 (en) * | 2003-09-11 | 2005-03-17 | Mathias Sanjay George | ECG driven image reconstruction for cardiac imaging |
| US20050124903A1 (en) * | 2003-12-05 | 2005-06-09 | Luchy Roteliuk | Pressure-based system and method for determining cardiac stroke volume |
| US20050124904A1 (en) * | 2003-12-05 | 2005-06-09 | Luchy Roteliuk | Arterial pressure-based, automatic determination of a cardiovascular parameter |
| US20050137488A1 (en) * | 2003-12-03 | 2005-06-23 | Ela Medical S.A. | Active implantable medical device with holter recording functions |
| US20050137487A1 (en) * | 2003-12-19 | 2005-06-23 | Qingsheng Zhu | System and method for acquiring breathing pattern signals from intracardiac electrograms and its use for heart failure therapy decision making and disease monitoring |
| US20050187481A1 (en) * | 2003-12-05 | 2005-08-25 | Feras Hatib | Real-time measurement of ventricular stroke volume variations by continuous arterial pulse contour analysis |
| US20050215918A1 (en) * | 2004-03-24 | 2005-09-29 | Frantz Ann K | Thoracic impedance monitor and electrode array and method of use |
| US20050240087A1 (en) * | 2003-11-18 | 2005-10-27 | Vivometrics Inc. | Method and system for processing data from ambulatory physiological monitoring |
| US20060030770A1 (en) * | 2004-08-03 | 2006-02-09 | University Of Vermont And State Agricultural College | Noninvasive pulmonary performance measurement method and system |
| US20060111642A1 (en) * | 2004-11-22 | 2006-05-25 | Baura Gail D | Method and apparatus for signal assessment including event rejection |
| US20060122528A1 (en) * | 2004-09-21 | 2006-06-08 | Yoav Gal | Sensors for inductive plethysmographic monitoring applications and apparel using same |
| US20060178591A1 (en) * | 2004-11-19 | 2006-08-10 | Hempfling Ralf H | Methods and systems for real time breath rate determination with limited processor resources |
| US20060241512A1 (en) * | 2005-04-20 | 2006-10-26 | Cardiac Pacemakers, Inc. | Thoracic or intracardiac impedance detection with automatic vector selection |
| US20060258914A1 (en) * | 2005-04-20 | 2006-11-16 | Derchak P A | Systems and methods for non-invasive physiological monitoring of non-human animals |
| US20060264764A1 (en) * | 2005-05-18 | 2006-11-23 | Alejandro Ortiz-Burgos | System and method for non-invasively determining a left ventricular end-diastolic pressure |
| US20060276718A1 (en) * | 2003-09-03 | 2006-12-07 | Stefan Madaus | Detection appliance and method for observing sleep-related breathing disorders |
| US7149576B1 (en) | 2000-07-10 | 2006-12-12 | Cardiodynamics International Corporation | Apparatus and method for defibrillation of a living subject |
| US20070038382A1 (en) * | 2005-08-09 | 2007-02-15 | Barry Keenan | Method and system for limiting interference in electroencephalographic signals |
| US20070050715A1 (en) * | 2005-07-26 | 2007-03-01 | Vivometrics, Inc. | Computer interfaces including physiologically guided avatars |
| US20070049843A1 (en) * | 2005-05-20 | 2007-03-01 | Derchak P A | Methods and systems for determining dynamic hyperinflation |
| US20070060959A1 (en) * | 2005-09-09 | 2007-03-15 | Cardiac Pacemakers, Inc. | Using implanted sensors for feedback control of implanted medical devices |
| US20070157930A1 (en) * | 2006-01-10 | 2007-07-12 | Viasys Manufacturing, Inc. | System and method for circuit compliance compensated volume assured pressure control in a patient respiratory ventilator |
| US20070172029A1 (en) * | 2006-01-06 | 2007-07-26 | Mayo Foundation For Medical Education And Research | Motion monitor system for use with imaging systems |
| US20070177770A1 (en) * | 2006-01-30 | 2007-08-02 | Derchak P A | System and method for identity confirmation using physiologic biometrics to determine a physiologic fingerprint |
| US20070196005A1 (en) * | 2006-02-23 | 2007-08-23 | White Christopher A | Feature Tracing Process for M-mode Images |
| US7267652B2 (en) | 2003-04-10 | 2007-09-11 | Vivometrics, Inc. | Systems and methods for respiratory event detection |
| US20070209669A1 (en) * | 2006-03-09 | 2007-09-13 | Derchak P Alexander | Monitoring and quantification of smoking behaviors |
| US20070270671A1 (en) * | 2006-04-10 | 2007-11-22 | Vivometrics, Inc. | Physiological signal processing devices and associated processing methods |
| US20070287896A1 (en) * | 2006-06-08 | 2007-12-13 | Derchak P A | System and method for snore detection and confirmation |
| US20080015421A1 (en) * | 2000-10-16 | 2008-01-17 | Remon Medical Technologies, Ltd. | Barometric pressure correction based on remote sources of information |
| US20080015454A1 (en) * | 2005-09-21 | 2008-01-17 | Yoav Gal | Band-like garment for physiological monitoring |
| US20080021333A1 (en) * | 2006-07-21 | 2008-01-24 | Cardiac Pacemakers, Inc. | Multiple sensor deployment |
| US20080027341A1 (en) * | 2002-03-26 | 2008-01-31 | Marvin Sackner | Method and system for extracting cardiac parameters from plethysmographic signals |
| US20080077440A1 (en) * | 2006-09-26 | 2008-03-27 | Remon Medical Technologies, Ltd | Drug dispenser responsive to physiological parameters |
| US20080077020A1 (en) * | 2006-09-22 | 2008-03-27 | Bam Labs, Inc. | Method and apparatus for monitoring vital signs remotely |
| US20080082018A1 (en) * | 2003-04-10 | 2008-04-03 | Sackner Marvin A | Systems and methods for respiratory event detection |
| US20080187193A1 (en) * | 2007-02-01 | 2008-08-07 | Ralph Thomas Hoctor | Method and Apparatus for Forming a Guide Image for an Ultrasound Image Scanner |
| US20080255629A1 (en) * | 2004-11-01 | 2008-10-16 | Proteus Biomedical, Inc. | Cardiac Motion Characterization by Strain Measurement |
| US20080255468A1 (en) * | 2005-04-20 | 2008-10-16 | Derchak P Alexander | Systems and methods for non-invasive physiological monitoring of non-human animals |
| US20080312553A1 (en) * | 2007-06-14 | 2008-12-18 | Timmons Michael J | Intracorporeal pressure measurement devices and methods |
| US20090012408A1 (en) * | 2004-03-24 | 2009-01-08 | Dainippon Sumitomo Pharma Co., Ltd. | Garment for bioinformation measurement having electrode, bioinformtion measurement system and bioinformation measurement device, and device control method |
| US20090069699A1 (en) * | 2007-09-12 | 2009-03-12 | Albert Chin-Yuh Lin | Method of measuring instantaneous arterial blood pressure and compliance and device thereof |
| US20090099480A1 (en) * | 2007-05-24 | 2009-04-16 | Peter Salgo | System and method for patient monitoring |
| US20090112088A1 (en) * | 2007-10-30 | 2009-04-30 | Kabushiki Kaisha Toshiba | Ultrasonic diagnostic apparatus, image data generating apparatus, ultrasonic diagnostic method and image data generating method |
| US20090156945A1 (en) * | 2007-12-13 | 2009-06-18 | Baruch Robert A | Monitoring respiratory variation of pulse pressure |
| US20090204163A1 (en) * | 2008-02-11 | 2009-08-13 | Shuros Allan C | Methods of monitoring hemodynamic status for rhythm discrimination within the heart |
| US20090201148A1 (en) * | 2008-02-12 | 2009-08-13 | Tran Binh C | Systems and methods for controlling wireless signal transfers between ultrasound-enabled medical devices |
| US20090270739A1 (en) * | 2008-01-30 | 2009-10-29 | Edwards Lifesciences Corporation | Real-time detection of vascular conditions of a subject using arterial pressure waveform analysis |
| US7621905B2 (en) | 1997-12-30 | 2009-11-24 | Remon Medical Technologies Ltd. | Devices for intrabody delivery of molecules and systems and methods utilizing same |
| US20100022900A1 (en) * | 2008-01-04 | 2010-01-28 | Peterson Stephen C | Non-Invasive Method And Device For Measuring Cardiac Output |
| US20100094144A1 (en) * | 2008-10-10 | 2010-04-15 | Eyal Doron | Systems and methods for determining cardiac output using pulmonary artery pressure measurements |
| US20100125211A1 (en) * | 2008-11-19 | 2010-05-20 | Stahmann Jeffrey E | Assessment of pulmonary vascular resistance via pulmonary artery pressure |
| US7727161B2 (en) | 2003-04-10 | 2010-06-01 | Vivometrics, Inc. | Systems and methods for monitoring cough |
| WO2010103435A1 (en) * | 2009-03-10 | 2010-09-16 | Koninklijke Philips Electronics N.V. | Diagnosis of asthma |
| US20100249632A1 (en) * | 2007-06-04 | 2010-09-30 | Chungbuk National University Industry Academic Cooperation Foundation | Method and system of monitoring respiratory signal by radio |
| US7813808B1 (en) | 2004-11-24 | 2010-10-12 | Remon Medical Technologies Ltd | Implanted sensor system with optimized operational and sensing parameters |
| US20100274100A1 (en) * | 2004-06-18 | 2010-10-28 | Andrew Behar | Systems and methods for monitoring subjects in potential physiological distress |
| US20100324378A1 (en) * | 2009-06-17 | 2010-12-23 | Tran Binh C | Physiologic signal monitoring using ultrasound signals from implanted devices |
| EP2305110A1 (en) * | 1997-03-17 | 2011-04-06 | Adidas AG | Physiologic signs feedback system |
| US20110172518A1 (en) * | 2003-05-01 | 2011-07-14 | Uri Rapoport | Method for Non-Invasive Measurement of Cardiac Output |
| US8032206B1 (en) * | 2005-10-20 | 2011-10-04 | Pacesetter, Inc. | Use of motion sensor for dynamic updating of heart detection threshold |
| US20110301569A1 (en) * | 2001-01-20 | 2011-12-08 | Gordon Wayne Dyer | Methods and apparatus for the CVCS |
| EP2417905A1 (en) | 2004-06-18 | 2012-02-15 | Adidas AG | Systems and methods for real-time physiological monitoring |
| US8161826B1 (en) | 2009-03-05 | 2012-04-24 | Stryker Corporation | Elastically stretchable fabric force sensor arrays and methods of making |
| US8271093B2 (en) | 2004-09-17 | 2012-09-18 | Cardiac Pacemakers, Inc. | Systems and methods for deriving relative physiologic measurements using a backend computing system |
| US8475387B2 (en) | 2006-06-20 | 2013-07-02 | Adidas Ag | Automatic and ambulatory monitoring of congestive heart failure patients |
| US8533879B1 (en) | 2008-03-15 | 2013-09-17 | Stryker Corporation | Adaptive cushion method and apparatus for minimizing force concentrations on a human body |
| US20130338514A1 (en) * | 2008-09-17 | 2013-12-19 | Covidien Lp | Method for determining hemodynamic effects |
| US8712519B1 (en) | 2006-03-31 | 2014-04-29 | Pacesetter, Inc. | Closed-loop adaptive adjustment of pacing therapy based on cardiogenic impedance signals detected by an implantable medical device |
| US8731649B2 (en) | 2012-08-30 | 2014-05-20 | Covidien Lp | Systems and methods for analyzing changes in cardiac output |
| US20140275961A1 (en) * | 2013-03-15 | 2014-09-18 | Ghassan S. Kassab | Methods for the non-invasive determination of heart and pulmonary pressures |
| US20140288442A1 (en) * | 2010-02-25 | 2014-09-25 | Tonino Bombardini | Method and apparatus for quantification and monitoring of cardiovascular function during induced stress or physical activity and at rest |
| US8844537B1 (en) | 2010-10-13 | 2014-09-30 | Michael T. Abramson | System and method for alleviating sleep apnea |
| US8904876B2 (en) | 2012-09-29 | 2014-12-09 | Stryker Corporation | Flexible piezocapacitive and piezoresistive force and pressure sensors |
| US8977348B2 (en) | 2012-12-21 | 2015-03-10 | Covidien Lp | Systems and methods for determining cardiac output |
| US8997588B2 (en) | 2012-09-29 | 2015-04-07 | Stryker Corporation | Force detecting mat with multiple sensor types |
| US9060745B2 (en) | 2012-08-22 | 2015-06-23 | Covidien Lp | System and method for detecting fluid responsiveness of a patient |
| US9101275B2 (en) | 2013-03-14 | 2015-08-11 | Cardiac Pacemakers, Inc. | Determining systolic time intervals using heart sounds |
| US20150289785A1 (en) * | 2012-08-30 | 2015-10-15 | Diasens D.O.O. | Apparatus and Method for Monitoring Respiration Volumes and Synchronization of Triggering in Mechanical Ventilation by Measuring the Local Curvature of the Torso Surface |
| US9241646B2 (en) | 2012-09-11 | 2016-01-26 | Covidien Lp | System and method for determining stroke volume of a patient |
| US9357937B2 (en) | 2012-09-06 | 2016-06-07 | Covidien Lp | System and method for determining stroke volume of an individual |
| US20170000357A1 (en) * | 2013-11-28 | 2017-01-05 | University Of Western Sydney | Monitoring pneumocardial function |
| FR3040283A1 (en) * | 2015-08-28 | 2017-03-03 | Univ Joseph Fourier - Grenoble 1 | DEVICE AND METHOD FOR NON-INVASIVE MEASUREMENT OF SUB-DIAPHRAGMATIC AORTIC FLOW IN A SMALL LAB MAMMAL |
| US9603534B2 (en) | 2012-02-13 | 2017-03-28 | Cardio Scale Ltd. | Method and system for estimating momentary cardiovascular performance reserve |
| WO2017100188A3 (en) * | 2015-12-07 | 2017-07-27 | Medici Technologies, LLC | Methods and apparatuses for assessment and management of hemodynamic status |
| US9833184B2 (en) | 2006-10-27 | 2017-12-05 | Adidas Ag | Identification of emotional states using physiological responses |
| US9839781B2 (en) | 2005-08-22 | 2017-12-12 | Cardiac Pacemakers, Inc. | Intracardiac impedance and its applications |
| US20190142284A1 (en) * | 2016-05-03 | 2019-05-16 | Maquet Critical Care Ab | Determination of cardiac output or effective pulmonary blood flow during mechanical ventilation |
| US10470718B2 (en) | 2005-08-17 | 2019-11-12 | Osypka Medical Gmbh | Method for digital demodulation and further processing of signals obtained in the measurement of electrical bioimpedance or bioadmittance in a human subject |
| US10514662B1 (en) | 2015-01-22 | 2019-12-24 | Vapotherm, Inc. | Oxygen mixing and delivery |
| WO2020232604A1 (en) * | 2019-05-20 | 2020-11-26 | 深圳市大耳马科技有限公司 | Cardiac diastolic function assessment method, device, and system |
| US10993672B2 (en) | 2017-12-31 | 2021-05-04 | Msheaf Health Management Technologies Limited | Non-invasive method and system to extract characteristic information of bio-tissues |
| US11058303B2 (en) | 2012-09-14 | 2021-07-13 | Covidien Lp | System and method for determining stability of cardiac output |
| WO2022026997A1 (en) * | 2020-07-28 | 2022-02-03 | Regents Of The University Of Minnesota | Wearable ambulatory sensors for measurement of breathing motions |
| US11612706B2 (en) | 2019-11-25 | 2023-03-28 | John C. Taube | Methods, systems, and devices for controlling mechanical ventilation |
| US11717182B2 (en) | 2017-08-25 | 2023-08-08 | Mayo Foundation For Medical Education And Research | Abdominal measurement apparatuses and related methods |
| US11779720B2 (en) | 2019-11-04 | 2023-10-10 | Vapotherm, Inc. | Methods, devices, and systems for improved oxygenation patient monitoring, mixing, and delivery |
Citations (11)
| Publication number | Priority date | Publication date | Assignee | Title |
|---|---|---|---|---|
| US3908639A (en) * | 1971-04-02 | 1975-09-30 | Kevin M Mcintyre | Detecting impaired heart mechanical performance |
| US4232682A (en) * | 1978-08-21 | 1980-11-11 | United States Surgical Corporation | Physiological parameter measuring system |
| US4308870A (en) * | 1980-06-04 | 1982-01-05 | The Kendall Company | Vital signs monitor |
| US4373534A (en) * | 1981-04-14 | 1983-02-15 | Respitrace Corporation | Method and apparatus for calibrating respiration monitoring system |
| US4418700A (en) * | 1981-03-11 | 1983-12-06 | Sylvia Warner | Method and apparatus for measurement of heart-related parameters |
| US4452252A (en) * | 1981-05-26 | 1984-06-05 | Respitrace Corporation | Non-invasive method for monitoring cardiopulmonary parameters |
| US4456015A (en) * | 1981-05-26 | 1984-06-26 | Respitrace Corporation | Non-invasive method for semiquantitative measurement of neck volume changes |
| US4494553A (en) * | 1981-04-01 | 1985-01-22 | F. William Carr | Vital signs monitor |
| US4576179A (en) * | 1983-05-06 | 1986-03-18 | Manus Eugene A | Respiration and heart rate monitoring apparatus |
| US4674518A (en) * | 1985-09-06 | 1987-06-23 | Cardiac Pacemakers, Inc. | Method and apparatus for measuring ventricular volume |
| US4815473A (en) * | 1977-04-07 | 1989-03-28 | Respitrace Corporation | Method and apparatus for monitoring respiration |
-
1991
- 1991-09-16 US US07/759,862 patent/US5178151A/en not_active Expired - Lifetime
Patent Citations (11)
| Publication number | Priority date | Publication date | Assignee | Title |
|---|---|---|---|---|
| US3908639A (en) * | 1971-04-02 | 1975-09-30 | Kevin M Mcintyre | Detecting impaired heart mechanical performance |
| US4815473A (en) * | 1977-04-07 | 1989-03-28 | Respitrace Corporation | Method and apparatus for monitoring respiration |
| US4232682A (en) * | 1978-08-21 | 1980-11-11 | United States Surgical Corporation | Physiological parameter measuring system |
| US4308870A (en) * | 1980-06-04 | 1982-01-05 | The Kendall Company | Vital signs monitor |
| US4418700A (en) * | 1981-03-11 | 1983-12-06 | Sylvia Warner | Method and apparatus for measurement of heart-related parameters |
| US4494553A (en) * | 1981-04-01 | 1985-01-22 | F. William Carr | Vital signs monitor |
| US4373534A (en) * | 1981-04-14 | 1983-02-15 | Respitrace Corporation | Method and apparatus for calibrating respiration monitoring system |
| US4452252A (en) * | 1981-05-26 | 1984-06-05 | Respitrace Corporation | Non-invasive method for monitoring cardiopulmonary parameters |
| US4456015A (en) * | 1981-05-26 | 1984-06-26 | Respitrace Corporation | Non-invasive method for semiquantitative measurement of neck volume changes |
| US4576179A (en) * | 1983-05-06 | 1986-03-18 | Manus Eugene A | Respiration and heart rate monitoring apparatus |
| US4674518A (en) * | 1985-09-06 | 1987-06-23 | Cardiac Pacemakers, Inc. | Method and apparatus for measuring ventricular volume |
Non-Patent Citations (24)
| Title |
|---|
| Blair, H. A. and A. M. Wedd: The measurement in man by a pneumocardiographic method of the excess of arterial outflow from the chest over venous inflow during the heart cycle, Am. Heart. J. 17: 541, 1939. * |
| Bosman, A. R. and G. De J. Lee: The effects of cardiac action upon lung gas volume Clin. Sci. 28: 311 324, 1965. * |
| Bosman, A. R. and G. De J. Lee: The effects of cardiac action upon lung gas volume Clin. Sci. 28: 311-324, 1965. |
| Chapman, C. B., Baker, Mitchell, Collier: Experiences with a cinefluorographic method for measuring ventricular volume Am. J. Card. 18: 25 30, 1966. * |
| Chapman, C. B., Baker, Mitchell, Collier: Experiences with a cinefluorographic method for measuring ventricular volume Am. J. Card. 18: 25-30, 1966. |
| Davila, J. C.: Symposium on measurement of left ventricular volume Part I, Am. J. Card. 18: 1, 1966. * |
| Eddleman E. E. Jr., K. Willis, L. Christianson, J. R., Pierce, and R. P. Walker: The kinetocardiogram, II, The normal configuration and amplitude, Circulation 8: 370 380, 1953. * |
| Eddleman E. E. Jr., K. Willis, L. Christianson, J. R., Pierce, and R. P. Walker: The kinetocardiogram, II, The normal configuration and amplitude, Circulation 8: 370-380, 1953. |
| Eddleman, E. E. Jr., and K. Willis: The Kinetocardiogram III, The distribution of forces over the anterior chest, Cir. 8: 569 577. * |
| Eddleman, E. E. Jr., and K. Willis: The Kinetocardiogram III, The distribution of forces over the anterior chest, Cir. 8: 569-577. |
| Eddleman, E. E., Jr., K. Willis, T. J. Reeves and T. R. Harrison: The Kinetocardiogram, I. Method of Recording Precordial Movements Circulation 8: 269 275, 1953. * |
| Eddleman, E. E., Jr., K. Willis, T. J. Reeves and T. R. Harrison: The Kinetocardiogram, I. Method of Recording Precordial Movements Circulation 8: 269-275, 1953. |
| Kazamias, T. M., M. P. Gander, J. Ross, Jr., and E. Braunwald: Detection of Left Ventricular Wall Motion Disorders in Coronary Artery Disease by Radarkymography, New. Eng. J. Med. 285: 63 71, 1971. * |
| Kazamias, T. M., M. P. Gander, J. Ross, Jr., and E. Braunwald: Detection of Left-Ventricular Wall Motion Disorders in Coronary Artery Disease by Radarkymography, New. Eng. J. Med. 285: 63-71, 1971. |
| Lee, G. de J. and A. B. Dubois: Pulmonary capillary blood flow in man, J. Clin. Invest. 34: 1380 1390, 1955. * |
| Lee, G. de J. and A. B. Dubois: Pulmonary capillary blood flow in man, J. Clin. Invest. 34: 1380-1390, 1955. |
| Luisada, A.: The internal pneumocardiogram, Am. Heart J. 23: 676 691, 1942. * |
| Luisada, A.: The internal pneumocardiogram, Am. Heart J. 23: 676-691, 1942. |
| Wasserman, K. and J. R. Comroe, Jr.: A method for estimating pulmonary capillary blood flow in man, J. Clin. Invest. 41: 401 410, 1962. * |
| Wasserman, K. and J. R. Comroe, Jr.: A method for estimating pulmonary capillary blood flow in man, J. Clin. Invest. 41: 401-410, 1962. |
| Weiner D. A., C. McCabe, G. Dagostino, S. Cutler, and T. J. Ryan: "Cardiokymography During Exercise Testing: A New Device for the Detection of Coronary Artery Disease and Left Ventricular Wall Motion Abnormalities", Am. J. Card., 51: 1307-1311, 1983. |
| Weiner D. A., C. McCabe, G. Dagostino, S. Cutler, and T. J. Ryan: Cardiokymography During Exercise Testing: A New Device for the Detection of Coronary Artery Disease and Left Ventricular Wall Motion Abnormalities , Am. J. Card., 51: 1307 1311, 1983. * |
| Weiner, D. A.: "Accuracy of Cardiokymography During Exercise Testing: Results of a Multi-Center Study," JACC vol. 6, No. 3, Sep. 1985 502-509. |
| Weiner, D. A.: Accuracy of Cardiokymography During Exercise Testing: Results of a Multi Center Study, JACC vol. 6, No. 3, Sep. 1985 502 509. * |
Cited By (263)
| Publication number | Priority date | Publication date | Assignee | Title |
|---|---|---|---|---|
| US5309917A (en) * | 1991-09-12 | 1994-05-10 | Drexel University | System and method of impedance cardiography and heartbeat determination |
| US5423326A (en) * | 1991-09-12 | 1995-06-13 | Drexel University | Apparatus and method for measuring cardiac output |
| US5443073A (en) * | 1991-09-12 | 1995-08-22 | Drexel University | System and method of impedance cardiography monitoring |
| US5388575A (en) * | 1992-09-25 | 1995-02-14 | Taube; John C. | Adaptive controller for automatic ventilators |
| US5640149A (en) * | 1993-08-31 | 1997-06-17 | Ulco Engineering Pty. Ltd. | Ventilator disconnect alarm |
| US6138675A (en) * | 1993-11-05 | 2000-10-31 | Resmed Ltd. | Determination of the occurrence of an apnea |
| US8381722B2 (en) | 1993-11-05 | 2013-02-26 | Resmed Limited | Distinguishing between closed and open airway apneas and treating patients accordingly |
| US20100242965A1 (en) * | 1993-11-05 | 2010-09-30 | Michael Berthon-Jones | Distinguishing between closed and open airway apneas and treating patients accordingly |
| US6029665A (en) * | 1993-11-05 | 2000-02-29 | Resmed Limited | Determination of patency of airway |
| US7320320B2 (en) | 1993-11-05 | 2008-01-22 | Resmed Limited | Determination of patency of the airway |
| US7730886B2 (en) | 1993-11-05 | 2010-06-08 | Resmed Limited | Determination of patency of the airway |
| US8752547B2 (en) | 1993-11-05 | 2014-06-17 | Resmed Limited | Distinguishing between closed and open airway apneas and treating patients accordingly |
| US20040123866A1 (en) * | 1993-11-05 | 2004-07-01 | Michael Berthon-Jones | Determination of patency of the airway |
| US20110011402A1 (en) * | 1993-11-05 | 2011-01-20 | Michael Berthon-Jones | Distinguishing between closed and open airway apneas and treating patients accordingly |
| US20080163873A1 (en) * | 1993-11-05 | 2008-07-10 | Michael Berthon-Jones | Determination of patency of the airway |
| US8360060B2 (en) | 1993-11-05 | 2013-01-29 | Resmed Limited | Distinguishing between closed and open airway apneas and treating patients accordingly |
| US6363933B1 (en) * | 1993-11-05 | 2002-04-02 | Resmed Ltd. | Apparatus and method for controlling the administration of CPAP treatment |
| US5402779A (en) * | 1994-04-29 | 1995-04-04 | Chen; William X. | Method for the non-invasive detection of an intravascular injection of an anesthetic by the use of an indicator dye |
| US6171263B1 (en) * | 1994-11-24 | 2001-01-09 | The Institute Of Respiratory Medicine Limited | Foetal circulatory impedance monitor |
| US5540725A (en) * | 1995-07-11 | 1996-07-30 | Pacesetter, Inc. | Upper rate response for implantable pacemaker based on atrial lock interval pacing |
| US5772601A (en) * | 1996-08-26 | 1998-06-30 | Colin Corporation | Apparatus for evaluating cardiac function of living subject |
| US9462975B2 (en) | 1997-03-17 | 2016-10-11 | Adidas Ag | Systems and methods for ambulatory monitoring of physiological signs |
| US20110087115A1 (en) * | 1997-03-17 | 2011-04-14 | Adidas Ag | Systems and Methods For Ambulatory Monitoring of Physiological Signs |
| EP2305110A1 (en) * | 1997-03-17 | 2011-04-06 | Adidas AG | Physiologic signs feedback system |
| US6079412A (en) * | 1997-04-18 | 2000-06-27 | Meier; Bernd Horst | Process and device for controlling and assisting natural breathing and mechanical respiration |
| US20020107453A1 (en) * | 1997-12-25 | 2002-08-08 | Nihon Kohden Corporation | Biological signal transmission apparatus |
| US7089048B2 (en) * | 1997-12-25 | 2006-08-08 | Nihon Kohden Corporation | Biological signal transmission apparatus |
| US7948148B2 (en) | 1997-12-30 | 2011-05-24 | Remon Medical Technologies Ltd. | Piezoelectric transducer |
| US7621905B2 (en) | 1997-12-30 | 2009-11-24 | Remon Medical Technologies Ltd. | Devices for intrabody delivery of molecules and systems and methods utilizing same |
| US20100094105A1 (en) * | 1997-12-30 | 2010-04-15 | Yariv Porat | Piezoelectric transducer |
| EP0940155A3 (en) * | 1998-02-04 | 2000-05-17 | Medtronic, Inc. | Apparatus for management of sleep apnea |
| US6186956B1 (en) * | 1998-05-28 | 2001-02-13 | University Of South Carolina | Method and system for continuously monitoring cardiac output |
| US6104949A (en) * | 1998-09-09 | 2000-08-15 | Vitatron Medical, B.V. | Medical device |
| WO2001019427A3 (en) * | 1999-09-16 | 2001-09-27 | Univ Johns Hopkins | Distributed architecture for apparatus used in a high magnetic field and/or rf environment |
| WO2001019427A2 (en) * | 1999-09-16 | 2001-03-22 | The Johns Hopkins University | Distributed architecture for apparatus used in a high magnetic field and/or rf environment |
| US20030135127A1 (en) * | 2000-04-17 | 2003-07-17 | Vivometrics, Inc. | Systems and methods for ambulatory monitoring of physiological signs |
| EP2324760A3 (en) * | 2000-04-17 | 2014-06-18 | Adidas AG | Systems and methods for ambulatory monitoring of physiological signs |
| US6551252B2 (en) * | 2000-04-17 | 2003-04-22 | Vivometrics, Inc. | Systems and methods for ambulatory monitoring of physiological signs |
| US7670295B2 (en) | 2000-04-17 | 2010-03-02 | Vivometrics, Inc. | Systems and methods for ambulatory monitoring of physiological signs |
| WO2001078577A3 (en) * | 2000-04-17 | 2003-01-09 | Vivometrics Inc | Systems and methods for ambulatory monitoring of physiological signs |
| US9750429B1 (en) | 2000-04-17 | 2017-09-05 | Adidas Ag | Systems and methods for ambulatory monitoring of physiological signs |
| EP2324760A2 (en) | 2000-04-17 | 2011-05-25 | Adidas AG | Systems and methods for ambulatory monitoring of physiological signs |
| EP2324761A2 (en) | 2000-04-17 | 2011-05-25 | Adidas AG | Systems and methods for ambulatory monitoring of physiological signals |
| US20040260193A1 (en) * | 2000-05-12 | 2004-12-23 | Lasala Anthony F. | Cardiac impulse detector |
| US6726635B1 (en) | 2000-05-12 | 2004-04-27 | Lasala Anthony F. | Cardiac impulse detector |
| US6602201B1 (en) | 2000-07-10 | 2003-08-05 | Cardiodynamics International Corporation | Apparatus and method for determining cardiac output in a living subject |
| US7149576B1 (en) | 2000-07-10 | 2006-12-12 | Cardiodynamics International Corporation | Apparatus and method for defibrillation of a living subject |
| US7251524B1 (en) | 2000-07-10 | 2007-07-31 | Cardiodynamics International Corporation | Apparatus and method for determining cardiac output in a living subject |
| US6626842B2 (en) * | 2000-08-09 | 2003-09-30 | Colin Corporation | Heart-sound analyzing apparatus |
| US7169109B2 (en) * | 2000-10-03 | 2007-01-30 | Arrow International, Inc. | Methods and apparatus for controlling heart assist devices |
| US20040059183A1 (en) * | 2000-10-03 | 2004-03-25 | Jansen Jozef Reinier Cornelis | Apparatus for controlling heart assist devices |
| US7641619B2 (en) | 2000-10-16 | 2010-01-05 | Remon Medical Technologies, Ltd. | Barometric pressure correction based on remote sources of information |
| US20080015421A1 (en) * | 2000-10-16 | 2008-01-17 | Remon Medical Technologies, Ltd. | Barometric pressure correction based on remote sources of information |
| US20110301569A1 (en) * | 2001-01-20 | 2011-12-08 | Gordon Wayne Dyer | Methods and apparatus for the CVCS |
| US20040261460A1 (en) * | 2001-05-30 | 2004-12-30 | Roba Giacomo Stefano | Method and burner for manufacturing a glass optical fibre preform by vapour deposition |
| US20110190601A1 (en) * | 2001-10-11 | 2011-08-04 | Osypka Markus J | System for Determining the Left-Ventricular Ejection Time TLVE of a Heart of a Subject |
| US8562538B2 (en) | 2001-10-11 | 2013-10-22 | Osypka Medical Gmbh | System for determining the left-ventricular ejection time TLVE of a heart of a subject |
| US7822470B2 (en) | 2001-10-11 | 2010-10-26 | Osypka Medical Gmbh | Method for determining the left-ventricular ejection time TLVE of a heart of a subject |
| US20030163058A1 (en) * | 2001-10-11 | 2003-08-28 | Osypka Markus J. | Method and apparatus for determining the left-ventricular ejection time TLVE of a heart of a subject |
| EP2633808A1 (en) | 2002-03-26 | 2013-09-04 | adidas AG | Method and system for extracting cardiac parameters from plethysmographic signals |
| US8790272B2 (en) | 2002-03-26 | 2014-07-29 | Adidas Ag | Method and system for extracting cardiac parameters from plethysmographic signals |
| EP1549212A1 (en) * | 2002-03-26 | 2005-07-06 | Vivometrics, Inc. | Method and system for extracting cardiac parameters from plethysmographic signals |
| US20080027341A1 (en) * | 2002-03-26 | 2008-01-31 | Marvin Sackner | Method and system for extracting cardiac parameters from plethysmographic signals |
| WO2003082099A1 (en) | 2002-03-26 | 2003-10-09 | Vivometrics, Inc. | Method and system for extracting cardiac parameters from plethysmographic signals |
| US7604603B2 (en) | 2002-03-26 | 2009-10-20 | Vivometrics, Inc. | Method and system for extracting cardiac parameters from plethysmographic signals |
| EP1549212A4 (en) * | 2002-03-26 | 2007-05-09 | Vivometrics Inc | Method and system for extracting cardiac parameters from plethysmographic signals |
| US20060036183A1 (en) * | 2002-03-26 | 2006-02-16 | Vivometrics Inc. | Method and system for extracting cardiac parameters from plethysmographic signals |
| US20030188757A1 (en) * | 2002-04-03 | 2003-10-09 | Koninklijke Philips Electronics N.V. | CT integrated respiratory monitor |
| US7182083B2 (en) * | 2002-04-03 | 2007-02-27 | Koninklijke Philips Electronics N.V. | CT integrated respiratory monitor |
| US20040030220A1 (en) * | 2002-08-09 | 2004-02-12 | Scimed Life Systems, Inc. | Device with infusion holes for imaging inside a blood vessel |
| US7613503B2 (en) * | 2002-08-09 | 2009-11-03 | Boston Scientific Scimed, Inc. | Device with infusion holes for imaging inside a blood vessel |
| US20040122334A1 (en) * | 2002-09-19 | 2004-06-24 | Alfred E. Mann Institute For Biomedical Engineering At The University Of Southern | Vantilation and volume change measurements using permanent magnet and magnet sensor affixed to body |
| US20080082018A1 (en) * | 2003-04-10 | 2008-04-03 | Sackner Marvin A | Systems and methods for respiratory event detection |
| EP2589335A2 (en) | 2003-04-10 | 2013-05-08 | Adidas AG | Systems and methods for respiratory event dedection |
| US7727161B2 (en) | 2003-04-10 | 2010-06-01 | Vivometrics, Inc. | Systems and methods for monitoring cough |
| US7267652B2 (en) | 2003-04-10 | 2007-09-11 | Vivometrics, Inc. | Systems and methods for respiratory event detection |
| US9297874B2 (en) | 2003-05-01 | 2016-03-29 | Aspect Imaging Ltd. | Apparatus and method for non-invasive measurement of cardiac output |
| US8798715B2 (en) | 2003-05-01 | 2014-08-05 | Aspect Imaging Ltd | Method for non-invasive measurement of cardiac output |
| US20110172518A1 (en) * | 2003-05-01 | 2011-07-14 | Uri Rapoport | Method for Non-Invasive Measurement of Cardiac Output |
| US20040249299A1 (en) * | 2003-06-06 | 2004-12-09 | Cobb Jeffrey Lane | Methods and systems for analysis of physiological signals |
| US8340747B2 (en) | 2003-06-25 | 2012-12-25 | Cardiac Pacemakers, Inc. | Method and apparatus for trending a physiological cardiac parameter |
| US8594789B2 (en) | 2003-06-25 | 2013-11-26 | Cardiac Pacemakers, Inc. | Method and apparatus for trending a physiological cardiac parameter |
| US20110009767A1 (en) * | 2003-06-25 | 2011-01-13 | Paul Goode | Method and apparatus for trending a physiological cardiac parameter |
| US20040267142A1 (en) * | 2003-06-25 | 2004-12-30 | Cardiac Pacemakers, Inc. | Method and apparatus for trending a physiological cardiac parameter |
| US20070049835A1 (en) * | 2003-06-25 | 2007-03-01 | Cardiac Pacemakers, Inc. | Method and apparatus for trending a physiological cardiac parameter |
| US7171258B2 (en) * | 2003-06-25 | 2007-01-30 | Cardiac Pacemakers, Inc. | Method and apparatus for trending a physiological cardiac parameter |
| US7826891B2 (en) | 2003-06-25 | 2010-11-02 | Cardiac Pacemakers, Inc. | Method and apparatus for trending a physiological cardiac parameter |
| US20050012414A1 (en) * | 2003-07-18 | 2005-01-20 | Osypka Medical Gmbh | Method and apparatus for isolated transformation of a first voltage into a second voltage for measurement of electrical bioimpedances or bioconductances |
| US10154811B2 (en) * | 2003-09-03 | 2018-12-18 | Resmed R&D Germany Gmbh | Detection appliance and method for observing sleep-related breathing disorders |
| US20060276718A1 (en) * | 2003-09-03 | 2006-12-07 | Stefan Madaus | Detection appliance and method for observing sleep-related breathing disorders |
| US20050059880A1 (en) * | 2003-09-11 | 2005-03-17 | Mathias Sanjay George | ECG driven image reconstruction for cardiac imaging |
| US20050240087A1 (en) * | 2003-11-18 | 2005-10-27 | Vivometrics Inc. | Method and system for processing data from ambulatory physiological monitoring |
| US8137270B2 (en) * | 2003-11-18 | 2012-03-20 | Adidas Ag | Method and system for processing data from ambulatory physiological monitoring |
| EP2508124A2 (en) | 2003-11-18 | 2012-10-10 | Adidas AG | System for processing data from ambulatory physiological monitoring |
| US9277871B2 (en) | 2003-11-18 | 2016-03-08 | Adidas Ag | Method and system for processing data from ambulatory physiological monitoring |
| EP2508123A1 (en) | 2003-11-18 | 2012-10-10 | Adidas AG | Method and system for processing data from ambulatory physiological monitoring |
| US20050137488A1 (en) * | 2003-12-03 | 2005-06-23 | Ela Medical S.A. | Active implantable medical device with holter recording functions |
| US8064992B2 (en) * | 2003-12-03 | 2011-11-22 | Ela Medical S.A.S. | Active implantable medical device with holter recording functions |
| US7452333B2 (en) | 2003-12-05 | 2008-11-18 | Edwards Lifesciences Corporation | Arterial pressure-based, automatic determination of a cardiovascular parameter |
| US20080300494A1 (en) * | 2003-12-05 | 2008-12-04 | Edwards Lifesciences Corporation | Real-time measurement of ventricular stroke volume variations by continuous arterial pulse contour analysis |
| US8721556B2 (en) | 2003-12-05 | 2014-05-13 | Edwards Lifesciences Corporation | Arterial pressure-based, automatic determination of a cardiovascular parameter |
| US20050187481A1 (en) * | 2003-12-05 | 2005-08-25 | Feras Hatib | Real-time measurement of ventricular stroke volume variations by continuous arterial pulse contour analysis |
| US20050124903A1 (en) * | 2003-12-05 | 2005-06-09 | Luchy Roteliuk | Pressure-based system and method for determining cardiac stroke volume |
| US20050124904A1 (en) * | 2003-12-05 | 2005-06-09 | Luchy Roteliuk | Arterial pressure-based, automatic determination of a cardiovascular parameter |
| WO2005055825A1 (en) * | 2003-12-05 | 2005-06-23 | Edwards Lifesciences Corporation | Arterial pressure-based, automatic determination of a cardiovascular parameter |
| US7422562B2 (en) | 2003-12-05 | 2008-09-09 | Edwards Lifesciences | Real-time measurement of ventricular stroke volume variations by continuous arterial pulse contour analysis |
| US20070149884A1 (en) * | 2003-12-05 | 2007-06-28 | Luchy Roteliuk | Pressure-based system and method for determining cardiac stroke volume |
| US7967757B2 (en) | 2003-12-05 | 2011-06-28 | Edwards Lifesciences Corporation | Arterial pressure-based, automatic determination of a cardiovascular parameter |
| US20090062666A1 (en) * | 2003-12-05 | 2009-03-05 | Edwards Lifesciences Corporation | Arterial pressure-based, automatic determination of a cardiovascular parameter |
| US7785263B2 (en) | 2003-12-05 | 2010-08-31 | Edwards Lifesciences Corporation | Pressure-based system and method for determining cardiac stroke volume |
| US7220230B2 (en) | 2003-12-05 | 2007-05-22 | Edwards Lifesciences Corporation | Pressure-based system and method for determining cardiac stroke volume |
| US20050137487A1 (en) * | 2003-12-19 | 2005-06-23 | Qingsheng Zhu | System and method for acquiring breathing pattern signals from intracardiac electrograms and its use for heart failure therapy decision making and disease monitoring |
| US7184817B2 (en) * | 2003-12-19 | 2007-02-27 | Cardiac Pacemakers, Inc. | System and method for acquiring breathing pattern signals from intracardiac electrograms and its use for heart failure therapy decision making and disease monitoring |
| US9433379B2 (en) | 2004-03-24 | 2016-09-06 | Nihon Kohden Corporation | Garment for bioinformation measurement having electrode, bioinformation measurement system and bioinformation measurement device, and device control method |
| US7474918B2 (en) | 2004-03-24 | 2009-01-06 | Noninvasive Medical Technologies, Inc. | Thoracic impedance monitor and electrode array and method of use |
| US9026200B2 (en) * | 2004-03-24 | 2015-05-05 | Nihon Kohden Corporation | Garment for bioinformation measurement having electrode, bioinformation measurement system and bioinformation measurement device, and device control method |
| US9414785B2 (en) | 2004-03-24 | 2016-08-16 | Nihon Kohden Corporation | Garment for bioinformation measurement having electrode, bioinformation measurement system and bioinformation measurement device, and device control method |
| US20090012408A1 (en) * | 2004-03-24 | 2009-01-08 | Dainippon Sumitomo Pharma Co., Ltd. | Garment for bioinformation measurement having electrode, bioinformtion measurement system and bioinformation measurement device, and device control method |
| US20050215918A1 (en) * | 2004-03-24 | 2005-09-29 | Frantz Ann K | Thoracic impedance monitor and electrode array and method of use |
| US9492084B2 (en) | 2004-06-18 | 2016-11-15 | Adidas Ag | Systems and methods for monitoring subjects in potential physiological distress |
| US20100274100A1 (en) * | 2004-06-18 | 2010-10-28 | Andrew Behar | Systems and methods for monitoring subjects in potential physiological distress |
| EP2417905A1 (en) | 2004-06-18 | 2012-02-15 | Adidas AG | Systems and methods for real-time physiological monitoring |
| US10478065B2 (en) | 2004-06-18 | 2019-11-19 | Adidas Ag | Systems and methods for monitoring subjects in potential physiological distress |
| US7945303B2 (en) * | 2004-08-03 | 2011-05-17 | The University Of Vermont And State Agricultural College | Noninvasive pulmonary performance measurement method and system |
| US20060030770A1 (en) * | 2004-08-03 | 2006-02-09 | University Of Vermont And State Agricultural College | Noninvasive pulmonary performance measurement method and system |
| US8271093B2 (en) | 2004-09-17 | 2012-09-18 | Cardiac Pacemakers, Inc. | Systems and methods for deriving relative physiologic measurements using a backend computing system |
| US8852099B2 (en) | 2004-09-17 | 2014-10-07 | Cardiac Pacemakers, Inc. | Systems and methods for deriving relative physiologic measurements |
| US8034001B2 (en) | 2004-09-21 | 2011-10-11 | Yoav Gal | Sensors for inductive plethysmographic monitoring applications and apparel using same |
| US8777868B2 (en) | 2004-09-21 | 2014-07-15 | Adidas Ag | Sensors for inductive plethysmographic monitoring applications and apparel using same |
| US20060122528A1 (en) * | 2004-09-21 | 2006-06-08 | Yoav Gal | Sensors for inductive plethysmographic monitoring applications and apparel using same |
| US9375165B2 (en) | 2004-09-21 | 2016-06-28 | Adidas Ag | Sensors for inductive plethysmographic monitoring applications and apparel using the same |
| US9850600B2 (en) | 2004-09-21 | 2017-12-26 | Adidas Ag | Sensor garment and methods of making the same |
| US20080255629A1 (en) * | 2004-11-01 | 2008-10-16 | Proteus Biomedical, Inc. | Cardiac Motion Characterization by Strain Measurement |
| US8121687B2 (en) | 2004-11-01 | 2012-02-21 | Proteus Biomedical, Inc. | Cardiac motion characterization by strain measurement |
| US20060178591A1 (en) * | 2004-11-19 | 2006-08-10 | Hempfling Ralf H | Methods and systems for real time breath rate determination with limited processor resources |
| US20060111642A1 (en) * | 2004-11-22 | 2006-05-25 | Baura Gail D | Method and apparatus for signal assessment including event rejection |
| US7570989B2 (en) | 2004-11-22 | 2009-08-04 | Cardiodynamics International Corporation | Method and apparatus for signal assessment including event rejection |
| US7813808B1 (en) | 2004-11-24 | 2010-10-12 | Remon Medical Technologies Ltd | Implanted sensor system with optimized operational and sensing parameters |
| US20060241512A1 (en) * | 2005-04-20 | 2006-10-26 | Cardiac Pacemakers, Inc. | Thoracic or intracardiac impedance detection with automatic vector selection |
| US8761876B2 (en) | 2005-04-20 | 2014-06-24 | Cardiac Pacemakers, Inc. | Thoracic or intracardiac impedance detection with automatic vector selection |
| US20060258914A1 (en) * | 2005-04-20 | 2006-11-16 | Derchak P A | Systems and methods for non-invasive physiological monitoring of non-human animals |
| US20080255468A1 (en) * | 2005-04-20 | 2008-10-16 | Derchak P Alexander | Systems and methods for non-invasive physiological monitoring of non-human animals |
| US8473050B2 (en) | 2005-04-20 | 2013-06-25 | Cardiac Pacemakers, Inc. | Thoracic or intracardiac impedance detection with automatic vector selection |
| US8014860B2 (en) | 2005-04-20 | 2011-09-06 | Cardiac Pacemakers, Inc. | Thoracic or intracardiac impedance detection with automatic vector selection |
| US7630763B2 (en) * | 2005-04-20 | 2009-12-08 | Cardiac Pacemakers, Inc. | Thoracic or intracardiac impedance detection with automatic vector selection |
| US7762953B2 (en) | 2005-04-20 | 2010-07-27 | Adidas Ag | Systems and methods for non-invasive physiological monitoring of non-human animals |
| US7857769B2 (en) | 2005-05-18 | 2010-12-28 | Alejandro Ortiz-Burgos | System and method for non-invasively determining a left ventricular end-diastolic pressure |
| US8663117B2 (en) | 2005-05-18 | 2014-03-04 | Dagmar Andueza | System and method for diagnosing a fluid status of a patient |
| US20110098557A1 (en) * | 2005-05-18 | 2011-04-28 | Alejandro Ortiz-Burgos | System and method for diagnosing a fluid status of a patient |
| US20060264764A1 (en) * | 2005-05-18 | 2006-11-23 | Alejandro Ortiz-Burgos | System and method for non-invasively determining a left ventricular end-diastolic pressure |
| US7878979B2 (en) | 2005-05-20 | 2011-02-01 | Adidas Ag | Methods and systems for determining dynamic hyperinflation |
| US20070049843A1 (en) * | 2005-05-20 | 2007-03-01 | Derchak P A | Methods and systems for determining dynamic hyperinflation |
| US8628480B2 (en) | 2005-05-20 | 2014-01-14 | Adidas Ag | Methods and systems for monitoring respiratory data |
| US8790255B2 (en) | 2005-07-26 | 2014-07-29 | Adidas Ag | Computer interfaces including physiologically guided avatars |
| US20070050715A1 (en) * | 2005-07-26 | 2007-03-01 | Vivometrics, Inc. | Computer interfaces including physiologically guided avatars |
| EP2484278A2 (en) | 2005-07-26 | 2012-08-08 | adidas AG | Computer interfaces including physiologically guided avatars |
| US8033996B2 (en) | 2005-07-26 | 2011-10-11 | Adidas Ag | Computer interfaces including physiologically guided avatars |
| EP2484277A2 (en) | 2005-07-26 | 2012-08-08 | adidas AG | Computer interfaces including physiologically guided avatars |
| EP2484276A2 (en) | 2005-07-26 | 2012-08-08 | adidas AG | Computer interfaces including physiologically guided avatars |
| US20070038382A1 (en) * | 2005-08-09 | 2007-02-15 | Barry Keenan | Method and system for limiting interference in electroencephalographic signals |
| US7809433B2 (en) | 2005-08-09 | 2010-10-05 | Adidas Ag | Method and system for limiting interference in electroencephalographic signals |
| US10470718B2 (en) | 2005-08-17 | 2019-11-12 | Osypka Medical Gmbh | Method for digital demodulation and further processing of signals obtained in the measurement of electrical bioimpedance or bioadmittance in a human subject |
| US11642088B2 (en) | 2005-08-17 | 2023-05-09 | Osypka Medical Gmbh | Method and apparatus for digital demodulation and further processing of signals obtained in the measurement of electrical bioimpedance or bioadmittance in an object |
| US9839781B2 (en) | 2005-08-22 | 2017-12-12 | Cardiac Pacemakers, Inc. | Intracardiac impedance and its applications |
| US7949394B2 (en) | 2005-09-09 | 2011-05-24 | Cardiac Pacemakers, Inc. | Using implanted sensors for feedback control of implanted medical devices |
| US20070060959A1 (en) * | 2005-09-09 | 2007-03-15 | Cardiac Pacemakers, Inc. | Using implanted sensors for feedback control of implanted medical devices |
| US20100222833A1 (en) * | 2005-09-09 | 2010-09-02 | Rodney Salo | Using implanted sensors for feedback control of implanted medical devices |
| US7742815B2 (en) | 2005-09-09 | 2010-06-22 | Cardiac Pacemakers, Inc. | Using implanted sensors for feedback control of implanted medical devices |
| US9504410B2 (en) | 2005-09-21 | 2016-11-29 | Adidas Ag | Band-like garment for physiological monitoring |
| US20080015454A1 (en) * | 2005-09-21 | 2008-01-17 | Yoav Gal | Band-like garment for physiological monitoring |
| US8032206B1 (en) * | 2005-10-20 | 2011-10-04 | Pacesetter, Inc. | Use of motion sensor for dynamic updating of heart detection threshold |
| US7678063B2 (en) * | 2006-01-06 | 2010-03-16 | Mayo Foundation For Medical Education And Research | Motion monitor system for use with imaging systems |
| US20070172029A1 (en) * | 2006-01-06 | 2007-07-26 | Mayo Foundation For Medical Education And Research | Motion monitor system for use with imaging systems |
| US20070157930A1 (en) * | 2006-01-10 | 2007-07-12 | Viasys Manufacturing, Inc. | System and method for circuit compliance compensated volume assured pressure control in a patient respiratory ventilator |
| US8474455B2 (en) * | 2006-01-10 | 2013-07-02 | Carefusion 207, Inc. | System and method for circuit compliance compensated volume assured pressure control in a patient respiratory ventilator |
| US20070177770A1 (en) * | 2006-01-30 | 2007-08-02 | Derchak P A | System and method for identity confirmation using physiologic biometrics to determine a physiologic fingerprint |
| US8762733B2 (en) | 2006-01-30 | 2014-06-24 | Adidas Ag | System and method for identity confirmation using physiologic biometrics to determine a physiologic fingerprint |
| WO2007100804A2 (en) * | 2006-02-23 | 2007-09-07 | Visualsonics Corp. | Feature tracing process for m- mode images |
| US20070196005A1 (en) * | 2006-02-23 | 2007-08-23 | White Christopher A | Feature Tracing Process for M-mode Images |
| WO2007100804A3 (en) * | 2006-02-23 | 2008-11-13 | Visualsonics Corp | Feature tracing process for m- mode images |
| US20070209669A1 (en) * | 2006-03-09 | 2007-09-13 | Derchak P Alexander | Monitoring and quantification of smoking behaviors |
| US8712519B1 (en) | 2006-03-31 | 2014-04-29 | Pacesetter, Inc. | Closed-loop adaptive adjustment of pacing therapy based on cardiogenic impedance signals detected by an implantable medical device |
| US20070270671A1 (en) * | 2006-04-10 | 2007-11-22 | Vivometrics, Inc. | Physiological signal processing devices and associated processing methods |
| US20070287896A1 (en) * | 2006-06-08 | 2007-12-13 | Derchak P A | System and method for snore detection and confirmation |
| US8177724B2 (en) | 2006-06-08 | 2012-05-15 | Adidas Ag | System and method for snore detection and confirmation |
| US8475387B2 (en) | 2006-06-20 | 2013-07-02 | Adidas Ag | Automatic and ambulatory monitoring of congestive heart failure patients |
| US20080021333A1 (en) * | 2006-07-21 | 2008-01-24 | Cardiac Pacemakers, Inc. | Multiple sensor deployment |
| US7955268B2 (en) | 2006-07-21 | 2011-06-07 | Cardiac Pacemakers, Inc. | Multiple sensor deployment |
| US11439345B2 (en) | 2006-09-22 | 2022-09-13 | Sleep Number Corporation | Method and apparatus for monitoring vital signs remotely |
| US20080077020A1 (en) * | 2006-09-22 | 2008-03-27 | Bam Labs, Inc. | Method and apparatus for monitoring vital signs remotely |
| US20080077440A1 (en) * | 2006-09-26 | 2008-03-27 | Remon Medical Technologies, Ltd | Drug dispenser responsive to physiological parameters |
| US9833184B2 (en) | 2006-10-27 | 2017-12-05 | Adidas Ag | Identification of emotional states using physiological responses |
| US20080187193A1 (en) * | 2007-02-01 | 2008-08-07 | Ralph Thomas Hoctor | Method and Apparatus for Forming a Guide Image for an Ultrasound Image Scanner |
| US7925068B2 (en) * | 2007-02-01 | 2011-04-12 | General Electric Company | Method and apparatus for forming a guide image for an ultrasound image scanner |
| US20090099480A1 (en) * | 2007-05-24 | 2009-04-16 | Peter Salgo | System and method for patient monitoring |
| US20100249632A1 (en) * | 2007-06-04 | 2010-09-30 | Chungbuk National University Industry Academic Cooperation Foundation | Method and system of monitoring respiratory signal by radio |
| US20080312553A1 (en) * | 2007-06-14 | 2008-12-18 | Timmons Michael J | Intracorporeal pressure measurement devices and methods |
| US7662102B2 (en) * | 2007-09-12 | 2010-02-16 | E-Med Biotech, Inc. | Method of measuring instantaneous arterial blood pressure and compliance and device thereof |
| US20090069699A1 (en) * | 2007-09-12 | 2009-03-12 | Albert Chin-Yuh Lin | Method of measuring instantaneous arterial blood pressure and compliance and device thereof |
| US20090112088A1 (en) * | 2007-10-30 | 2009-04-30 | Kabushiki Kaisha Toshiba | Ultrasonic diagnostic apparatus, image data generating apparatus, ultrasonic diagnostic method and image data generating method |
| US20090156945A1 (en) * | 2007-12-13 | 2009-06-18 | Baruch Robert A | Monitoring respiratory variation of pulse pressure |
| US8551005B2 (en) | 2007-12-13 | 2013-10-08 | Robert A. BARUCH | Monitoring respiratory variation of pulse pressure |
| US20100022900A1 (en) * | 2008-01-04 | 2010-01-28 | Peterson Stephen C | Non-Invasive Method And Device For Measuring Cardiac Output |
| US8721559B2 (en) | 2008-01-04 | 2014-05-13 | Raytheon Company | Non-invasive method and device for measuring cardiac output |
| US20090270739A1 (en) * | 2008-01-30 | 2009-10-29 | Edwards Lifesciences Corporation | Real-time detection of vascular conditions of a subject using arterial pressure waveform analysis |
| US20090204163A1 (en) * | 2008-02-11 | 2009-08-13 | Shuros Allan C | Methods of monitoring hemodynamic status for rhythm discrimination within the heart |
| US8725260B2 (en) | 2008-02-11 | 2014-05-13 | Cardiac Pacemakers, Inc | Methods of monitoring hemodynamic status for rhythm discrimination within the heart |
| US20090201148A1 (en) * | 2008-02-12 | 2009-08-13 | Tran Binh C | Systems and methods for controlling wireless signal transfers between ultrasound-enabled medical devices |
| US8369960B2 (en) | 2008-02-12 | 2013-02-05 | Cardiac Pacemakers, Inc. | Systems and methods for controlling wireless signal transfers between ultrasound-enabled medical devices |
| US8800386B2 (en) | 2008-03-15 | 2014-08-12 | Stryker Corporation | Force sensing sheet |
| US8875331B2 (en) * | 2008-03-15 | 2014-11-04 | Stryker Corporation | Adaptive cushion method and apparatus for minimizing force concentrations on a human body |
| US8533879B1 (en) | 2008-03-15 | 2013-09-17 | Stryker Corporation | Adaptive cushion method and apparatus for minimizing force concentrations on a human body |
| US9414769B2 (en) * | 2008-09-17 | 2016-08-16 | Covidien Lp | Method for determining hemodynamic effects |
| US20130338514A1 (en) * | 2008-09-17 | 2013-12-19 | Covidien Lp | Method for determining hemodynamic effects |
| US20100094144A1 (en) * | 2008-10-10 | 2010-04-15 | Eyal Doron | Systems and methods for determining cardiac output using pulmonary artery pressure measurements |
| US8591423B2 (en) | 2008-10-10 | 2013-11-26 | Cardiac Pacemakers, Inc. | Systems and methods for determining cardiac output using pulmonary artery pressure measurements |
| US8632470B2 (en) | 2008-11-19 | 2014-01-21 | Cardiac Pacemakers, Inc. | Assessment of pulmonary vascular resistance via pulmonary artery pressure |
| US20100125211A1 (en) * | 2008-11-19 | 2010-05-20 | Stahmann Jeffrey E | Assessment of pulmonary vascular resistance via pulmonary artery pressure |
| US8161826B1 (en) | 2009-03-05 | 2012-04-24 | Stryker Corporation | Elastically stretchable fabric force sensor arrays and methods of making |
| US8661915B2 (en) | 2009-03-05 | 2014-03-04 | Stryker Corporation | Elastically stretchable fabric force sensor arrays and methods of making |
| US9237862B2 (en) * | 2009-03-10 | 2016-01-19 | Koninklijle Philips N.V. | Diagnosis of asthma |
| WO2010103435A1 (en) * | 2009-03-10 | 2010-09-16 | Koninklijke Philips Electronics N.V. | Diagnosis of asthma |
| US20120089042A1 (en) * | 2009-03-10 | 2012-04-12 | Koninklijke Philips Electronics N.V. | Diagnosis of asthma |
| US20100324378A1 (en) * | 2009-06-17 | 2010-12-23 | Tran Binh C | Physiologic signal monitoring using ultrasound signals from implanted devices |
| US20140288442A1 (en) * | 2010-02-25 | 2014-09-25 | Tonino Bombardini | Method and apparatus for quantification and monitoring of cardiovascular function during induced stress or physical activity and at rest |
| US9763767B2 (en) | 2010-10-13 | 2017-09-19 | Michael T. Abramson | System and method for alleviating sleep apnea |
| US8844537B1 (en) | 2010-10-13 | 2014-09-30 | Michael T. Abramson | System and method for alleviating sleep apnea |
| US9603534B2 (en) | 2012-02-13 | 2017-03-28 | Cardio Scale Ltd. | Method and system for estimating momentary cardiovascular performance reserve |
| US9402573B2 (en) | 2012-08-22 | 2016-08-02 | Covidien Lp | System and method for detecting fluid responsiveness of a patient |
| US9060745B2 (en) | 2012-08-22 | 2015-06-23 | Covidien Lp | System and method for detecting fluid responsiveness of a patient |
| US20150289785A1 (en) * | 2012-08-30 | 2015-10-15 | Diasens D.O.O. | Apparatus and Method for Monitoring Respiration Volumes and Synchronization of Triggering in Mechanical Ventilation by Measuring the Local Curvature of the Torso Surface |
| US8731649B2 (en) | 2012-08-30 | 2014-05-20 | Covidien Lp | Systems and methods for analyzing changes in cardiac output |
| US9357937B2 (en) | 2012-09-06 | 2016-06-07 | Covidien Lp | System and method for determining stroke volume of an individual |
| US9241646B2 (en) | 2012-09-11 | 2016-01-26 | Covidien Lp | System and method for determining stroke volume of a patient |
| US11445930B2 (en) | 2012-09-11 | 2022-09-20 | Covidien Lp | System and method for determining stroke volume of a patient |
| US10448851B2 (en) | 2012-09-11 | 2019-10-22 | Covidien Lp | System and method for determining stroke volume of a patient |
| US11058303B2 (en) | 2012-09-14 | 2021-07-13 | Covidien Lp | System and method for determining stability of cardiac output |
| US8904876B2 (en) | 2012-09-29 | 2014-12-09 | Stryker Corporation | Flexible piezocapacitive and piezoresistive force and pressure sensors |
| US8997588B2 (en) | 2012-09-29 | 2015-04-07 | Stryker Corporation | Force detecting mat with multiple sensor types |
| US8977348B2 (en) | 2012-12-21 | 2015-03-10 | Covidien Lp | Systems and methods for determining cardiac output |
| US9101275B2 (en) | 2013-03-14 | 2015-08-11 | Cardiac Pacemakers, Inc. | Determining systolic time intervals using heart sounds |
| US10390713B2 (en) * | 2013-03-15 | 2019-08-27 | Ghassan S. Kassab | Methods for the non-invasive determination of heart and pulmonary pressures |
| US20140275961A1 (en) * | 2013-03-15 | 2014-09-18 | Ghassan S. Kassab | Methods for the non-invasive determination of heart and pulmonary pressures |
| US10182727B2 (en) * | 2013-11-28 | 2019-01-22 | Western Sydney University | Monitoring pneumocardial function |
| AU2014354582B2 (en) * | 2013-11-28 | 2019-03-21 | Western Sydney University | "Monitoring pneumocardial function" |
| US20170000357A1 (en) * | 2013-11-28 | 2017-01-05 | University Of Western Sydney | Monitoring pneumocardial function |
| US10514662B1 (en) | 2015-01-22 | 2019-12-24 | Vapotherm, Inc. | Oxygen mixing and delivery |
| US11853084B1 (en) | 2015-01-22 | 2023-12-26 | Vapotherm, Inc. | Oxygen mixing and delivery |
| US11092984B1 (en) | 2015-01-22 | 2021-08-17 | Vapotherm, Inc. | Oxygen mixing and delivery |
| FR3040283A1 (en) * | 2015-08-28 | 2017-03-03 | Univ Joseph Fourier - Grenoble 1 | DEVICE AND METHOD FOR NON-INVASIVE MEASUREMENT OF SUB-DIAPHRAGMATIC AORTIC FLOW IN A SMALL LAB MAMMAL |
| WO2017037369A1 (en) * | 2015-08-28 | 2017-03-09 | Universite Grenoble Alpes | Device and method for non-invasive measurement of subdiaphragmatic aortic flow in a small laboratory mammal |
| WO2017100188A3 (en) * | 2015-12-07 | 2017-07-27 | Medici Technologies, LLC | Methods and apparatuses for assessment and management of hemodynamic status |
| US11363956B2 (en) | 2015-12-07 | 2022-06-21 | Medici Technologies Llc | Methods and apparatuses for assessment and management of hemodynamic status |
| US11045105B2 (en) * | 2016-05-03 | 2021-06-29 | Maquet Critical Care Ab | Determination of cardiac output or effective pulmonary blood flow during mechanical ventilation |
| US20190142284A1 (en) * | 2016-05-03 | 2019-05-16 | Maquet Critical Care Ab | Determination of cardiac output or effective pulmonary blood flow during mechanical ventilation |
| US11717182B2 (en) | 2017-08-25 | 2023-08-08 | Mayo Foundation For Medical Education And Research | Abdominal measurement apparatuses and related methods |
| US10993672B2 (en) | 2017-12-31 | 2021-05-04 | Msheaf Health Management Technologies Limited | Non-invasive method and system to extract characteristic information of bio-tissues |
| CN113226170A (en) * | 2019-05-20 | 2021-08-06 | 深圳市大耳马科技有限公司 | Method, device and system for assessing diastolic function |
| WO2020232604A1 (en) * | 2019-05-20 | 2020-11-26 | 深圳市大耳马科技有限公司 | Cardiac diastolic function assessment method, device, and system |
| CN113226170B (en) * | 2019-05-20 | 2024-03-08 | 深圳市大耳马科技有限公司 | Diastolic function evaluation method, diastolic function evaluation equipment and diastolic function evaluation system |
| US11779720B2 (en) | 2019-11-04 | 2023-10-10 | Vapotherm, Inc. | Methods, devices, and systems for improved oxygenation patient monitoring, mixing, and delivery |
| US11612706B2 (en) | 2019-11-25 | 2023-03-28 | John C. Taube | Methods, systems, and devices for controlling mechanical ventilation |
| WO2022026997A1 (en) * | 2020-07-28 | 2022-02-03 | Regents Of The University Of Minnesota | Wearable ambulatory sensors for measurement of breathing motions |
Similar Documents
| Publication | Publication Date | Title |
|---|---|---|
| US5178151A (en) | System for non-invasive detection of changes of cardiac volumes and aortic pulses | |
| AU648503B2 (en) | Non-invasive cardiac function measurement | |
| CA2294998C (en) | Noninvasive monitoring of cardiac performance | |
| US7904141B2 (en) | System and apparatus for determining the left-ventricular ejection time TLVE of a heart of a subject | |
| JP5006373B2 (en) | Non-invasive system for monitoring cardiac parameters | |
| US6186955B1 (en) | Noninvasive continuous cardiac output monitor | |
| US5181517A (en) | Method and apparatus for the measurement of atrial pressure | |
| Hill et al. | Left ventricular ejection and the Heather index measured by non‐invasive methods during postural changes in man | |
| Porter et al. | Measurement of cardiac output by electrical impedance plethysmography | |
| Sackner et al. | Thoracocardiography: Part 1: Noninvasive measurement of changes in stroke volume comparisons to thermodilution | |
| US20050203429A1 (en) | Device and method for measuring cardiac function | |
| ORIHASHI et al. | Intraoperative assessment of pulmonary vein flow | |
| Bloch et al. | Thoracocardiographic-derived left ventricular systolic time intervals | |
| JP3289898B2 (en) | Method and apparatus for measuring atrial pressure | |
| AU665747B2 (en) | Method and apparatus for the measurement of atrial pressure | |
| Chong | Application of serologic diagnosis of tsutsugamushi disease (scrub typhus) in Korea where the disease was recently recognized to be endemic | |
| Van Dijk et al. | The intra-and inter-operator variability of Echo-Doppler measurements for noninvasive pulmonary arterial pressure determination in congenital heart disease | |
| WO1993000037A1 (en) | Method and apparatus for the measurement of atrial pressure | |
| Kaltenbach et al. | Cardiovascular testing | |
| Dehkordi et al. | Comparison of Wearable Methods for Estimating Cardiac Timings: A Comprehensive Multimodal Echocardiography Investigation | |
| Al-Shamma et al. | THE EFFECT OF DEEP INSPIRATION AND FORCED EXPIRATTION ON DOPPLER RANSMITRAL FLOW, CARDIAC OUTPUT | |
| Raessler | Non-invasive cardiac monitoring |
Legal Events
| Date | Code | Title | Description |
|---|---|---|---|
| STCF | Information on status: patent grant |
Free format text: PATENTED CASE |
|
| FPAY | Fee payment |
Year of fee payment: 4 |
|
| FPAY | Fee payment |
Year of fee payment: 8 |
|
| AS | Assignment |
Owner name: NON-INVASIVE MONITORING SYSTEMS, INC., FLORIDA Free format text: ASSIGNMENT OF ASSIGNORS INTEREST;ASSIGNOR:SACKNER, MARVIN A.;REEL/FRAME:010984/0482 Effective date: 20000721 |
|
| AS | Assignment |
Owner name: VIVOMETRICS, INC., CALIFORNIA Free format text: CHANGE OF NAME;ASSIGNOR:LIFESHIRT.COM, INC.;REEL/FRAME:012495/0454 Effective date: 20000928 |
|
| AS | Assignment |
Owner name: LIFESHIRT.COM, INC., CALIFORNIA Free format text: ASSIGNMENT OF ASSIGNORS INTEREST;ASSIGNOR:NON-INVASIVE MONITORING SYSTEMS, INC.;REEL/FRAME:013258/0357 Effective date: 20000814 Owner name: VIVOMETRICS, INC., CALIFORNIA Free format text: CHANGE OF NAME;ASSIGNOR:LIFESHIRT.COM, INC.;REEL/FRAME:013258/0345 Effective date: 20000828 |
|
| REMI | Maintenance fee reminder mailed | ||
| FPAY | Fee payment |
Year of fee payment: 12 |
|
| SULP | Surcharge for late payment |
Year of fee payment: 11 |