US4771467A - Method of identification of arborescent structures in digital images and its application to an image-processing device - Google Patents
Method of identification of arborescent structures in digital images and its application to an image-processing device Download PDFInfo
- Publication number
- US4771467A US4771467A US06/937,618 US93761886A US4771467A US 4771467 A US4771467 A US 4771467A US 93761886 A US93761886 A US 93761886A US 4771467 A US4771467 A US 4771467A
- Authority
- US
- United States
- Prior art keywords
- tree
- sub
- trees
- label
- model
- Prior art date
- Legal status (The legal status is an assumption and is not a legal conclusion. Google has not performed a legal analysis and makes no representation as to the accuracy of the status listed.)
- Expired - Lifetime
Links
Images


Classifications
-
- G—PHYSICS
- G06—COMPUTING; CALCULATING OR COUNTING
- G06V—IMAGE OR VIDEO RECOGNITION OR UNDERSTANDING
- G06V30/00—Character recognition; Recognising digital ink; Document-oriented image-based pattern recognition
- G06V30/10—Character recognition
- G06V30/19—Recognition using electronic means
- G06V30/196—Recognition using electronic means using sequential comparisons of the image signals with a plurality of references
- G06V30/1983—Syntactic or structural pattern recognition, e.g. symbolic string recognition
- G06V30/1988—Graph matching
Definitions
- This invention relates to the field of recognition of shapes in images and more particularly to the identification of arborescent structures.
- the invention finds an application in the processing of digital images, especially in the medical field, for example for identification of blood vessels in images obtained by digital angiography.
- the invention has for its object a method of identification of arborescent structures in digital images.
- the data detected in the image on the one hand and the model data on the other hand must be represented conventionally in the same manner by a set of data which characterizes an arborescent structure.
- the method in accordance with the invention utilizes this method for finding a minimum distance between two trees, then determines the path which leads to this minimum distance in order to achieve the final result of identification between the object arborescent structure and the model with which it is sought to identify said structure.
- the invention is also concerned with the use of said method in a digital image processing device for such applications as recognition of blood vessels in images obtained by digital angiography.
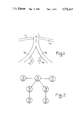
- FIG. 1 illustrates one example of a model tree.
- FIG. 2 is a relational diagram between the branches of the tree shown in FIG. 1.
- FIG. 3 illustrates one example of an object tree detected in a digital image.
- FIG. 4 is a relational diagram between the branches of the object tree shown in FIG. 3.
- FIGS. 5 to 12 are tables illustrating the computation of the distance between two trees.
- a tree structure is defined by a root which is, for example, the portion between two quasi-parallel lines which has the greatest width, and by branches also formed by quasi-parallel pairs of lines joined to the root itself or to other branches by means of arcs, each branch being the sub-tree root.
- each branch of a tree is characterized by a so-called label vector, the components of which are characteristic parameters.
- each branch represents one blood vessel for which the label vector may include components such as the width, the length and the shape of the vessel considered with which the term vessel is also associated.
- the data extracted from the digital image are structured in the same manner by detection followed by parameterization of contours in the image, detection of branches by recognition of quasi-parallel lines in the image followed by formation of the relational diagram between the branches, each branch being represented by a label vector, the components of which have the same structure as those of the model tree.
- the label of the root of T (b 1 in the example given above) is denoted by E(T).
- FIG. 2 represents the relations between these branches as they appear in FIG. 1. Each branch is a node in this relational graph.
- E(T') E a .
- FIG. 4 represents a relational diagram between these branches as they appear in FIG. 3: b b , b c , b d and b g are connected to the root b a , b f is connected to b e which is in turn connected to b d , and b h is connected to b g .
- Each branch is a node in this relational graph.
- each tree is defined as being made up of a series of disjoint sub-trees, an order being introduced between said sub-trees: for example, the sub-trees are described in the trigonometric direction, starting from the root to which a direction is given.
- T i is the sub-tree of T of order i.
- a tree T can be converted to a tree T* by a change in label as follows: the label of its root E(T) is replaced by the label of the root of T*, E(T*); the list of sub-trees of T* is the same as the list of sub-trees of T.
- a sub-tree in the descriptive list of a tree: a sub-tree can be inserted in an ordered descriptive list of sub-trees of a tree T at a given row in order to form a modified tree T*.
- E(T*) E(T)
- the value assigned to a branch can be a combination of components of the label vector of this branch.
- the most simple example consists in taking one of the components of the label vector such as, for example, the width of the branches.
- this cost can be the difference between the widths in the case of sub-trees reduced to branches.
- the cost of destruction of one sub-tree A is equal to the sum of costs of destruction of the constituent sub-trees of the sub-tree A.
- this cost (as is the case with the insertion cost) can be a value assigned to said branch, namely the width, for example.
- Measurement of the distance between two trees A and B is then obtained by means of a recursive procedure as described by the Selkow algorithm indicated above which assigns a global cost to the transformation series which are possible for transforming the tree A into the other tree B.
- These transformation series take place in a sequence of elementary operations to which an elementary cost is assigned in each case.
- the minimum distance d(A,B) between the two trees labelled A and B will be the global cost of the least costly method of transforming the departure tree to the arrival tree. This cost takes into account both the modifications of structures, insertions and suppressions of sub-trees and modifications of labels.
- T(i) is the tree obtained by removing from a tree T the sub-trees from the order i+1 to the last on the list.
- T m is the last sub-tree of the descriptive list of T
- This computation is recursive since it is necessary to compute d(Ai, Bj) in order to compute d(A(i), B(j)), Ai and Bj being trees themselves.
- FIGS. 5 and 6 represent another example respectively of a model tree and of an object tree to be identified therewith.
- a branch is denoted between brackets in the nodes shown in FIGS. 5 and 6 under the label of the branch which is denoted solely by its index a to g in the model tree and 1 to 6 in the data tree.
- the solution is given in a series of tables in FIGS. 7 to 12.
- the table TAB 0 serves to compute the distances between the sub-trees of the first lists.
- FIG. 7 represents the first table which illustrates the solution: TAB 0 .
- the inputs of this table are in horizontal rows, the list of sub-trees of T is given horizontally and the list of sub-trees of T' is provided in a vertical column.
- each sub-tree there has been computed a value equal to the sum of values of the branches and indicated under the corresponding sub-tree; these values are circled.
- the other computations are performed in the third step by employing in some cases the necessary intermediate computations which are apparent from the following tables.
- the table TAB 1 given in FIG. 8 serves to compute the minimum distance between T 1 and T' 1 , namely 15;
- the table TAB 2 given in FIG. 9 serves to compute the distance between T 2 and T' 1 , namely 42;
- the table TAB 3 given in FIG. 10 illustrates the computation of the distance between T 1 and T' 2 , namely 41;
- FIG. 11 illustrates the computation of the minimum distance between T' 3 and T' 1 , namely 19; and the table TAB 5 of between T 3 and T' 1 , namely 19; and the table TAB 5 of FIG. 12 illustrates the computation of the distance between T 3 and T' 2 , namely 13; the distance between T 2 and T' 2 is obtained immediately by reason of the fact that the two sub-trees are reduced to their roots by the difference in values (20+10), namely 10.
- These values which are underlined in table TAB 0 are then employed for final computation of the minimum distance between the trees T' and T as illustrated in table TAB 0 of FIG. 7.
- the minimum distance thus obtained is 48 in the example illustrated in FIGS. 5 to 12.
- each cost obtained in one computational step as shown in the corresponding square carries an arrow which indicates the choices made at each stage when performing tests on the minimum costs, or the origin of the value adopted as an initial value for cost computation when there has not been any choice.
- the method for finding a pathway to the minimum distance consists in following the path in the direction of the arrows which interconnect the costs.
- this gives the following associations obtained by reading the table TAB 0 :
- T' 1 T 1 ; cost: 15 (complex cost)
- T' 0 T 0 ; cost 10 (by a change of label).
- Angiography is a radiological technique for visual display of blood vessels, the principle of which is as follows: a contrast-enhancing product is injected into a vessel and radiographs of the region of the body to be examined are taken at uniform intervals of time. The sequence of images obtained by subtraction from a reference image taken prior to injection of the contrast product produces the image of the vessels and provides indications in regard to the rate of propagation of the contrast product within said vessels.
- This examination is employed for detecting pathologies and mainly stenoses (obstruction) or aneurysms (dilation) of blood vessels.
- a first step consists in automatic identification of the blood vessels with respect to an anatomic model of the circulatory system in the examination region under consideration.
- the blood-vessel system has a natural three-dimensional tree structure. If the largest artery is taken as a root, it then subdivides into smaller vessels, and so on in sequence.
- the angiographic image corresponds to the projection of this structure on a plane. In the case of one and the same region, the images obtained can be very different according to the orientation of this visualization plane. Consideration will therefore be given to a different model for each type of angiography (region of interest and angle of visualization). These models are supplied by practitioners.
- the model in the form of a tree for application of the method is constituted as follows:
- the largest artery corresponds to the root of the tree and the vessels which extend therefrom are the branches.
- the branches are joined to the root by an arc and are in turn roots of the sub-trees formed by their tributary vessels.
- each branch of the tree is labelled by a set of parameters which are characteristic of the vessel which it represents.
- This label is in fact a vector constituted by a certain number of components such as width, length, shape and so on, together with the name of the vessel considered.
- step 4 designated earlier as "formation of intervessel relational tree”. It is necessary to determine the connections between vessels and the direction of these connections and to remove the different uncertainties (crossing or junction, direction).
- the insertion or destruction costs are equal to the vessel width and the substitution cost is equal to the absolute value of the difference in widths of the two vessels considered.
- test image of the type shown in FIG. 3 has been chosen. This image exhibits a large number of vessels and therefore provides a fairly complete tree. Moreover, parasitic segments and holes in the contours have been introduced for closer approximation to a real case.
- the model selected for the matching operation corresponds to the tree shown in FIG. 2.
- a possible representation is given in FIG. 1.
- the selected model was rather different from the data: the branch b 7 of the model does not appear in the data; the branches b c and b f of the data do not appear in the model.
- the invention is not limited to the method as described in detail in the foregoing or to its application to angiographic digital images.
Abstract
Description
Claims (3)
Applications Claiming Priority (2)
| Application Number | Priority Date | Filing Date | Title |
|---|---|---|---|
| FR8517946A FR2591005B1 (en) | 1985-12-04 | 1985-12-04 | METHOD FOR IDENTIFYING A TREE STRUCTURE IN DIGITAL IMAGES AND ITS APPLICATION TO AN IMAGE PROCESSING DEVICE |
| FR8517946 | 1985-12-04 |
Publications (1)
| Publication Number | Publication Date |
|---|---|
| US4771467A true US4771467A (en) | 1988-09-13 |
Family
ID=9325437
Family Applications (1)
| Application Number | Title | Priority Date | Filing Date |
|---|---|---|---|
| US06/937,618 Expired - Lifetime US4771467A (en) | 1985-12-04 | 1986-12-03 | Method of identification of arborescent structures in digital images and its application to an image-processing device |
Country Status (4)
| Country | Link |
|---|---|
| US (1) | US4771467A (en) |
| EP (1) | EP0226507B1 (en) |
| DE (1) | DE3674743D1 (en) |
| FR (1) | FR2591005B1 (en) |
Cited By (19)
| Publication number | Priority date | Publication date | Assignee | Title |
|---|---|---|---|---|
| US5166876A (en) * | 1991-01-16 | 1992-11-24 | General Electric Company | System and method for detecting internal structures contained within the interior region of a solid object |
| US5175773A (en) * | 1988-09-13 | 1992-12-29 | General Electric Cgr S.A. | Method of three-dimensional reconstruction of arborescence by labeling |
| US5263117A (en) * | 1989-10-26 | 1993-11-16 | International Business Machines Corporation | Method and apparatus for finding the best splits in a decision tree for a language model for a speech recognizer |
| US5500907A (en) * | 1991-06-25 | 1996-03-19 | Fuji Xerox Co., Ltd. | Image signal analyzing system |
| US5915036A (en) * | 1994-08-29 | 1999-06-22 | Eskofot A/S | Method of estimation |
| US6173068B1 (en) * | 1996-07-29 | 2001-01-09 | Mikos, Ltd. | Method and apparatus for recognizing and classifying individuals based on minutiae |
| WO2001059707A1 (en) * | 2000-02-11 | 2001-08-16 | The Government Of The United States Of America, As Represented By The Secretary, Dept. Of Health And Human Services | Vessel delineation in magnetic resonance angiographic images |
| US6400996B1 (en) | 1999-02-01 | 2002-06-04 | Steven M. Hoffberg | Adaptive pattern recognition based control system and method |
| US6418424B1 (en) | 1991-12-23 | 2002-07-09 | Steven M. Hoffberg | Ergonomic man-machine interface incorporating adaptive pattern recognition based control system |
| US6478735B1 (en) * | 1999-01-28 | 2002-11-12 | The United States Of America As Represented By The Administrator Of The National Aeronautics And Space Administration | Physiological feedback method and system |
| US20040258296A1 (en) * | 2001-10-16 | 2004-12-23 | Johannes Bruijns | Method for automatic branch labelling |
| US20050256400A1 (en) * | 2003-12-03 | 2005-11-17 | Bhargav Raman | Method to identify arterial and venous vessels |
| US20060211940A1 (en) * | 2004-10-01 | 2006-09-21 | Marco Antonelli | Blood vessel structure segmentation system and method |
| US7242988B1 (en) | 1991-12-23 | 2007-07-10 | Linda Irene Hoffberg | Adaptive pattern recognition based controller apparatus and method and human-factored interface therefore |
| US7974714B2 (en) | 1999-10-05 | 2011-07-05 | Steven Mark Hoffberg | Intelligent electronic appliance system and method |
| US8046313B2 (en) | 1991-12-23 | 2011-10-25 | Hoffberg Steven M | Ergonomic man-machine interface incorporating adaptive pattern recognition based control system |
| US8369967B2 (en) | 1999-02-01 | 2013-02-05 | Hoffberg Steven M | Alarm system controller and a method for controlling an alarm system |
| US8892495B2 (en) | 1991-12-23 | 2014-11-18 | Blanding Hovenweep, Llc | Adaptive pattern recognition based controller apparatus and method and human-interface therefore |
| US10361802B1 (en) | 1999-02-01 | 2019-07-23 | Blanding Hovenweep, Llc | Adaptive pattern recognition based control system and method |
Families Citing this family (1)
| Publication number | Priority date | Publication date | Assignee | Title |
|---|---|---|---|---|
| FR2683925B1 (en) * | 1991-11-15 | 1996-08-30 | Thomson Csf | PROCESS FOR MATCHING GRAPHS ASSOCIATED WITH PHYSICAL ENTITIES AND ITS APPLICATIONS TO RECORDING OF IMAGES AND TO RECOGNITION OF SHAPES. |
Citations (1)
| Publication number | Priority date | Publication date | Assignee | Title |
|---|---|---|---|---|
| US4499596A (en) * | 1982-06-28 | 1985-02-12 | International Business Machines Corporation | Adaptive facsimile compression using a dynamic extendable decision network |
-
1985
- 1985-12-04 FR FR8517946A patent/FR2591005B1/en not_active Expired
-
1986
- 1986-12-02 DE DE8686402673T patent/DE3674743D1/en not_active Expired - Fee Related
- 1986-12-02 EP EP86402673A patent/EP0226507B1/en not_active Expired - Lifetime
- 1986-12-03 US US06/937,618 patent/US4771467A/en not_active Expired - Lifetime
Patent Citations (1)
| Publication number | Priority date | Publication date | Assignee | Title |
|---|---|---|---|---|
| US4499596A (en) * | 1982-06-28 | 1985-02-12 | International Business Machines Corporation | Adaptive facsimile compression using a dynamic extendable decision network |
Non-Patent Citations (4)
| Title |
|---|
| IEEE Transactions on Pattern Analysis and Machine Intelligence, vol. PAMI 7, No. 3, May 1985; pp. 299 305. * |
| IEEE Transactions on Pattern Analysis and Machine Intelligence, vol. PAMI-7, No. 3, May 1985; pp. 299-305. |
| Information Processing Letter, vol. 6, No. 6; Dec. 1977; pp. 184 186. * |
| Information Processing Letter, vol. 6, No. 6; Dec. 1977; pp. 184-186. |
Cited By (25)
| Publication number | Priority date | Publication date | Assignee | Title |
|---|---|---|---|---|
| US5175773A (en) * | 1988-09-13 | 1992-12-29 | General Electric Cgr S.A. | Method of three-dimensional reconstruction of arborescence by labeling |
| US5263117A (en) * | 1989-10-26 | 1993-11-16 | International Business Machines Corporation | Method and apparatus for finding the best splits in a decision tree for a language model for a speech recognizer |
| US5166876A (en) * | 1991-01-16 | 1992-11-24 | General Electric Company | System and method for detecting internal structures contained within the interior region of a solid object |
| US5500907A (en) * | 1991-06-25 | 1996-03-19 | Fuji Xerox Co., Ltd. | Image signal analyzing system |
| US6418424B1 (en) | 1991-12-23 | 2002-07-09 | Steven M. Hoffberg | Ergonomic man-machine interface incorporating adaptive pattern recognition based control system |
| US8046313B2 (en) | 1991-12-23 | 2011-10-25 | Hoffberg Steven M | Ergonomic man-machine interface incorporating adaptive pattern recognition based control system |
| US7242988B1 (en) | 1991-12-23 | 2007-07-10 | Linda Irene Hoffberg | Adaptive pattern recognition based controller apparatus and method and human-factored interface therefore |
| US8892495B2 (en) | 1991-12-23 | 2014-11-18 | Blanding Hovenweep, Llc | Adaptive pattern recognition based controller apparatus and method and human-interface therefore |
| US5915036A (en) * | 1994-08-29 | 1999-06-22 | Eskofot A/S | Method of estimation |
| US6173068B1 (en) * | 1996-07-29 | 2001-01-09 | Mikos, Ltd. | Method and apparatus for recognizing and classifying individuals based on minutiae |
| US6478735B1 (en) * | 1999-01-28 | 2002-11-12 | The United States Of America As Represented By The Administrator Of The National Aeronautics And Space Administration | Physiological feedback method and system |
| US10361802B1 (en) | 1999-02-01 | 2019-07-23 | Blanding Hovenweep, Llc | Adaptive pattern recognition based control system and method |
| US6640145B2 (en) | 1999-02-01 | 2003-10-28 | Steven Hoffberg | Media recording device with packet data interface |
| US9535563B2 (en) | 1999-02-01 | 2017-01-03 | Blanding Hovenweep, Llc | Internet appliance system and method |
| US6400996B1 (en) | 1999-02-01 | 2002-06-04 | Steven M. Hoffberg | Adaptive pattern recognition based control system and method |
| US8583263B2 (en) | 1999-02-01 | 2013-11-12 | Steven M. Hoffberg | Internet appliance system and method |
| US8369967B2 (en) | 1999-02-01 | 2013-02-05 | Hoffberg Steven M | Alarm system controller and a method for controlling an alarm system |
| US7974714B2 (en) | 1999-10-05 | 2011-07-05 | Steven Mark Hoffberg | Intelligent electronic appliance system and method |
| WO2001059707A1 (en) * | 2000-02-11 | 2001-08-16 | The Government Of The United States Of America, As Represented By The Secretary, Dept. Of Health And Human Services | Vessel delineation in magnetic resonance angiographic images |
| US7003144B2 (en) | 2000-02-11 | 2006-02-21 | The United States Of America As Represented By The Department Of Health And Human Services | Vessel delineation in magnetic resonance angiographic images |
| US20030031351A1 (en) * | 2000-02-11 | 2003-02-13 | Yim Peter J. | Vessel delineation in magnetic resonance angiographic images |
| US7372983B2 (en) * | 2001-10-16 | 2008-05-13 | Koninklijke Philips Electronics N.V. | Method for automatic branch labeling |
| US20040258296A1 (en) * | 2001-10-16 | 2004-12-23 | Johannes Bruijns | Method for automatic branch labelling |
| US20050256400A1 (en) * | 2003-12-03 | 2005-11-17 | Bhargav Raman | Method to identify arterial and venous vessels |
| US20060211940A1 (en) * | 2004-10-01 | 2006-09-21 | Marco Antonelli | Blood vessel structure segmentation system and method |
Also Published As
| Publication number | Publication date |
|---|---|
| FR2591005A1 (en) | 1987-06-05 |
| EP0226507B1 (en) | 1990-10-03 |
| EP0226507A1 (en) | 1987-06-24 |
| DE3674743D1 (en) | 1990-11-08 |
| FR2591005B1 (en) | 1988-01-08 |
Similar Documents
| Publication | Publication Date | Title |
|---|---|---|
| US4771467A (en) | Method of identification of arborescent structures in digital images and its application to an image-processing device | |
| Haris et al. | Model-based morphological segmentation and labeling of coronary angiograms | |
| CN110298844B (en) | X-ray radiography image blood vessel segmentation and identification method and device | |
| CN112884826B (en) | Method and device for extracting center line of blood vessel | |
| CN109770930B (en) | Method and device for determining coronary artery microcirculation resistance | |
| JP2010075693A (en) | Method and apparatus for classification of coronary artery image data | |
| US9189866B2 (en) | Vascular tree from anatomical landmarks and a clinical ontology | |
| Smets et al. | A knowledge-based system for the delineation of blood vessels on subtraction angiograms | |
| CN110189258B (en) | Arteria carotis lumen and tube wall automatic division method based on the multi-modal sequence of MRI | |
| WO2007089938A2 (en) | Method for segmenting arteries and veins | |
| KR102562317B1 (en) | Method and apparatus for processing vascular image automatically | |
| CN111932497B (en) | Coronary artery identification method and device | |
| CN114943682A (en) | Method and device for detecting anatomical key points in three-dimensional angiography image | |
| CN109816650A (en) | A kind of target area recognition methods and its system based on two-dimentional DSA image | |
| Kaftan et al. | A novel multipurpose tree and path matching algorithm with application to airway trees | |
| CN113313715A (en) | Method, device, apparatus and medium for segmenting cardiac artery blood vessel | |
| US20060176306A1 (en) | Graph extraction labelling and visualization | |
| Ritchings et al. | Detection of abnormalities on carotid angiograms using syntactic techniques | |
| US4843629A (en) | Method of locating pairs of curved parallel lines in an image | |
| Zhao et al. | Quantitation of vascular morphology by directed graph construction | |
| CN115409859A (en) | Coronary artery blood vessel image segmentation method and device, storage medium and terminal | |
| KR102399510B1 (en) | Method and apparatus for processing vascular image based on user input | |
| Ogiela et al. | Semantic-oriented syntactic algorithms for content recognition and understanding of images in medical databases | |
| CN113487616B (en) | Method for constructing complete structure vascular tree structure by using continuous multi-frame images | |
| Haris et al. | Coronary arterial tree extraction based on artery tracking and mathematical morphology |
Legal Events
| Date | Code | Title | Description |
|---|---|---|---|
| AS | Assignment |
Owner name: THOMSON-CGR, 13, SQUARE MAX HYMANS 75015, PARIS, F Free format text: ASSIGNMENT OF ASSIGNORS INTEREST.;ASSIGNORS:CATROS, JEAN Y.;MISCHLER, DENIS;REEL/FRAME:004639/0547 Effective date: 19861120 Owner name: THOMSON-CGR,FRANCE Free format text: ASSIGNMENT OF ASSIGNORS INTEREST;ASSIGNORS:CATROS, JEAN Y.;MISCHLER, DENIS;REEL/FRAME:004639/0547 Effective date: 19861120 |
|
| STCF | Information on status: patent grant |
Free format text: PATENTED CASE |
|
| FEPP | Fee payment procedure |
Free format text: PAYOR NUMBER ASSIGNED (ORIGINAL EVENT CODE: ASPN); ENTITY STATUS OF PATENT OWNER: LARGE ENTITY |
|
| FPAY | Fee payment |
Year of fee payment: 4 |
|
| REMI | Maintenance fee reminder mailed | ||
| FEPP | Fee payment procedure |
Free format text: PAYER NUMBER DE-ASSIGNED (ORIGINAL EVENT CODE: RMPN); ENTITY STATUS OF PATENT OWNER: LARGE ENTITY |
|
| FPAY | Fee payment |
Year of fee payment: 8 |
|
| FEPP | Fee payment procedure |
Free format text: PAYOR NUMBER ASSIGNED (ORIGINAL EVENT CODE: ASPN); ENTITY STATUS OF PATENT OWNER: LARGE ENTITY |
|
| FPAY | Fee payment |
Year of fee payment: 12 |