US20090127454A1 - Biomarkers useful for diagnosing prostate cancer, and methods thereof - Google Patents
Biomarkers useful for diagnosing prostate cancer, and methods thereof Download PDFInfo
- Publication number
- US20090127454A1 US20090127454A1 US12/294,215 US29421507A US2009127454A1 US 20090127454 A1 US20090127454 A1 US 20090127454A1 US 29421507 A US29421507 A US 29421507A US 2009127454 A1 US2009127454 A1 US 2009127454A1
- Authority
- US
- United States
- Prior art keywords
- metabolite
- prostate cancer
- sample
- metabolites
- patient
- Prior art date
- Legal status (The legal status is an assumption and is not a legal conclusion. Google has not performed a legal analysis and makes no representation as to the accuracy of the status listed.)
- Granted
Links
- 208000000236 Prostatic Neoplasms Diseases 0.000 title claims abstract description 180
- 206010060862 Prostate cancer Diseases 0.000 title claims abstract description 175
- 238000000034 method Methods 0.000 title claims abstract description 174
- 239000000090 biomarker Substances 0.000 title description 27
- 239000002207 metabolite Substances 0.000 claims abstract description 271
- 239000000523 sample Substances 0.000 claims description 113
- 238000004885 tandem mass spectrometry Methods 0.000 claims description 100
- 239000012634 fragment Substances 0.000 claims description 77
- 239000003550 marker Substances 0.000 claims description 54
- 239000013074 reference sample Substances 0.000 claims description 39
- 238000002560 therapeutic procedure Methods 0.000 claims description 28
- 150000001875 compounds Chemical class 0.000 claims description 24
- 238000001228 spectrum Methods 0.000 claims description 20
- 238000004895 liquid chromatography mass spectrometry Methods 0.000 claims description 17
- 238000002347 injection Methods 0.000 claims description 16
- 239000007924 injection Substances 0.000 claims description 16
- 238000005040 ion trap Methods 0.000 claims description 14
- RYCNUMLMNKHWPZ-SNVBAGLBSA-N 1-acetyl-sn-glycero-3-phosphocholine Chemical class CC(=O)OC[C@@H](O)COP([O-])(=O)OCC[N+](C)(C)C RYCNUMLMNKHWPZ-SNVBAGLBSA-N 0.000 claims description 12
- 230000036541 health Effects 0.000 claims description 12
- 230000003247 decreasing effect Effects 0.000 claims description 10
- 238000004811 liquid chromatography Methods 0.000 claims description 10
- 238000012216 screening Methods 0.000 claims description 8
- 230000003213 activating effect Effects 0.000 claims description 6
- 230000002503 metabolic effect Effects 0.000 claims description 3
- BLHVJAAEHMLMOI-UHFFFAOYSA-N N,N-dimethylethanolamine phosphate Chemical compound CN(C)CCOP(O)(O)=O BLHVJAAEHMLMOI-UHFFFAOYSA-N 0.000 claims description 2
- 210000004369 blood Anatomy 0.000 abstract description 13
- 239000008280 blood Substances 0.000 abstract description 13
- 150000002500 ions Chemical class 0.000 description 46
- 210000002966 serum Anatomy 0.000 description 35
- 238000004458 analytical method Methods 0.000 description 34
- 230000007704 transition Effects 0.000 description 32
- 229910001868 water Inorganic materials 0.000 description 29
- 238000013467 fragmentation Methods 0.000 description 27
- 238000006062 fragmentation reaction Methods 0.000 description 27
- 238000012360 testing method Methods 0.000 description 27
- OKKJLVBELUTLKV-UHFFFAOYSA-N Methanol Chemical compound OC OKKJLVBELUTLKV-UHFFFAOYSA-N 0.000 description 24
- 102000007066 Prostate-Specific Antigen Human genes 0.000 description 22
- 108010072866 Prostate-Specific Antigen Proteins 0.000 description 22
- 206010028980 Neoplasm Diseases 0.000 description 20
- 238000004252 FT/ICR mass spectrometry Methods 0.000 description 18
- 238000001514 detection method Methods 0.000 description 18
- 239000000107 tumor biomarker Substances 0.000 description 18
- 238000003556 assay Methods 0.000 description 17
- 230000000670 limiting effect Effects 0.000 description 17
- 238000001819 mass spectrum Methods 0.000 description 17
- 238000003745 diagnosis Methods 0.000 description 16
- 201000010099 disease Diseases 0.000 description 16
- 208000037265 diseases, disorders, signs and symptoms Diseases 0.000 description 16
- 238000013537 high throughput screening Methods 0.000 description 16
- 230000035945 sensitivity Effects 0.000 description 14
- 238000009826 distribution Methods 0.000 description 13
- 238000005259 measurement Methods 0.000 description 12
- BDAGIHXWWSANSR-UHFFFAOYSA-N methanoic acid Natural products OC=O BDAGIHXWWSANSR-UHFFFAOYSA-N 0.000 description 12
- 201000011510 cancer Diseases 0.000 description 11
- 238000001360 collision-induced dissociation Methods 0.000 description 11
- 239000000284 extract Substances 0.000 description 11
- HZAXFHJVJLSVMW-UHFFFAOYSA-N 2-Aminoethan-1-ol Chemical compound NCCO HZAXFHJVJLSVMW-UHFFFAOYSA-N 0.000 description 10
- 238000005481 NMR spectroscopy Methods 0.000 description 10
- OEYIOHPDSNJKLS-UHFFFAOYSA-N choline Chemical compound C[N+](C)(C)CCO OEYIOHPDSNJKLS-UHFFFAOYSA-N 0.000 description 10
- 238000002405 diagnostic procedure Methods 0.000 description 10
- 238000000065 atmospheric pressure chemical ionisation Methods 0.000 description 9
- 238000002552 multiple reaction monitoring Methods 0.000 description 9
- 210000002307 prostate Anatomy 0.000 description 9
- 239000000126 substance Substances 0.000 description 9
- 238000001574 biopsy Methods 0.000 description 8
- 235000014113 dietary fatty acids Nutrition 0.000 description 8
- 229930195729 fatty acid Natural products 0.000 description 8
- 239000000194 fatty acid Substances 0.000 description 8
- 150000004665 fatty acids Chemical class 0.000 description 8
- 239000007789 gas Substances 0.000 description 8
- 238000004949 mass spectrometry Methods 0.000 description 8
- 150000003384 small molecules Chemical class 0.000 description 8
- GETQZCLCWQTVFV-UHFFFAOYSA-O trimethylammonium Chemical group C[NH+](C)C GETQZCLCWQTVFV-UHFFFAOYSA-O 0.000 description 8
- PPJWCUOWPVSSSW-UHFFFAOYSA-N C=C[N+](C)(C)C Chemical compound C=C[N+](C)(C)C PPJWCUOWPVSSSW-UHFFFAOYSA-N 0.000 description 7
- BLHVJAAEHMLMOI-UHFFFAOYSA-M CN(C)CCOP(=O)([O-])O Chemical compound CN(C)CCOP(=O)([O-])O BLHVJAAEHMLMOI-UHFFFAOYSA-M 0.000 description 7
- UEZVMMHDMIWARA-UHFFFAOYSA-M O=P(=O)[O-] Chemical compound O=P(=O)[O-] UEZVMMHDMIWARA-UHFFFAOYSA-M 0.000 description 7
- LOOIOIUTCVZNDU-HNQUOIGGSA-M O=P([O-])(O)O/C=C/CO Chemical compound O=P([O-])(O)O/C=C/CO LOOIOIUTCVZNDU-HNQUOIGGSA-M 0.000 description 7
- 239000012472 biological sample Substances 0.000 description 7
- 238000012512 characterization method Methods 0.000 description 7
- 238000004128 high performance liquid chromatography Methods 0.000 description 7
- 230000007935 neutral effect Effects 0.000 description 7
- YHHSONZFOIEMCP-UHFFFAOYSA-O phosphocholine Chemical compound C[N+](C)(C)CCOP(O)(O)=O YHHSONZFOIEMCP-UHFFFAOYSA-O 0.000 description 7
- 238000011282 treatment Methods 0.000 description 7
- OSWFIVFLDKOXQC-UHFFFAOYSA-N 4-(3-methoxyphenyl)aniline Chemical compound COC1=CC=CC(C=2C=CC(N)=CC=2)=C1 OSWFIVFLDKOXQC-UHFFFAOYSA-N 0.000 description 6
- WEVYAHXRMPXWCK-UHFFFAOYSA-N Acetonitrile Chemical compound CC#N WEVYAHXRMPXWCK-UHFFFAOYSA-N 0.000 description 6
- RYCNUMLMNKHWPZ-UHFFFAOYSA-O CC(=O)OCC(O)COP(=O)(O)OCC[N+](C)(C)C Chemical compound CC(=O)OCC(O)COP(=O)(O)OCC[N+](C)(C)C RYCNUMLMNKHWPZ-UHFFFAOYSA-O 0.000 description 6
- XJAXPUAAFVAFEA-UHFFFAOYSA-U CC(=O)OCC(O)COP(=O)(O)OCC[N+](C)(C)C.CC(=O)OCC(O)COP(=O)(O)OCC[N+](C)(C)C.CC(=O)OCC(O)COP(=O)(O)OCC[N+](C)(C)C.CC(=O)OCC(O)COP(=O)(O)OCC[N+](C)(C)C.CC(=O)OCC(O)COP(=O)(O)OCC[N+](C)(C)C.CCCCCCCCCCCCCCCC(=O)OCC(O)COP(=O)(O)OCCN(C)C.CCCCCCCCCCCCCCCC(=O)OCC(O)COP(=O)(O)OCC[N+](C)(C)C.CCCCCCCCCCCCCCCCCC(=O)OCC(O)COP(=O)(O)OCC[N+](C)(C)C Chemical compound CC(=O)OCC(O)COP(=O)(O)OCC[N+](C)(C)C.CC(=O)OCC(O)COP(=O)(O)OCC[N+](C)(C)C.CC(=O)OCC(O)COP(=O)(O)OCC[N+](C)(C)C.CC(=O)OCC(O)COP(=O)(O)OCC[N+](C)(C)C.CC(=O)OCC(O)COP(=O)(O)OCC[N+](C)(C)C.CCCCCCCCCCCCCCCC(=O)OCC(O)COP(=O)(O)OCCN(C)C.CCCCCCCCCCCCCCCC(=O)OCC(O)COP(=O)(O)OCC[N+](C)(C)C.CCCCCCCCCCCCCCCCCC(=O)OCC(O)COP(=O)(O)OCC[N+](C)(C)C XJAXPUAAFVAFEA-UHFFFAOYSA-U 0.000 description 6
- DAZXVJBJRMWXJP-UHFFFAOYSA-N CCN(C)C Chemical compound CCN(C)C DAZXVJBJRMWXJP-UHFFFAOYSA-N 0.000 description 6
- KYLYEZUDQSQIRP-UHFFFAOYSA-M CN(C)CCOP(=O)([O-])OCC(O)CO Chemical compound CN(C)CCOP(=O)([O-])OCC(O)CO KYLYEZUDQSQIRP-UHFFFAOYSA-M 0.000 description 6
- 238000000605 extraction Methods 0.000 description 6
- 235000019253 formic acid Nutrition 0.000 description 6
- 239000002904 solvent Substances 0.000 description 6
- YQTVBZHHWNMNKX-UHFFFAOYSA-N C=C=CO Chemical compound C=C=CO YQTVBZHHWNMNKX-UHFFFAOYSA-N 0.000 description 5
- DDTCHENWLYXUKH-UHFFFAOYSA-M CC(O)COP(=O)([O-])OCCN(C)C Chemical compound CC(O)COP(=O)([O-])OCCN(C)C DDTCHENWLYXUKH-UHFFFAOYSA-M 0.000 description 5
- LUTCBIUSZADAEM-HWKANZROSA-M CN(C)CCOP(=O)([O-])OC/C=C/O Chemical compound CN(C)CCOP(=O)([O-])OC/C=C/O LUTCBIUSZADAEM-HWKANZROSA-M 0.000 description 5
- PEDCQBHIVMGVHV-UHFFFAOYSA-N glycerol group Chemical group OCC(O)CO PEDCQBHIVMGVHV-UHFFFAOYSA-N 0.000 description 5
- 230000014759 maintenance of location Effects 0.000 description 5
- 239000000203 mixture Substances 0.000 description 5
- 241000894007 species Species 0.000 description 5
- JMCRDEBJJPRTPV-UPHRSURJSA-M [O-]/C=C\O Chemical compound [O-]/C=C\O JMCRDEBJJPRTPV-UPHRSURJSA-M 0.000 description 4
- 239000006286 aqueous extract Substances 0.000 description 4
- 238000013375 chromatographic separation Methods 0.000 description 4
- 238000000132 electrospray ionisation Methods 0.000 description 4
- 125000005313 fatty acid group Chemical group 0.000 description 4
- 239000007788 liquid Substances 0.000 description 4
- 238000012544 monitoring process Methods 0.000 description 4
- 102000039446 nucleic acids Human genes 0.000 description 4
- 108020004707 nucleic acids Proteins 0.000 description 4
- 150000007523 nucleic acids Chemical class 0.000 description 4
- QIQXTHQIDYTFRH-UHFFFAOYSA-N octadecanoic acid Chemical group CCCCCCCCCCCCCCCCCC(O)=O QIQXTHQIDYTFRH-UHFFFAOYSA-N 0.000 description 4
- 239000012071 phase Substances 0.000 description 4
- WTJKGGKOPKCXLL-RRHRGVEJSA-N phosphatidylcholine Chemical compound CCCCCCCCCCCCCCCC(=O)OC[C@H](COP([O-])(=O)OCC[N+](C)(C)C)OC(=O)CCCCCCCC=CCCCCCCCC WTJKGGKOPKCXLL-RRHRGVEJSA-N 0.000 description 4
- 238000000899 pressurised-fluid extraction Methods 0.000 description 4
- 238000012545 processing Methods 0.000 description 4
- DNXIKVLOVZVMQF-UHFFFAOYSA-N (3beta,16beta,17alpha,18beta,20alpha)-17-hydroxy-11-methoxy-18-[(3,4,5-trimethoxybenzoyl)oxy]-yohimban-16-carboxylic acid, methyl ester Natural products C1C2CN3CCC(C4=CC=C(OC)C=C4N4)=C4C3CC2C(C(=O)OC)C(O)C1OC(=O)C1=CC(OC)=C(OC)C(OC)=C1 DNXIKVLOVZVMQF-UHFFFAOYSA-N 0.000 description 3
- IJGRMHOSHXDMSA-UHFFFAOYSA-N Atomic nitrogen Chemical compound N#N IJGRMHOSHXDMSA-UHFFFAOYSA-N 0.000 description 3
- RTURPKKYZIWERS-UHFFFAOYSA-O C/C=[O+]\P(=O)(O)O Chemical compound C/C=[O+]\P(=O)(O)O RTURPKKYZIWERS-UHFFFAOYSA-O 0.000 description 3
- ASWBNKHCZGQVJV-UHFFFAOYSA-O CCCCCCCCCCCCCCCC(=O)OCC(O)COP(=O)(O)OCC[N+](C)(C)C Chemical compound CCCCCCCCCCCCCCCC(=O)OCC(O)COP(=O)(O)OCC[N+](C)(C)C ASWBNKHCZGQVJV-UHFFFAOYSA-O 0.000 description 3
- SUHOQUVVVLNYQR-UHFFFAOYSA-O C[N+](C)(C)CCOP(=O)(O)OCC(O)CO Chemical compound C[N+](C)(C)CCOP(=O)(O)OCC(O)CO SUHOQUVVVLNYQR-UHFFFAOYSA-O 0.000 description 3
- HMQQONSSEFTCKL-UHFFFAOYSA-N C[N+](C)(C)CCOP(=O)=O Chemical compound C[N+](C)(C)CCOP(=O)=O HMQQONSSEFTCKL-UHFFFAOYSA-N 0.000 description 3
- 206010061818 Disease progression Diseases 0.000 description 3
- 102000004190 Enzymes Human genes 0.000 description 3
- 108090000790 Enzymes Proteins 0.000 description 3
- LFQSCWFLJHTTHZ-UHFFFAOYSA-N Ethanol Chemical compound CCO LFQSCWFLJHTTHZ-UHFFFAOYSA-N 0.000 description 3
- XEKOWRVHYACXOJ-UHFFFAOYSA-N Ethyl acetate Chemical compound CCOC(C)=O XEKOWRVHYACXOJ-UHFFFAOYSA-N 0.000 description 3
- JZNWSCPGTDBMEW-UHFFFAOYSA-N Glycerophosphorylethanolamin Natural products NCCOP(O)(=O)OCC(O)CO JZNWSCPGTDBMEW-UHFFFAOYSA-N 0.000 description 3
- LCQMZZCPPSWADO-UHFFFAOYSA-N Reserpilin Natural products COC(=O)C1COCC2CN3CCc4c([nH]c5cc(OC)c(OC)cc45)C3CC12 LCQMZZCPPSWADO-UHFFFAOYSA-N 0.000 description 3
- QEVHRUUCFGRFIF-SFWBKIHZSA-N Reserpine Natural products O=C(OC)[C@@H]1[C@H](OC)[C@H](OC(=O)c2cc(OC)c(OC)c(OC)c2)C[C@H]2[C@@H]1C[C@H]1N(C2)CCc2c3c([nH]c12)cc(OC)cc3 QEVHRUUCFGRFIF-SFWBKIHZSA-N 0.000 description 3
- YJTHZOLZJDBORU-HSZRJFAPSA-N [(2R)-3-hexadecanoyloxy-2-hydroperoxypropyl] 2-(trimethylazaniumyl)ethyl phosphate Chemical compound CCCCCCCCCCCCCCCC(=O)OC[C@@H](OO)COP([O-])(=O)OCC[N+](C)(C)C YJTHZOLZJDBORU-HSZRJFAPSA-N 0.000 description 3
- 238000009825 accumulation Methods 0.000 description 3
- 238000004364 calculation method Methods 0.000 description 3
- 150000001793 charged compounds Chemical class 0.000 description 3
- 238000006243 chemical reaction Methods 0.000 description 3
- 238000002512 chemotherapy Methods 0.000 description 3
- 229960001231 choline Drugs 0.000 description 3
- 230000034994 death Effects 0.000 description 3
- 231100000517 death Toxicity 0.000 description 3
- 230000007423 decrease Effects 0.000 description 3
- 238000009795 derivation Methods 0.000 description 3
- 238000011161 development Methods 0.000 description 3
- 230000018109 developmental process Effects 0.000 description 3
- 238000010790 dilution Methods 0.000 description 3
- 239000012895 dilution Substances 0.000 description 3
- 230000005750 disease progression Effects 0.000 description 3
- 230000000694 effects Effects 0.000 description 3
- IPCSVZSSVZVIGE-UHFFFAOYSA-N hexadecanoic acid Chemical compound CCCCCCCCCCCCCCCC(O)=O IPCSVZSSVZVIGE-UHFFFAOYSA-N 0.000 description 3
- 125000004435 hydrogen atom Chemical group [H]* 0.000 description 3
- 238000010191 image analysis Methods 0.000 description 3
- 238000002705 metabolomic analysis Methods 0.000 description 3
- VLKZOEOYAKHREP-UHFFFAOYSA-N n-Hexane Chemical compound CCCCCC VLKZOEOYAKHREP-UHFFFAOYSA-N 0.000 description 3
- 239000013610 patient sample Substances 0.000 description 3
- 125000002467 phosphate group Chemical group [H]OP(=O)(O[H])O[*] 0.000 description 3
- 150000003904 phospholipids Chemical class 0.000 description 3
- 230000008569 process Effects 0.000 description 3
- 238000001959 radiotherapy Methods 0.000 description 3
- BJOIZNZVOZKDIG-MDEJGZGSSA-N reserpine Chemical compound O([C@H]1[C@@H]([C@H]([C@H]2C[C@@H]3C4=C([C]5C=CC(OC)=CC5=N4)CCN3C[C@H]2C1)C(=O)OC)OC)C(=O)C1=CC(OC)=C(OC)C(OC)=C1 BJOIZNZVOZKDIG-MDEJGZGSSA-N 0.000 description 3
- 229960003147 reserpine Drugs 0.000 description 3
- MDMGHDFNKNZPAU-UHFFFAOYSA-N roserpine Natural products C1C2CN3CCC(C4=CC=C(OC)C=C4N4)=C4C3CC2C(OC(C)=O)C(OC)C1OC(=O)C1=CC(OC)=C(OC)C(OC)=C1 MDMGHDFNKNZPAU-UHFFFAOYSA-N 0.000 description 3
- 238000000926 separation method Methods 0.000 description 3
- 230000003595 spectral effect Effects 0.000 description 3
- 208000024891 symptom Diseases 0.000 description 3
- 210000001519 tissue Anatomy 0.000 description 3
- XLYOFNOQVPJJNP-UHFFFAOYSA-N water Substances O XLYOFNOQVPJJNP-UHFFFAOYSA-N 0.000 description 3
- MTCFGRXMJLQNBG-REOHCLBHSA-N (2S)-2-Amino-3-hydroxypropansäure Chemical compound OC[C@H](N)C(O)=O MTCFGRXMJLQNBG-REOHCLBHSA-N 0.000 description 2
- ZPDQFUYPBVXUKS-YADHBBJMSA-N 1-stearoyl-sn-glycero-3-phosphoserine Chemical compound CCCCCCCCCCCCCCCCCC(=O)OC[C@@H](O)COP(O)(=O)OC[C@H](N)C(O)=O ZPDQFUYPBVXUKS-YADHBBJMSA-N 0.000 description 2
- SNBUPCHXOGXJFR-HSZRJFAPSA-N 2-aminoethyl [(2r)-2-hydroperoxy-3-octadecoxypropyl] hydrogen phosphate Chemical compound CCCCCCCCCCCCCCCCCCOC[C@@H](OO)COP(O)(=O)OCCN SNBUPCHXOGXJFR-HSZRJFAPSA-N 0.000 description 2
- 206010004446 Benign prostatic hyperplasia Diseases 0.000 description 2
- FKPKQYIXBFBROO-DYTRJAOYSA-O CCCCCCCCCCCCCCCC(=O)O/C=C/COP(=O)(O)OCC[N+](C)(C)C Chemical compound CCCCCCCCCCCCCCCC(=O)O/C=C/COP(=O)(O)OCC[N+](C)(C)C FKPKQYIXBFBROO-DYTRJAOYSA-O 0.000 description 2
- PXQWHFCKRBFTHV-UHFFFAOYSA-M CCCCCCCCCCCCCCCC(=O)OCC(O)COP(=O)([O-])OCCN(C)C Chemical compound CCCCCCCCCCCCCCCC(=O)OCC(O)COP(=O)([O-])OCCN(C)C PXQWHFCKRBFTHV-UHFFFAOYSA-M 0.000 description 2
- NIOYUNMRJMEDGI-UHFFFAOYSA-N CCCCCCCCCCCCCCCC=O Chemical compound CCCCCCCCCCCCCCCC=O NIOYUNMRJMEDGI-UHFFFAOYSA-N 0.000 description 2
- IHNKQIMGVNPMTC-UHFFFAOYSA-O CCCCCCCCCCCCCCCCCC(=O)OCC(O)COP(=O)(O)OCC[N+](C)(C)C Chemical compound CCCCCCCCCCCCCCCCCC(=O)OCC(O)COP(=O)(O)OCC[N+](C)(C)C IHNKQIMGVNPMTC-UHFFFAOYSA-O 0.000 description 2
- VDCPDRMBZHYSDD-UHFFFAOYSA-M CCCCCCCCCCCCCCCCCC(=O)OCC(O)COP(=O)([O-])OCCN(C)C Chemical compound CCCCCCCCCCCCCCCCCC(=O)OCC(O)COP(=O)([O-])OCCN(C)C VDCPDRMBZHYSDD-UHFFFAOYSA-M 0.000 description 2
- 102000012406 Carcinoembryonic Antigen Human genes 0.000 description 2
- 108010022366 Carcinoembryonic Antigen Proteins 0.000 description 2
- RTZKZFJDLAIYFH-UHFFFAOYSA-N Diethyl ether Chemical compound CCOCC RTZKZFJDLAIYFH-UHFFFAOYSA-N 0.000 description 2
- UEEJHVSXFDXPFK-UHFFFAOYSA-N N-dimethylaminoethanol Chemical compound CN(C)CCO UEEJHVSXFDXPFK-UHFFFAOYSA-N 0.000 description 2
- 208000004403 Prostatic Hyperplasia Diseases 0.000 description 2
- MTCFGRXMJLQNBG-UHFFFAOYSA-N Serine Natural products OCC(N)C(O)=O MTCFGRXMJLQNBG-UHFFFAOYSA-N 0.000 description 2
- 238000000692 Student's t-test Methods 0.000 description 2
- CWRILEGKIAOYKP-SSDOTTSWSA-M [(2r)-3-acetyloxy-2-hydroxypropyl] 2-aminoethyl phosphate Chemical compound CC(=O)OC[C@@H](O)COP([O-])(=O)OCCN CWRILEGKIAOYKP-SSDOTTSWSA-M 0.000 description 2
- 239000002253 acid Substances 0.000 description 2
- 239000012223 aqueous fraction Substances 0.000 description 2
- 239000011324 bead Substances 0.000 description 2
- 229960002887 deanol Drugs 0.000 description 2
- 239000012470 diluted sample Substances 0.000 description 2
- 239000012972 dimethylethanolamine Substances 0.000 description 2
- 239000012154 double-distilled water Substances 0.000 description 2
- 238000005516 engineering process Methods 0.000 description 2
- 125000000524 functional group Chemical group 0.000 description 2
- UOXRPRZMAROFPH-IESLQMLBSA-N lysophosphatidylinositol Chemical compound CCCCCCCCCCCCCCCC(=O)OC[C@@H](O)COP(O)(=O)OC1[C@H](O)[C@@H](O)C(O)[C@@H](O)[C@H]1O UOXRPRZMAROFPH-IESLQMLBSA-N 0.000 description 2
- 238000002595 magnetic resonance imaging Methods 0.000 description 2
- 239000000463 material Substances 0.000 description 2
- 238000000816 matrix-assisted laser desorption--ionisation Methods 0.000 description 2
- 230000001431 metabolomic effect Effects 0.000 description 2
- 238000000874 microwave-assisted extraction Methods 0.000 description 2
- 238000002156 mixing Methods 0.000 description 2
- 239000006199 nebulizer Substances 0.000 description 2
- 238000000655 nuclear magnetic resonance spectrum Methods 0.000 description 2
- 125000001117 oleyl group Chemical group [H]C([*])([H])C([H])([H])C([H])([H])C([H])([H])C([H])([H])C([H])([H])C([H])([H])C([H])([H])/C([H])=C([H])\C([H])([H])C([H])([H])C([H])([H])C([H])([H])C([H])([H])C([H])([H])C([H])([H])C([H])([H])[H] 0.000 description 2
- 239000003960 organic solvent Substances 0.000 description 2
- 125000001312 palmitoyl group Chemical group O=C([*])C([H])([H])C([H])([H])C([H])([H])C([H])([H])C([H])([H])C([H])([H])C([H])([H])C([H])([H])C([H])([H])C([H])([H])C([H])([H])C([H])([H])C([H])([H])C([H])([H])C([H])([H])[H] 0.000 description 2
- NBIIXXVUZAFLBC-UHFFFAOYSA-K phosphate Chemical compound [O-]P([O-])([O-])=O NBIIXXVUZAFLBC-UHFFFAOYSA-K 0.000 description 2
- 238000003752 polymerase chain reaction Methods 0.000 description 2
- 238000002600 positron emission tomography Methods 0.000 description 2
- 230000002441 reversible effect Effects 0.000 description 2
- 239000011877 solvent mixture Substances 0.000 description 2
- 238000000527 sonication Methods 0.000 description 2
- 125000004079 stearyl group Chemical group [H]C([*])([H])C([H])([H])C([H])([H])C([H])([H])C([H])([H])C([H])([H])C([H])([H])C([H])([H])C([H])([H])C([H])([H])C([H])([H])C([H])([H])C([H])([H])C([H])([H])C([H])([H])C([H])([H])C([H])([H])C([H])([H])[H] 0.000 description 2
- 238000000672 surface-enhanced laser desorption--ionisation Methods 0.000 description 2
- 238000001356 surgical procedure Methods 0.000 description 2
- 238000003325 tomography Methods 0.000 description 2
- 238000011269 treatment regimen Methods 0.000 description 2
- ZHRZLXZJVUFLNY-XAMCCFCMSA-N (2s)-2-[[(2s)-2-[[(2s)-2-[[(2s)-2-aminopropanoyl]amino]propanoyl]amino]propanoyl]amino]propanoic acid Chemical compound C[C@H](N)C(=O)N[C@@H](C)C(=O)N[C@@H](C)C(=O)N[C@@H](C)C(O)=O ZHRZLXZJVUFLNY-XAMCCFCMSA-N 0.000 description 1
- WRIDQFICGBMAFQ-UHFFFAOYSA-N (E)-8-Octadecenoic acid Natural products CCCCCCCCCC=CCCCCCCC(O)=O WRIDQFICGBMAFQ-UHFFFAOYSA-N 0.000 description 1
- LQJBNNIYVWPHFW-UHFFFAOYSA-N 20:1omega9c fatty acid Natural products CCCCCCCCCCC=CCCCCCCCC(O)=O LQJBNNIYVWPHFW-UHFFFAOYSA-N 0.000 description 1
- QSBYPNXLFMSGKH-UHFFFAOYSA-N 9-Heptadecensaeure Natural products CCCCCCCC=CCCCCCCCC(O)=O QSBYPNXLFMSGKH-UHFFFAOYSA-N 0.000 description 1
- 235000009027 Amelanchier alnifolia Nutrition 0.000 description 1
- 244000068687 Amelanchier alnifolia Species 0.000 description 1
- VHUUQVKOLVNVRT-UHFFFAOYSA-N Ammonium hydroxide Chemical compound [NH4+].[OH-] VHUUQVKOLVNVRT-UHFFFAOYSA-N 0.000 description 1
- 201000001320 Atherosclerosis Diseases 0.000 description 1
- QRWFGWZWHBUJPW-UHFFFAOYSA-N C.C.C[N+](C)(C)CC=O Chemical compound C.C.C[N+](C)(C)CC=O QRWFGWZWHBUJPW-UHFFFAOYSA-N 0.000 description 1
- KHRIPQMMFOGLOF-UHFFFAOYSA-O C.C[NH+](C)C Chemical compound C.C[NH+](C)C KHRIPQMMFOGLOF-UHFFFAOYSA-O 0.000 description 1
- LCLXTUCLGOLGJB-MIKBAOFSSA-O C/C=C/C/C=C/C/C=C/CCCCC(=O)O/C=C/C[O+]=P(=O)O Chemical compound C/C=C/C/C=C/C/C=C/CCCCC(=O)O/C=C/C[O+]=P(=O)O LCLXTUCLGOLGJB-MIKBAOFSSA-O 0.000 description 1
- YCVYMTHOFCDJRR-QMDLBSTFSA-O C/C=C/C/C=C/C/C=C/CCCCC(=O)OCC(O)C[O+]=P(=O)O Chemical compound C/C=C/C/C=C/C/C=C/CCCCC(=O)OCC(O)C[O+]=P(=O)O YCVYMTHOFCDJRR-QMDLBSTFSA-O 0.000 description 1
- NSZFUUYZNPSNLS-UTCJRWHESA-O C/C=[O+]/P(=O)(O)OC/C(O)=C/OC=O Chemical compound C/C=[O+]/P(=O)(O)OC/C(O)=C/OC=O NSZFUUYZNPSNLS-UTCJRWHESA-O 0.000 description 1
- OZZZCXJVNJUVHT-HTXNQAPBSA-O C/C=[O+]/P(=O)(O)OC/C=C/OC(=O)CCCCCCCCCCCCCCC Chemical compound C/C=[O+]/P(=O)(O)OC/C=C/OC(=O)CCCCCCCCCCCCCCC OZZZCXJVNJUVHT-HTXNQAPBSA-O 0.000 description 1
- GSTNEHYUYBRQOM-LRKAYDMASA-O C/C=[O+]/P(=O)(O)OCC(O)COC(=O)CCC/C=C/C/C=C/C/C=C/C/C=C/C/C=C/CC Chemical compound C/C=[O+]/P(=O)(O)OCC(O)COC(=O)CCC/C=C/C/C=C/C/C=C/C/C=C/C/C=C/CC GSTNEHYUYBRQOM-LRKAYDMASA-O 0.000 description 1
- AZZZNMQTWROZCR-NCEJYBGESA-O C/C=[O+]/P(=O)(O)OCC(O)COC(=O)CCCC/C=C/C/C=C/C/C=C/CCCCC Chemical compound C/C=[O+]/P(=O)(O)OCC(O)COC(=O)CCCC/C=C/C/C=C/C/C=C/CCCCC AZZZNMQTWROZCR-NCEJYBGESA-O 0.000 description 1
- QTCJYWHMLPSWTD-MVKOLZDDSA-O C/C=[O+]/P(=O)(O)OCC(O)COC(=O)CCCCCCC/C=C/C/C=C/CCCCC Chemical compound C/C=[O+]/P(=O)(O)OCC(O)COC(=O)CCCCCCC/C=C/C/C=C/CCCCC QTCJYWHMLPSWTD-MVKOLZDDSA-O 0.000 description 1
- TYTSXPBWONOOBG-NCEJYBGESA-N C/C=[O+]/P(=O)([O-])OCC(O)COC(=O)CCCCCC/C=C/C/C=C/C/C=C/CCCCC Chemical compound C/C=[O+]/P(=O)([O-])OCC(O)COC(=O)CCCCCC/C=C/C/C=C/C/C=C/CCCCC TYTSXPBWONOOBG-NCEJYBGESA-N 0.000 description 1
- YDNKGFDKKRUKPY-JHOUSYSJSA-N C16 ceramide Natural products CCCCCCCCCCCCCCCC(=O)N[C@@H](CO)[C@H](O)C=CCCCCCCCCCCCCC YDNKGFDKKRUKPY-JHOUSYSJSA-N 0.000 description 1
- OGWASFPAKWNAPB-ZDVGBALWSA-O C=CCC/C=C/C/C=C/CCCCCCCC(=O)OCC(O)COP(=O)(O)/[O+]=C/C Chemical compound C=CCC/C=C/C/C=C/CCCCCCCC(=O)OCC(O)COP(=O)(O)/[O+]=C/C OGWASFPAKWNAPB-ZDVGBALWSA-O 0.000 description 1
- CHLYDWBJSQNGQK-UHFFFAOYSA-O C=CCCC(=O)OCC(O)COP(=O)(O)/[O+]=C/C Chemical compound C=CCCC(=O)OCC(O)COP(=O)(O)/[O+]=C/C CHLYDWBJSQNGQK-UHFFFAOYSA-O 0.000 description 1
- YSARRZVALRNPGB-VOTSOKGWSA-N C=CCCC/C=C/CCCCCCCC#[O+] Chemical compound C=CCCC/C=C/CCCCCCCC#[O+] YSARRZVALRNPGB-VOTSOKGWSA-N 0.000 description 1
- ZNSNUPVNJRGBOA-DBSWOVOKSA-N C=CCCC/C=C/CCCCCCCC(=O)O/C=C/CO=P(=O)O Chemical compound C=CCCC/C=C/CCCCCCCC(=O)O/C=C/CO=P(=O)O ZNSNUPVNJRGBOA-DBSWOVOKSA-N 0.000 description 1
- LNPANCIPQPJKOG-MDZDMXLPSA-O C=CCCC/C=C/CCCCCCCC(=O)OCC(O)COP(=O)(O)OCC[N+](C)(C)C Chemical compound C=CCCC/C=C/CCCCCCCC(=O)OCC(O)COP(=O)(O)OCC[N+](C)(C)C LNPANCIPQPJKOG-MDZDMXLPSA-O 0.000 description 1
- JYGIFNHCRLHIQN-UHFFFAOYSA-M C=CCCCCCCCC(=O)OCC(COP(=O)([O-])OCCN(C)CO)OC(C)O Chemical compound C=CCCCCCCCC(=O)OCC(COP(=O)([O-])OCCN(C)CO)OC(C)O JYGIFNHCRLHIQN-UHFFFAOYSA-M 0.000 description 1
- XWBUGKSTUSMBAB-DTQAZKPQSA-O C=CCCCCCCCCCCCC(=O)O/C=C/C[OH2+] Chemical compound C=CCCCCCCCCCCCC(=O)O/C=C/C[OH2+] XWBUGKSTUSMBAB-DTQAZKPQSA-O 0.000 description 1
- UQMWZQSBPKPBAJ-UHFFFAOYSA-M C=COP(=O)([O-])OCC(NC)C(=O)O Chemical compound C=COP(=O)([O-])OCC(NC)C(=O)O UQMWZQSBPKPBAJ-UHFFFAOYSA-M 0.000 description 1
- PSBWHWZWVJZEBZ-UHFFFAOYSA-M C=COP(=O)([O-])OCC(O)COC(=O)CCCCCCCCCCCCCCC Chemical compound C=COP(=O)([O-])OCC(O)COC(=O)CCCCCCCCCCCCCCC PSBWHWZWVJZEBZ-UHFFFAOYSA-M 0.000 description 1
- FEPALRHSTYQUPX-UHFFFAOYSA-N CC#CC#CC#CC#CC#CC#CC#CC#CC(=O)O.[HH].[HH].[HH].[HH].[HH].[HH].[HH].[HH].[HH].[HH].[HH].[HH].[HH].[HH] Chemical compound CC#CC#CC#CC#CC#CC#CC#CC#CC(=O)O.[HH].[HH].[HH].[HH].[HH].[HH].[HH].[HH].[HH].[HH].[HH].[HH].[HH].[HH] FEPALRHSTYQUPX-UHFFFAOYSA-N 0.000 description 1
- MJPWUOCFEWEBLB-UHFFFAOYSA-N CC#CC#CC#CC#CC#CC#CC#CC#CC(=O)O.[HH].[HH].[HH].[HH].[HH].[HH].[HH].[HH].[HH].[HH].[HH].[HH].[HH].[HH].[HH] Chemical compound CC#CC#CC#CC#CC#CC#CC#CC#CC(=O)O.[HH].[HH].[HH].[HH].[HH].[HH].[HH].[HH].[HH].[HH].[HH].[HH].[HH].[HH].[HH] MJPWUOCFEWEBLB-UHFFFAOYSA-N 0.000 description 1
- ZXQLWIFEWOOSJB-UHFFFAOYSA-N CC#CC#CC#CC#CC#CC#CC#CC#CC(=O)OCC(COP(=O)(O)OCCN(C)C)OC(O)CO.CC#CC#CC#CC#CC#CC#CC#CC#CC(=O)OCC(COP(=O)(O)OCCN(C)C)OC(O)CO.CCCCCCCCCCCCCCCC(=O)OCC(COP(=O)(O)OCC(NC)C(=O)O)OC(C)O.CCCCCCCCCCCCCCCC(=O)OCC(COP(=O)(O)OCCN(C)C)OC(O)CO.CCCCCCCCCCCCCCCCCC(=O)OCC(COP(=O)(O)OCCN(C)C)OC(O)CO.[HH].[HH].[HH].[HH].[HH].[HH].[HH].[HH].[HH].[HH].[HH].[HH].[HH].[HH].[HH].[HH].[HH].[HH].[HH].[HH].[HH].[HH].[HH].[HH].[HH].[HH].[HH].[HH].[HH] Chemical compound CC#CC#CC#CC#CC#CC#CC#CC#CC(=O)OCC(COP(=O)(O)OCCN(C)C)OC(O)CO.CC#CC#CC#CC#CC#CC#CC#CC#CC(=O)OCC(COP(=O)(O)OCCN(C)C)OC(O)CO.CCCCCCCCCCCCCCCC(=O)OCC(COP(=O)(O)OCC(NC)C(=O)O)OC(C)O.CCCCCCCCCCCCCCCC(=O)OCC(COP(=O)(O)OCCN(C)C)OC(O)CO.CCCCCCCCCCCCCCCCCC(=O)OCC(COP(=O)(O)OCCN(C)C)OC(O)CO.[HH].[HH].[HH].[HH].[HH].[HH].[HH].[HH].[HH].[HH].[HH].[HH].[HH].[HH].[HH].[HH].[HH].[HH].[HH].[HH].[HH].[HH].[HH].[HH].[HH].[HH].[HH].[HH].[HH] ZXQLWIFEWOOSJB-UHFFFAOYSA-N 0.000 description 1
- UQQDPABIYWJSMO-UHFFFAOYSA-N CC#CC#CC#CC#CC#CC#CC#CC#CC(=O)OCC(COP(=O)(O)OCCN(C)C)OC(O)CO.[HH].[HH].[HH].[HH].[HH].[HH].[HH].[HH].[HH].[HH].[HH].[HH].[HH].[HH] Chemical compound CC#CC#CC#CC#CC#CC#CC#CC#CC(=O)OCC(COP(=O)(O)OCCN(C)C)OC(O)CO.[HH].[HH].[HH].[HH].[HH].[HH].[HH].[HH].[HH].[HH].[HH].[HH].[HH].[HH] UQQDPABIYWJSMO-UHFFFAOYSA-N 0.000 description 1
- BQLNEOQBAFPXLN-UHFFFAOYSA-N CC#CC#CC#CC#CC#CC#CC#CC#CC(=O)OCC(COP(=O)(O)OCCN(C)C)OC(O)CO.[HH].[HH].[HH].[HH].[HH].[HH].[HH].[HH].[HH].[HH].[HH].[HH].[HH].[HH].[HH] Chemical compound CC#CC#CC#CC#CC#CC#CC#CC#CC(=O)OCC(COP(=O)(O)OCCN(C)C)OC(O)CO.[HH].[HH].[HH].[HH].[HH].[HH].[HH].[HH].[HH].[HH].[HH].[HH].[HH].[HH].[HH] BQLNEOQBAFPXLN-UHFFFAOYSA-N 0.000 description 1
- UQQDPABIYWJSMO-UHFFFAOYSA-M CC#CC#CC#CC#CC#CC#CC#CC#CC(=O)OCC(COP(=O)([O-])OCCN(C)C)OC(O)CO.[HH].[HH].[HH].[HH].[HH].[HH].[HH].[HH].[HH].[HH].[HH].[HH].[HH].[HH] Chemical compound CC#CC#CC#CC#CC#CC#CC#CC#CC(=O)OCC(COP(=O)([O-])OCCN(C)C)OC(O)CO.[HH].[HH].[HH].[HH].[HH].[HH].[HH].[HH].[HH].[HH].[HH].[HH].[HH].[HH] UQQDPABIYWJSMO-UHFFFAOYSA-M 0.000 description 1
- BQLNEOQBAFPXLN-UHFFFAOYSA-M CC#CC#CC#CC#CC#CC#CC#CC#CC(=O)OCC(COP(=O)([O-])OCCN(C)C)OC(O)CO.[HH].[HH].[HH].[HH].[HH].[HH].[HH].[HH].[HH].[HH].[HH].[HH].[HH].[HH].[HH] Chemical compound CC#CC#CC#CC#CC#CC#CC#CC#CC(=O)OCC(COP(=O)([O-])OCCN(C)C)OC(O)CO.[HH].[HH].[HH].[HH].[HH].[HH].[HH].[HH].[HH].[HH].[HH].[HH].[HH].[HH].[HH] BQLNEOQBAFPXLN-UHFFFAOYSA-M 0.000 description 1
- KJDTWBKCUIJRLS-UHFFFAOYSA-M CC#CC#CC#CC#CC#CC#CC#CC#CC(=O)OCC(O)COP(=O)([O-])OCCN(C)C.[HH].[HH].[HH].[HH].[HH].[HH].[HH].[HH].[HH].[HH].[HH].[HH].[HH].[HH] Chemical compound CC#CC#CC#CC#CC#CC#CC#CC#CC(=O)OCC(O)COP(=O)([O-])OCCN(C)C.[HH].[HH].[HH].[HH].[HH].[HH].[HH].[HH].[HH].[HH].[HH].[HH].[HH].[HH] KJDTWBKCUIJRLS-UHFFFAOYSA-M 0.000 description 1
- VAAWLUHLNCOMGD-UHFFFAOYSA-M CC#CC#CC#CC#CC#CC#CC#CC#CC(=O)OCC(O)COP(=O)([O-])OCCN(C)C.[HH].[HH].[HH].[HH].[HH].[HH].[HH].[HH].[HH].[HH].[HH].[HH].[HH].[HH].[HH] Chemical compound CC#CC#CC#CC#CC#CC#CC#CC#CC(=O)OCC(O)COP(=O)([O-])OCCN(C)C.[HH].[HH].[HH].[HH].[HH].[HH].[HH].[HH].[HH].[HH].[HH].[HH].[HH].[HH].[HH] VAAWLUHLNCOMGD-UHFFFAOYSA-M 0.000 description 1
- AMIJPSJGAJFZSD-UHFFFAOYSA-N CC#CC#CC#CC#CC#CC#CC#CC#CC=O.[HH].[HH].[HH].[HH].[HH].[HH].[HH].[HH].[HH].[HH].[HH].[HH].[HH].[HH] Chemical compound CC#CC#CC#CC#CC#CC#CC#CC#CC=O.[HH].[HH].[HH].[HH].[HH].[HH].[HH].[HH].[HH].[HH].[HH].[HH].[HH].[HH] AMIJPSJGAJFZSD-UHFFFAOYSA-N 0.000 description 1
- WNBIWRWVIQVKDZ-UHFFFAOYSA-N CC#CC#CC#CC#CC#CC#CC#CC#CC=O.[HH].[HH].[HH].[HH].[HH].[HH].[HH].[HH].[HH].[HH].[HH].[HH].[HH].[HH].[HH] Chemical compound CC#CC#CC#CC#CC#CC#CC#CC#CC=O.[HH].[HH].[HH].[HH].[HH].[HH].[HH].[HH].[HH].[HH].[HH].[HH].[HH].[HH].[HH] WNBIWRWVIQVKDZ-UHFFFAOYSA-N 0.000 description 1
- QTBSBXVTEAMEQO-UHFFFAOYSA-N CC(=O)O Chemical compound CC(=O)O QTBSBXVTEAMEQO-UHFFFAOYSA-N 0.000 description 1
- SDHFDMPVPHRSBP-JEYKTYJUSA-O CC/C=C/C/C=C/C/C=C/C/C=C/C/C=C/CCCC(=O)O/C=C/COP(=O)(O)OCC[N+](C)(C)C Chemical compound CC/C=C/C/C=C/C/C=C/C/C=C/C/C=C/CCCC(=O)O/C=C/COP(=O)(O)OCC[N+](C)(C)C SDHFDMPVPHRSBP-JEYKTYJUSA-O 0.000 description 1
- PDIGSOAOQOXRDU-GUTOPQIJSA-O CC/C=C/C/C=C/C/C=C/C/C=C/C/C=C/CCCC(=O)OCC(O)COP(=O)(O)OCC[N+](C)(C)C Chemical compound CC/C=C/C/C=C/C/C=C/C/C=C/C/C=C/CCCC(=O)OCC(O)COP(=O)(O)OCC[N+](C)(C)C PDIGSOAOQOXRDU-GUTOPQIJSA-O 0.000 description 1
- YCTDZYMMFQCTEO-FNORWQNLSA-N CC/C=C/CCCC Chemical compound CC/C=C/CCCC YCTDZYMMFQCTEO-FNORWQNLSA-N 0.000 description 1
- MKDLXBSOWOBRIA-DEMSAOOFSA-O CCCC/C=C/C/C=C/C/C=C/CCCCCCC(=O)O/C=C/COP(=O)(O)OCC[N+](C)(C)C Chemical compound CCCC/C=C/C/C=C/C/C=C/CCCCCCC(=O)O/C=C/COP(=O)(O)OCC[N+](C)(C)C MKDLXBSOWOBRIA-DEMSAOOFSA-O 0.000 description 1
- APXBSNPAXVKBQT-GQCTYLIASA-O CCCCC(=O)O/C=C/C[O+]=P(=O)O Chemical compound CCCCC(=O)O/C=C/C[O+]=P(=O)O APXBSNPAXVKBQT-GQCTYLIASA-O 0.000 description 1
- MRTUWVDDQVMUCR-WYTUUNCASA-O CCCCC/C=C/C/C=C/C/C=C/CCCCC(=O)OCC(O)COP(=O)(O)OCC[N+](C)(C)C Chemical compound CCCCC/C=C/C/C=C/C/C=C/CCCCC(=O)OCC(O)COP(=O)(O)OCC[N+](C)(C)C MRTUWVDDQVMUCR-WYTUUNCASA-O 0.000 description 1
- GXJMPRFDIBFQTI-YHTMAJSVSA-O CCCCC/C=C/C/C=C/C/C=C/CCCCC(=O)OCC(O)C[O+]=P(=O)O Chemical compound CCCCC/C=C/C/C=C/C/C=C/CCCCC(=O)OCC(O)C[O+]=P(=O)O GXJMPRFDIBFQTI-YHTMAJSVSA-O 0.000 description 1
- BBNHCUBQEQJHIG-WYTUUNCASA-O CCCCC/C=C/C/C=C/C/C=C/CCCCCCC(=O)OCC(O)COP(=O)(O)OCC[N+](C)(C)C Chemical compound CCCCC/C=C/C/C=C/C/C=C/CCCCCCC(=O)OCC(O)COP(=O)(O)OCC[N+](C)(C)C BBNHCUBQEQJHIG-WYTUUNCASA-O 0.000 description 1
- WUUZNRCSJMYKFC-PPYVJCMGSA-O CCCCC/C=C/C/C=C/CCCCCCCC(=O)O/C=C/COP(=O)(O)OCC[N+](C)(C)C Chemical compound CCCCC/C=C/C/C=C/CCCCCCCC(=O)O/C=C/COP(=O)(O)OCC[N+](C)(C)C WUUZNRCSJMYKFC-PPYVJCMGSA-O 0.000 description 1
- SPJFYYJXNPEZDW-OKLKQMLOSA-O CCCCC/C=C/C/C=C/CCCCCCCC(=O)OCC(O)COP(=O)(O)OCC[N+](C)(C)C Chemical compound CCCCC/C=C/C/C=C/CCCCCCCC(=O)OCC(O)COP(=O)(O)OCC[N+](C)(C)C SPJFYYJXNPEZDW-OKLKQMLOSA-O 0.000 description 1
- OYHQOLUKZRVURQ-AVQMFFATSA-O CCCCC/C=C/C/C=C/CCCCCCCC(O)=[OH+] Chemical compound CCCCC/C=C/C/C=C/CCCCCCCC(O)=[OH+] OYHQOLUKZRVURQ-AVQMFFATSA-O 0.000 description 1
- RZIFULQEHWBJMO-VXHSNOLZSA-O CCCCCCCC/C=C/CCCCCCCC(=O)O/C=C/COP(=O)(O)OCC[N+](C)(C)C Chemical compound CCCCCCCC/C=C/CCCCCCCC(=O)O/C=C/COP(=O)(O)OCC[N+](C)(C)C RZIFULQEHWBJMO-VXHSNOLZSA-O 0.000 description 1
- YAMUFBLWGFFICM-OUKQBFOZSA-O CCCCCCCC/C=C/CCCCCCCC(=O)OCC(O)COP(=O)(O)OCC[N+](C)(C)C Chemical compound CCCCCCCC/C=C/CCCCCCCC(=O)OCC(O)COP(=O)(O)OCC[N+](C)(C)C YAMUFBLWGFFICM-OUKQBFOZSA-O 0.000 description 1
- QOMVVZRTJVPNCP-UHFFFAOYSA-N CCCCCCCCCCCCCCCC#[O+] Chemical compound CCCCCCCCCCCCCCCC#[O+] QOMVVZRTJVPNCP-UHFFFAOYSA-N 0.000 description 1
- GNDSSMFTUARPIG-OBGWFSINSA-O CCCCCCCCCCCCCCCC(=O)O/C=C/C[OH2+] Chemical compound CCCCCCCCCCCCCCCC(=O)O/C=C/C[OH2+] GNDSSMFTUARPIG-OBGWFSINSA-O 0.000 description 1
- FLIACVVOZYBSBS-UHFFFAOYSA-N CCCCCCCCCCCCCCCC(=O)OC Chemical compound CCCCCCCCCCCCCCCC(=O)OC FLIACVVOZYBSBS-UHFFFAOYSA-N 0.000 description 1
- PQPOLHFDDKCTLS-OBGWFSINSA-M CCCCCCCCCCCCCCCC(=O)OC/C=C/OP(=O)([O-])O Chemical compound CCCCCCCCCCCCCCCC(=O)OC/C=C/OP(=O)([O-])O PQPOLHFDDKCTLS-OBGWFSINSA-M 0.000 description 1
- JMAOFQXTBKPXNN-HEHNFIMWSA-M CCCCCCCCCCCCCCCC(=O)OC/C=C/OP(=O)([O-])OCCN(C)C Chemical compound CCCCCCCCCCCCCCCC(=O)OC/C=C/OP(=O)([O-])OCCN(C)C JMAOFQXTBKPXNN-HEHNFIMWSA-M 0.000 description 1
- YZFFZNIKHYBBLU-UHFFFAOYSA-N CCCCCCCCCCCCCCCC(=O)OCC(COP(=O)(O)OCC(NC)C(=O)O)OC(C)O Chemical compound CCCCCCCCCCCCCCCC(=O)OCC(COP(=O)(O)OCC(NC)C(=O)O)OC(C)O YZFFZNIKHYBBLU-UHFFFAOYSA-N 0.000 description 1
- GZQWQHICDWCGFJ-UHFFFAOYSA-N CCCCCCCCCCCCCCCC(=O)OCC(COP(=O)(O)OCCN(C)C)OC(O)CO Chemical compound CCCCCCCCCCCCCCCC(=O)OCC(COP(=O)(O)OCCN(C)C)OC(O)CO GZQWQHICDWCGFJ-UHFFFAOYSA-N 0.000 description 1
- PTFNHMIWFURVFD-VHEBQXMUSA-M CCCCCCCCCCCCCCCC(=O)OCC(COP(=O)([O-])O/C=C/NC)OC(C)O Chemical compound CCCCCCCCCCCCCCCC(=O)OCC(COP(=O)([O-])O/C=C/NC)OC(C)O PTFNHMIWFURVFD-VHEBQXMUSA-M 0.000 description 1
- YZFFZNIKHYBBLU-UHFFFAOYSA-M CCCCCCCCCCCCCCCC(=O)OCC(COP(=O)([O-])OCC(NC)C(=O)O)OC(C)O Chemical compound CCCCCCCCCCCCCCCC(=O)OCC(COP(=O)([O-])OCC(NC)C(=O)O)OC(C)O YZFFZNIKHYBBLU-UHFFFAOYSA-M 0.000 description 1
- GZQWQHICDWCGFJ-UHFFFAOYSA-M CCCCCCCCCCCCCCCC(=O)OCC(COP(=O)([O-])OCCN(C)C)OC(O)CO Chemical compound CCCCCCCCCCCCCCCC(=O)OCC(COP(=O)([O-])OCCN(C)C)OC(O)CO GZQWQHICDWCGFJ-UHFFFAOYSA-M 0.000 description 1
- PXQWHFCKRBFTHV-UHFFFAOYSA-N CCCCCCCCCCCCCCCC(=O)OCC(O)COP(=O)(O)OCCN(C)C Chemical compound CCCCCCCCCCCCCCCC(=O)OCC(O)COP(=O)(O)OCCN(C)C PXQWHFCKRBFTHV-UHFFFAOYSA-N 0.000 description 1
- QHZLMUACJMDIAE-UHFFFAOYSA-O CCCCCCCCCCCCCCCC(=O)OCC(O)C[OH2+] Chemical compound CCCCCCCCCCCCCCCC(=O)OCC(O)C[OH2+] QHZLMUACJMDIAE-UHFFFAOYSA-O 0.000 description 1
- UEBOJGLRMRLLRL-JZJYNLBNSA-M CCCCCCCCCCCCCCCC(=O)OCCCOP(=O)([O-])O/C=C\C(=O)O Chemical compound CCCCCCCCCCCCCCCC(=O)OCCCOP(=O)([O-])O/C=C\C(=O)O UEBOJGLRMRLLRL-JZJYNLBNSA-M 0.000 description 1
- VYWPYHZXFVWBNN-UHFFFAOYSA-M CCCCCCCCCCCCCCCC(=O)OCCCOP(=O)([O-])OCC(NC)C(=O)O Chemical compound CCCCCCCCCCCCCCCC(=O)OCCCOP(=O)([O-])OCC(NC)C(=O)O VYWPYHZXFVWBNN-UHFFFAOYSA-M 0.000 description 1
- IPCSVZSSVZVIGE-UHFFFAOYSA-M CCCCCCCCCCCCCCCC(=O)[O-] Chemical compound CCCCCCCCCCCCCCCC(=O)[O-] IPCSVZSSVZVIGE-UHFFFAOYSA-M 0.000 description 1
- AOMSOSNCMZOJAZ-BSYVCWPDSA-O CCCCCCCCCCCCCCCCCC(=O)O/C=C/COP(=O)(O)OCC[N+](C)(C)C Chemical compound CCCCCCCCCCCCCCCCCC(=O)O/C=C/COP(=O)(O)OCC[N+](C)(C)C AOMSOSNCMZOJAZ-BSYVCWPDSA-O 0.000 description 1
- RSNXESVNAXEFMZ-UHFFFAOYSA-M CCCCCCCCCCCCCCCCCC(=O)OCC(C)COP(=O)([O-])OCCN(C)C Chemical compound CCCCCCCCCCCCCCCCCC(=O)OCC(C)COP(=O)([O-])OCCN(C)C RSNXESVNAXEFMZ-UHFFFAOYSA-M 0.000 description 1
- MXELBBIZYNMMGW-UHFFFAOYSA-N CCCCCCCCCCCCCCCCCC(=O)OCC(COP(=O)(O)OCCN(C)C)OC(O)CO Chemical compound CCCCCCCCCCCCCCCCCC(=O)OCC(COP(=O)(O)OCCN(C)C)OC(O)CO MXELBBIZYNMMGW-UHFFFAOYSA-N 0.000 description 1
- MXELBBIZYNMMGW-UHFFFAOYSA-M CCCCCCCCCCCCCCCCCC(=O)OCC(COP(=O)([O-])OCCN(C)C)OC(O)CO Chemical compound CCCCCCCCCCCCCCCCCC(=O)OCC(COP(=O)([O-])OCCN(C)C)OC(O)CO MXELBBIZYNMMGW-UHFFFAOYSA-M 0.000 description 1
- BBYWOYAFBUOUFP-UHFFFAOYSA-M CCCCCCCCCCCCCCCCCC(=O)OCC(O)COP(=O)([O-])OCCN Chemical compound CCCCCCCCCCCCCCCCCC(=O)OCC(O)COP(=O)([O-])OCCN BBYWOYAFBUOUFP-UHFFFAOYSA-M 0.000 description 1
- QIQXTHQIDYTFRH-UHFFFAOYSA-O CCCCCCCCCCCCCCCCCC(O)=[OH+] Chemical compound CCCCCCCCCCCCCCCCCC(O)=[OH+] QIQXTHQIDYTFRH-UHFFFAOYSA-O 0.000 description 1
- FWWQKRXKHIRPJY-UHFFFAOYSA-N CCCCCCCCCCCCCCCCCC=O Chemical compound CCCCCCCCCCCCCCCCCC=O FWWQKRXKHIRPJY-UHFFFAOYSA-N 0.000 description 1
- SGHWSBMDJNWXLZ-UHFFFAOYSA-M CCOP(=O)([O-])OCC(NC)C(=O)O Chemical compound CCOP(=O)([O-])OCC(NC)C(=O)O SGHWSBMDJNWXLZ-UHFFFAOYSA-M 0.000 description 1
- UWNKCPWBCXKCET-ZZXKWVIFSA-M CN(C)CCOP(=O)([O-])O/C=C/CO Chemical compound CN(C)CCOP(=O)([O-])O/C=C/CO UWNKCPWBCXKCET-ZZXKWVIFSA-M 0.000 description 1
- RBAAYBAXGRCLAW-UHFFFAOYSA-N COC(N[IH][IH]C)=O Chemical compound COC(N[IH][IH]C)=O RBAAYBAXGRCLAW-UHFFFAOYSA-N 0.000 description 1
- BSXJJFWFSVKRAZ-TWGQIWQCSA-O C[N+](C)(C)CCOP(=O)(O)OC/C(O)=C/OC=O Chemical compound C[N+](C)(C)CCOP(=O)(O)OC/C(O)=C/OC=O BSXJJFWFSVKRAZ-TWGQIWQCSA-O 0.000 description 1
- 206010061819 Disease recurrence Diseases 0.000 description 1
- SQUHHTBVTRBESD-UHFFFAOYSA-N Hexa-Ac-myo-Inositol Natural products CC(=O)OC1C(OC(C)=O)C(OC(C)=O)C(OC(C)=O)C(OC(C)=O)C1OC(C)=O SQUHHTBVTRBESD-UHFFFAOYSA-N 0.000 description 1
- 241000282412 Homo Species 0.000 description 1
- 101100021459 Homo sapiens LMBRD1 gene Proteins 0.000 description 1
- UFHFLCQGNIYNRP-UHFFFAOYSA-N Hydrogen Chemical compound [H][H] UFHFLCQGNIYNRP-UHFFFAOYSA-N 0.000 description 1
- 206010061218 Inflammation Diseases 0.000 description 1
- OYHQOLUKZRVURQ-HZJYTTRNSA-N Linoleic acid Chemical compound CCCCC\C=C/C\C=C/CCCCCCCC(O)=O OYHQOLUKZRVURQ-HZJYTTRNSA-N 0.000 description 1
- 102100031335 Lysosomal cobalamin transport escort protein LMBD1 Human genes 0.000 description 1
- 206010027476 Metastases Diseases 0.000 description 1
- 241001467552 Mycobacterium bovis BCG Species 0.000 description 1
- CRJGESKKUOMBCT-VQTJNVASSA-N N-acetylsphinganine Chemical compound CCCCCCCCCCCCCCC[C@@H](O)[C@H](CO)NC(C)=O CRJGESKKUOMBCT-VQTJNVASSA-N 0.000 description 1
- SUHOOTKUPISOBE-UHFFFAOYSA-M NCCOP(=O)([O-])O Chemical compound NCCOP(=O)([O-])O SUHOOTKUPISOBE-UHFFFAOYSA-M 0.000 description 1
- HWBREJGIEWLDQT-HNQUOIGGSA-M NCCOP(=O)([O-])OC/C=C/O Chemical compound NCCOP(=O)([O-])OC/C=C/O HWBREJGIEWLDQT-HNQUOIGGSA-M 0.000 description 1
- JZNWSCPGTDBMEW-UHFFFAOYSA-M NCCOP(=O)([O-])OCC(O)CO Chemical compound NCCOP(=O)([O-])OCC(O)CO JZNWSCPGTDBMEW-UHFFFAOYSA-M 0.000 description 1
- AEMRFAOFKBGASW-UHFFFAOYSA-N O=C(O)CO Chemical compound O=C(O)CO AEMRFAOFKBGASW-UHFFFAOYSA-N 0.000 description 1
- ZQPPMHVWECSIRJ-UHFFFAOYSA-N Oleic acid Natural products CCCCCCCCC=CCCCCCCCC(O)=O ZQPPMHVWECSIRJ-UHFFFAOYSA-N 0.000 description 1
- 239000005642 Oleic acid Substances 0.000 description 1
- 229910019142 PO4 Inorganic materials 0.000 description 1
- 235000021314 Palmitic acid Nutrition 0.000 description 1
- 102000015439 Phospholipases Human genes 0.000 description 1
- 108010064785 Phospholipases Proteins 0.000 description 1
- 238000000944 Soxhlet extraction Methods 0.000 description 1
- QYKIQEUNHZKYBP-UHFFFAOYSA-N Vinyl ether Chemical compound C=COC=C QYKIQEUNHZKYBP-UHFFFAOYSA-N 0.000 description 1
- FWJMJXRJRDJZGY-UHFFFAOYSA-N [CH2+]CC(O)OC(=O)CCCCCCCCCCCCCCC Chemical compound [CH2+]CC(O)OC(=O)CCCCCCCCCCCCCCC FWJMJXRJRDJZGY-UHFFFAOYSA-N 0.000 description 1
- DIMDPYWOPQTFFY-OYVSTQIOSA-N [CH2+]CCCCC/C=C/CC/C=C/CCCC Chemical compound [CH2+]CCCCC/C=C/CC/C=C/CCCC DIMDPYWOPQTFFY-OYVSTQIOSA-N 0.000 description 1
- LOCGFDLZUAEZID-UHFFFAOYSA-M [CH2-]N(C)CCOP(=O)([O-])OCC(C)O Chemical compound [CH2-]N(C)CCOP(=O)([O-])OCC(C)O LOCGFDLZUAEZID-UHFFFAOYSA-M 0.000 description 1
- NZAXLVZQSAXKCO-UHFFFAOYSA-N [CH2-]OC(=O)CCCCCCCCCCCCCCC Chemical compound [CH2-]OC(=O)CCCCCCCCCCCCCCC NZAXLVZQSAXKCO-UHFFFAOYSA-N 0.000 description 1
- 125000002252 acyl group Chemical group 0.000 description 1
- 210000000577 adipose tissue Anatomy 0.000 description 1
- 230000032683 aging Effects 0.000 description 1
- 150000001298 alcohols Chemical class 0.000 description 1
- 150000001412 amines Chemical group 0.000 description 1
- 125000003277 amino group Chemical group 0.000 description 1
- 239000000908 ammonium hydroxide Substances 0.000 description 1
- 230000002280 anti-androgenic effect Effects 0.000 description 1
- 239000000051 antiandrogen Substances 0.000 description 1
- 229940030495 antiandrogen sex hormone and modulator of the genital system Drugs 0.000 description 1
- 239000000427 antigen Substances 0.000 description 1
- 102000036639 antigens Human genes 0.000 description 1
- 108091007433 antigens Proteins 0.000 description 1
- 239000003125 aqueous solvent Substances 0.000 description 1
- 229960000190 bacillus calmette–guérin vaccine Drugs 0.000 description 1
- 230000009286 beneficial effect Effects 0.000 description 1
- 230000008901 benefit Effects 0.000 description 1
- 239000003150 biochemical marker Substances 0.000 description 1
- 230000008236 biological pathway Effects 0.000 description 1
- 230000015572 biosynthetic process Effects 0.000 description 1
- 210000004556 brain Anatomy 0.000 description 1
- 230000028956 calcium-mediated signaling Effects 0.000 description 1
- 238000011088 calibration curve Methods 0.000 description 1
- 229940106189 ceramide Drugs 0.000 description 1
- ZVEQCJWYRWKARO-UHFFFAOYSA-N ceramide Natural products CCCCCCCCCCCCCCC(O)C(=O)NC(CO)C(O)C=CCCC=C(C)CCCCCCCCC ZVEQCJWYRWKARO-UHFFFAOYSA-N 0.000 description 1
- 230000008859 change Effects 0.000 description 1
- 150000005829 chemical entities Chemical class 0.000 description 1
- 238000000451 chemical ionisation Methods 0.000 description 1
- 210000001072 colon Anatomy 0.000 description 1
- 238000007398 colorimetric assay Methods 0.000 description 1
- 238000012790 confirmation Methods 0.000 description 1
- 239000013068 control sample Substances 0.000 description 1
- 238000007796 conventional method Methods 0.000 description 1
- IDLFZVILOHSSID-OVLDLUHVSA-N corticotropin Chemical group C([C@@H](C(=O)N[C@@H](CO)C(=O)N[C@@H](CCSC)C(=O)N[C@@H](CCC(O)=O)C(=O)N[C@@H](CC=1NC=NC=1)C(=O)N[C@@H](CC=1C=CC=CC=1)C(=O)N[C@@H](CCCNC(N)=N)C(=O)N[C@@H](CC=1C2=CC=CC=C2NC=1)C(=O)NCC(=O)N[C@@H](CCCCN)C(=O)N1[C@@H](CCC1)C(=O)N[C@@H](C(C)C)C(=O)NCC(=O)N[C@@H](CCCCN)C(=O)N[C@@H](CCCCN)C(=O)N[C@@H](CCCNC(N)=N)C(=O)N[C@@H](CCCNC(N)=N)C(=O)N1[C@@H](CCC1)C(=O)N[C@@H](C(C)C)C(=O)N[C@@H](CCCCN)C(=O)N[C@@H](C(C)C)C(=O)N[C@@H](CC=1C=CC(O)=CC=1)C(=O)N1[C@@H](CCC1)C(=O)N[C@@H](CC(N)=O)C(=O)NCC(=O)N[C@@H](C)C(=O)N[C@@H](CCC(O)=O)C(=O)N[C@@H](CC(O)=O)C(=O)N[C@@H](CCC(O)=O)C(=O)N[C@@H](CO)C(=O)N[C@@H](C)C(=O)N[C@@H](CCC(O)=O)C(=O)N[C@@H](C)C(=O)N[C@@H](CC=1C=CC=CC=1)C(=O)N1[C@@H](CCC1)C(=O)N[C@@H](CC(C)C)C(=O)N[C@@H](CCC(O)=O)C(=O)N[C@@H](CC=1C=CC=CC=1)C(O)=O)NC(=O)[C@@H](N)CO)C1=CC=C(O)C=C1 IDLFZVILOHSSID-OVLDLUHVSA-N 0.000 description 1
- 230000001186 cumulative effect Effects 0.000 description 1
- 238000013501 data transformation Methods 0.000 description 1
- 230000007812 deficiency Effects 0.000 description 1
- 230000000593 degrading effect Effects 0.000 description 1
- 238000001212 derivatisation Methods 0.000 description 1
- 235000005911 diet Nutrition 0.000 description 1
- 230000000378 dietary effect Effects 0.000 description 1
- 238000007865 diluting Methods 0.000 description 1
- 229910001873 dinitrogen Inorganic materials 0.000 description 1
- 229940079593 drug Drugs 0.000 description 1
- 239000003814 drug Substances 0.000 description 1
- 238000010828 elution Methods 0.000 description 1
- 229940031098 ethanolamine Drugs 0.000 description 1
- 238000004401 flow injection analysis Methods 0.000 description 1
- 238000009472 formulation Methods 0.000 description 1
- 235000021588 free fatty acids Nutrition 0.000 description 1
- 238000002546 full scan Methods 0.000 description 1
- 238000002290 gas chromatography-mass spectrometry Methods 0.000 description 1
- 230000000762 glandular Effects 0.000 description 1
- 229960005150 glycerol Drugs 0.000 description 1
- 210000004209 hair Anatomy 0.000 description 1
- 238000001794 hormone therapy Methods 0.000 description 1
- 239000001257 hydrogen Substances 0.000 description 1
- 229910052739 hydrogen Inorganic materials 0.000 description 1
- 125000002887 hydroxy group Chemical group [H]O* 0.000 description 1
- 238000009169 immunotherapy Methods 0.000 description 1
- 230000006872 improvement Effects 0.000 description 1
- 238000010348 incorporation Methods 0.000 description 1
- 230000004054 inflammatory process Effects 0.000 description 1
- CDAISMWEOUEBRE-GPIVLXJGSA-N inositol Chemical compound O[C@H]1[C@H](O)[C@@H](O)[C@H](O)[C@H](O)[C@@H]1O CDAISMWEOUEBRE-GPIVLXJGSA-N 0.000 description 1
- 229960000367 inositol Drugs 0.000 description 1
- 238000011835 investigation Methods 0.000 description 1
- 238000002955 isolation Methods 0.000 description 1
- QXJSBBXBKPUZAA-UHFFFAOYSA-N isooleic acid Natural products CCCCCCCC=CCCCCCCCCC(O)=O QXJSBBXBKPUZAA-UHFFFAOYSA-N 0.000 description 1
- 210000003734 kidney Anatomy 0.000 description 1
- 238000009533 lab test Methods 0.000 description 1
- 235000020778 linoleic acid Nutrition 0.000 description 1
- OYHQOLUKZRVURQ-IXWMQOLASA-N linoleic acid Natural products CCCCC\C=C/C\C=C\CCCCCCCC(O)=O OYHQOLUKZRVURQ-IXWMQOLASA-N 0.000 description 1
- 125000005645 linoleyl group Chemical group 0.000 description 1
- 150000002632 lipids Chemical class 0.000 description 1
- 238000001294 liquid chromatography-tandem mass spectrometry Methods 0.000 description 1
- 210000004185 liver Anatomy 0.000 description 1
- 210000004072 lung Anatomy 0.000 description 1
- 239000012528 membrane Substances 0.000 description 1
- 238000007884 metabolite profiling Methods 0.000 description 1
- 230000009401 metastasis Effects 0.000 description 1
- 125000002496 methyl group Chemical group [H]C([H])([H])* 0.000 description 1
- 238000012986 modification Methods 0.000 description 1
- 230000004048 modification Effects 0.000 description 1
- WQEPLUUGTLDZJY-UHFFFAOYSA-N n-Pentadecanoic acid Natural products CCCCCCCCCCCCCCC(O)=O WQEPLUUGTLDZJY-UHFFFAOYSA-N 0.000 description 1
- VVGIYYKRAMHVLU-UHFFFAOYSA-N newbouldiamide Natural products CCCCCCCCCCCCCCCCCCCC(O)C(O)C(O)C(CO)NC(=O)CCCCCCCCCCCCCCCCC VVGIYYKRAMHVLU-UHFFFAOYSA-N 0.000 description 1
- 229910052757 nitrogen Inorganic materials 0.000 description 1
- 238000010606 normalization Methods 0.000 description 1
- 150000002888 oleic acid derivatives Chemical class 0.000 description 1
- -1 or other Chemical compound 0.000 description 1
- FXQOOHFUXNQCKQ-UHFFFAOYSA-N oxacyclooctadecan-2-one Chemical compound O=C1CCCCCCCCCCCCCCCCO1 FXQOOHFUXNQCKQ-UHFFFAOYSA-N 0.000 description 1
- 125000000913 palmityl group Chemical group [H]C([*])([H])C([H])([H])C([H])([H])C([H])([H])C([H])([H])C([H])([H])C([H])([H])C([H])([H])C([H])([H])C([H])([H])C([H])([H])C([H])([H])C([H])([H])C([H])([H])C([H])([H])C([H])([H])[H] 0.000 description 1
- 210000000496 pancreas Anatomy 0.000 description 1
- 239000010452 phosphate Substances 0.000 description 1
- 229940085991 phosphate ion Drugs 0.000 description 1
- 238000002360 preparation method Methods 0.000 description 1
- 230000002265 prevention Effects 0.000 description 1
- 238000003672 processing method Methods 0.000 description 1
- 238000004393 prognosis Methods 0.000 description 1
- 102000004169 proteins and genes Human genes 0.000 description 1
- 108090000623 proteins and genes Proteins 0.000 description 1
- 230000005588 protonation Effects 0.000 description 1
- 238000010833 quantitative mass spectrometry Methods 0.000 description 1
- 125000001453 quaternary ammonium group Chemical group 0.000 description 1
- 238000011472 radical prostatectomy Methods 0.000 description 1
- 230000009467 reduction Effects 0.000 description 1
- 230000002829 reductive effect Effects 0.000 description 1
- 230000001105 regulatory effect Effects 0.000 description 1
- 238000002271 resection Methods 0.000 description 1
- 210000003296 saliva Anatomy 0.000 description 1
- 238000005070 sampling Methods 0.000 description 1
- 229920006395 saturated elastomer Polymers 0.000 description 1
- 238000007423 screening assay Methods 0.000 description 1
- CDAISMWEOUEBRE-UHFFFAOYSA-N scyllo-inosotol Natural products OC1C(O)C(O)C(O)C(O)C1O CDAISMWEOUEBRE-UHFFFAOYSA-N 0.000 description 1
- 229960001153 serine Drugs 0.000 description 1
- 210000002027 skeletal muscle Anatomy 0.000 description 1
- 210000003491 skin Anatomy 0.000 description 1
- 210000002460 smooth muscle Anatomy 0.000 description 1
- 239000007787 solid Substances 0.000 description 1
- 239000007790 solid phase Substances 0.000 description 1
- 238000007619 statistical method Methods 0.000 description 1
- 125000003696 stearoyl group Chemical group O=C([*])C([H])([H])C([H])([H])C([H])([H])C([H])([H])C([H])([H])C([H])([H])C([H])([H])C([H])([H])C([H])([H])C([H])([H])C([H])([H])C([H])([H])C([H])([H])C([H])([H])C([H])([H])C([H])([H])C([H])([H])[H] 0.000 description 1
- 210000002784 stomach Anatomy 0.000 description 1
- 125000001424 substituent group Chemical group 0.000 description 1
- 238000000194 supercritical-fluid extraction Methods 0.000 description 1
- 239000004094 surface-active agent Substances 0.000 description 1
- 238000012353 t test Methods 0.000 description 1
- 230000001225 therapeutic effect Effects 0.000 description 1
- 238000012546 transfer Methods 0.000 description 1
- 238000000825 ultraviolet detection Methods 0.000 description 1
- 210000002700 urine Anatomy 0.000 description 1
- 238000010200 validation analysis Methods 0.000 description 1
- 229960000834 vinyl ether Drugs 0.000 description 1
- 238000003809 water extraction Methods 0.000 description 1
Images


Classifications
-
- C—CHEMISTRY; METALLURGY
- C07—ORGANIC CHEMISTRY
- C07F—ACYCLIC, CARBOCYCLIC OR HETEROCYCLIC COMPOUNDS CONTAINING ELEMENTS OTHER THAN CARBON, HYDROGEN, HALOGEN, OXYGEN, NITROGEN, SULFUR, SELENIUM OR TELLURIUM
- C07F9/00—Compounds containing elements of Groups 5 or 15 of the Periodic System
- C07F9/02—Phosphorus compounds
- C07F9/06—Phosphorus compounds without P—C bonds
- C07F9/08—Esters of oxyacids of phosphorus
- C07F9/09—Esters of phosphoric acids
- C07F9/10—Phosphatides, e.g. lecithin
-
- C—CHEMISTRY; METALLURGY
- C07—ORGANIC CHEMISTRY
- C07F—ACYCLIC, CARBOCYCLIC OR HETEROCYCLIC COMPOUNDS CONTAINING ELEMENTS OTHER THAN CARBON, HYDROGEN, HALOGEN, OXYGEN, NITROGEN, SULFUR, SELENIUM OR TELLURIUM
- C07F9/00—Compounds containing elements of Groups 5 or 15 of the Periodic System
- C07F9/02—Phosphorus compounds
- C07F9/06—Phosphorus compounds without P—C bonds
- C07F9/08—Esters of oxyacids of phosphorus
- C07F9/09—Esters of phosphoric acids
- C07F9/091—Esters of phosphoric acids with hydroxyalkyl compounds with further substituents on alkyl
-
- G—PHYSICS
- G01—MEASURING; TESTING
- G01N—INVESTIGATING OR ANALYSING MATERIALS BY DETERMINING THEIR CHEMICAL OR PHYSICAL PROPERTIES
- G01N33/00—Investigating or analysing materials by specific methods not covered by groups G01N1/00 - G01N31/00
- G01N33/48—Biological material, e.g. blood, urine; Haemocytometers
- G01N33/483—Physical analysis of biological material
- G01N33/487—Physical analysis of biological material of liquid biological material
- G01N33/49—Blood
-
- G—PHYSICS
- G01—MEASURING; TESTING
- G01N—INVESTIGATING OR ANALYSING MATERIALS BY DETERMINING THEIR CHEMICAL OR PHYSICAL PROPERTIES
- G01N27/00—Investigating or analysing materials by the use of electric, electrochemical, or magnetic means
-
- G—PHYSICS
- G01—MEASURING; TESTING
- G01N—INVESTIGATING OR ANALYSING MATERIALS BY DETERMINING THEIR CHEMICAL OR PHYSICAL PROPERTIES
- G01N33/00—Investigating or analysing materials by specific methods not covered by groups G01N1/00 - G01N31/00
- G01N33/48—Biological material, e.g. blood, urine; Haemocytometers
- G01N33/483—Physical analysis of biological material
-
- G—PHYSICS
- G01—MEASURING; TESTING
- G01N—INVESTIGATING OR ANALYSING MATERIALS BY DETERMINING THEIR CHEMICAL OR PHYSICAL PROPERTIES
- G01N33/00—Investigating or analysing materials by specific methods not covered by groups G01N1/00 - G01N31/00
- G01N33/48—Biological material, e.g. blood, urine; Haemocytometers
- G01N33/50—Chemical analysis of biological material, e.g. blood, urine; Testing involving biospecific ligand binding methods; Immunological testing
- G01N33/53—Immunoassay; Biospecific binding assay; Materials therefor
- G01N33/574—Immunoassay; Biospecific binding assay; Materials therefor for cancer
- G01N33/57407—Specifically defined cancers
- G01N33/57434—Specifically defined cancers of prostate
-
- G—PHYSICS
- G01—MEASURING; TESTING
- G01N—INVESTIGATING OR ANALYSING MATERIALS BY DETERMINING THEIR CHEMICAL OR PHYSICAL PROPERTIES
- G01N33/00—Investigating or analysing materials by specific methods not covered by groups G01N1/00 - G01N31/00
- G01N33/48—Biological material, e.g. blood, urine; Haemocytometers
- G01N33/50—Chemical analysis of biological material, e.g. blood, urine; Testing involving biospecific ligand binding methods; Immunological testing
- G01N33/68—Chemical analysis of biological material, e.g. blood, urine; Testing involving biospecific ligand binding methods; Immunological testing involving proteins, peptides or amino acids
- G01N33/6803—General methods of protein analysis not limited to specific proteins or families of proteins
- G01N33/6848—Methods of protein analysis involving mass spectrometry
-
- G—PHYSICS
- G01—MEASURING; TESTING
- G01N—INVESTIGATING OR ANALYSING MATERIALS BY DETERMINING THEIR CHEMICAL OR PHYSICAL PROPERTIES
- G01N2333/00—Assays involving biological materials from specific organisms or of a specific nature
- G01N2333/435—Assays involving biological materials from specific organisms or of a specific nature from animals; from humans
- G01N2333/745—Assays involving non-enzymic blood coagulation factors
-
- G—PHYSICS
- G01—MEASURING; TESTING
- G01N—INVESTIGATING OR ANALYSING MATERIALS BY DETERMINING THEIR CHEMICAL OR PHYSICAL PROPERTIES
- G01N2405/00—Assays, e.g. immunoassays or enzyme assays, involving lipids
- G01N2405/04—Phospholipids, i.e. phosphoglycerides
-
- G—PHYSICS
- G01—MEASURING; TESTING
- G01N—INVESTIGATING OR ANALYSING MATERIALS BY DETERMINING THEIR CHEMICAL OR PHYSICAL PROPERTIES
- G01N30/00—Investigating or analysing materials by separation into components using adsorption, absorption or similar phenomena or using ion-exchange, e.g. chromatography or field flow fractionation
- G01N30/02—Column chromatography
- G01N30/62—Detectors specially adapted therefor
- G01N30/72—Mass spectrometers
- G01N30/7233—Mass spectrometers interfaced to liquid or supercritical fluid chromatograph
Definitions
- the present invention relates to small molecules or metabolites that are found to have significantly different abundances or intensities between clinically diagnosed prostate cancer-positive patients and normal patients.
- the present invention also relates to methods for diagnosing prostate cancer, or the risk of developing prostate cancer.
- Prostate cancer will affect one in every six men during their lifetime, with over 200,000 diagnoses and 30,000 deaths per year in the U.S. alone (1). It is the second leading cause of death due to cancer in men.
- Current screening methods for prostate cancer include the prostate-specific antigen (PSA) test, which detects the levels of prostate-specific antigen in a blood sample, and digital rectal examination (DRE).
- PSA prostate-specific antigen
- DRE digital rectal examination
- 60 to 70% of at-risk men in the U.S. have undergone PSA testing since the test was adopted, prostate cancer death rates have only slightly decreased. This is largely due to two reasons: 1) the fact that PSA testing fails to identify a subset of aggressive cancers, and 2) that only about 30% of men with a positive PSA test have a positive biopsy.
- prostate cancer biomarker(s) would therefore be suitable for early detection, as well as have the ability to predict disease aggressiveness and ideally to be able to monitor disease progression during therapy or post surgery.
- PSA is recognized as the best available serum marker for prostate cancer, however, there is substantial room for improvement.
- the impact of PSA testing, beginning in the early 1990s, can be seen by decreases in the numbers of men diagnosed with metastasis, concurrent with overall decreased mortality (2).
- PSA screening increased awareness of prostate cancer, which ultimately stimulated the analysis of more biopsies.
- Calculating the performance characteristics (sensitivity and specificity) of the PSA test is difficult because of ethnicity-related difference in incidence, and that in most studies, the percentage of biopsies performed is higher than what would normally be performed in clinical practice.
- Diagnosis is a complex process, which involves integrating the results of a physical examination, a PSA test, the Gleason grade (by assessing glandular architecture at biopsy) and possibly other lab tests.
- the claimed invention describes the discovery of molecules present in serum samples which show a differential pattern of abundances between prostate cancer patients and normal individuals.
- the present invention relates to small molecules or metabolites that are found to have significantly different abundances or intensities between clinically diagnosed prostate cancer-positive patients and normal patients.
- the present invention also relates to methods for diagnosing prostate cancer, or the risk of developing prostate cancer.
- the present invention provides a method for identifying, validating, and implementing a high-throughput screening (HTS) assay for the diagnosis of a health-state indicative of prostate cancer.
- the method encompasses the analysis of prostate cancer-specific and normal biological samples using non-targeted FTMS technology to identify all statistically significant metabolite features which differ between normal and prostate cancer-positive biological samples, followed by the selection of the optimal feature subset using statistics and chemical properties of the molecules, and characterization of the feature set using methods including, but not limited to, chromatographic separation, mass spectrometry (MS/MS), and nuclear magnetic resonance (NMR), for the purposes of:
- the present invention further provides a method for the diagnosis of prostate cancer or the risk of developing prostate cancer in humans by measuring the levels of specific small molecules present in a sample and comparing them to “normal” reference levels.
- the methods measure the intensities of specific small molecules, also referred to as metabolites, in the sample from the patient and compare these intensities to the intensities observed in a population of healthy individuals.
- the present invention provides a method of identifying one or more than one metabolite marker for diagnosing prostate cancer, comprising the steps of:
- the metabolite markers are selected from the metabolites listed in Table 1, or any combination thereof.
- the method may further comprise selecting a minimal number of metabolite markers needed for optimal diagnosis.
- the high resolution mass spectrometer may be a Fourier Transform Ion Cyclotron Resonance Mass Spectrometer (FTMS).
- the present invention also provides a method for diagnosing prostate cancer or the risk of prostate cancer in a patient, the method comprising the steps of:
- the one or more than one metabolite marker is selected from the metabolites listed in Table 1, or any combination thereof.
- the diagnostic method above may comprise analyzing the sample by liquid chromatography mass spectrometry (LC-MS) in step b).
- step b) may comprise analyzing the sample by either liquid chromatography or direct injection followed by linear ion trap tandem mass spectrometry.
- the one or more than one reference sample may be a plurality of samples obtained from control individuals; one or more than one baseline sample obtained from the patient at an earlier date; or a combination thereof.
- a method for diagnosing prostate cancer or the risk of prostate cancer in a patient comprising the steps of:
- the diagnostic method above may comprise one or more than one metabolite marker selected from metabolites listed in Table 1, or any combination thereof.
- the diagnostic method above may comprise analyzing the sample by liquid chromatography mass spectrometry (LC-MS) in step b).
- step b) may comprise analyzing the sample by either direct injection or liquid chromatography and linear ion trap tandem mass spectrometry.
- the one or more than one reference sample may be a plurality of samples obtained from control individuals; one or more than one baseline sample obtained from the patient at an earlier date; or a combination thereof.
- the present invention further provides a method for evaluating the efficacy of a therapy for treating prostate cancer in a patient, comprising:
- step b) may comprise analyzing the sample by direct injection or liquid chromatography and linear ion trap tandem mass spectrometry.
- the one or more than one reference sample may be a plurality of samples obtained from control individuals; one or more than one pre-therapy baseline sample obtained from the patient; or a combination thereof.
- a method for evaluating the efficacy of a therapy for treating prostate cancer in a patient comprising:
- step b) may comprise analyzing the sample by direct injection or liquid chromatography and linear ion trap tandem mass spectrometry.
- the one or more than one reference sample may be a plurality of samples obtained from control individuals; one or more than one pre-therapy baseline sample obtained from the patient; or a combination thereof.
- the methods described herein may be combined with other methods for monitoring prostate cancer, for example the PSA test.
- the one or more than one metabolite marker may be selected from the group consisting of lysophospholipids, including lysophosphatidylcholines, lysophosphatidylethanolamines, lysophosphatidyldimethylethanolamines, lysophosphatidylserines, lysosphingosylphosphorylcholines, lysophosphatidylglycerols lysophosphatidylinositols, platelet activating factors (PAFs), and combinations thereof.
- lysophospholipids including lysophosphatidylcholines, lysophosphatidylethanolamines, lysophosphatidyldimethylethanolamines, lysophosphatidylserines, lysosphingosylphosphorylcholines, lysophosphatidylglycerols lysophosphatidylinositols, platelet activ
- the one or more than one metabolite marker may comprise metabolites with accurate masses measured in Daltons of, or substantially equivalent to, a) 495.3328, b) 517.3148, c) 519.3328, d) 521.3480, e) 523.3640, f) 541.3148, g) 545.3460, h) 481.3171, i) 531.3123, j) 541.3422, k) 555.3101, l) 565.3394, m) 567.3546, and n) 569.3687.
- the quantifying data for the one or more than one metabolite is compared, these metabolites are observed to be decreased in patients with prostate cancer.
- a ratio for the one or more than one metabolite to the internal control metabolite is compared, the ratio of metabolite to internal control metabolite is decreased in patients with prostate cancer.
- the metabolites a) to g) are lysophosphatidylcholine-related compounds and metabolites h) to n) are putatively N,N-dimethyl lysophosphatidylethanolamine-related compounds.
- Metabolites a) to n) may be further characterized by an MS/MS spectrum as shown in a) FIG. 7 , and/or as described in Table 3; b) FIG. 8 , and/or as described in Table 4; c) FIG. 9 , and/or as described in Table 5; d) FIG. 10 , and/or as described in Table 6; e) FIG. 11 , and/or as described in Table 7; f) FIG.
- FIG. 12 and/or as described in Table 8; g) FIG. 13 , and/or as described in Table 9; h) FIG. 14 , and/or as described in Table 12; i) FIG. 15 , and/or as described in Table 13; j) FIG. 16 , and/or as described in Table 14; k) FIG. 17 , and/or as described in Table 15; l) FIG. 18 , and/or as described in Table 16; m) FIG. 19 , and/or as described in Table 17; and n) FIG. 20 , and/or as described in Table 18, respectively.
- the one or more than one metabolite above may be further characterized by molecular formula a) C 24 H 50 NO 7 P, b) C 26 H 48 NO 7 P, c) C 26 H 50 NO 7 P, d) C 26 H 52 NO 7 P, e) C 26 H 54 NO 7 P, f) C 28 H 48 NO 7 P, g) C 28 H 52 NO 7 P, h) C 23 H 48 NO 7 P, i) C 30 H 46 NO 5 P, j) C 25 H 52 NO 9 P, k) C 25 H 50 NO 10 P, l) C 27 H 52 NO 9 P, m) C 27 H 54 NO 9 P, and n) C 27 H 56 NO 9 P, respectively.
- the structures of the one or more than one metabolite may be characterized as follows:
- the present invention also provides novel compounds. These compounds are selected from the group consisting of the metabolites with accurate masses measured in Daltons of, or substantially equivalent to, a) 531.3123, b) 541.3422, c) 555.3101, d) 565.3394, e) 567.3546, and f) 569.3687.
- the compounds may also be further characterized by molecular formula a) C 30 H 46 NO 5 P, b) C 25 H 52 NO 9 P, c) C 25 H 50 NO 10 P, d) C 27 H 52 NO 9 P, e) C 27 H 54 NO 9 P, and f) C 27 H 56 NO 9 P, respectively.
- the compounds described above may be characterized by the putative structures
- novel compounds of the present invention may be used for the diagnosis of prostate cancer, or for evaluating the efficacy of treatment of prostate cancer in a patient.
- the present invention may significantly impact the ability to detect prostate cancer or the risk of developing prostate cancer, and may save lives.
- the statistical performance of a test based on these samples suggests that the test will outperform the PSA test, the only other serum-based diagnostic test for prostate cancer.
- a combination of the methods described herein and the PSA test may improve the overall diagnostic performance of each test.
- HTS assays can be used for the following, wherein the specific “health-state” refers to, but is not limited to prostate cancer:
- FIG. 1 shows a summary of the steps involved in the discovery, identification and characterization of metabolites, including those relating to lysophospholipid species, which are associated with the presence of prostate cancer.
- FIG. 2 shows a principle component analysis (PCA) plot generated from the 492 masses with p-values less than 0.05. Each point on the plot represents a single patient sample, while the dotted line represents the boundary between which most of the prostate cancer subjects (in black) and the controls (grey), can be separated.
- PCA principle component analysis
- FIG. 3 shows a PCA plot generated from a subset of 14 masses selected from the 492 with p-values ⁇ 0.05. A high degree of discrimination between the prostate cancer subjects (black points) and the control subjects (grey points) is evident using only the 14 masses. The dotted line shows the boundary between the two cohorts, which when used as a cutoff value results in 84% sensitivity (84% of cancers detected) and 100% specificity (no controls being classified as cancer, or false positives).
- FIG. 5 shows a series of extracted mass spectra for metabolites eluting between 16 and 18 minutes of chromatographic separation on HPLC, as detected using time-of-flight (TOF) MS.
- the box indicates a region of metabolite masses detected between approximately 450 and 600 daltons in control serum (A), but absent from prostate cancer-positive serum (B).
- the lower panel (C) indicates the net difference between the control and prostate cancer spectra.
- FIG. 7 shows the MS/MS extracted mass spectra for 495.3328 (496.3401 [M+H]), at collision energy voltages of 20 (A), 35 (B) and 50 (C) volts, respectively.
- FIG. 8 shows the MS/MS extracted mass spectra for 517.3148 (518.3219 [M+H]), at collision energy voltages of 20 (A), 35 (B) and 50 (C) volts, respectively.
- FIG. 9 shows the MS/MS extracted mass spectra for 519.3328 (520.3401 [M+H]), at collision energy voltages of 20 (A), 35 (B) and 50 (C) volts, respectively.
- FIG. 10 shows the MS/MS extracted mass spectra for 521.3480 (522.3554 [M+H]), at collision energy voltages of 20 (A), 35 (B) and 50 (C) volts, respectively.
- FIG. 11 shows the MS/MS extracted mass spectra for 523.3640 (524.3713 [M+H]), at collision energy voltages of 20 (A), 35 (B) and 50 (C) volts, respectively.
- FIG. 12 shows the MS/MS extracted mass spectra for 541.3148 (542.3219 [M+H]), at collision energy voltages of 20 (A), 35 (B) and 50 (C) volts, respectively.
- FIG. 13 shows the MS/MS extracted mass spectra for 545.3460 (546.3534 [M+H]), at collision energy voltages of 20 (A), 35 (B) and 50 (C) volts, respectively.
- FIG. 14 shows the MS/MS extracted mass spectra for 481.3171 (480.3091 [M ⁇ H]), at collision energy voltages of 20 (A), 35 (B) and 50 (C) volts, respectively.
- FIG. 15 shows the MS/MS extracted mass spectra for 531.3123 (530.3035 [M ⁇ H]), at collision energy voltages of 20 (A), 35 (B) and 50 (C) volts, respectively.
- FIG. 16 shows the MS/MS extracted mass spectra for 541.3422 (540.3335 [M ⁇ H]), at collision energy voltages of 20 (A), 35 (B) and 50 (C) volts, respectively.
- FIG. 17 shows the MS/MS extracted mass spectra for 555.3101 (554.3013 [M ⁇ H]), at collision energy voltages of 20 (A), 35 (B) and 50 (C) volts, respectively.
- FIG. 18 shows the MS/MS extracted mass spectra for 565.3394 (564.3306 [M ⁇ H]), at collision energy voltages of 20 (A), 35 (B) and 50 (C) volts, respectively.
- FIG. 19 shows the MS/MS extracted mass spectra for 567.3546 (566.3459 [M ⁇ H]), at collision energy voltages of 20 (A), 35 (B) and 50 (C) volts, respectively.
- FIG. 20 shows the MS/MS extracted mass spectra for 569.3687 (568.3598 [M ⁇ H]), at collision energy voltages of 20 (A), 35 (B) and 50 (C) volts, respectively.
- FIG. 21 shows A), the list of the parent-daughter ion transitions used for the positive ESI triple-quadrupole HTS method as well as the R-squared correlation coefficient resulting from calculation of linearity across five diluted samples. B), Standard curve for transition 496.3/184.2a1. C). The average ratio (biomarker:IS peak area) for each transition in the prostate (black) and control (grey) subjects.
- FIG. 22 shows A), a scatter plot of the positive ESI HTS patient scores for 147 male controls (grey squeares) and 24 prostate cancer patients (black triangles). B), frequency histogram showing the distribution of the control population (grey) and prostate cancer subjects (black) according to binned patient scores.
- FIG. 23 shows A), the list of the parent-daughter ion transitions used for the negative ESI triple-quadrupole HTS method as well as the R-squared correlation coefficient resulting from calculation of linearity across five diluted samples.
- B Standard curve for transition 480.3/255.4a1.
- C The average ratio (biomarker:IS peak area) for each transition in the prostate (black) and control (grey) subjects.
- FIG. 24 shows A), a scatter plot of the negative ESI HTS patient scores for 147 male controls (grey squeares) and 24 prostate cancer patients (black triangles). B), frequency histogram showing the distribution of the control population (grey) and prostate cancer subjects (black) according to binned patient scores.
- the present invention relates to small molecules or metabolites that are found to have significantly different abundances or intensities between clinically diagnosed prostate cancer-positive patients and normal patients.
- the present invention also relates to methods for diagnosing prostate cancer, or the risk of developing prostate cancer.
- the present invention provides novel methods for discovering, validating, and implementing a diagnosis method for prostate cancer.
- a method for identifying specific biomarkers for diagnosing prostate cancer comprising the steps of: introducing one or more than one sample from one or more than one patient with prostate cancer, said sample containing a plurality of metabolites into a high resolution mass spectrometer (for example, and without wishing to be limiting, a Fourier Transform Ion Cyclotron Resonance Mass Spectrometer (FTMS)); obtaining, identifying and quantifying data for the metabolites; creating a database of said quantifying data; comparing the quantifying data from the sample with corresponding data obtained from one or more than one sample from a control patient; identifying one or more than one metabolites that differ.
- the metabolite markers identified using the method of the present invention may include the metabolites listed in Table 1.
- the method may further comprise selecting the minimal number of metabolite markers needed for optimal diagnosis.
- a group of patients representative of the health state i.e., a particular disease
- a group of “normal” or “control” counterparts i.e., individuals that do not suffer from the particular health state
- Biological samples taken from the patients in the particular health state can then be compared to the same samples taken from the normal population as well as to patients in similar health-state category in the hopes of identifying biochemical differences between the two groups, by analyzing the biochemicals present in the samples using analytical methods including, but not limited to, FTMS and/or LC-MS.
- the method for the discovery of metabolite markers as described above may be done using non-targeted metabolomic strategies or methods. Multiple non-targeted metabolomics strategies have been described in the scientific literature including NMR (6), GC-MS (7), LC-MS (8), and FTMS strategies (9-11).
- the metabolic profiling strategy employed for the discovery of differentially expressed metabolites in the present invention was the non-targeted FTMS strategy by Phenomenome Discoveries [21, 24-27; see also US Published Application No. 2004-0029120 A1, Canadian Application No. 2,298,181, and WO 0157518].
- Non-targeted analysis involves the measurement of as many molecules in a sample as possible, without any prior knowledge or selection of components prior to the analysis.
- the present invention uses a non-targeted method to identify metabolite components in serum samples that differ between individuals with prostate cancer and control individuals (i.e., individuals that do not have prostate cancer).
- metabolite profiling strategies could be used to discover some or all of the differentially regulated metabolites disclosed in the present invention and that the metabolites described herein, however discovered or measured, represent unique chemical entities that are independent of the analytical technology that may be used to detect and measure them.
- other methods of metabolite detection could be used, for example other MS-based platforms, ELISAs, colorimetric assays, etc.
- the present invention also provides a method for diagnosing prostate cancer or the risk of developing prostate cancer in a patient, the method comprising the steps of:
- the step of analyzing the sample may comprise analyzing the sample using a mass spectrometer (MS).
- MS mass spectrometer
- mass spectrometer could be of the FTMS, orbitrap, time-of-flight (TOF) or quadrupole types.
- the mass spectrometer could be equipped with an additional pre-detector mass filter.
- Q-FTMS quadrupole-FTMS
- Q-TOF quadrupole-TOF
- TQ or QQQ triple quadrupole
- MSn refers to the situation where the parent ion is fragmented by collision induced dissociation (CID) or other fragmentation procedures to create fragment ions, and then one or more than one of said fragments are detected by the mass spectrometer. Such fragments can then be further fragmented to create further fragments.
- the sample could be introduced into the mass spectrometer using a liquid or gas chromatographic system or by direct injection.
- any type of biological sample that originates from anywhere within the body, for example but not limited to, blood (serum/plasma), CSF, urine, stool, breath, saliva, or biopsy of any solid tissue including tumor, adjacent normal, smooth and skeletal muscle, adipose tissue, liver, skin, hair, brain, kidney, pancreas, lung, colon, stomach, or other may be used.
- samples that are serum. While the term “serum” is used herein, those skilled in the art will recognize that plasma or whole blood or a sub-fraction of whole blood may also be used.
- the biological samples may be obtained in both normal and prostate cancer-positive groups from a diverse population of individuals, ranging in age, ethnicity, weight, occupation, and displaying varying non-prostate cancer-related health-states. Choosing subjects in this way introduces more variability into a dataset, however, reduces potential confounding bias that ultimately results in a more robust set of biomarkers (since it can still detect disease in the presence of many other variables).
- a blood sample when drawn from a patient there are several ways in which the sample can be processed.
- the range of processing can be as little as none (i.e. frozen whole blood) or as complex as the isolation of a particular cell type.
- the most common and routine procedures involve the preparation of either serum or plasma from whole blood. All blood sample processing methods, including spotting of blood samples onto solid-phase supports, such as filter paper or other immobile materials, are also contemplated by the present invention.
- the processed blood or serum or sample described above may then be further processed to make it compatible with the methodical analysis technique to be employed in the detection and measurement of the metabolites contained within the processed serum or blood sample.
- the types of processing can range from as little as no further processing to as complex as differential extraction and chemical derivatization.
- Extraction methods could include sonication, soxhlet extraction, microwave assisted extraction (MAE), supercritical fluid extraction (SFE), accelerated solvent extraction (ASE), pressurized liquid extraction (PLE), pressurized hot water extraction (PHWE) and/or surfactant assisted extraction (PHWE) in common solvents such as methanol, ethanol, mixtures of alcohols and water, or organic solvents such as ethyl acetate or hexane.
- a method of particular interest for extracting metabolites for FTMS non-targeted analysis as well as for direct injection on triple quadrupole mass spectrometers, is to perform a liquid/liquid extraction whereby non-polar metabolites dissolve in an organic solvent and polar metabolites dissolve in an aqueous solvent.
- the extracted samples may be analyzed using any suitable method known in the art.
- extracts of biological samples are amenable to analysis on essentially any mass spectrometry platform, either by direct injection or following chromatographic separation.
- Typical mass spectrometers are comprised of a source which ionizes molecules within the sample, and a detector for detecting the ionized molecules or fragments of molecules.
- Non-limiting examples of common sources include electron impact, electrospray ionization (ESI), atmospheric pressure chemical ionization (APCI), atmospheric pressure photo ionization (APPI), matrix assisted laser desorption ionization (MALDI), surface enhanced laser desorption ionization (SELDI), and derivations thereof.
- Common mass separation and detection systems can include quadrupole, quadrupole ion trap, linear ion trap, time-of-flight (TOF), magnetic sector, ion cyclotron (FTMS), Orbitrap, and derivations and combinations thereof.
- TOF time-of-flight
- FTMS ion cyclotron
- Orbitrap derivations and combinations thereof.
- the advantage of FTMS over other MS-based platforms is its high resolving capability that allows for the separation of metabolites differing by only hundredths of a Dalton, many which would be missed by lower resolution instruments.
- metabolic it is meant specific small molecules, the levels or intensities of which are measured in a sample, and that may be used as markers to diagnose a disease state. These small molecules may also be referred to herein as “metabolite marker”, “metabolite component”, “biomarker”, “biochemical marker”, or “metabolite feature”.
- the metabolites are generally characterized by their accurate mass, as measured by mass spectrometry technique used in the above method.
- the accurate mass may also be referred to as “accurate neutral mass” or “neutral mass”.
- the accurate mass of a metabolite is given herein in Daltons (Da), or a mass substantially equivalent thereto. By “substantially equivalent thereto”, it is meant that a +/ ⁇ 5 ppm (part per million) difference in the accurate mass would indicate the same metabolite, as would be recognized by a person of skill in the art.
- Ppm is defined as 1,000,000* ⁇ m accuracy/mmeasured (for example, theoretical mass: 1000, measured mass: 999.9 error: 100 ppm).
- the accurate mass is given as the mass of the neutral metabolite.
- the ionization of the metabolites which occurs during analysis of the sample, the metabolite will cause either a loss or gain of one or more hydrogen atoms and a loss or gain of an electron. This changes the accurate mass to the “ionized mass”, which differs from the accurate mass by the mass of hydrogens and electrons lost or gained during ionization. Unless otherwise specified, the accurate neutral mass will be referred to herein.
- Data is collected during analysis and quantifying data for one or more than one metabolite is obtained.
- Quantifying data is obtained by measuring the levels or intensities of specific metabolites present in a sample. The measurement itself could be a relative measurement (e.g. comparison of intensity to another sample or distribution), or a quantitative measurement (e.g. a concentration such as X mg/ml).
- the quantifying data is compared to corresponding data from one or more than one reference sample.
- the “reference sample”, also referred to herein as a “control sample”, is any suitable reference sample for the particular disease state.
- the reference sample may be a sample from a control individual, i.e., a person not suffering from prostate cancer (also referred to herein as a “normal”, “control”, or “reference” individual or patient); the reference sample may also be a sample obtained from a patient with prostate cancer.
- more than one reference sample may be used for comparison to the quantifying data.
- the one or more than one reference sample may be a first reference sample obtained from a control individual.
- the one or more than one reference sample may also be a sample obtained from a patient at an earlier date; this would allow longitudinal monitoring of a patient's health state throughout their lifetime. Such samples could be collected over successive intervals of time.
- the reference sample could also be obtained from a patient with prostate cancer prior to therapy (i.e., pre-therapy) in order to monitor the efficacy of the therapy administered.
- pre-therapy i.e., pre-therapy
- the present invention also provides novel compounds, identified using the methods of the present invention.
- the novel compounds may be used as metabolite markers in the diagnosis of prostate cancer or the risk of developing prostate cancer, as described above.
- the compounds may be selected from the metabolites listed in Table 1, or any combination thereof.
- An optimal panel of metabolites may be selected from the group of 492 metabolites shown in Table 1.
- the optimal panel of metabolite markers may be metabolites with accurate masses (measured in Daltons) of 519.3328, 541.3148, 545.3460, 555.3101, 541.3422, 565.3394, 521.3480, 517.3148, 567.3546, 523.3640, 531.3123, 481.3171, 495.3328, 569.3687, where a +/ ⁇ 5 ppm difference would indicate the same metabolite.
- the 14 metabolites just described when measured in serum or tissue, show a lower concentration in prostate cancer-positive subjects relative to control (disease-free) individuals.
- the 14 metabolite markers described above can be categorized into one of two groups, based on their detection in an aqueous extract and their propensity to ionize either positively or negatively.
- the 14 metabolites described above relate to metabolites of the lysophospholipid class, for example, lysophosphatidylcholine, lysophosphatidylethanolamines, lysophosphatidyldimethylethanolamines, lysophosphatidylserines, lysosphingosylphosphorylcholines, lysophosphatidylglycerols, lysophosphatidylinositols, platelet activating factors (PAFs), and combinations thereof.
- lysophosphatidylcholine for example, lysophosphatidylcholine, lysophosphatidylethanolamines, lysophosphatidyldimethylethanolamines, lysophosphatidylserines, lysosphingosylphosphorylcholines, lysophosphatidylglycerols, lysophosphatidylinositols
- the concentration of specific metabolites described above, including lysophospholipid species, is detected in order to diagnose prostate cancer or the risk of prostate cancer. Any combination of the above metabolites could be measured simultaneously, in a serial manner, or in different combinations to arrive at a diagnostic output.
- Structural characterization of the above metabolites may be carried out using methods well known to those skilled in the area.
- the principal characteristics that may be used to characterize the metabolites may include, but are not limited to accurate mass, molecular formula, polarity, acid/base properties, NMR spectra, and MS/MS or MSn spectra. Techniques used to determine these characteristics include, but are not limited to reverse phase LC-MS using a C18 column followed by analysis by MS, MS/MS fragmentation using collision induced dissociation (CID), NMR, and extraction.
- the data obtained can be used as fingerprints or unique identifiers of a particular metabolite under the experimental conditions specified. Any or all of the metabolites described by the present application may be fingerprinted under various conditions to provide additional information on the metabolites, for example, the structure or nature of the molecule.
- metabolites within the optimal panel of metabolite markers described above can be further characterized by their MS/MS fragmentation patterns resulting from collision induced dissociation.
- the metabolites are molecules related to lysophospholipids. Specifically these include, but are not limited to, lysophosphatidylcholine (lysoPC), lysophosphatidylethanolamine (lysoPE), lysophosphatidyldimethylethanolamine (lysoPdmE), lysophosphatidylserine (lysoPS), lysophosphatidylinositol (lysoPI), and lysophosphatidylglycerol (lysoPG), and platelet activating factors (PAFs), wherein the glycerol backbone is attached to a fatty acid at either SN1 or SN2, for example, 16:0, 18:0, 18:1, 18:2, 18:3, 20:3, 20:4, 20:5, 22:6, ceramide, or other, and a phosphate-containing choline (lysoPC), lysophosphatidylethanolamine (lysoPE),
- PC and PE represent the two major lipid components of biological membranes.
- PC and PE comprise a glycerol backbone containing a phosphate group attached to ethanolamine or choline at the SN3 position, and two fatty acids bound to the SN1 and SN2 positions through an acyl, ether, or vinyl-ether linkages.
- the fatty acids can be either saturated (more common at SN1), or unsaturated (more common at SN2).
- a lysophospholipid such as lysoPC is generated along with a free fatty acid. Lysophospholipids have been implicated in numerous biological pathways and diseases, such as calcium signaling, atherosclerosis and inflammation (12).
- the present invention also provides high-throughput methods for the diagnosis of prostate cancer.
- the method involves fragmentation of the parent molecule; in a non-limiting example, this may be accomplished by a Q-TrapTM system.
- Detection of the metabolites may be performed using one of various assay platforms, including calorimetric chemical assays (UV, or other wavelength), antibody-based enzyme-linked immunosorbant assays (ELISAs), chip-based and polymerase-chain reaction for nucleic acid detection assays, bead-based nucleic-acid detection methods, dipstick chemical assays or other chemical reaction, image analysis such as magnetic resonance imaging (MRI), positron emission tomography (PET) scan, computerized tomography (CT) scan, nuclear magnetic resonance (NMR), and various mass spectrometry-based systems.
- MRI magnetic resonance imaging
- PET positron emission tomography
- CT computerized tomography
- NMR nuclear magnetic resonance
- a method for diagnosing prostate cancer or the risk of prostate cancer in a patient comprising the steps of:
- the step of analyzing the sample may comprise analyzing the sample using a mass spectrometer (MS).
- MS mass spectrometer
- such mass spectrometer could be of the FTMS, orbitrap, time of flight (TOF) or quadrupole types.
- the mass spectrometer could be equipped with an additional pre-detector mass filter.
- Q-FTMS quadrupole-FTMS
- Q-TOF quadrupole-TOF
- TQ or QQQ triple quadrupole
- MSn refers to the situation where the parent ion is fragmented by collision induced dissociation (CID) or other fragmentation procedures to create fragment ions, and then one or more than one of said fragments are detected by the mass spectrometer. Such fragments can then be further fragmented to create further fragments.
- the sample could be introduced into the mass spectrometer using a liquid or gas chromatographic system or by direct injection.
- the one or more than one reference sample may be a first baseline reference sample obtained from a control individual.
- the one or more than one metabolite marker may be selected from the metabolites as listed in Table 1, or the metabolites may be the 14 metabolites described above.
- the “internal control metabolite” refers to an endogenous metabolite naturally present in the patient, provided the metabolite is not associated with the disease and does not vary over disease states; alternatively, the “internal control metabolite” may also refer to an external standard spiked into a serum sample prior to analysis. For example, and without wishing to be limiting, the ratio may be used to determine a diagnostic score for the test subject.
- the measurement of metabolite markers could be taken longitudinally over time in a test subject to determine the change in metabolite concentrations and likelihood of prostate cancer, or risk for the development of prostate cancer.
- the test subject would provide a sample at a start point, essentially establishing a baseline value; the test subject could then provide samples over time which would be compared to the start point sample.
- an increase in the intensity of the 14 metabolites described above would indicate a reduced risk of prostate cancer, while a decrease in the intensity would indicate an increased risk for prostate cancer.
- a method for evaluating the efficacy of a therapy for treating prostate cancer in a patient comprising:
- a ratio for each of the one or more than one metabolite marker to an internal control metabolite may be obtained.
- each ratio of said one or more than one metabolite marker to the internal control metabolite to corresponding data obtained from one or more than one reference sample is compared to evaluate the efficacy of the therapy.
- the step of analyzing may comprise analyzing the sample by liquid chromatography mass spectrometry (LC-MS), or alternatively may comprise analyzing the sample by direct injection or liquid chromatography and linear ion trap tandem mass spectrometry when the method is a high-throughput method.
- LC-MS liquid chromatography mass spectrometry
- therapy or “treatment”
- any suitable course of therapy that may attempt to improve the health state of the patient being evaluated.
- the effect of the particular therapy in improving or degrading the health state of the patient will be measured.
- a person of skill in the art would be capable of determining whether the therapy is effective for treating prostate cancer.
- Such treatment may include, but are not limited to, immunotherapy (for example, Bacillus Calmette-Guerin injection), radical prostatectomy, chemotherapy, radiation therapy, hormone therapy (including antiandrogens), or others.
- the one or more than one reference sample may be any suitable reference sample.
- the reference sample may be a plurality of samples obtained from control individuals or one or more than one pre-therapy baseline sample obtained from the patient; or any combination thereof.
- a pre-therapy baseline sample from the patient is particularly useful, as the variation in metabolites will then be specific to the patient.
- the one or more than one metabolite marker may be selected from the metabolites as listed in Table 1, or the metabolites may be the 14 metabolites described above.
- the efficacy of a therapy as described above is evaluated based on the measurement of the metabolites and comparison to the reference sample, whereby a restoration of the metabolites towards a normal specified range would be indicative of a positive treatment effect.
- a ratio for each of the one or more than one metabolite marker to an internal control metabolite can be obtained in step b); each ratio of the one or more than one metabolite marker to the internal control metabolite could then be compared to corresponding data obtained from one or more than one reference sample in step c).
- the present invention also provides high throughput methods for diagnosis of prostate cancer.
- the method may involve fragmentation of the parent molecule; in a non-limiting example, this may be accomplished by a Q-TrapTM system.
- Detection of the metabolites may be performed using one of various assay platforms, including colorimetric chemical assays (UV, or other wavelength), antibody-based enzyme-linked immunosorbant assays (ELISAs), chip-based and polymerase-chain reaction for nucleic acid detection assays, bead-based nucleic-acid detection methods, dipstick chemical assays or other chemical reaction, image analysis such as magnetic resonance imaging (MRI), positron emission tomography (PET) scan, computerized tomography (CT) scan, nuclear magnetic resonance (NMR), and various mass spectrometry-based systems.
- MRI magnetic resonance imaging
- PET positron emission tomography
- CT computerized tomography
- NMR nuclear magnetic resonance
- the HTS method may involve the measurement of intensity, peak area or summed scans of each selected daughter ion per biomarker, as well as daughter ions for one or more internal standards added to each sample.
- a ratio may then be generated by dividing each biomarker transition by an internal standard transition.
- the internal standard provides an indication of the instrument sensitivity, and allows for the normalization of biomarker transition signals across multiple samplings.
- the ratios generated for the disease-free or healthy population become the defining parameter for the “normal” distribution.
- a validation set of samples comprising normals and prostate-positives are then analyzed and compared to the normal distribution. This results in essentially two distributions, one for the normal population and one for the prostate-positive population.
- a cutoff ratio between the two distributions is then selected to determine the sensitivity and specificity of the biomarker assay.
- any individual or combination of metabolites described herein could be combined with existing cancer markers to arrive at a diagnostic/prognostic output.
- existing cancer markers may include, but are not limited to prostate specific antigen (PSA), carcinoembryonic antigen (CEA), cancer antigen (CA) 19-9, C15-3, or CA125.
- the above methods may provide medical professionals with a test to better determine the appropriate treatment regimen for a subject based upon the stage at which the cancer is detected. Since the diagnostic methods are relatively non-invasive, a large number of otherwise undiagnosed cases could be identified, particularly early cases, for which specific interventions may be administered by medical professionals.
- the methods of the present invention may also be used to detect recurrence of cancer, possibly prior to clinical symptoms of the recurrence. Such knowledge could be subsequently used to properly direct treatment regimens that may have improved chances of preventing the recurrence.
- FIG. 1 An outline of the present invention including each of the examples listed below is shown in FIG. 1 .
- Differentially expressed metabolites are identified in clinically diagnosed prostate cancer-positive patients and normal patients.
- serum samples were obtained from representative populations of healthy prostate cancer-free individuals and of professionally diagnosed prostate cancer-positive patients (SeraCare LifeSciences, Inc).
- the biochemical markers of prostate cancer described below were derived from the analysis of 24 serum samples from prostate cancer-positive patients and 25 serum samples from healthy controls. Samples in both groups were from a diverse population of individuals, ranging in age, ethnicity, weight, occupation, and displaying varying non-prostate cancer-related health-states. All samples were single time-point collections, and the prostate cancer samples were taken either immediately prior to, or immediately following surgical resection of a tumor. All samples were taken prior to chemo or radiation therapy.
- the metabolites contained within the 49 serum samples were separated into polar and non-polar extracts by sonication and vigorous mixing (vortex mixing).
- serum extracts 24 prostate cancer, 25 normal
- ESI electrospray ionization
- APCI atmospheric pressure chemical ionization
- Sample extracts were diluted either three or six-fold in methanol:0.1% (v/v) ammonium hydroxide (50:50, v/v) for negative ionization modes, or in methanol:0.1% (v/v) formic acid (50:50, v/v) for positive ionization modes.
- sample extracts were directly injected without diluting.
- the instrument conditions were tuned to optimize ion intensity and broad-band accumulation over the mass range of 100-1000 amu according to the instrument manufacturer's recommendations.
- a mixture of the abovementioned standards was used to internally calibrate each sample spectrum for mass accuracy over the acquisition range of 100-1000 amu.
- Mass Spectrometry Data Processing Using a linear least-squares regression line, mass axis values were calibrated such that each internal standard mass peak had a mass error of ⁇ 1 p.p.m. compared with its theoretical mass. Using XMASS software from Bruker Daltonics Inc., data file sizes of 1 megaword were acquired and zero-filled to 2 megawords. A sinm data transformation was performed prior to Fourier transform and magnitude calculations. The mass spectra from each analysis were integrated, creating a peak list that contained the accurate mass and absolute intensity of each peak. Compounds in the range of 100-2000 m/z were analyzed.
- the diagnostic accuracy of the 14 masses is shown through a PCA plot in FIG. 3 , which illustrates a clear separation between disease and controls. In fact, separating the controls from the prostate cancers using the dotted line results in a sensitivity of 84% and specificity of 100%.
- a graph of the relative intensities of the 14 masses as detected on the FTICR is shown in FIG. 4 (using data scaled between 0 and 1 for each mass). Each of the markers appears to show a reduction or deficiency of approximately 50% (on average) in the prostate cancer sera versus control sera.
- prostate cancer-positive and prostate cancer-negative serum can form the basis for a prostate cancer diagnostic test as presently described.
- Example 1 The metabolites and their associations with the clinical variables described in Example 1 were further confirmed using an independent mass spectrometry system.
- Representative aqueous sample extracts from each variable group (10 controls and 9 prostate cancers) were re-analyzed by LC-MS using an HP 1050 high-performance liquid chromatography, or equivalent interfaced to an ABI Q-Star, or equivalent mass spectrometer to obtain mass and intensity information for the purpose of identifying metabolites that differ in intensity between the clinical variables under investigation.
- Data were acquired using full-scan detection in both positive and negative ESI modes, and the resulting spectral data calibrated and aligned using Phenomenome Profiler software.
- FIG. 5 shows the extracted mass spectra within this retention time range for the controls (A), prostate cancers (B), and the net difference between the controls and prostate cancers (C).
- the boxed region shows the mass range where the subset of 14 masses previously described was redetected. As previously observed, these molecules were significantly lower in intensity in the prostate cancer sera compared to the controls.
- Various characteristics can be used for structure elucidation of metabolites include accurate mass and molecular formula determination, polarity, acid/base properties, NMR spectra, and MS/MS or MSn spectra. These data can be used as fingerprints of a particular metabolite and are unique identifiers of a particular metabolite regardless of whether the complete structure has been determined.
- the data include:
- MS/MS spectra The 14 metabolites of interest were further characterized by performing MS/MS fragmentation using collision induced dissociation (CID). This MS/MS analysis was performed in real time (i.e. during the chromatographic elution process) or off-line on fractions collected from the chromatographic separation process.
- CID collision induced dissociation
- Aqueous fractions from 9 prostate cancer and 10 normal sample extracts were evaporated to dryness under nitrogen gas and reconstituted in 100 ⁇ L of water:methanol:formic acid (97.9:2:0.1). 5 ⁇ L of the reconstituted sample was used for HPLC (Agilent 1100 system with MetaSil AQ 3 um, C18, 100 ⁇ 2.0 mm column, Varian Inc.) for full scan and MS/MS.
- HPLC Alignin 1100 system with MetaSil AQ 3 um, C18, 100 ⁇ 2.0 mm column, Varian Inc.
- the mobile phase consisted of water:methanol:formic acid (97.9:2:0.1) as solvent A, and 0.1% formic acid in methanol as solvent B.
- the solvent gradient was as follows: Solvent A was held at 100% for the first minute, then changed to 20% A and 80% B using a linear gradient over 10 min, and then held at 20% A, 80% B for 9 min; then the solvent mixture was changed to 100% B during the next 10 min using a linear gradient, and was held at 100% B for 15 minutes. Finally, the solvent mixture was held at 100% A to equilibrate the column for duration of 20 min (total elapsed time 65 min). Eluate from the HPLC was analyzed using an ABI QSTART XL mass spectrometer fitted with an ESI (TurbolonSprayTM) source in positive and negative mode.
- ESI TeurbolonSprayTM
- the “TOF-MS” scan type was used with an accumulation time of 1.0 sec, a mass scan range of 50 to 1500 Da, and duration time of 60 min.
- the source parameters at positive ESI mode were as follows: Ion source gas 1 (GS1) 55; Ion source gas 2 (GS2) 90; Curtain gas (CUR) 40; Nebulizer Current (NC) 3.0; Temperature 400° C.; Declustering Potential (DP) 60; Focusing Potential (FP) 265; Declustering Potential 2 (DP2) 15.
- the source parameters at negative ESI mode were as follows: Ion source gas 1 (GS1) 55; Ion source gas 2 (GS2) 70; Curtain gas (CUR) 40; Nebulizer Current (NC) 0; Temperature 400° C.; Declustering Potential (DP) ⁇ 55; Focusing Potential (FP) ⁇ 265; Declustering Potential 2 (DP2) ⁇ 15.
- the “Product Ion” scan type was used with an accumulation time of 1.0 sec, a scan range of 50 to 650 Da, and a duration time of 60 min. All source parameters are the same as above, with collision energy (CE) settings of 20V, 35V, 50V at positive mode and ⁇ 20V, ⁇ 35V, ⁇ 50V at negative mode.
- the collision gas (CAD, nitrogen) was set at 5.
- the structure of a given molecule dictates a specific fragmentation pattern under defined conditions and is unique for that molecule (equivalent to a person's fingerprint)—even slight changes to the molecule's structure can result in a different fragmentation pattern.
- the fragments generated by CID were used to gain insights regarding the structure of the metabolites.
- Fragment ions though weak, were observed for either a sn-1 fatty acid side chain or loss thereof.
- the fragment ion representing m/z 458 was assigned as plausibly due to the loss of C 16 H 32 O unit.
- Another fragment ion at m/z 239 (C 16 H 31 O + ) though low in intensity was also present signifying the sn-1 fatty acid itself. Based on these deductions, the structure was proposed as 2-hydroxy-1-palmitoyl-sn-glycero-3-phosphocholine.
- the fragmentation spectra of the seven metabolites detected in the negative ionization mode i.e., metabolites with accurate masses of 481.3171, 531.3123, 541.3422, 555.3101, 565.3394, 567.3546, and 569.3687
- FIGS. 14 to 20 collision energies of 20, 35 and 50 volts.
- the molecular formulae suggested that four (541.3422, 565.3394, 567.3546, 569.3687) out of the seven biomarkers were found to possess similar formulae of RNO 9 P, where R is the variable fatty acid type, indicating that they could be phospholipid ethanolamine related compounds.
- Table 11 summarizes the molecular formulae and putative structures of the molecules based upon the MS/MS data.
- Tables 12 to 18 list the fragment ion masses, putative formulas of the fragments and fragment losses as well as putative structures for each fragment.
- Fragment ions were observed for sn-1 fatty acid side chain for the markers 481.3168 and 541.3422 (palmityl, C 16 H 31 O 2 , m/z 255), 565.3394 (linoleyl, C 18 H 31 O 2 , m/z 279), 567.3546 (oleyl, C 18 H 33 O 2 , m/z 281), and 569.3687 (stearyl, C 18 H 35 O 2 , m/z 283) as prominent signals in their MS/MS spectra.
- MS/MS data is consistent with molecules of lysophospholipid species
- present invention also includes structures where functional groups or reported fragments are connected in ways that are not presently indicated.
- HTS high throughput screening
- High throughput screening was performed with a linear ion trap mass spectrometer (Q-trap 4000, Applied Biosystem) coupled with Agilent 1100 LC system. Serum samples were extracted as described in Example 1. The aqueous fraction was mixed 1:3 with acetonitrile to precipitate proteins prior to use for the analysis of each sample. 15 ⁇ L of internal standard (reserpine in methanol: 100 ⁇ g/mL for negative ESI; 1 ⁇ g/mL for positive ESI) and 108 ⁇ L of 3:1 (acetonitrile):(1% formic acid in ddH2O) was added to each 12 ⁇ L sample aliquot for a total volume of 135 ⁇ L.
- internal standard reserpine in methanol: 100 ⁇ g/mL for negative ESI; 1 ⁇ g/mL for positive ESI
- the autosampler injected 100 ⁇ L of the sample by flow-injection analysis (FIA) into an ABI 4000QTRAP.
- the carrier solvent was 60:40 (methanol):(1% formic acid in ddH2O), with a flow rate of 450 ⁇ L/min into the APCI source.
- MS/MS HTS methods negative and positive ESI were developed on a quadrupole linear ion trap ABI 4000QTRAP mass spectrometer equipped with a TurboVTM source with an Ionspray probe.
- the source gas parameters were as follows:
- Negative ESI (CUR: 10.0, CAD: 6, IS: ⁇ 4500, TEM: 500, GS1: 50, GS2: 60, interface heater on. “Compound” settings were as follows: entrance potential (EP): ⁇ 10, and collision cell exit potential (CXP): ⁇ 10.0); Positive ESI: (CUR: 10.0, CAD: 6, IS: 5500, TEM: 500, GS1: 30, GS2: 60, interface heater on. “Compound” settings were as follows: entrance potential (EP): 10, and collision cell exit potential (CXP): 15.0).
- the methods were based on the multiple reaction monitoring (MRM) of 2 MRM transitions for each biomarker, and 2 MRM transitions for the internal standard (reserpine, though other compounds may be used) for a total of 16 MRM's for each method. Each of the transitions was monitored for 100 msec or 70 msec for positive and negative ESI modes, respectively. The total acquisition time per sample was approximately 1 min. Briefly, each method measured the intensities of each of 14 biomarker MRM transitions (from 7 parents) and 2 internal standard (IS) MRM transitions (from 1 parent) as shown in Table 20. A patient score was then generated by determining the lowest mean-normalized log(2) transformed ratio of the seven measured biomarker:IS transitions per patient.
- MRM multiple reaction monitoring
- the ABI 400QTRAP was capable of accurately measuring the MRM transition peak areas using the method described above by plotting the peak area ratios of the biomarker transitions versus the internal standard transitions for each of the seven biomarkers for each method.
- the HTS method also incorporates a series of dilutions of extracted human reference serum material, which allowed for the determination and assurance of instrument linearity. If the calibration curve has a R 2 value ⁇ 0.98, then the sample run is considered a failure and the sample needs to be rerun.
- the prostate cancer HTS triple-quad method comprises two independent data acquisition components due to the fact that half the molecules are detected in negative mode, and the other half in positive mode.
- the transitions used for measurement are shown in FIG. 21A , and comprise two daughter ion transitions per molecule for each of the biomarkers (a and b, with the exception of 546.3, in which a single transition was used), and two internal standard transitions per sample (1 and 2). Dividing each biomarker transition by each internal standard transition therefore resulted in 26 ratios per biomarker.
- a normal reference serum sample is also analyzed at varying dilutions to assess instrument linearity, for which R-squared coefficients can be calculated.
- the average R-squared values for data obtained below for each transition ratio is shown in FIG. 21A .
- a sample plot of the average intensities of the dilutions for 496.3/184.2a1 is shown in FIG. 21B .
- the ratio data was then normalized to the mean of the control population and log(2) transformed. The lowest ratio value of per patient was then selected as the final output score. The distributions of these patient scores were then visualized to determine the optimum diagnostic cut-off point.
- the same 24 prostate cancer serum samples used for the discovery phase were re-analyzed using this method, along with an expanded independent set of 147 male control samples.
- the average ratio (not log transformed) for each of the 26 transitions in the control and prostate cancer cohorts is shown in FIG. 21C . As expected, the intensity of each ratio is lower in the prostate cancer cohort compared to the controls.
- the final patient scores (lowest detected log ratio per patient) for these subjects are shown in the scatter plot in FIG. 22A .
- Plotting the distributions of the subjects based upon the patient score, as shown in FIG. 22B mirrored the previous findings and showed a shift in the distribution of the prostate patients (black bars) to the left, indicating an overall lower patient score in the majority of prostate cancer patients relative to the controls. Setting a cut-off patient score of ⁇ 1.25, indicated by the dotted line in FIG.
- the daughter ion transitions for the HTS method are shown in FIG. 23A .
- the method is similar to the positive mode, with four ratios (from two internal standard measurements) generated per parent ion, resulting in 28 total ratios per patient sample.
- the average r-squared values resulting from the analysis of multiple diluted serum samples for each of the ratios is also shown in FIG. 23A .
- a plot of the standard curve for the first transition ratio (480.3/255.4a1) is shown in FIG. 23 B as an example. As expected, the ratios for each of the transitions was lower in the prostate cancer cohort relative to the controls, as shown in the bar graph in FIG. 23C .
- the final patient scores (lowest detected log ratio per patient) for the seven metabolites detected in the negative mode are shown in the scatter plot in FIG. 24A .
- Plotting the distributions of the subjects based upon the patient score, as shown in FIG. 24B mirrored the previous findings and showed a shift in the distribution of the prostate patients (black bars) to the left, indicating an overall lower patient score in the majority of prostate cancer patients relative to the controls. Setting a cut-off patient score of ⁇ 1.00, indicated by the dotted line in FIG.
- the cut-off value could be move either up or down to favor either sensitivity or specificity, respectively. This performance is superior to that achievable with PSA testing. Since this method is accurate and can be run rapidly on a serum sample, screening the male population would be expected to identify otherwise undetected cases, and would therefore have a major impact on prostate cancer mortality.
- various subsets of the measured transitions and ratios thereof could be used to optimize the diagnostic accuracy.
- performing serial analysis of each of the positive and negative modes and then stacking or combining the results may also improve the sensitivity and specificity. For example, patients incorrectly diagnosed using only one method (positive mode) may be correctly classified with the negative mode, or vise-versa.
- data from both positive and negative modes could be acquired first, followed by the generation of a single patient score based upon the total cumulative dataset.
Abstract
Description
- The present invention relates to small molecules or metabolites that are found to have significantly different abundances or intensities between clinically diagnosed prostate cancer-positive patients and normal patients. The present invention also relates to methods for diagnosing prostate cancer, or the risk of developing prostate cancer.
- Prostate cancer will affect one in every six men during their lifetime, with over 200,000 diagnoses and 30,000 deaths per year in the U.S. alone (1). It is the second leading cause of death due to cancer in men. Current screening methods for prostate cancer include the prostate-specific antigen (PSA) test, which detects the levels of prostate-specific antigen in a blood sample, and digital rectal examination (DRE). Although 60 to 70% of at-risk men in the U.S. have undergone PSA testing since the test was adopted, prostate cancer death rates have only slightly decreased. This is largely due to two reasons: 1) the fact that PSA testing fails to identify a subset of aggressive cancers, and 2) that only about 30% of men with a positive PSA test have a positive biopsy. Diagnosis is further complicated by the fact that of all men treated for prostate cancer, about 25% have disease recurrence and require additional treatment, while in other cases some tumors never progress at all and may be better left untreated. Therefore, a key issue with prostate cancer diagnosis today is the inability to predict the course of the disease. Together, these statistics have made prostate screening with conventional methods a controversial issue. The ideal prostate cancer biomarker(s) would therefore be suitable for early detection, as well as have the ability to predict disease aggressiveness and ideally to be able to monitor disease progression during therapy or post surgery.
- Currently, PSA is recognized as the best available serum marker for prostate cancer, however, there is substantial room for improvement. The impact of PSA testing, beginning in the early 1990s, can be seen by decreases in the numbers of men diagnosed with metastasis, concurrent with overall decreased mortality (2). However, this may be due to the fact that PSA screening increased awareness of prostate cancer, which ultimately stimulated the analysis of more biopsies. Calculating the performance characteristics (sensitivity and specificity) of the PSA test is difficult because of ethnicity-related difference in incidence, and that in most studies, the percentage of biopsies performed is higher than what would normally be performed in clinical practice. In the Prostate Cancer Prevention Trial (PCPT) (3), the false-negative rate for detection of high-grade tumors was at least 15%, with a false-positive rate of 70% (i.e. only 30% of men with elevated PSA have a positive biopsy). In another study, the Physician's Health Study (4), the sensitivity for aggressive cancer over a four-year period was 87%, but dropped to 53% for non-aggressive cancers. There have been many other studies carried out to assess PSA sensitivity, but the latest findings claim overall sensitivity to be at best 73% (5). Lowering the PSA threshold would detect more cancers, but at the cost of more false-positives and subsequently more biopsies. To complicate matters further, it appears that due to increased prevalence of benign prostatic hyperplasia (BPH) in the ageing male population, the sensitivity of the PSA test with a cut-point of 4 ng/ml decreases with age.
- PSA alone cannot diagnose prostate cancer. Diagnosis is a complex process, which involves integrating the results of a physical examination, a PSA test, the Gleason grade (by assessing glandular architecture at biopsy) and possibly other lab tests.
- It is clear that there is a need for improving prostate cancer detection. A test that is able to detect risk for, or the presence of, prostate cancer or that can predict aggressive disease with high specificity and sensitivity would be very beneficial and would impact prostate cancer morbidity. The claimed invention describes the discovery of molecules present in serum samples which show a differential pattern of abundances between prostate cancer patients and normal individuals.
- The present invention relates to small molecules or metabolites that are found to have significantly different abundances or intensities between clinically diagnosed prostate cancer-positive patients and normal patients. The present invention also relates to methods for diagnosing prostate cancer, or the risk of developing prostate cancer.
- The present invention provides a method for identifying, validating, and implementing a high-throughput screening (HTS) assay for the diagnosis of a health-state indicative of prostate cancer. In a particular example, the method encompasses the analysis of prostate cancer-specific and normal biological samples using non-targeted FTMS technology to identify all statistically significant metabolite features which differ between normal and prostate cancer-positive biological samples, followed by the selection of the optimal feature subset using statistics and chemical properties of the molecules, and characterization of the feature set using methods including, but not limited to, chromatographic separation, mass spectrometry (MS/MS), and nuclear magnetic resonance (NMR), for the purposes of:
-
- 1. separating and identifying retention times of the metabolites;
- 2. producing descriptive MS/MS fragmentation patterns specific for each metabolite;
- 3. characterization of molecular structures; and
- 4. developing a high-throughput quantitative or semi-quantitative MS/MS-based diagnostic assay.
- The present invention further provides a method for the diagnosis of prostate cancer or the risk of developing prostate cancer in humans by measuring the levels of specific small molecules present in a sample and comparing them to “normal” reference levels. The methods measure the intensities of specific small molecules, also referred to as metabolites, in the sample from the patient and compare these intensities to the intensities observed in a population of healthy individuals.
- The present invention provides a method of identifying one or more than one metabolite marker for diagnosing prostate cancer, comprising the steps of:
-
- a) introducing one or more than one sample from one or more than one patient with prostate cancer, said sample containing a plurality of metabolites into a high resolution mass spectrometer
- b) obtaining quantifying data for the metabolites;
- c) creating a database of said quantifying data;
- d) comparing the identifying and quantifying data from the sample with corresponding data from a sample from one or more than one reference sample; and
- e) identifying one or more than one metabolite marker that differs between said sample and said one or more than one reference sample.
- The metabolite markers are selected from the metabolites listed in Table 1, or any combination thereof. The method may further comprise selecting a minimal number of metabolite markers needed for optimal diagnosis. The high resolution mass spectrometer may be a Fourier Transform Ion Cyclotron Resonance Mass Spectrometer (FTMS).
- The present invention also provides a method for diagnosing prostate cancer or the risk of prostate cancer in a patient, the method comprising the steps of:
-
- a) obtaining a sample from said patient;
- b) analyzing said sample to obtain quantifying data for one or more than one metabolite marker;
- c) comparing the quantifying data for said one or more than one metabolite marker to corresponding data obtained from one or more than one reference sample; and
- d) using said comparison to differentially diagnose prostate cancer or the risk of prostate cancer.
- The one or more than one metabolite marker is selected from the metabolites listed in Table 1, or any combination thereof. The diagnostic method above may comprise analyzing the sample by liquid chromatography mass spectrometry (LC-MS) in step b). Alternatively, when the method is a high throughput method, step b) may comprise analyzing the sample by either liquid chromatography or direct injection followed by linear ion trap tandem mass spectrometry.
- In the method as described above, the one or more than one reference sample may be a plurality of samples obtained from control individuals; one or more than one baseline sample obtained from the patient at an earlier date; or a combination thereof.
- In another embodiment of the present invention, there is provided a method for diagnosing prostate cancer or the risk of prostate cancer in a patient, the method comprising the steps of:
-
- a) obtaining a sample from said patient;
- b) analyzing said sample to obtain quantifying data for one or more than one metabolite marker;
- c) obtaining a ratio for each of the one or more than one metabolite marker to an internal control metabolite;
- d) comparing each ratio of said one or more than one metabolite marker to the internal control metabolite to corresponding data obtained from one or more than one reference sample; and
- e) using said comparison to diagnose prostate cancer or the risk of prostate cancer.
- The diagnostic method above may comprise one or more than one metabolite marker selected from metabolites listed in Table 1, or any combination thereof. The diagnostic method above may comprise analyzing the sample by liquid chromatography mass spectrometry (LC-MS) in step b). Alternatively, when the method is a high throughput method, step b) may comprise analyzing the sample by either direct injection or liquid chromatography and linear ion trap tandem mass spectrometry.
- In the method as described above, the one or more than one reference sample may be a plurality of samples obtained from control individuals; one or more than one baseline sample obtained from the patient at an earlier date; or a combination thereof.
- The present invention further provides a method for evaluating the efficacy of a therapy for treating prostate cancer in a patient, comprising:
-
- a) obtaining a sample from said patient;
- b) analyzing said sample to obtain quantifying data for one or more than one metabolite marker;
- c) comparing said quantifying data to corresponding data obtained from one or more than one reference sample; and
- d) using said comparison to determine whether the therapy is improving the health state of the patient,
- wherein the one or more than one metabolite marker is selected from metabolites listed in Table 1, or any combination thereof. The diagnostic method above may comprise analyzing the sample by liquid chromatography mass spectrometry (LC-MS) in step b). Alternatively, when the method is a high throughput method, step b) may comprise analyzing the sample by direct injection or liquid chromatography and linear ion trap tandem mass spectrometry.
- In the method as described above, the one or more than one reference sample may be a plurality of samples obtained from control individuals; one or more than one pre-therapy baseline sample obtained from the patient; or a combination thereof.
- In yet another embodiment of the present invention, there is provided a method for evaluating the efficacy of a therapy for treating prostate cancer in a patient, comprising:
-
- a) obtaining a sample from said patient;
- b) analyzing said sample to obtain quantifying data for one or more than one metabolite marker;
- c) obtaining a ratio for each of the one or more than one metabolite marker to an internal control metabolite;
- d) comparing each ratio of said one or more than one metabolite marker to the internal control metabolite to corresponding data obtained from one or more than one reference sample; and
- e) using said comparison to determine whether the therapy is improving the health state of the patient,
- wherein the one or more than one metabolite marker is selected from metabolites listed in Table 1, or any combination thereof. The diagnostic method above may comprise analyzing the sample by liquid chromatography mass spectrometry (LC-MS) in step b). Alternatively, when the method is a high throughput method, step b) may comprise analyzing the sample by direct injection or liquid chromatography and linear ion trap tandem mass spectrometry.
- In the method as described above, the one or more than one reference sample may be a plurality of samples obtained from control individuals; one or more than one pre-therapy baseline sample obtained from the patient; or a combination thereof.
- The methods described herein may be combined with other methods for monitoring prostate cancer, for example the PSA test.
- In the diagnostic methods and methods of evaluating the efficacy of treatment as described above, the one or more than one metabolite marker may be selected from the group consisting of lysophospholipids, including lysophosphatidylcholines, lysophosphatidylethanolamines, lysophosphatidyldimethylethanolamines, lysophosphatidylserines, lysosphingosylphosphorylcholines, lysophosphatidylglycerols lysophosphatidylinositols, platelet activating factors (PAFs), and combinations thereof. For example, the one or more than one metabolite marker may comprise metabolites with accurate masses measured in Daltons of, or substantially equivalent to, a) 495.3328, b) 517.3148, c) 519.3328, d) 521.3480, e) 523.3640, f) 541.3148, g) 545.3460, h) 481.3171, i) 531.3123, j) 541.3422, k) 555.3101, l) 565.3394, m) 567.3546, and n) 569.3687. In methods where the quantifying data for the one or more than one metabolite is compared, these metabolites are observed to be decreased in patients with prostate cancer. In methods where a ratio for the one or more than one metabolite to the internal control metabolite is compared, the ratio of metabolite to internal control metabolite is decreased in patients with prostate cancer.
- The metabolites a) to g) are lysophosphatidylcholine-related compounds and metabolites h) to n) are putatively N,N-dimethyl lysophosphatidylethanolamine-related compounds. Metabolites a) to n) may be further characterized by an MS/MS spectrum as shown in a)
FIG. 7 , and/or as described in Table 3; b)FIG. 8 , and/or as described in Table 4; c)FIG. 9 , and/or as described in Table 5; d)FIG. 10 , and/or as described in Table 6; e)FIG. 11 , and/or as described in Table 7; f)FIG. 12 , and/or as described in Table 8; g)FIG. 13 , and/or as described in Table 9; h)FIG. 14 , and/or as described in Table 12; i)FIG. 15 , and/or as described in Table 13; j)FIG. 16 , and/or as described in Table 14; k)FIG. 17 , and/or as described in Table 15; l)FIG. 18 , and/or as described in Table 16; m)FIG. 19 , and/or as described in Table 17; and n)FIG. 20 , and/or as described in Table 18, respectively. - Additionally, the one or more than one metabolite above may be further characterized by molecular formula a) C24H50NO7P, b) C26H48NO7P, c) C26H50NO7P, d) C26H52NO7P, e) C26H54NO7P, f) C28H48NO7P, g) C28H52NO7P, h) C23H48NO7P, i) C30H46NO5P, j) C25H52NO9P, k) C25H50NO10P, l) C27H52NO9P, m) C27H54NO9P, and n) C27H56NO9P, respectively. The structures of the one or more than one metabolite may be characterized as follows:
-


- The present invention also provides novel compounds. These compounds are selected from the group consisting of the metabolites with accurate masses measured in Daltons of, or substantially equivalent to, a) 531.3123, b) 541.3422, c) 555.3101, d) 565.3394, e) 567.3546, and f) 569.3687.
- The compounds described above may be further characterized by an MS/MS spectrum as shown in
-
- a)
FIG. 15 , and/or as described in Table 13; - b)
FIG. 16 , and/or as described in Table 14; - c)
FIG. 17 , and/or as described in Table 15; - d)
FIG. 18 , and/or as described in Table 16; - e)
FIG. 19 , and/or as described in Table 17; and - f)
FIG. 20 , and/or as described in Table 18, respectively.
- a)
- Likewise the compounds described above may be further characterized by an MS/MS spectrum as shown in tables 12 through 18, respectively.
- The compounds may also be further characterized by molecular formula a) C30H46NO5P, b) C25H52NO9P, c) C25H50NO10P, d) C27H52NO9P, e) C27H54NO9P, and f) C27H56NO9P, respectively. In addition, the compounds described above may be characterized by the putative structures
-

- The novel compounds of the present invention may be used for the diagnosis of prostate cancer, or for evaluating the efficacy of treatment of prostate cancer in a patient.
- The present invention may significantly impact the ability to detect prostate cancer or the risk of developing prostate cancer, and may save lives. The statistical performance of a test based on these samples suggests that the test will outperform the PSA test, the only other serum-based diagnostic test for prostate cancer. Alternatively, a combination of the methods described herein and the PSA test may improve the overall diagnostic performance of each test.
- The methods of the present invention, including HTS assays, can be used for the following, wherein the specific “health-state” refers to, but is not limited to prostate cancer:
- 1. identifying small-molecule metabolite biomarkers which can discriminate between prostate cancer-positive and prostate cancer-negative individuals using any biological sample, such as a serum sample, taken from the individual;
- 2. specifically diagnosing prostate cancer using metabolites identified in a sample such as serum, plasma, whole blood, and/or other tissue biopsy as described herein;
- 3. selecting the minimal number of metabolite features required for optimal diagnostic assay performance statistics using uni- or multivariate statistical methods and relevant chemical information about the molecules such as those mentioned herein;
- 4. identifying structural characteristics of biomarker metabolites selected from non-targeted metabolomic analysis using LC-MS/MS, MSn and NMR;
- 5. developing a high-throughput triple-quadrupole MS/MS method for assaying selected metabolite levels in a sample;
- 6. diagnosing prostate cancer, or the risk of developing prostate cancer, by determining the levels of any combination of metabolite features disclosed from the FTMS analysis of patient sample, using any method including but not limited to mass spectrometry, NMR, UV detection, ELISA (enzyme-linked immunosorbant assay), chemical reaction, image analysis, or other;
- 7. monitoring any therapeutic treatment of prostate cancer, including drug (chemotherapy), radiation therapy, surgery, dietary, lifestyle effects or other; and/or
- 9. longitudinal monitoring or screening of the general population for prostate cancer using any single or combination of features disclosed in the method.
- The impact of the present invention on the diagnosis of prostate cancer would be tremendous, as literally everyone could be screened longitudinally throughout their lifetime to assess risk. Given that the performance characteristics of the test of the present invention are representative for the general population, this test alone may be superior to any other currently available screening method, as it may have the potential to detect disease progression prior to the emergence of clinical symptoms.
- This summary of the invention does not necessarily describe all features of the invention.
- These and other features of the invention will become more apparent from the following description in which reference is made to the appended drawings wherein:
-
FIG. 1 shows a summary of the steps involved in the discovery, identification and characterization of metabolites, including those relating to lysophospholipid species, which are associated with the presence of prostate cancer. -
FIG. 2 shows a principle component analysis (PCA) plot generated from the 492 masses with p-values less than 0.05. Each point on the plot represents a single patient sample, while the dotted line represents the boundary between which most of the prostate cancer subjects (in black) and the controls (grey), can be separated. -
FIG. 3 shows a PCA plot generated from a subset of 14 masses selected from the 492 with p-values <0.05. A high degree of discrimination between the prostate cancer subjects (black points) and the control subjects (grey points) is evident using only the 14 masses. The dotted line shows the boundary between the two cohorts, which when used as a cutoff value results in 84% sensitivity (84% of cancers detected) and 100% specificity (no controls being classified as cancer, or false positives). -
FIG. 4 shows a bar graph of the average relative intensities of the 14 selected masses in the control (grey) and the prostate cancer subjects (black). Error bars=±1 s.d. -
FIG. 5 shows a series of extracted mass spectra for metabolites eluting between 16 and 18 minutes of chromatographic separation on HPLC, as detected using time-of-flight (TOF) MS. The box indicates a region of metabolite masses detected between approximately 450 and 600 daltons in control serum (A), but absent from prostate cancer-positive serum (B). The lower panel (C) indicates the net difference between the control and prostate cancer spectra. -
FIG. 6 shows a graph of the 14 said metabolites as detected using TOF-MS following HPLC. Error bars=1 s.d. -
FIG. 7 shows the MS/MS extracted mass spectra for 495.3328 (496.3401 [M+H]), at collision energy voltages of 20 (A), 35 (B) and 50 (C) volts, respectively. -
FIG. 8 shows the MS/MS extracted mass spectra for 517.3148 (518.3219 [M+H]), at collision energy voltages of 20 (A), 35 (B) and 50 (C) volts, respectively. -
FIG. 9 shows the MS/MS extracted mass spectra for 519.3328 (520.3401 [M+H]), at collision energy voltages of 20 (A), 35 (B) and 50 (C) volts, respectively. -
FIG. 10 shows the MS/MS extracted mass spectra for 521.3480 (522.3554 [M+H]), at collision energy voltages of 20 (A), 35 (B) and 50 (C) volts, respectively. -
FIG. 11 shows the MS/MS extracted mass spectra for 523.3640 (524.3713 [M+H]), at collision energy voltages of 20 (A), 35 (B) and 50 (C) volts, respectively. -
FIG. 12 shows the MS/MS extracted mass spectra for 541.3148 (542.3219 [M+H]), at collision energy voltages of 20 (A), 35 (B) and 50 (C) volts, respectively. -
FIG. 13 shows the MS/MS extracted mass spectra for 545.3460 (546.3534 [M+H]), at collision energy voltages of 20 (A), 35 (B) and 50 (C) volts, respectively. -
FIG. 14 shows the MS/MS extracted mass spectra for 481.3171 (480.3091 [M−H]), at collision energy voltages of 20 (A), 35 (B) and 50 (C) volts, respectively. -
FIG. 15 shows the MS/MS extracted mass spectra for 531.3123 (530.3035 [M−H]), at collision energy voltages of 20 (A), 35 (B) and 50 (C) volts, respectively. -
FIG. 16 shows the MS/MS extracted mass spectra for 541.3422 (540.3335 [M−H]), at collision energy voltages of 20 (A), 35 (B) and 50 (C) volts, respectively. -
FIG. 17 shows the MS/MS extracted mass spectra for 555.3101 (554.3013 [M−H]), at collision energy voltages of 20 (A), 35 (B) and 50 (C) volts, respectively. -
FIG. 18 shows the MS/MS extracted mass spectra for 565.3394 (564.3306 [M−H]), at collision energy voltages of 20 (A), 35 (B) and 50 (C) volts, respectively. -
FIG. 19 shows the MS/MS extracted mass spectra for 567.3546 (566.3459 [M−H]), at collision energy voltages of 20 (A), 35 (B) and 50 (C) volts, respectively. -
FIG. 20 shows the MS/MS extracted mass spectra for 569.3687 (568.3598 [M−H]), at collision energy voltages of 20 (A), 35 (B) and 50 (C) volts, respectively. -
FIG. 21 shows A), the list of the parent-daughter ion transitions used for the positive ESI triple-quadrupole HTS method as well as the R-squared correlation coefficient resulting from calculation of linearity across five diluted samples. B), Standard curve for transition 496.3/184.2a1. C). The average ratio (biomarker:IS peak area) for each transition in the prostate (black) and control (grey) subjects. -
FIG. 22 shows A), a scatter plot of the positive ESI HTS patient scores for 147 male controls (grey squeares) and 24 prostate cancer patients (black triangles). B), frequency histogram showing the distribution of the control population (grey) and prostate cancer subjects (black) according to binned patient scores. -
FIG. 23 shows A), the list of the parent-daughter ion transitions used for the negative ESI triple-quadrupole HTS method as well as the R-squared correlation coefficient resulting from calculation of linearity across five diluted samples. B), Standard curve for transition 480.3/255.4a1. C). The average ratio (biomarker:IS peak area) for each transition in the prostate (black) and control (grey) subjects. -
FIG. 24 shows A), a scatter plot of the negative ESI HTS patient scores for 147 male controls (grey squeares) and 24 prostate cancer patients (black triangles). B), frequency histogram showing the distribution of the control population (grey) and prostate cancer subjects (black) according to binned patient scores. - The present invention relates to small molecules or metabolites that are found to have significantly different abundances or intensities between clinically diagnosed prostate cancer-positive patients and normal patients. The present invention also relates to methods for diagnosing prostate cancer, or the risk of developing prostate cancer.
- The present invention provides novel methods for discovering, validating, and implementing a diagnosis method for prostate cancer. In one embodiment of the present invention, there is provided a method for identifying specific biomarkers for diagnosing prostate cancer comprising the steps of: introducing one or more than one sample from one or more than one patient with prostate cancer, said sample containing a plurality of metabolites into a high resolution mass spectrometer (for example, and without wishing to be limiting, a Fourier Transform Ion Cyclotron Resonance Mass Spectrometer (FTMS)); obtaining, identifying and quantifying data for the metabolites; creating a database of said quantifying data; comparing the quantifying data from the sample with corresponding data obtained from one or more than one sample from a control patient; identifying one or more than one metabolites that differ. The metabolite markers identified using the method of the present invention may include the metabolites listed in Table 1. The method may further comprise selecting the minimal number of metabolite markers needed for optimal diagnosis.
- In order to determine the biochemical markers of a given health-state in a particular population, a group of patients representative of the health state (i.e., a particular disease) and/or a group of “normal” or “control” counterparts (i.e., individuals that do not suffer from the particular health state) are required. Biological samples taken from the patients in the particular health state can then be compared to the same samples taken from the normal population as well as to patients in similar health-state category in the hopes of identifying biochemical differences between the two groups, by analyzing the biochemicals present in the samples using analytical methods including, but not limited to, FTMS and/or LC-MS.
- The method for the discovery of metabolite markers as described above may be done using non-targeted metabolomic strategies or methods. Multiple non-targeted metabolomics strategies have been described in the scientific literature including NMR (6), GC-MS (7), LC-MS (8), and FTMS strategies (9-11). The metabolic profiling strategy employed for the discovery of differentially expressed metabolites in the present invention was the non-targeted FTMS strategy by Phenomenome Discoveries [21, 24-27; see also US Published Application No. 2004-0029120 A1, Canadian Application No. 2,298,181, and WO 0157518]. Non-targeted analysis involves the measurement of as many molecules in a sample as possible, without any prior knowledge or selection of components prior to the analysis. Therefore, the potential for non-targeted analysis to discover novel metabolite biomarkers is high versus targeted methods, which detect a predefined list of molecules. The present invention uses a non-targeted method to identify metabolite components in serum samples that differ between individuals with prostate cancer and control individuals (i.e., individuals that do not have prostate cancer).
- However, a person skilled in the art would recognize that other metabolite profiling strategies could be used to discover some or all of the differentially regulated metabolites disclosed in the present invention and that the metabolites described herein, however discovered or measured, represent unique chemical entities that are independent of the analytical technology that may be used to detect and measure them. For example, and without wishing to be limiting in any manner, other methods of metabolite detection could be used, for example other MS-based platforms, ELISAs, colorimetric assays, etc.
- The present invention also provides a method for diagnosing prostate cancer or the risk of developing prostate cancer in a patient, the method comprising the steps of:
-
- a) obtaining a sample from said patient;
- b) analyzing said sample to obtain quantifying data for one or more than one metabolite marker;
- c) comparing the quantifying data for said one or more than one metabolite marker to corresponding data obtained from one or more than one reference sample; and
- d) using said comparison to diagnose prostate cancer or the risk of developing prostate cancer.
- The step of analyzing the sample (step b) may comprise analyzing the sample using a mass spectrometer (MS). For example, and without wishing to be limiting, such mass spectrometer could be of the FTMS, orbitrap, time-of-flight (TOF) or quadrupole types. Alternatively, the mass spectrometer could be equipped with an additional pre-detector mass filter. For example, and without wishing to be limiting such instruments are commonly referred to as quadrupole-FTMS (Q-FTMS), quadrupole-TOF (Q-TOF) or triple quadrupole (TQ or QQQ). In addition, the mass spectrometer could be operated in either the parent ion detection mode (MS) or in MSn mode, where n>=2. MSn refers to the situation where the parent ion is fragmented by collision induced dissociation (CID) or other fragmentation procedures to create fragment ions, and then one or more than one of said fragments are detected by the mass spectrometer. Such fragments can then be further fragmented to create further fragments. Alternatively, the sample could be introduced into the mass spectrometer using a liquid or gas chromatographic system or by direct injection.
- In the methods of the present invention, any type of biological sample that originates from anywhere within the body, for example but not limited to, blood (serum/plasma), CSF, urine, stool, breath, saliva, or biopsy of any solid tissue including tumor, adjacent normal, smooth and skeletal muscle, adipose tissue, liver, skin, hair, brain, kidney, pancreas, lung, colon, stomach, or other may be used. Of particular interest are samples that are serum. While the term “serum” is used herein, those skilled in the art will recognize that plasma or whole blood or a sub-fraction of whole blood may also be used.
- The biological samples may be obtained in both normal and prostate cancer-positive groups from a diverse population of individuals, ranging in age, ethnicity, weight, occupation, and displaying varying non-prostate cancer-related health-states. Choosing subjects in this way introduces more variability into a dataset, however, reduces potential confounding bias that ultimately results in a more robust set of biomarkers (since it can still detect disease in the presence of many other variables).
- In a non-limiting example, when a blood sample is drawn from a patient there are several ways in which the sample can be processed. The range of processing can be as little as none (i.e. frozen whole blood) or as complex as the isolation of a particular cell type. The most common and routine procedures involve the preparation of either serum or plasma from whole blood. All blood sample processing methods, including spotting of blood samples onto solid-phase supports, such as filter paper or other immobile materials, are also contemplated by the present invention.
- Without wishing to be limiting in any manner, the processed blood or serum or sample described above may then be further processed to make it compatible with the methodical analysis technique to be employed in the detection and measurement of the metabolites contained within the processed serum or blood sample. The types of processing can range from as little as no further processing to as complex as differential extraction and chemical derivatization. Extraction methods could include sonication, soxhlet extraction, microwave assisted extraction (MAE), supercritical fluid extraction (SFE), accelerated solvent extraction (ASE), pressurized liquid extraction (PLE), pressurized hot water extraction (PHWE) and/or surfactant assisted extraction (PHWE) in common solvents such as methanol, ethanol, mixtures of alcohols and water, or organic solvents such as ethyl acetate or hexane. A method of particular interest for extracting metabolites for FTMS non-targeted analysis as well as for direct injection on triple quadrupole mass spectrometers, is to perform a liquid/liquid extraction whereby non-polar metabolites dissolve in an organic solvent and polar metabolites dissolve in an aqueous solvent.
- The extracted samples may be analyzed using any suitable method known in the art. For example, and without wishing to be limiting in any manner, extracts of biological samples are amenable to analysis on essentially any mass spectrometry platform, either by direct injection or following chromatographic separation. Typical mass spectrometers are comprised of a source which ionizes molecules within the sample, and a detector for detecting the ionized molecules or fragments of molecules. Non-limiting examples of common sources include electron impact, electrospray ionization (ESI), atmospheric pressure chemical ionization (APCI), atmospheric pressure photo ionization (APPI), matrix assisted laser desorption ionization (MALDI), surface enhanced laser desorption ionization (SELDI), and derivations thereof. Common mass separation and detection systems can include quadrupole, quadrupole ion trap, linear ion trap, time-of-flight (TOF), magnetic sector, ion cyclotron (FTMS), Orbitrap, and derivations and combinations thereof. The advantage of FTMS over other MS-based platforms is its high resolving capability that allows for the separation of metabolites differing by only hundredths of a Dalton, many which would be missed by lower resolution instruments.
- By the term “metabolite”, it is meant specific small molecules, the levels or intensities of which are measured in a sample, and that may be used as markers to diagnose a disease state. These small molecules may also be referred to herein as “metabolite marker”, “metabolite component”, “biomarker”, “biochemical marker”, or “metabolite feature”.
- The metabolites are generally characterized by their accurate mass, as measured by mass spectrometry technique used in the above method. The accurate mass may also be referred to as “accurate neutral mass” or “neutral mass”. The accurate mass of a metabolite is given herein in Daltons (Da), or a mass substantially equivalent thereto. By “substantially equivalent thereto”, it is meant that a +/−5 ppm (part per million) difference in the accurate mass would indicate the same metabolite, as would be recognized by a person of skill in the art. The mass accuracy is the difference which is observed between the theoretical mass and a measured mass: delta mass accuracy (Δm)=mreal−mmeasured, which is often expressed in parts per million (ppm). Ppm is defined as 1,000,000*Δm accuracy/mmeasured (for example, theoretical mass: 1000, measured mass: 999.9 error: 100 ppm).
- The accurate mass is given as the mass of the neutral metabolite. As would be recognized by a person of skill in the art, the ionization of the metabolites, which occurs during analysis of the sample, the metabolite will cause either a loss or gain of one or more hydrogen atoms and a loss or gain of an electron. This changes the accurate mass to the “ionized mass”, which differs from the accurate mass by the mass of hydrogens and electrons lost or gained during ionization. Unless otherwise specified, the accurate neutral mass will be referred to herein.
- Similarly, when a metabolite is described by its molecular formula or structure, the molecular formula or structure of the neutral metabolite will be given, unless otherwise specified. Naturally, the molecular formula or structure of the ionized metabolite will differ from the neutral molecular formula or structure by the number of hydrogens lost or gained during ionization.
- Data is collected during analysis and quantifying data for one or more than one metabolite is obtained. “Quantifying data” is obtained by measuring the levels or intensities of specific metabolites present in a sample. The measurement itself could be a relative measurement (e.g. comparison of intensity to another sample or distribution), or a quantitative measurement (e.g. a concentration such as X mg/ml).
- The quantifying data is compared to corresponding data from one or more than one reference sample. The “reference sample”, also referred to herein as a “control sample”, is any suitable reference sample for the particular disease state. For example, and without wishing to be limiting in any manner, in the present invention the reference sample may be a sample from a control individual, i.e., a person not suffering from prostate cancer (also referred to herein as a “normal”, “control”, or “reference” individual or patient); the reference sample may also be a sample obtained from a patient with prostate cancer. As would be understood by a person of skill in the art, more than one reference sample may be used for comparison to the quantifying data. For example and without wishing to be limiting, the one or more than one reference sample may be a first reference sample obtained from a control individual. The one or more than one reference sample may also be a sample obtained from a patient at an earlier date; this would allow longitudinal monitoring of a patient's health state throughout their lifetime. Such samples could be collected over successive intervals of time. In another example, the reference sample could also be obtained from a patient with prostate cancer prior to therapy (i.e., pre-therapy) in order to monitor the efficacy of the therapy administered. A person of skill in the art would also recognize that a combination of such reference samples could be used in the methods of the present invention.
- The present invention also provides novel compounds, identified using the methods of the present invention. The novel compounds may be used as metabolite markers in the diagnosis of prostate cancer or the risk of developing prostate cancer, as described above.
- In one embodiment, the compounds may be selected from the metabolites listed in Table 1, or any combination thereof. An optimal panel of metabolites may be selected from the group of 492 metabolites shown in Table 1. For example, and without wishing to be limiting, the optimal panel of metabolite markers may be metabolites with accurate masses (measured in Daltons) of 519.3328, 541.3148, 545.3460, 555.3101, 541.3422, 565.3394, 521.3480, 517.3148, 567.3546, 523.3640, 531.3123, 481.3171, 495.3328, 569.3687, where a +/−5 ppm difference would indicate the same metabolite. In particular, it is presently shown that the 14 metabolites just described, when measured in serum or tissue, show a lower concentration in prostate cancer-positive subjects relative to control (disease-free) individuals.
- The 14 metabolite markers described above can be categorized into one of two groups, based on their detection in an aqueous extract and their propensity to ionize either positively or negatively. The metabolites with accurate masses (measured in Daltons) of 0495.3328, 517.3148, 519.3328, 521.3480, 523.3640, 541.3148, and 545.3460, where a +/−5 ppm difference would indicate the same metabolite, were detected as positive ions using methods presently described; metabolites with accurate masses (measured in Daltons) of 481.3171, 531.3123, 541.3422, 555.3101, 565.3394, 567.3546, and 569.3687, where a +/−5 ppm difference would indicate the same metabolite, were detected as negative ions using the methods presently described.
- The 14 metabolites described above relate to metabolites of the lysophospholipid class, for example, lysophosphatidylcholine, lysophosphatidylethanolamines, lysophosphatidyldimethylethanolamines, lysophosphatidylserines, lysosphingosylphosphorylcholines, lysophosphatidylglycerols, lysophosphatidylinositols, platelet activating factors (PAFs), and combinations thereof.
- The concentration of specific metabolites described above, including lysophospholipid species, is detected in order to diagnose prostate cancer or the risk of prostate cancer. Any combination of the above metabolites could be measured simultaneously, in a serial manner, or in different combinations to arrive at a diagnostic output.
- Structural characterization of the above metabolites may be carried out using methods well known to those skilled in the area. The principal characteristics that may be used to characterize the metabolites may include, but are not limited to accurate mass, molecular formula, polarity, acid/base properties, NMR spectra, and MS/MS or MSn spectra. Techniques used to determine these characteristics include, but are not limited to reverse phase LC-MS using a C18 column followed by analysis by MS, MS/MS fragmentation using collision induced dissociation (CID), NMR, and extraction. The data obtained can be used as fingerprints or unique identifiers of a particular metabolite under the experimental conditions specified. Any or all of the metabolites described by the present application may be fingerprinted under various conditions to provide additional information on the metabolites, for example, the structure or nature of the molecule.
- The metabolites within the optimal panel of metabolite markers described above can be further characterized by their MS/MS fragmentation patterns resulting from collision induced dissociation. In particular, metabolite with:
- accurate mass 495.3328 has an ionized mass of 496.3401 ([M+H]+, calcd. 496.3398 for C24H51NO7P+). The MS/MS fragments (MS/MS m/z) (relative intensity) are: 496 ([M+H]+, 90%), 478 (5%), 419 (1%), 313 (1%), 283 (1%), 258 (1%), 239 (1%), 184 (90%), 166 (1%), 104 (100%), 86 (70%); see
FIG. 7 , Table 3. - accurate mass 517.3148 has an ionized mass of 518.3219 ([M+H]+, calcd. 518.3241 for C26H49NO7P+). The MS/MS fragments (MS/MS m/z) (relative intensity) are: 518 ([M+H]+, 90%), 459 (10%), 415 (1%), 359 (1%), 341 (1%), 313 (1%), 281 (1%), 221 (1%), 104 (100%), 86 (30%); see
FIG. 8 , Table 4. - accurate mass 519.3328 has an ionized mass of 520.3401 ([M+H]+, calcd. 520.3398 for C26H51NO7P+). The MS/MS fragments (MS/MS m/z) (relative intensity) are: 520 ([M+H]+, 10%), 502 (1%), 461 (5%), 281 (1%), 221 (1%), 184 (100%), 166 (5%), 124 (1%), 86 (30%); see
FIG. 9 , Table 5. - accurate mass 521.3480 has an ionized mass of 522.3554 ([M+H]+, calcd. 522.3554 for C26H53NO7P+). The MS/MS fragments (MS/MS m/z) (relative intensity) are: 522 ([M+H]+, 100%), 504 (7%), 478 (1%), 357 (1%), 258 (1%), 221 (1%), 184 (60%), 124 (5%), 104 (80%), 86 (30%); see
FIG. 10 , Table 6. - accurate mass 523.3640 has an ionized mass of 524.3713 ([M+H]+, calcd. 524.3711 for C26H55NO7P+). The MS/MS fragments (MS/MS m/z) (relative intensity) are: 524 ([M+H]+, 100%), 506 (5%), 496 (1%), 478 (1%), 331 (1%), 313 (1%), 285 (1%), 258 (1%), 184 (70%), 166 (2%), 124 (5%), 104 (70%), 86 (30%); see
FIG. 11 , Table 7. - accurate mass 541.3148 has an ionized mass of 542.3219 ([M+H]+, calcd. 542.3241 for C28H49NO7P+). The MS/MS fragments (MS/MS m/z) (relative intensity) are: 542 ([M+H]+, 80%), 483 (25%), 284 (1%), 225 (1%), 184 (1%), 104 (100%), 86 (30%); see
FIG. 12 , Table 8. - accurate mass 545.3460 has an ionized mass of 546.3534 ([M+H]+, calcd. 546.3554 for C28H35NO7P+). The MS/MS fragments (MS/MS m/z) (relative intensity) are: 546 ([M+H]+, 90%), 528 (1%), 514 (1%), 487 (30%), 104 (100%), 86 (30%); see
FIG. 13 , Table 9. - accurate mass 481.3171 has an ionized mass of 480.3091 ([M−H]−, calcd. 480.3081 for C23H47NO7P−). The MS/MS fragments (MS/MS m/z) (relative intensity) are: 480 ([M−H]−, 100%), 255 (100%), 242 (10%), 224 (15%), 168 (10%), 153 (10%), 79 (25%); see
FIG. 14 , Table 12. - accurate mass 531.3123 has an ionized mass of 530.3035 ([M−H]−, calcd. 531.3114 for C30H46NO5P). The MS/MS fragments (MS/MS m/z) (relative intensity) are: (530, 100%), 480 (100%), 255 (100%), 242 (10%), 224 (15%), 168 (10%), 153 (10%), 79 (25%); see
FIG. 15 , Table 13. - accurate mass 541.3422 has an ionized mass of 540.3335 [M−H]−, calcd. 540.3293 for C25H51NO9P−). The MS/MS fragments (MS/MS m/z) (relative intensity) are: 540 ([M−H]−, 10%), 480 (100%), 255 (100%), 242 (10%), 224 (15%), 168 (10%), 153 (10%), 79 (25%); see
FIG. 16 , Table 14. - accurate mass 555.3101 has an ionized mass of 554.3013 ([M−H]−, calcd. 555.3172 for C25H50NO10P). The MS/MS fragments (MS/MS m/z) (relative intensity) are: 554 ([M−H]−, 10%), 494 (100%), 269 (100%), 242 (10%), 224 (15%), 168 (10%), 153 (10%), 79 (25%); see
FIG. 17 , Table 15. - accurate mass 565.3394 has an ionized mass of 564.3306 ([M−H]−, calcd. 564.3293 for C27H51NO9P−). The MS/MS fragments (MS/MS m/z) (relative intensity) are: 564 ([M−H]−, 100%), 504 (100%), 279 (100%), 242 (10%), 224 (15%), 168 (10%), 153 (10%), 79 (25%); see
FIG. 18 , Table 16. - accurate mass 567.3546 has an ionized mass of 566.3459 ([M−H]−, calcd. 566.3449 for C27H53NO9P−). The MS/MS fragments (MS/MS m/z) (relative intensity) are: 566 ([M−H]−, 10%), 506 (100%), 281 (100%), 242 (10%), 224 (15%), 168 (10%), 153 (10%), 79 (25%); see
FIG. 19 , Table 17. - accurate mass 569.3687 has an ionized mass of 568.3598 ([M−H]−, calcd. 568.3605 for C27H55NO9P−). The MS/MS fragments (MS/MS m/z) (relative intensity) are: 568 (m/z represents the [M+H]+ mass), 10%), 508 (100%), 283 (100%), 242 (10%), 224 (15%), 168 (10%), 153 (10%), 79 (25%); see
FIG. 20 , Table 18. - Based on the structural characterization of the 14 metabolite markers selected for the diagnosis of prostate cancer, it was determined that the metabolites are molecules related to lysophospholipids. Specifically these include, but are not limited to, lysophosphatidylcholine (lysoPC), lysophosphatidylethanolamine (lysoPE), lysophosphatidyldimethylethanolamine (lysoPdmE), lysophosphatidylserine (lysoPS), lysophosphatidylinositol (lysoPI), and lysophosphatidylglycerol (lysoPG), and platelet activating factors (PAFs), wherein the glycerol backbone is attached to a fatty acid at either SN1 or SN2, for example, 16:0, 18:0, 18:1, 18:2, 18:3, 20:3, 20:4, 20:5, 22:6, ceramide, or other, and a phosphate-containing choline, ethanolamine, dimethylethanolamine, serine, glycerol, or inositol is present at SN3.
- Phosphatidylcholine (PC) and phosphatidyethanaolamine (PE) represent the two major lipid components of biological membranes. PC and PE comprise a glycerol backbone containing a phosphate group attached to ethanolamine or choline at the SN3 position, and two fatty acids bound to the SN1 and SN2 positions through an acyl, ether, or vinyl-ether linkages. The fatty acids can be either saturated (more common at SN1), or unsaturated (more common at SN2). When phospholipids such as PC and PE are hydrolyzed by various phospholipases, a lysophospholipid such as lysoPC is generated along with a free fatty acid. Lysophospholipids have been implicated in numerous biological pathways and diseases, such as calcium signaling, atherosclerosis and inflammation (12).
- U.S. Published
Patent Application US 2004/0137541 (Mills et al.) focuses on the elevation of lysoPCs as key events in or during the progression of cancer. In particular, Mills et al. describe the elevation of lysoPCs in gynecological cancers. This is in contrast with the present invention, which shows that the panel of 14 biomarkers (i.e., metabolites with accurate masses of 519.3328, 541.3148, 545.3460, 555.3101, 541.3422, 565.3394, 521.3480, 517.3148, 567.3546, 523.3640, 531.3123, 481.3171, 495.3328, 569.3687) are decreased in the serum of patients with prostate cancer. - The present invention also provides high-throughput methods for the diagnosis of prostate cancer. The method involves fragmentation of the parent molecule; in a non-limiting example, this may be accomplished by a Q-Trap™ system. Detection of the metabolites may be performed using one of various assay platforms, including calorimetric chemical assays (UV, or other wavelength), antibody-based enzyme-linked immunosorbant assays (ELISAs), chip-based and polymerase-chain reaction for nucleic acid detection assays, bead-based nucleic-acid detection methods, dipstick chemical assays or other chemical reaction, image analysis such as magnetic resonance imaging (MRI), positron emission tomography (PET) scan, computerized tomography (CT) scan, nuclear magnetic resonance (NMR), and various mass spectrometry-based systems.
- In a further embodiment of the present invention, there is provided a method for diagnosing prostate cancer or the risk of prostate cancer in a patient. The method comprising the steps of:
-
- a) obtaining a sample from said patient;
- b) analyzing said sample to obtain quantifying data for one or more than one metabolite marker;
- c) obtaining a ratio for each of the one or more than one metabolite marker to an internal control metabolite;
- d) comparing each ratio of said one or more than one metabolite marker to the internal control metabolite to corresponding data obtained from one or more than one reference sample; and
- e) using said comparison to diagnose prostate cancer or the risk of prostate cancer.
- The step of analyzing the sample (step b) may comprise analyzing the sample using a mass spectrometer (MS). For example, and without wishing to be limiting, such mass spectrometer could be of the FTMS, orbitrap, time of flight (TOF) or quadrupole types. Alternatively, the mass spectrometer could be equipped with an additional pre-detector mass filter. For example, and without wishing to be limiting such instruments are commonly referred to as quadrupole-FTMS (Q-FTMS), quadrupole-TOF (Q-TOF) or triple quadrupole (TQ or QQQ). In addition, the mass spectrometer could be operated in either the parent ion detection mode (MS) or in MSn mode, where n>=2. MSn refers to the situation where the parent ion is fragmented by collision induced dissociation (CID) or other fragmentation procedures to create fragment ions, and then one or more than one of said fragments are detected by the mass spectrometer. Such fragments can then be further fragmented to create further fragments. Alternatively, the sample could be introduced into the mass spectrometer using a liquid or gas chromatographic system or by direct injection.
- In the method as just described above, the one or more than one reference sample may be a first baseline reference sample obtained from a control individual.
- In the method as described above, the one or more than one metabolite marker may be selected from the metabolites as listed in Table 1, or the metabolites may be the 14 metabolites described above. The “internal control metabolite” refers to an endogenous metabolite naturally present in the patient, provided the metabolite is not associated with the disease and does not vary over disease states; alternatively, the “internal control metabolite” may also refer to an external standard spiked into a serum sample prior to analysis. For example, and without wishing to be limiting, the ratio may be used to determine a diagnostic score for the test subject.
- Use of the ratio of the metabolite marker to the internal control metabolite offers measurements that are more stable and reproducible than measurements of absolute levels of the metabolite marker. As the internal control metabolite is present in all samples and does not vary over disease states, the sample-to-sample variability (due to handling, extraction, etc) is minimized.
- In the diagnostic methods of the present invention, the measurement of metabolite markers could be taken longitudinally over time in a test subject to determine the change in metabolite concentrations and likelihood of prostate cancer, or risk for the development of prostate cancer. The test subject would provide a sample at a start point, essentially establishing a baseline value; the test subject could then provide samples over time which would be compared to the start point sample. For example, and without wishing to be limiting, an increase in the intensity of the 14 metabolites described above would indicate a reduced risk of prostate cancer, while a decrease in the intensity would indicate an increased risk for prostate cancer.
- In yet another embodiment of the present invention, there is provided a method for evaluating the efficacy of a therapy for treating prostate cancer in a patient, comprising:
-
- a) obtaining a sample from said patient;
- b) analyzing said sample to obtain quantifying data for one or more than one metabolite marker;
- c) comparing said quantifying data to corresponding data obtained from one or more than one reference sample; and
- d) using said comparison to determine whether the therapy is improving the health state of the patient.
- Optionally, after the step of analyzing (step b), a ratio for each of the one or more than one metabolite marker to an internal control metabolite may be obtained. In this case, each ratio of said one or more than one metabolite marker to the internal control metabolite to corresponding data obtained from one or more than one reference sample is compared to evaluate the efficacy of the therapy.
- The step of analyzing (step b) may comprise analyzing the sample by liquid chromatography mass spectrometry (LC-MS), or alternatively may comprise analyzing the sample by direct injection or liquid chromatography and linear ion trap tandem mass spectrometry when the method is a high-throughput method.
- By the term “therapy” or “treatment”, it is meant any suitable course of therapy that may attempt to improve the health state of the patient being evaluated. When evaluating the efficacy of the therapy, the effect of the particular therapy in improving or degrading the health state of the patient will be measured. In doing so, a person of skill in the art would be capable of determining whether the therapy is effective for treating prostate cancer. Such treatment may include, but are not limited to, immunotherapy (for example, Bacillus Calmette-Guerin injection), radical prostatectomy, chemotherapy, radiation therapy, hormone therapy (including antiandrogens), or others.
- In the method as described, the one or more than one reference sample may be any suitable reference sample. For example, and without wishing to be limiting in any manner, the reference sample may be a plurality of samples obtained from control individuals or one or more than one pre-therapy baseline sample obtained from the patient; or any combination thereof. A pre-therapy baseline sample from the patient is particularly useful, as the variation in metabolites will then be specific to the patient.
- In the method as described above, the one or more than one metabolite marker may be selected from the metabolites as listed in Table 1, or the metabolites may be the 14 metabolites described above.
- The efficacy of a therapy as described above is evaluated based on the measurement of the metabolites and comparison to the reference sample, whereby a restoration of the metabolites towards a normal specified range would be indicative of a positive treatment effect.
- In an alternative method of evaluating the efficacy of a therapy for treating prostate cancer, a ratio for each of the one or more than one metabolite marker to an internal control metabolite can be obtained in step b); each ratio of the one or more than one metabolite marker to the internal control metabolite could then be compared to corresponding data obtained from one or more than one reference sample in step c).
- The present invention also provides high throughput methods for diagnosis of prostate cancer. The method may involve fragmentation of the parent molecule; in a non-limiting example, this may be accomplished by a Q-Trap™ system. Detection of the metabolites may be performed using one of various assay platforms, including colorimetric chemical assays (UV, or other wavelength), antibody-based enzyme-linked immunosorbant assays (ELISAs), chip-based and polymerase-chain reaction for nucleic acid detection assays, bead-based nucleic-acid detection methods, dipstick chemical assays or other chemical reaction, image analysis such as magnetic resonance imaging (MRI), positron emission tomography (PET) scan, computerized tomography (CT) scan, nuclear magnetic resonance (NMR), and various mass spectrometry-based systems.
- The HTS method may involve the measurement of intensity, peak area or summed scans of each selected daughter ion per biomarker, as well as daughter ions for one or more internal standards added to each sample. A ratio may then be generated by dividing each biomarker transition by an internal standard transition. The internal standard provides an indication of the instrument sensitivity, and allows for the normalization of biomarker transition signals across multiple samplings. The ratios generated for the disease-free or healthy population become the defining parameter for the “normal” distribution. A validation set of samples comprising normals and prostate-positives are then analyzed and compared to the normal distribution. This results in essentially two distributions, one for the normal population and one for the prostate-positive population. A cutoff ratio between the two distributions is then selected to determine the sensitivity and specificity of the biomarker assay.
- In the methods of the present invention, any individual or combination of metabolites described herein could be combined with existing cancer markers to arrive at a diagnostic/prognostic output. Such existing markers may include, but are not limited to prostate specific antigen (PSA), carcinoembryonic antigen (CEA), cancer antigen (CA) 19-9, C15-3, or CA125.
- The above methods may provide medical professionals with a test to better determine the appropriate treatment regimen for a subject based upon the stage at which the cancer is detected. Since the diagnostic methods are relatively non-invasive, a large number of otherwise undiagnosed cases could be identified, particularly early cases, for which specific interventions may be administered by medical professionals. The methods of the present invention may also be used to detect recurrence of cancer, possibly prior to clinical symptoms of the recurrence. Such knowledge could be subsequently used to properly direct treatment regimens that may have improved chances of preventing the recurrence.
- The impact of the present invention on the diagnosis of prostate cancer would be tremendous, as literally everyone could be screened longitudinally throughout their lifetime to assess risk. Given that the performance characteristics of the test of the present invention are representative for the general population, this test alone may be superior to any other currently available screening method, as it may have the potential to detect disease progression prior to the emergence of clinical symptoms.
- The present invention will be further illustrated in the following examples. An outline of the present invention including each of the examples listed below is shown in
FIG. 1 . - Differentially expressed metabolites are identified in clinically diagnosed prostate cancer-positive patients and normal patients.
- Clinical Samples. For the prostate cancer screening assay described, serum samples were obtained from representative populations of healthy prostate cancer-free individuals and of professionally diagnosed prostate cancer-positive patients (SeraCare LifeSciences, Inc). The biochemical markers of prostate cancer described below were derived from the analysis of 24 serum samples from prostate cancer-positive patients and 25 serum samples from healthy controls. Samples in both groups were from a diverse population of individuals, ranging in age, ethnicity, weight, occupation, and displaying varying non-prostate cancer-related health-states. All samples were single time-point collections, and the prostate cancer samples were taken either immediately prior to, or immediately following surgical resection of a tumor. All samples were taken prior to chemo or radiation therapy.
- The metabolites contained within the 49 serum samples were separated into polar and non-polar extracts by sonication and vigorous mixing (vortex mixing).
- The analysis of serum extracts (24 prostate cancer, 25 normal) was made by direct injection into a FTMS and ionization by either electrospray ionization (ESI) or atmospheric pressure chemical ionization (APCI) in both positive and negative modes. Sample extracts were diluted either three or six-fold in methanol:0.1% (v/v) ammonium hydroxide (50:50, v/v) for negative ionization modes, or in methanol:0.1% (v/v) formic acid (50:50, v/v) for positive ionization modes. For APCI, sample extracts were directly injected without diluting. All analyses were performed on a Bruker Daltonics APEX III Fourier transform ion cyclotron resonance mass spectrometer equipped with a 7.0 T actively shielded superconducting magnet (Bruker Daltonics, Billerica, Mass.). Samples were directly injected using ESI and APCI sources at a flow rate of 600 μL per hour. Ion transfer/detection parameters were optimized using a standard mix of serine, tetra-alanine, reserpine, Hewlett-Packard tuning mix and the adrenocorticotrophic hormone fragment 4-10. In addition, the instrument conditions were tuned to optimize ion intensity and broad-band accumulation over the mass range of 100-1000 amu according to the instrument manufacturer's recommendations. A mixture of the abovementioned standards was used to internally calibrate each sample spectrum for mass accuracy over the acquisition range of 100-1000 amu.
- In total six separate analyses comprising combinations of extracts and ionization modes were obtained for each sample:
-
- Aqueous Extract
- 1. Positive ESI (analysis mode 1101)
- 2. Negative ESI (analysis mode 1102)
- Organic Extract
- 3. Positive ESI (analysis mode 1201)
- 4. Negative ESI (analysis mode 1202)
- 5. Positive APCI (analysis mode 1203)
- 6. Negative APCI (analysis mode 1204)
- Aqueous Extract
- Mass Spectrometry Data Processing. Using a linear least-squares regression line, mass axis values were calibrated such that each internal standard mass peak had a mass error of <1 p.p.m. compared with its theoretical mass. Using XMASS software from Bruker Daltonics Inc., data file sizes of 1 megaword were acquired and zero-filled to 2 megawords. A sinm data transformation was performed prior to Fourier transform and magnitude calculations. The mass spectra from each analysis were integrated, creating a peak list that contained the accurate mass and absolute intensity of each peak. Compounds in the range of 100-2000 m/z were analyzed. In order to compare and summarize data across different ionization modes and polarities, all detected mass peaks were converted to their corresponding neutral masses assuming hydrogen adduct formation. A self-generated two-dimensional (mass vs. sample intensity) array was then created using DISCOV Ametrics™ software (Phenomenome Discoveries Inc., Saskatoon, SK, Canada). The data from multiple files were integrated and this combined file was then processed to determine all of the unique masses. The average of each unique mass was determined, representing the y axis. This value represents the average of all of the detected accurate masses that were statistically determined to be equivalent. Considering that the mass accuracy of the instrument for the calibration standards is approximately 1 ppm, it would be evident to one skilled in the art that these average masses would include all masses that fall within +/−2 ppm of this average mass, or even +/−5 ppm of this average mass. A column was created for each file that was originally selected to be analyzed, representing the x axis. The intensity for each mass found in each of the files selected was then filled into its representative x,y coordinate. Coordinates that did not contain an intensity value were left blank. Once in the array, the data were further processed, visualized and interpreted, and putative chemical identities were assigned. Each of the spectra were then peak picked to obtain the mass and intensity of all metabolites detected. These data from all of the modes were then merged to create one data file per sample. Then, the data from all 90 samples was merged and aligned to create a two-dimensional metabolite array in which each sample is represented by a column and each unique metabolite is represented by a single row. In the cell corresponding to a given metabolite sample combination, the intensity of the metabolite in that sample was displayed. When the data was represented in this format, metabolites showing differences between groups of samples (i.e., normal and cancer) were determined.
- Advanced Data Interpretation. A student's T-test was used to select for metabolites that differ between the normal and the prostate cancer-positive samples (p<0.05). 492 metabolites met this criterion (as listed in Table 1). Each of these features differs statistically between the two populations and therefore each has potential diagnostic utility. The features are described by their accurate mass and analysis mode, which together are sufficient to provide the putative molecular formulas and chemical characteristics (such as polarity and putative functional groups) of each metabolite. The ability of the 492 metabolites to discriminate between the control and prostate cancer serum is shown by the PCA plot in
FIG. 2 . A relatively clear distinction (as shown by the dotted line) between the controls (in grey) and prostate cancers (in black) can be drawn, which indicates that the 492 metabolites together can diagnose a prostate cancer-positive serum sample relative to control serum. - However, the incorporation and development of 492 signals into a commercially useful assay is not practical, therefore a combination of univariate analyses and chemical information was used to further select a subset of 14 metabolites from the 492 for additional characterization. The subset of 14 metabolites selected were detected in two different modes: those with accurate masses (measured in Daltons) of 495.3328, 517.3148, 519.3328, 521.3480, 523.3640, 541.3148, and 545.3460, where a +/−5 ppm difference would indicate the same metabolite, were detected as positive ions using methods described in this application and metabolites with accurate masses (measured in Daltons) of 481.3171, 531.3123, 541.3422, 555.3101, 565.3394, 567.3546, and 569.3687 were detected as negative ions using the methods described within this application. All metabolite masses represent 12C molecules.
- The diagnostic accuracy of the 14 masses is shown through a PCA plot in
FIG. 3 , which illustrates a clear separation between disease and controls. In fact, separating the controls from the prostate cancers using the dotted line results in a sensitivity of 84% and specificity of 100%. A graph of the relative intensities of the 14 masses as detected on the FTICR is shown inFIG. 4 (using data scaled between 0 and 1 for each mass). Each of the markers appears to show a reduction or deficiency of approximately 50% (on average) in the prostate cancer sera versus control sera. - Based upon these results, a clear distinction can be made between the serum of prostate cancer-positive patients and healthy (prostate cancer negative) individuals. Therefore, these markers, which are capable of identifying and distinguishing prostate cancer-positive and prostate cancer-negative serum, can form the basis for a prostate cancer diagnostic test as presently described.
- The metabolites and their associations with the clinical variables described in Example 1 were further confirmed using an independent mass spectrometry system. Representative aqueous sample extracts from each variable group (10 controls and 9 prostate cancers) were re-analyzed by LC-MS using an HP 1050 high-performance liquid chromatography, or equivalent interfaced to an ABI Q-Star, or equivalent mass spectrometer to obtain mass and intensity information for the purpose of identifying metabolites that differ in intensity between the clinical variables under investigation. Data were acquired using full-scan detection in both positive and negative ESI modes, and the resulting spectral data calibrated and aligned using Phenomenome Profiler software. We identified a retention time window (time at which molecular species are eluting off of the HPLC column), of approximately 28 to 34 minutes under the specified chromatographic conditions.
FIG. 5 shows the extracted mass spectra within this retention time range for the controls (A), prostate cancers (B), and the net difference between the controls and prostate cancers (C). The boxed region shows the mass range where the subset of 14 masses previously described was redetected. As previously observed, these molecules were significantly lower in intensity in the prostate cancer sera compared to the controls. A bar graph of the average raw intensities (scaled between 0 and 1) for each of the 14 metabolites as detected using HPLC-coupled TOF-MS, is shown inFIG. 6 . - Various characteristics can be used for structure elucidation of metabolites include accurate mass and molecular formula determination, polarity, acid/base properties, NMR spectra, and MS/MS or MSn spectra. These data can be used as fingerprints of a particular metabolite and are unique identifiers of a particular metabolite regardless of whether the complete structure has been determined. The data include:
- 1. LC retention time. The extracts containing the metabolites of interest are subjected to reverse phase LC-MS using a C18 column and analysis by MS to determine their retention time under standardized conditions. When the extracts were subjected to LC/MS analysis, all 14 metabolites co-eluted within 26-34 min range.
- 2. MS/MS spectra. The 14 metabolites of interest were further characterized by performing MS/MS fragmentation using collision induced dissociation (CID). This MS/MS analysis was performed in real time (i.e. during the chromatographic elution process) or off-line on fractions collected from the chromatographic separation process.
- Aqueous fractions from 9 prostate cancer and 10 normal sample extracts were evaporated to dryness under nitrogen gas and reconstituted in 100 μL of water:methanol:formic acid (97.9:2:0.1). 5 μL of the reconstituted sample was used for HPLC (Agilent 1100 system with
MetaSil AQ 3 um, C18, 100×2.0 mm column, Varian Inc.) for full scan and MS/MS. The mobile phase consisted of water:methanol:formic acid (97.9:2:0.1) as solvent A, and 0.1% formic acid in methanol as solvent B. At a flow rate of 0.2 ml/min, the solvent gradient was as follows: Solvent A was held at 100% for the first minute, then changed to 20% A and 80% B using a linear gradient over 10 min, and then held at 20% A, 80% B for 9 min; then the solvent mixture was changed to 100% B during the next 10 min using a linear gradient, and was held at 100% B for 15 minutes. Finally, the solvent mixture was held at 100% A to equilibrate the column for duration of 20 min (total elapsed time 65 min). Eluate from the HPLC was analyzed using an ABI QSTART XL mass spectrometer fitted with an ESI (TurbolonSpray™) source in positive and negative mode. - For time-of-flight full scan mode, the “TOF-MS” scan type was used with an accumulation time of 1.0 sec, a mass scan range of 50 to 1500 Da, and duration time of 60 min. The source parameters at positive ESI mode were as follows: Ion source gas 1 (GS1) 55; Ion source gas 2 (GS2) 90; Curtain gas (CUR) 40; Nebulizer Current (NC) 3.0;
Temperature 400° C.; Declustering Potential (DP) 60; Focusing Potential (FP) 265; Declustering Potential 2 (DP2) 15. The source parameters at negative ESI mode were as follows: Ion source gas 1 (GS1) 55; Ion source gas 2 (GS2) 70; Curtain gas (CUR) 40; Nebulizer Current (NC) 0;Temperature 400° C.; Declustering Potential (DP) −55; Focusing Potential (FP) −265; Declustering Potential 2 (DP2) −15. - In MS/MS mode, the “Product Ion” scan type was used with an accumulation time of 1.0 sec, a scan range of 50 to 650 Da, and a duration time of 60 min. All source parameters are the same as above, with collision energy (CE) settings of 20V, 35V, 50V at positive mode and −20V, −35V, −50V at negative mode. The collision gas (CAD, nitrogen) was set at 5.
- The structure of a given molecule dictates a specific fragmentation pattern under defined conditions and is unique for that molecule (equivalent to a person's fingerprint)—even slight changes to the molecule's structure can result in a different fragmentation pattern. In addition to providing a fingerprint of the molecule's identity, the fragments generated by CID were used to gain insights regarding the structure of the metabolites.
- Upon constructing possible molecular formulae for the positive mode biomarker panel (i.e., metabolites with accurate masses of 495.3328, 517.3148, 519.3328, 521.3480, 523.3640, 541.3148, and 545.3460), all seven biomarkers were found to possess similar formulae of RNO7P, where R is the variable fatty acid type, indicating that they could be phospholipid choline-related compounds. A summary of the proposed structures based upon MS/MS interprestations is shown in Table 2. The fragmentation spectra for the 7 metabolites detected in the positive ionization mode are shown in
FIGS. 7 to 13 (collision energies of 20 (A), 35 (B) and 50 (C) volts), and the masses of the fragments and molecular formula assignments listed in Tables 3 through 9. Each table lists the daughter ions resulting from the CID, as well as the proposed structures of the fragment ions and the fragment losses. - The MS/MS data obtained in the positive mode ESI indicates that each of the seven metabolites abstracted a proton, resulting in the corresponding molecular ion ([M+H]+) in their MS/MS spectra. This suggests the protonation of the phosphate group leaving the positively charged quaternary ammonium ion as the parent ion. Evidence for losing the quaternary amine group, (CH3)3NH+, [M+H−60]+) was observed for all of the metabolites confirming the presence of the choline head group in these metabolites. Fragment ions due to phosphocholine (C5H15NO4P+, m/z 184) and ethanol-quaternary amine (C5H14NO+, m/z 104) were other indications suggesting phosphocholine-type structures. Loss of H2O from the molecular ions was also observed confirming the presence of free hydroxy groups at sn-2 positions inherent in lysolipid-type structures.
- Fragment ions, though weak, were observed for either a sn-1 fatty acid side chain or loss thereof. For example, for metabolite 495.3328, where palmitic acid was thought to be the sn-1 fatty acid, the fragment ion representing m/z 458 was assigned as plausibly due to the loss of C16H32O unit. Another fragment ion at m/z 239 (C16H31O+) though low in intensity was also present signifying the sn-1 fatty acid itself. Based on these deductions, the structure was proposed as 2-hydroxy-1-palmitoyl-sn-glycero-3-phosphocholine. The structure of 495.3328 was confirmed to be 2-hydroxy-1-palmitoyl-sn-glycero-3-phosphocholine (commercial standard) by comparison of their LC/MS and MS/MS spectral data (fragment ion comparisons shown in Table 10).
- The MS/MS spectral data of the remaining 6 metabolites were very similar to that of 495.3328, the only differences being differences in the sn-1 fatty acid side chains. For metabolites 519.3328 (520 M−H), 521.3481 (522 M−H), and 523.3640 (524 M−H), loss of H2O from their parent ions resulted in fragment ions m/
z - The fragmentation spectra of the seven metabolites detected in the negative ionization mode (i.e., metabolites with accurate masses of 481.3171, 531.3123, 541.3422, 555.3101, 565.3394, 567.3546, and 569.3687), are shown in
FIGS. 14 to 20 (collision energies of 20, 35 and 50 volts). The molecular formulae suggested that four (541.3422, 565.3394, 567.3546, 569.3687) out of the seven biomarkers were found to possess similar formulae of RNO9P, where R is the variable fatty acid type, indicating that they could be phospholipid ethanolamine related compounds. Table 11 summarizes the molecular formulae and putative structures of the molecules based upon the MS/MS data. Tables 12 to 18 list the fragment ion masses, putative formulas of the fragments and fragment losses as well as putative structures for each fragment. - In the negative mode with electro spray ionization, (ESI), each of the seven molecules loose a proton resulting in the corresponding molecular ion ([M−H+]−) in their MS/MS spectra. This suggests the de-protonation of the phosphate group, leaving the negatively charged phosphate ion as the parent ion. Fragment ions were observed for sn-1 fatty acid side chain for the markers 481.3168 and 541.3422 (palmityl, C16H31O2, m/z 255), 565.3394 (linoleyl, C18H31O2, m/z 279), 567.3546 (oleyl, C18H33O2, m/z 281), and 569.3687 (stearyl, C18H35O2, m/z 283) as prominent signals in their MS/MS spectra. Upon comparing the MS/MS spectra of 569.3687 to its corresponding lysophospholipid ethanolamine counterpart, 2-hydroxy-1-stearyl-sn-glycero-3-phosphoethanolamine (C23H48NO7P, exact mass: 481.317) (commercial standard), a number of similarities were observed (Table 19). The initial fragment loss from the parent ion [M+H]− of 569.3687 was corresponding to a mass loss of 60 Dalton unit which is associated with the formula C2H4O2. This fragment loss was consistent to all the markers of the above panel with exception to 481.3171 which has a formula of C23H48NO7P similar to the general formulation of the sn2-hydroxyphosphoethanolamine types. In comparing the fragment m/z 508 of 569.3687 to the parent ion of its lysophosphoetanolamine commercial standard (m/z 480), a difference of only 28 Dalton units was observed, which lead to the derivation of N,N-dimethyl phosphoethanolamine type of structures for the biomarker panel. The fragment losses after the loss of sn2 fatty acid, m/
z - While the reported MS/MS data is consistent with molecules of lysophospholipid species, the present invention also includes structures where functional groups or reported fragments are connected in ways that are not presently indicated.
- A high throughput screening (HTS) method was developed for diagnosing prostate cancer. The method described below is compatible with current laboratory instrumentation and triple-quadrupole mass spectrometers that are in place in many laboratories globally (13, 14).
- High throughput screening (HTS) was performed with a linear ion trap mass spectrometer (Q-trap 4000, Applied Biosystem) coupled with Agilent 1100 LC system. Serum samples were extracted as described in Example 1. The aqueous fraction was mixed 1:3 with acetonitrile to precipitate proteins prior to use for the analysis of each sample. 15 μL of internal standard (reserpine in methanol: 100 μg/mL for negative ESI; 1 μg/mL for positive ESI) and 108 μL of 3:1 (acetonitrile):(1% formic acid in ddH2O) was added to each 12 μL sample aliquot for a total volume of 135 μL. The autosampler injected 100 μL of the sample by flow-injection analysis (FIA) into an ABI 4000QTRAP. The carrier solvent was 60:40 (methanol):(1% formic acid in ddH2O), with a flow rate of 450 μL/min into the APCI source.
- The MS/MS HTS methods (negative and positive ESI) were developed on a quadrupole linear ion trap ABI 4000QTRAP mass spectrometer equipped with a TurboV™ source with an Ionspray probe. The source gas parameters were as follows:
- Negative ESI: (CUR: 10.0, CAD: 6, IS: −4500, TEM: 500, GS1: 50, GS2: 60, interface heater on. “Compound” settings were as follows: entrance potential (EP): −10, and collision cell exit potential (CXP): −10.0); Positive ESI: (CUR: 10.0, CAD: 6, IS: 5500, TEM: 500, GS1: 30, GS2: 60, interface heater on. “Compound” settings were as follows: entrance potential (EP): 10, and collision cell exit potential (CXP): 15.0).
- The methods were based on the multiple reaction monitoring (MRM) of 2 MRM transitions for each biomarker, and 2 MRM transitions for the internal standard (reserpine, though other compounds may be used) for a total of 16 MRM's for each method. Each of the transitions was monitored for 100 msec or 70 msec for positive and negative ESI modes, respectively. The total acquisition time per sample was approximately 1 min. Briefly, each method measured the intensities of each of 14 biomarker MRM transitions (from 7 parents) and 2 internal standard (IS) MRM transitions (from 1 parent) as shown in Table 20. A patient score was then generated by determining the lowest mean-normalized log(2) transformed ratio of the seven measured biomarker:IS transitions per patient. This value was then compared to a distribution of scores generated from normal individuals, and a prostate cancer risk factor was assigned accordingly. It was confirmed that the ABI 400QTRAP was capable of accurately measuring the MRM transition peak areas using the method described above by plotting the peak area ratios of the biomarker transitions versus the internal standard transitions for each of the seven biomarkers for each method. In addition, the HTS method also incorporates a series of dilutions of extracted human reference serum material, which allowed for the determination and assurance of instrument linearity. If the calibration curve has a R2 value <0.98, then the sample run is considered a failure and the sample needs to be rerun.
- As described above, the prostate cancer HTS triple-quad method comprises two independent data acquisition components due to the fact that half the molecules are detected in negative mode, and the other half in positive mode.
- For the seven lysophosphaditylcholine molecules detected in the positive mode (i.e., metabolites with accurate masses of 495.3328, 517.3148, 519.3328, 521.3480, 523.3640, 541.3148, and 545.3460), the transitions used for measurement are shown in
FIG. 21A , and comprise two daughter ion transitions per molecule for each of the biomarkers (a and b, with the exception of 546.3, in which a single transition was used), and two internal standard transitions per sample (1 and 2). Dividing each biomarker transition by each internal standard transition therefore resulted in 26 ratios per biomarker. A normal reference serum sample is also analyzed at varying dilutions to assess instrument linearity, for which R-squared coefficients can be calculated. The average R-squared values for data obtained below for each transition ratio is shown inFIG. 21A . A sample plot of the average intensities of the dilutions for 496.3/184.2a1 is shown inFIG. 21B . The ratio data was then normalized to the mean of the control population and log(2) transformed. The lowest ratio value of per patient was then selected as the final output score. The distributions of these patient scores were then visualized to determine the optimum diagnostic cut-off point. - The same 24 prostate cancer serum samples used for the discovery phase were re-analyzed using this method, along with an expanded independent set of 147 male control samples. The average ratio (not log transformed) for each of the 26 transitions in the control and prostate cancer cohorts is shown in
FIG. 21C . As expected, the intensity of each ratio is lower in the prostate cancer cohort compared to the controls. - The final patient scores (lowest detected log ratio per patient) for these subjects are shown in the scatter plot in
FIG. 22A . The results clearly show that the patient scores of the 24 prostate cancer patients (black triangles) were significantly lower than most of the disease-free male subjects (light grey squares). Plotting the distributions of the subjects based upon the patient score, as shown inFIG. 22B , mirrored the previous findings and showed a shift in the distribution of the prostate patients (black bars) to the left, indicating an overall lower patient score in the majority of prostate cancer patients relative to the controls. Setting a cut-off patient score of −1.25, indicated by the dotted line inFIG. 22A , resulted in approximately 75% sensitivity (that is, 75% of the cancer patients have scores of less than −1.25), and 91% specificity (that is, 91% of the control male population has a score greater than −1.25). The p-value generated from at-test using the patient scores was 1.09E-14 between the controls and prostate cancer samples. - For the seven lysolipid species detected in the negative mode (481.3171, 531.3123, 541.3422, 555.3101, 565.3394, 567.3546, and 569.3687), the daughter ion transitions for the HTS method are shown in
FIG. 23A . The method is similar to the positive mode, with four ratios (from two internal standard measurements) generated per parent ion, resulting in 28 total ratios per patient sample. The average r-squared values resulting from the analysis of multiple diluted serum samples for each of the ratios is also shown inFIG. 23A . A plot of the standard curve for the first transition ratio (480.3/255.4a1) is shown inFIG. 23 B as an example. As expected, the ratios for each of the transitions was lower in the prostate cancer cohort relative to the controls, as shown in the bar graph inFIG. 23C . - The final patient scores (lowest detected log ratio per patient) for the seven metabolites detected in the negative mode are shown in the scatter plot in
FIG. 24A . The results clearly show that the patient scores of the 24 prostate cancer patients (black triangles) were significantly lower than most of the disease-free male subjects (light grey squares). Plotting the distributions of the subjects based upon the patient score, as shown inFIG. 24B , mirrored the previous findings and showed a shift in the distribution of the prostate patients (black bars) to the left, indicating an overall lower patient score in the majority of prostate cancer patients relative to the controls. Setting a cut-off patient score of −1.00, indicated by the dotted line inFIG. 24A , results in approximately 79% sensitivity (that is, 79% of the cancer patients have scores of less than −1.00), and 81% specificity (that is, 81% of the control male population has a score greater than −1.25). The p-value generated from a t-test using the patient scores was 4.11E-14 between the controls and prostate cancer samples. - As would be known to a person of skill in the art, the cut-off value could be move either up or down to favor either sensitivity or specificity, respectively. This performance is superior to that achievable with PSA testing. Since this method is accurate and can be run rapidly on a serum sample, screening the male population would be expected to identify otherwise undetected cases, and would therefore have a major impact on prostate cancer mortality.
- As would also be known to a person of skill in the art, various subsets of the measured transitions and ratios thereof could be used to optimize the diagnostic accuracy. Likewise, performing serial analysis of each of the positive and negative modes and then stacking or combining the results may also improve the sensitivity and specificity. For example, patients incorrectly diagnosed using only one method (positive mode) may be correctly classified with the negative mode, or vise-versa. Alternatively, data from both positive and negative modes could be acquired first, followed by the generation of a single patient score based upon the total cumulative dataset.
- All citations are hereby incorporated by reference.
- The present invention has been described with regard to one or more embodiments. However, it will be apparent to persons skilled in the art that a number of variations and modifications can be made without departing from the scope of the invention as defined in the claims.
-
- 1. Troyer D A, Mubiru J, Leach R J, Naylor S L. Promise and challenge: Markers of prostate cancer detection, diagnosis and prognosis. Dis
Markers 2004; 20(2): 117-28. - 2. Mettlin C J, Murphy G P, Rosenthal D S, Menck H R. The National Cancer Data Base report on prostate carcinoma after the peak in incidence rates in the U.S. The American College of Surgeons Commission on Cancer and the American Cancer Society. Cancer 1998; 83(8):1679-84.
- 3. Thompson I M, Goodman P J, Tangen C M, et al. The influence of finasteride on the development of prostate cancer. N Engl J Med 2003; 349(3):215-24.
- 4. Gann P H, Hennekens C H, Stampfer M J. A prospective evaluation of plasma prostate-specific antigen for detection of prostatic cancer. Jama 1995; 273(4):289-94.
- 5. Schroder F H, van der Cruijsen-Koeter I, de Koning H J, Vis A N, Hoedemaeker R F, Kranse R. Prostate cancer detection at low prostate specific antigen. The Journal of
urology 2000; 163(3):806-12. - 6. Reo N V. NMR-based metabolomics. Drug Chem Toxicol 2002; 25(4):375-82.
- 7. Taylor J, King R D, Altmann T, Fiehn O. Application of metabolomics to plant genotype discrimination using statistics and machine learning. Bioinformatics 2002; 18 Suppl 2:S241-8.
- 8. Katajamaa M, Oresic M. Processing methods for differential analysis of LC/MS profile data. BMC Bioinformatics 2005; 6:179.
- 9. Aharoni A, Ric de Vos C H, Verhoeven H A, et al. Nontargeted metabolome analysis by use of Fourier Transform Ion Cyclotron Mass Spectrometry. Omics 2002; 6(3):217-34.
- 10. Hirai M Y, Klein M, Fujikawa Y, et al. Elucidation of gene-to-gene and metabolite-to-gene networks in arabidopsis by integration of metabolomics and transcriptomics. The Journal of biological chemistry 2005; 280(27):25590-5.
- 11. Hirai M Y, Yano M, Goodenowe D B, et al. Integration of transcriptomics and metabolomics for understanding of global responses to nutritional stresses in Arabidopsis thaliana. Proceedings of the National Academy of Sciences of the United States of
America 2004; 101(27): 10205-10. - 12. Okajima F, Sato K, Tomura H, et al. Stimulatory and inhibitory actions of lysophosphatidylcholine, depending on its fatty acid residue, on the phospholipase C/Ca2+ system in HL-60 leukaemia cells. The Biochemical journal 1998; 336 (Pt 2):491-500.
- 13. Hopfgartner G, Varesio E, Tschappat V, Grivet C, Bourgogne E, Leuthold L A. Triple quadrupole linear ion trap mass spectrometer for the analysis of small molecules and macromolecules.
J Mass Spectrom 2004; 39(8):845-55. - 14. Xia Y Q, Miller J D, Bakhtiar R, Franklin R B, Liu D Q. Use of a quadrupole linear ion trap mass spectrometer in metabolite identification and bioanalysis. Rapid Commun Mass Spectrom 2003; 17(11):1137-45.
-
TABLE 1 List of metabolites discriminating prostate cancer-positive from normal serum (p < 0.05). Detected Analysis Avg. Normal StDev. Avg. Prostate StDev. Normal/Prostate Mass Mode P_Value (log2) Normal (log2) Prostate (log2 ratio) 174.1408 1203 0.0079 1.85 0.25 1.62 0.32 1.14 188.1566 1203 0.0227 1.46 0.36 1.12 0.63 1.31 194.0804 1203 0.0001 0.72 0.8 0 0 0.72 202.0454 1101 0.0279 2.58 1.09 3.15 0.59 0.82 205.8867 1101 0.048 2.81 0.28 2.96 0.21 0.95 216.0401 1102 0.0216 3.02 0.84 3.5 0.51 0.86 218.0372 1102 0.0137 1.35 0.78 1.85 0.58 0.73 226.0687 1102 0.0163 1.94 0.86 2.49 0.67 0.78 228.1476 1101 0.0001 0.07 0.36 1.25 1.28 0.06 232.9133 1202 0.0049 2.46 0.22 2.04 0.68 1.21 242.2251 1204 0.0024 2.02 0.32 1.68 0.42 1.2 243.0719 1101 0.0116 4.53 0.79 5.04 0.54 0.9 244.056 1101 0.0043 1.54 1.14 2.41 0.87 0.64 247.9578 1102 0.0003 0 0 1.58 2 0 252.2096 1204 0.0063 1.84 0.33 1.44 0.61 1.28 258.2482 1204 0.0421 1.97 0.33 1.77 0.33 1.11 268.2412 1204 0.0209 2.42 0.42 2.15 0.36 1.12 272.2357 1204 0.0307 2.75 0.52 2.45 0.44 1.13 273.874 1101 0.0349 2.76 0.29 2.93 0.23 0.94 276.2096 1204 0.0001 2.77 0.46 2.24 0.42 1.24 278.2256 1204 0.0013 4.95 0.42 4.54 0.42 1.09 279.2287 1204 0.0047 2.83 0.47 2.44 0.45 1.16 280.2414 1204 0.0401 8.14 0.45 7.89 0.36 1.03 281.2448 1204 0.0352 5.77 0.45 5.52 0.36 1.05 283.2602 1204 0.0475 6.56 0.42 6.33 0.38 1.04 283.9028 1101 0.0061 3.14 0.33 3.36 0.2 0.93 292.204 1204 0.0096 1.9 0.54 1.48 0.57 1.29 296.2358 1204 0.0229 4.48 0.55 4.16 0.38 1.08 298.2519 1204 0.004 4.74 0.5 4.35 0.38 1.09 299.2558 1204 0.0034 2.51 0.49 2.13 0.37 1.18 300.2098 1204 0.0026 1.83 0.33 1.37 0.64 1.34 300.2676 1204 0.0001 1.26 0.63 0.49 0.63 2.59 302.2256 1204 8.97E−06 3.69 0.4 3.05 0.5 1.21 304.2394 1202 0.0088 4.39 0.47 4.03 0.45 1.09 304.241 1204 1.34E−05 5.07 0.31 4.64 0.32 1.09 305.243 1202 0.0123 2.4 0.68 1.8 0.91 1.33 305.2439 1204 0.0001 2.77 0.32 2.34 0.36 1.19 306.257 1204 0.0003 3.14 0.39 2.65 0.5 1.19 308.2715 1204 0.0171 1.96 0.58 1.54 0.62 1.28 310.2154 1204 0.0128 2.29 0.47 1.99 0.32 1.15 310.2884 1204 0.0322 2.39 0.52 2.03 0.62 1.18 312.2313 1204 0.0018 2.69 0.33 2.41 0.26 1.12 312.304 1204 0.0013 1.22 0.82 0.51 0.62 2.41 314.2464 1204 0.0049 1.88 0.37 1.45 0.63 1.3 317.9626 1101 0.0053 0.86 1.23 1.81 1.02 0.48 320.2358 1204 4.37E−05 1.86 0.56 0.99 0.77 1.87 326.2262 1204 0.0052 1.79 1.03 0.96 0.95 1.87 326.2476 1204 0.0425 0.79 0.68 1.18 0.59 0.68 327.0326 1204 0.002 2.61 0.31 2.32 0.32 1.13 328.2628 1204 0.0356 1.75 0.25 1.93 0.31 0.91 329.2426 1202 0.0399 1.25 1 0.67 0.91 1.86 329.2445 1204 0.0147 0.91 0.83 0.39 0.59 2.33 330.2568 1204 0.0428 2.25 0.4 1.93 0.66 1.17 331.8326 1101 0.0273 2.7 0.32 2.89 0.26 0.93 339.9964 1101 0.0003 1.94 0.95 2.77 0.43 0.7 340.2977 1203 0.0156 2.4 0.41 2.12 0.36 1.13 341.8614 1101 0.017 3.34 0.39 3.58 0.27 0.93 342.2198 1204 0.0159 0.71 0.82 0.22 0.52 3.27 351.8906 1101 0.0391 3.38 0.41 3.59 0.25 0.94 354.1668 1202 0.0008 0 0 1.08 1.51 0 368.3437 1203 0.0146 10.86 0.29 10.67 0.24 1.02 369.3474 1203 0.0232 9.26 0.25 9.1 0.22 1.02 371.3538 1203 0.0087 3.05 0.27 2.84 0.26 1.07 382.2903 1204 0.0045 0.04 0.18 0.61 0.94 0.06 392.294 1204 0.0001 1.81 0.96 0.63 1 2.88 411.3186 1202 0.0044 2.99 0.29 2.74 0.3 1.09 430.3083 1204 0.0003 2.09 0.28 1.82 0.2 1.15 430.3818 1204 0.0064 4.04 0.69 3.5 0.63 1.15 431.3861 1204 0.0169 2.53 0.65 2.11 0.52 1.2 432.3686 1204 0.0107 1.6 0.9 0.87 1.01 1.84 452.2536 1204 0.0023 1.71 0.34 1.21 0.69 1.41 472.3925 1203 0.0052 3.93 0.51 4.32 0.41 0.91 473.3957 1203 0.0122 2.46 0.52 2.83 0.47 0.87 481.3171 1102 3.99E−09 1.79 0.36 0.86 0.53 2.08 481.3172 1202 0.006 4.19 0.25 3.98 0.27 1.05 482.3216 1202 0.0265 2.28 0.28 2.09 0.3 1.09 484.3792 1204 0.0432 1.8 0.7 1.32 0.89 1.36 492.4184 1203 0.0025 0.69 0.94 0.05 0.26 12.93 494.4344 1203 0.01 1.92 1.56 0.9 1.04 2.13 495.3328 1101 4.45E−08 4.22 0.38 3.23 0.65 1.3 495.4376 1203 0.023 0.81 1.11 0.22 0.51 3.63 496.336 1101 2.57E−08 2.68 0.34 1.74 0.6 1.53 501.2848 1201 0.0053 1.47 0.97 0.75 0.75 1.97 505.3227 1202 0.0005 4.17 0.3 3.85 0.3 1.08 506.3213 1202 0.0007 2.66 0.29 2.35 0.32 1.13 507.3317 1202 0.0258 3.02 0.26 2.84 0.28 1.06 509.3493 1202 0.0021 2.69 0.26 2.39 0.38 1.13 517.3148 1101 2.98E−08 4.38 0.36 3.3 0.72 1.33 518.3182 1101 5.20E−08 2.42 0.32 1.33 0.78 1.82 518.4345 1203 0.0043 1.33 1.08 0.52 0.79 2.57 519.332 1201 0.0008 2.68 0.73 2.04 0.5 1.31 519.3328 1101 2.80E−09 2.6 0.57 1.12 0.82 2.31 520.4502 1203 0.0049 3.69 0.97 2.88 0.96 1.28 521.348 1101 3.30E−09 2.35 0.38 1.34 0.57 1.75 521.4526 1203 0.0189 1.97 1.04 1.32 0.82 1.49 522.464 1203 0.0092 4.68 0.96 3.93 0.98 1.19 523.364 1101 2.06E−08 2.54 0.44 1.52 0.62 1.68 523.4678 1203 0.0083 3.27 0.93 2.55 0.91 1.28 524.4725 1203 0.0053 1.08 0.92 0.39 0.72 2.77 529.3167 1202 0.011 3.32 0.32 3.06 0.38 1.09 531.3123 1102 1.22E−09 2.39 0.3 1.49 0.51 1.61 534.4645 1204 0.039 1.34 0.8 0.85 0.83 1.58 538.501 1204 0.0479 0.93 0.86 0.48 0.71 1.97 541.3148 1101 4.07E−09 2.56 0.59 1.07 0.84 2.39 541.3422 1102 5.17E−10 4.45 0.36 3.47 0.51 1.28 541.3433 1202 0.0241 6.11 0.34 5.89 0.31 1.04 542.3453 1102 1.47E−10 2.65 0.35 1.8 0.38 1.47 542.3461 1202 0.0215 4.21 0.27 4.03 0.26 1.04 545.346 1101 3.41E−08 2.48 0.48 1.2 0.84 2.07 548.4817 1203 0.0358 6.91 0.53 6.58 0.51 1.05 549.4848 1203 0.0347 5.47 0.54 5.14 0.53 1.06 552.3825 1201 0.0061 0 0 0.43 0.75 0 552.4048 1204 0.0167 0.75 0.71 0.3 0.55 2.53 555.3101 1102 9.86E−09 1.94 0.48 0.84 0.62 2.32 565.3393 1202 0.0128 7.07 0.37 6.83 0.28 1.04 565.3394 1102 5.30E−09 4.17 0.49 3.13 0.54 1.33 566.3433 1102 7.66E−09 2.44 0.49 1.5 0.44 1.62 566.3434 1202 0.0017 5.4 0.31 5.11 0.3 1.06 567.3546 1202 0.0468 6.01 0.3 5.84 0.28 1.03 567.3548 1102 5.18E−10 3.41 0.41 2.48 0.43 1.38 568.3573 1102 1.36E−06 1.53 0.48 0.68 0.58 2.23 568.3574 1202 0.0494 4.01 0.3 3.84 0.29 1.04 569.3687 1102 6.16E−08 3.13 0.41 2.14 0.64 1.46 569.3691 1202 0.0043 5.16 0.23 4.91 0.35 1.05 570.3726 1202 0.0047 3.28 0.23 3.04 0.33 1.08 570.4653 1203 0.0021 2.21 0.39 1.71 0.65 1.29 570.4915 1204 0.0089 0.67 0.8 0.15 0.5 4.56 579.5322 1203 0.0008 4.45 0.6 3.84 0.59 1.16 580.5345 1203 0.0006 2.21 0.71 1.4 0.83 1.58 582.2469 1201 0.0261 2.44 0.97 3.02 0.8 0.81 583.2504 1201 0.042 1.11 0.83 1.58 0.75 0.7 587.3228 1202 0.0276 2.22 0.91 1.61 0.94 1.37 589.3401 1102 3.62E−07 2.73 0.42 1.86 0.6 1.47 589.3404 1202 0.0246 6.25 0.37 5.98 0.42 1.04 590.343 1202 0.0253 4.37 0.37 4.12 0.38 1.06 590.4597 1204 0.0219 2.54 0.57 2.13 0.65 1.2 596.4794 1203 0.0012 3.36 0.42 2.88 0.55 1.17 599.4932 1204 0.0151 1.76 0.91 1.07 0.99 1.64 601.5077 1204 0.0428 1.65 0.83 1.14 0.92 1.46 604.5441 1203 0.0002 6.45 0.49 5.89 0.49 1.1 605.5469 1203 0.0002 4.94 0.51 4.37 0.5 1.13 609.3242 1102 9.76E−08 2.04 0.35 1.18 0.58 1.72 612.5004 1204 0.0149 1.85 0.69 1.27 0.9 1.46 615.4797 1204 0.0001 3.22 0.37 2.77 0.38 1.16 622.4973 1203 0.0126 3.29 0.59 2.89 0.51 1.14 623.4918 1204 0.0366 1.79 0.94 1.21 0.93 1.48 623.5003 1203 0.006 2.19 0.6 1.59 0.83 1.37 624.5134 1203 0.0003 4.04 0.39 3.6 0.4 1.12 625.5078 1204 0.0259 3.76 0.64 3.36 0.54 1.12 625.5163 1203 0.0005 2.86 0.4 2.42 0.43 1.18 626.5109 1204 0.014 2.63 0.59 2.17 0.67 1.21 626.5285 1203 1.19E−05 3.78 0.36 3.28 0.37 1.15 627.5204 1204 0.015 4.62 0.59 4.21 0.55 1.1 627.5306 1203 0.0006 2.52 0.41 2.06 0.47 1.23 628.5236 1204 0.0103 3.32 0.61 2.86 0.6 1.16 628.5426 1203 0.0017 3.22 0.45 2.76 0.5 1.16 629.5453 1203 0.0275 1.95 0.66 1.46 0.83 1.33 630.5582 1203 0.0078 2.78 0.68 2.32 0.46 1.2 632.5752 1203 1.91E−06 1.46 0.85 0.3 0.61 4.83 635.5246 1204 0.0253 1.7 1 1.07 0.89 1.58 641.4915 1204 0.0036 2.19 1.03 1.19 1.23 1.83 646.5709 1203 0.0008 3.54 0.6 2.92 0.59 1.21 647.574 1203 0.0008 2.72 0.58 2.06 0.71 1.32 647.6063 1204 0.0044 2.09 0.62 1.39 0.97 1.5 648.5865 1203 0.0007 5.73 0.44 5.2 0.56 1.1 649.5056 1204 0.0255 2.61 0.91 2.02 0.91 1.3 649.5898 1203 0.0015 4.69 0.48 4.17 0.59 1.12 655.5509 1204 0.0006 2.79 0.57 1.87 1.1 1.49 660.5005 1204 0.0059 1.38 0.97 0.62 0.86 2.22 660.6082 1203 0.0116 0.41 0.77 0 0 0.41 663.4864 1204 0.0311 1.49 1.27 0.76 1.03 1.97 670.5688 1204 9.11E−06 3.86 0.42 3.2 0.51 1.21 670.5711 1203 0.0142 1.69 0.89 1.03 0.92 1.64 671.5723 1204 0.0003 2.92 0.4 2.17 0.85 1.34 672.5865 1203 0.0034 4.47 0.61 3.91 0.65 1.14 673.5893 1203 0.003 3.66 0.57 3.13 0.61 1.17 673.6185 1204 0.0174 3.07 0.49 2.63 0.74 1.17 673.6224 1203 0.0032 2.74 0.45 2.37 0.4 1.16 675.6359 1203 0.001 3.37 0.37 3 0.37 1.12 675.6375 1204 0.0047 3.89 0.48 3.33 0.82 1.17 676.6393 1203 0.0009 2.24 0.36 1.78 0.54 1.26 680.5625 1204 0.0293 3.86 0.65 3.48 0.52 1.11 684.5487 1204 0.0001 3.11 0.37 2.63 0.44 1.18 685.5543 1204 0.0001 2.7 0.37 2.1 0.61 1.29 686.5126 1204 0.0469 2.49 0.86 1.92 1.09 1.3 688.5294 1204 0.0081 2.9 0.43 2.46 0.68 1.18 690.4849 1204 0.0399 2.37 0.6 1.98 0.69 1.2 690.547 1204 0.0008 2.36 0.39 1.73 0.77 1.36 692.5571 1204 0.017 3.07 0.63 2.65 0.54 1.16 693.611 1204 0.0396 3.79 0.5 3.39 0.8 1.12 695.647 1204 0.0043 2.54 1.08 1.36 1.63 1.87 696.5856 1203 0.0318 1.14 0.98 0.59 0.73 1.93 696.651 1204 0.0448 1.53 1.17 0.81 1.28 1.89 699.5205 1204 0.0002 2.61 0.75 1.63 0.93 1.6 702.5675 1101 6.42E−08 2.87 0.29 2.12 0.5 1.35 705.6083 1204 0.0303 2.82 0.49 2.44 0.69 1.16 707.6256 1204 0.0361 4.27 0.43 3.83 0.93 1.12 708.6308 1204 0.0242 3.26 0.44 2.86 0.74 1.14 710.4923 1204 0.0087 2.32 0.37 1.91 0.65 1.22 716.4982 1204 0.0004 2.38 0.33 1.59 0.98 1.5 721.6388 1204 0.0402 5.27 0.49 4.76 1.1 1.11 722.6423 1204 0.0473 4.18 0.51 3.75 0.89 1.11 723.5194 1204 7.34E−07 4.49 0.76 3.32 0.67 1.35 723.5198 1202 4.42E−07 3.17 0.64 1.96 0.81 1.62 724.5247 1204 9.89E−07 3.45 0.69 2.32 0.72 1.49 724.5496 1101 1.87E−07 2.45 0.29 1.77 0.47 1.38 725.5375 1204 0.0002 3.23 0.84 2.23 0.87 1.45 726.5456 1204 7.10E−06 2.81 0.37 1.89 0.82 1.48 727.5565 1204 1.52E−05 3.68 0.5 2.86 0.67 1.29 728.562 1204 6.41E−07 3.01 0.36 2.23 0.58 1.35 729.5724 1204 2.18E−05 2.39 0.38 1.56 0.79 1.53 731.4913 1204 0.0013 5.85 0.37 5.45 0.44 1.07 732.4938 1204 0.0013 4.6 0.36 4.21 0.44 1.09 733.6425 1204 0.0199 3.17 0.43 2.75 0.77 1.16 735.6555 1204 0.0055 4.08 0.42 3.52 0.86 1.16 736.2234 1204 0.0037 0.05 0.26 0.77 1.15 0.07 736.6584 1204 0.0078 2.95 0.45 2.47 0.71 1.19 737.5354 1204 0.0059 1.3 1.05 0.54 0.75 2.39 738.5449 1102 1.43E−07 2.76 0.35 2.14 0.35 1.29 741.5307 1204 0.0066 2.96 0.52 2.52 0.56 1.17 742.5354 1204 0.0448 2.04 0.84 1.51 0.94 1.35 743.5469 1202 0.0499 3.47 0.45 3.23 0.38 1.07 744.4942 1204 0.0208 4.35 0.37 4.09 0.39 1.06 745.4972 1204 0.0029 3.53 0.29 3.23 0.39 1.1 746.556 1102 2.28E−05 2.02 0.3 1.37 0.62 1.47 747.5201 1202 0.0001 2.64 0.55 1.95 0.6 1.36 747.5234 1204 0.0007 3.91 0.52 3.36 0.52 1.16 748.5279 1204 0.0025 2.81 0.53 2.25 0.7 1.25 748.5722 1102 2.22E−07 4.56 0.34 3.91 0.41 1.17 749.5346 1203 0.0221 0.97 1.02 0.38 0.68 2.56 749.5354 1201 0.0001 2.15 0.62 1.31 0.73 1.64 749.5364 1202 9.54E−08 3.96 0.45 2.94 0.67 1.35 749.5402 1204 3.67E−06 5.01 0.64 4.11 0.55 1.22 749.5763 1102 8.79E−07 3.39 0.35 2.76 0.42 1.23 750.5403 1202 3.39E−07 2.93 0.44 1.99 0.65 1.47 750.5434 1204 6.74E−07 3.86 0.58 2.94 0.54 1.31 751.551 1203 0.0218 1.39 1 0.78 0.77 1.78 751.5529 1202 3.60E−06 4.09 0.52 3.18 0.69 1.29 751.5548 1204 2.96E−05 5.25 0.72 4.35 0.64 1.21 752.5565 1202 3.61E−06 3.01 0.51 2.17 0.6 1.39 752.5578 1204 2.88E−05 4.12 0.67 3.29 0.59 1.26 753.5674 1204 0.0001 2.95 0.55 2.37 0.43 1.25 755.4866 1204 6.72E−07 3.54 0.37 2.85 0.47 1.24 756.4905 1204 0.0002 2.68 0.34 1.82 1.01 1.47 757.5017 1204 0.0003 3.97 0.42 3.45 0.53 1.15 757.5618 1101 1.53E−06 5.41 0.44 4.65 0.52 1.16 758.5089 1204 0.0007 4.94 0.36 4.53 0.43 1.09 758.5654 1101 1.28E−06 4.37 0.44 3.59 0.54 1.22 759.516 1204 2.72E−05 5.22 0.34 4.67 0.48 1.12 759.578 1101 0.0001 4.15 0.46 3.58 0.45 1.16 760.5223 1204 4.81E−05 4.57 0.3 4.09 0.44 1.12 760.5816 1101 3.36E−05 3.04 0.45 2.44 0.46 1.24 761.5269 1204 2.48E−05 3.16 0.31 2.69 0.39 1.17 765.5665 1201 0.0166 2.93 0.61 2.52 0.53 1.16 766.5701 1201 0.0341 1.88 0.75 1.45 0.6 1.29 767.5821 1201 0.0146 3.46 0.58 3.09 0.41 1.12 768.4944 1204 0.0043 3.82 0.41 3.48 0.39 1.1 768.5507 1202 0.0292 2.46 0.35 2.22 0.42 1.11 769.4957 1204 0.0045 3.02 0.39 2.56 0.65 1.18 770.5109 1204 0.0046 3.21 0.41 2.86 0.42 1.12 771.5809 1204 0.0153 4.35 0.35 4.09 0.36 1.06 772.5269 1204 0.0016 3.71 0.35 3.34 0.43 1.11 772.5856 1204 0.0098 3.34 0.31 3.08 0.35 1.08 773.5337 1204 1.41E−06 3.61 0.28 3.11 0.35 1.16 774.5404 1204 0.0289 2.54 0.61 2.07 0.85 1.23 775.553 1204 0.0039 3.63 0.52 3.19 0.5 1.14 775.5533 1202 0.0031 2.58 0.44 2.11 0.6 1.22 776.5563 1204 0.0039 2.64 0.46 2.09 0.77 1.26 776.6057 1102 0.0029 2.16 0.46 1.62 0.73 1.33 776.6069 1202 0.0388 1.81 0.66 2.13 0.34 0.85 777.5679 1204 0.0026 2.97 0.51 2.57 0.33 1.15 779.5438 1101 5.66E−07 5.11 0.46 4.25 0.59 1.2 779.5831 1204 0.0034 2.62 0.5 2.15 0.56 1.22 780.5474 1101 6.60E−07 4.02 0.47 3.18 0.56 1.27 781.5612 1101 3.67E−07 4.91 0.41 4.11 0.53 1.19 782.5087 1204 0.0001 4.12 0.36 3.58 0.48 1.15 782.5649 1101 2.11E−07 3.83 0.42 3.04 0.49 1.26 783.5141 1204 2.43E−05 3.75 0.31 3.24 0.43 1.16 783.578 1101 1.62E−06 3.95 0.46 3.17 0.54 1.25 783.6349 1204 0.0015 0.13 0.45 0.86 0.99 0.15 784.5235 1204 0.0002 3.77 0.35 3.27 0.52 1.15 784.5813 1101 1.54E−06 2.86 0.45 2.16 0.45 1.33 785.5295 1204 0.0003 3.04 0.36 2.54 0.54 1.2 785.5936 1101 9.67E−06 4.24 0.41 3.57 0.53 1.19 786.5404 1204 2.83E−05 4.19 0.34 3.63 0.49 1.15 786.5967 1101 8.65E−06 3.15 0.38 2.54 0.47 1.24 787.5447 1204 3.19E−05 3.18 0.33 2.67 0.45 1.19 793.5387 1102 1.74E−07 3.64 0.39 2.89 0.47 1.26 794.5126 1204 0.0111 2.51 0.32 1.98 0.95 1.27 794.5424 1102 1.81E−07 2.57 0.33 1.86 0.48 1.38 795.5555 1102 0.0001 2.7 0.44 2.02 0.62 1.34 796.5292 1204 0.0318 3.36 0.34 3.14 0.36 1.07 798.6776 1203 0.0254 1.05 1.09 0.44 0.71 2.39 803.5436 1101 3.89E−07 3.81 0.45 2.87 0.65 1.33 803.5685 1102 3.50E−07 6 0.46 5.19 0.5 1.16 804.547 1101 5.81E−07 2.82 0.43 1.93 0.63 1.46 804.5717 1102 6.08E−07 4.71 0.44 3.97 0.47 1.19 804.7208 1204 0.0112 1.66 1.06 0.89 0.97 1.86 804.7219 1203 0.009 2.47 1.05 1.6 1.19 1.55 805.5606 1101 2.80E−07 4.01 0.45 3.17 0.54 1.27 805.5834 1102 1.15E−05 4.65 0.5 3.98 0.45 1.17 805.7267 1203 0.042 1.47 1.19 0.83 0.97 1.78 806.5643 1101 2.17E−06 3.03 0.47 2.24 0.54 1.35 806.5863 1102 6.89E−06 3.46 0.46 2.78 0.48 1.25 807.5761 1101 4.54E−06 4.24 0.41 3.56 0.51 1.19 808.5795 1101 3.90E−06 3.25 0.4 2.55 0.53 1.27 809.5937 1101 1.58E−05 3.5 0.38 2.92 0.46 1.2 810.5401 1204 0.001 3.52 0.34 3.11 0.46 1.13 810.597 1101 0.0001 2.53 0.42 2.01 0.45 1.26 811.5733 1202 0.0028 3.25 0.52 2.8 0.47 1.16 812.5767 1202 0.0028 2.34 0.47 1.77 0.77 1.33 813.5888 1202 0.0017 3.62 0.45 3.23 0.37 1.12 814.592 1202 0.0008 2.65 0.39 2.26 0.36 1.17 816.5591 1102 3.10E−06 2.26 0.35 1.6 0.51 1.41 816.7297 1204 0.0444 0.25 0.58 0 0 0.25 817.5376 1102 2.59E−07 2.42 0.39 1.6 0.55 1.51 819.5553 1102 0.0001 2.2 0.64 1.32 0.78 1.67 821.5718 1102 2.76E−08 3.02 0.44 2.13 0.5 1.42 822.5751 1102 3.08E−07 2.01 0.44 1.12 0.6 1.79 824.689 1203 0.0032 2.33 0.77 1.53 1.01 1.52 825.5545 1202 0.038 3.16 0.86 2.68 0.67 1.18 825.5548 1102 0.0017 1.06 0.77 0.41 0.55 2.55 826.5579 1202 0.0426 2.12 0.89 1.63 0.75 1.3 826.7053 1203 0.0039 4.43 0.61 3.88 0.66 1.14 827.5439 1101 0.0345 1.82 1.11 1.19 0.88 1.52 827.5698 1102 2.43E−07 4.75 0.39 3.83 0.65 1.24 827.5699 1202 0.0259 6.79 0.5 6.47 0.47 1.05 827.7084 1203 0.0029 3.7 0.6 3.16 0.6 1.17 828.5734 1102 7.16E−08 3.72 0.37 2.87 0.55 1.3 828.5741 1202 0.0258 5.69 0.45 5.4 0.43 1.05 828.7206 1203 0.0268 5.58 0.56 5.22 0.56 1.07 829.5597 1101 0.0052 1.89 0.84 1.19 0.83 1.59 829.5857 1102 2.38E−06 4.41 0.5 3.55 0.61 1.24 829.7239 1204 0.0481 2.77 0.58 2.34 0.86 1.18 829.7244 1203 0.0355 4.83 0.55 4.49 0.55 1.08 830.5887 1102 3.45E−06 3.3 0.5 2.48 0.59 1.33 830.6537 1102 0.0004 2.49 0.35 2.06 0.44 1.21 830.7359 1203 0.0499 5.12 0.61 4.78 0.55 1.07 831.575 1101 0.0001 2.87 0.49 2.31 0.43 1.24 831.575 1101 0.0001 2.87 0.49 2.31 0.43 1.24 831.5999 1102 3.19E−07 5.12 0.51 4.22 0.55 1.22 831.6002 1202 0.0111 6.36 0.46 6.03 0.41 1.06 831.7409 1203 0.0438 4.27 0.6 3.94 0.54 1.09 832.5765 1101 0.0094 0.52 0.87 0.04 0.17 14.81 832.6028 1102 3.72E−07 3.98 0.51 3.1 0.53 1.28 832.6039 1202 0.0119 5.26 0.45 4.95 0.4 1.06 835.6996 1204 0.0102 2.81 0.99 2.01 1.09 1.4 836.7063 1204 0.0067 1.87 1.13 0.98 1.06 1.9 837.5884 1202 0.022 2.81 0.38 2.56 0.37 1.1 837.7182 1204 0.0042 3.32 0.96 2.4 1.17 1.39 838.7227 1204 0.0035 2.64 1.02 1.66 1.19 1.59 839.7321 1204 0.0325 1.64 1.29 0.87 1.13 1.87 847.5955 1202 0.0215 2.67 0.49 2.33 0.49 1.14 850.703 1203 0.0002 3.38 0.6 2.7 0.6 1.25 851.5689 1102 0.0008 2.92 0.63 2.28 0.64 1.28 851.7111 1203 0.0058 3.03 0.57 2.47 0.76 1.22 852.5725 1102 0.0048 1.98 0.68 1.41 0.66 1.4 852.7198 1203 0.0274 5.94 0.62 5.57 0.49 1.07 852.7242 1204 0.0074 3.66 0.62 3.21 0.52 1.14 853.5854 1102 1.66E−05 3.01 0.48 2.33 0.51 1.29 853.7252 1203 0.0376 5.25 0.62 4.91 0.49 1.07 854.5887 1102 0.0004 2.03 0.46 1.43 0.62 1.42 855.6013 1102 9.20E−06 4.14 0.41 3.36 0.66 1.23 856.6046 1102 8.38E−06 3.14 0.41 2.42 0.59 1.3 856.6697 1102 3.72E−07 2.99 0.34 2.28 0.49 1.31 857.617 1102 0.001 2.52 0.8 1.68 0.87 1.5 857.6733 1102 1.09E−06 2.14 0.33 1.34 0.64 1.6 858.6847 1102 2.66E−05 3.48 0.42 2.88 0.49 1.21 859.6877 1102 3.67E−05 2.53 0.4 1.97 0.45 1.28 861.5265 1102 2.01E−06 2.38 0.43 1.63 0.54 1.46 861.7174 1204 0.0161 4.38 0.84 3.81 0.76 1.15 861.7808 1203 0.0128 3.02 0.48 2.66 0.51 1.14 862.7228 1204 0.0046 3.92 0.69 3.34 0.69 1.18 863.6874 1204 0.001 5.36 0.4 4.83 0.63 1.11 863.7339 1204 0.0071 5.83 0.67 5.27 0.72 1.11 864.738 1204 0.0063 5.13 0.63 4.58 0.71 1.12 865.7482 1204 0.0198 5.44 0.75 4.9 0.83 1.11 866.7527 1204 0.0308 4.67 0.78 4.15 0.84 1.13 867.7576 1204 0.0183 3.23 0.75 2.58 1.09 1.25 871.5528 1102 9.31E−07 3.47 0.46 2.69 0.51 1.29 872.5556 1102 1.76E−05 2.41 0.44 1.74 0.54 1.39 873.5684 1102 8.02E−06 2.42 0.51 1.66 0.54 1.45 876.7223 1203 0.0008 4.38 0.59 3.71 0.72 1.18 877.7271 1203 0.0029 3.56 0.64 2.93 0.76 1.22 878.7381 1203 0.0075 6.24 0.6 5.78 0.57 1.08 879.598 1102 0.0007 1.67 0.63 1.1 0.48 1.53 879.742 1203 0.0083 5.51 0.59 5.04 0.59 1.09 880.7528 1203 0.0122 7.31 0.66 6.88 0.46 1.06 880.7555 1204 0.0202 4.51 0.74 4.07 0.5 1.11 881.7568 1203 0.0137 6.55 0.65 6.15 0.43 1.07 881.7609 1204 0.038 4.04 0.8 3.63 0.51 1.11 882.7673 1203 0.0252 7.43 0.71 7.05 0.43 1.06 882.7717 1204 0.0429 4.99 0.81 4.59 0.51 1.09 883.7715 1203 0.0273 6.57 0.69 6.2 0.41 1.06 884.7817 1203 0.0156 6.5 0.7 6.08 0.44 1.07 884.7873 1204 0.0252 4.76 0.76 4.33 0.51 1.1 885.7867 1203 0.0153 5.49 0.66 5.09 0.44 1.08 885.7919 1204 0.0131 4.05 0.73 3.59 0.5 1.13 886.5582 1102 3.88E−07 3.51 0.32 2.75 0.55 1.28 886.8027 1204 0.0165 3.49 0.71 3.05 0.51 1.14 887.5625 1102 3.90E−05 2.6 0.37 1.89 0.67 1.37 887.8022 1203 0.0251 3.28 0.86 2.81 0.48 1.17 893.774 1204 0.0192 5.83 0.8 5.31 0.69 1.1 894.7273 1204 0.001 4.24 0.65 3.6 0.63 1.18 894.7813 1204 0.0049 4.39 0.74 3.78 0.7 1.16 895.5578 1102 2.28E−08 2.61 0.38 1.77 0.5 1.48 895.559 1202 0.0235 2.34 0.41 1.99 0.61 1.17 895.7335 1204 0.0024 3.82 0.67 3.22 0.62 1.18 895.7873 1204 0.0115 2.68 1.32 1.65 1.4 1.62 896.745 1204 0.0031 4.26 0.69 3.69 0.59 1.15 897.573 1102 8.61E−06 2.28 0.49 1.45 0.66 1.57 897.75 1204 0.0053 3.68 0.76 3.13 0.54 1.18 898.7605 1204 0.0026 3.79 0.69 3.22 0.54 1.17 899.5871 1102 6.42E−07 2.93 0.5 2.07 0.54 1.41 899.7663 1204 0.0179 3.04 0.83 2.55 0.53 1.19 900.5897 1102 2.46E−07 1.94 0.46 0.98 0.65 1.98 902.737 1203 0.0022 4.31 0.67 3.71 0.61 1.16 903.7407 1203 0.001 3.66 0.65 2.99 0.68 1.22 904.7535 1203 0.0012 5.52 0.54 5.02 0.48 1.1 905.7573 1203 0.0013 4.79 0.52 4.31 0.45 1.11 906.769 1203 0.0016 5.87 0.48 5.46 0.39 1.08 907.7735 1203 0.0011 5.13 0.47 4.72 0.36 1.09 907.7735 1203 0.0011 5.13 0.47 4.72 0.36 1.09 908.708 1204 0.0018 3.13 0.65 2.43 0.84 1.29 908.7842 1204 0.0092 2.68 0.88 1.92 1.09 1.4 908.7843 1203 0.0011 5.24 0.5 4.78 0.41 1.1 909.7153 1204 0.0151 3.2 0.89 2.64 0.65 1.21 909.7892 1203 0.0011 4.42 0.48 3.99 0.39 1.11 910.7248 1204 0.0047 3.77 0.73 3.2 0.6 1.18 910.7979 1203 0.0001 3.71 0.49 3.12 0.48 1.19 911.7326 1204 0.0069 4.17 0.82 3.57 0.68 1.17 912.7412 1204 0.0105 4.25 0.82 3.69 0.63 1.15 913.7502 1204 0.0143 5.1 0.98 4.49 0.67 1.14 914.7577 1204 0.026 4.9 1.01 4.33 0.67 1.13 915.7673 1204 0.0297 6.06 1.07 5.48 0.68 1.11 916.774 1204 0.0399 5.76 1.03 5.23 0.67 1.1 917.7836 1204 0.0157 6.41 1.05 5.76 0.72 1.11 918.7901 1204 0.0164 5.96 1 5.34 0.7 1.12 919.7981 1204 0.0053 5.38 0.96 4.66 0.75 1.15 920.747 1204 0.0002 4.08 0.58 3.43 0.58 1.19 920.8054 1204 0.0012 4.46 0.91 3.61 0.81 1.23 921.753 1204 0.0011 3.84 0.6 3.13 0.83 1.23 921.8145 1204 0.0021 3.27 1.23 2.07 1.37 1.58 922.7656 1204 0.0003 3.9 0.61 3.24 0.55 1.2 922.8229 1204 0.0198 2.13 1.57 1.14 1.3 1.88 923.5884 1102 4.49E−06 1.95 0.42 1.19 0.59 1.63 923.7675 1204 0.0248 3.35 0.87 2.8 0.78 1.2 924.7826 1204 0.0003 3.34 0.59 2.69 0.58 1.24 926.7371 1203 0.0003 2.14 0.97 1 1.06 2.14 928.7519 1203 0.0006 3.02 0.66 2.31 0.69 1.31 930.7673 1203 0.001 3.37 0.67 2.58 0.89 1.31 931.7691 1203 0.046 2.31 1.18 1.64 1.11 1.41 931.793 1204 0.016 2.05 1.41 1.09 1.26 1.87 932.7819 1203 0.026 3.25 0.79 2.81 0.49 1.15 934.7235 1204 0.0092 3.33 0.88 2.6 1.01 1.28 935.7299 1204 0.0026 3.23 0.59 2.6 0.79 1.24 936.7387 1204 0.0015 3.41 0.59 2.73 0.82 1.25 937.7457 1204 0.0005 3.43 0.61 2.55 1 1.34 938.7553 1204 0.0011 3.6 0.69 2.75 1.01 1.31 939.7616 1204 0.0016 3.39 0.73 2.63 0.84 1.29 940.7709 1204 0.0005 3.65 0.81 2.73 0.92 1.34 941.7779 1204 0.0016 3.31 0.96 2.37 0.99 1.39 942.7876 1204 0.0093 3.5 1.1 2.72 0.89 1.29 943.7931 1204 0.0099 2.93 1.31 1.96 1.2 1.49 944.8033 1204 0.0124 2.95 1.35 1.96 1.3 1.5 945.8085 1204 0.0019 2.54 1.35 1.26 1.38 2.01 946.8187 1204 0.0246 1.89 1.53 0.98 1.21 1.94 950.7385 1203 0.0482 0.54 0.93 0.12 0.4 4.58 952.7568 1203 0.0004 0.91 1.05 0.06 0.3 14.68 952.7759 1204 0.0034 2.34 1.05 1.37 1.16 1.71 954.7905 1204 0.0344 1.44 1.25 0.75 0.95 1.92 962.7616 1204 0.0031 2.2 1.09 1.19 1.17 1.85 964.7764 1204 0.0017 2.64 0.79 1.82 0.93 1.45 965.7839 1204 0.0037 1.95 1.07 1.01 1.08 1.93 966.7933 1204 0.0047 2.48 0.95 1.63 1.07 1.53 967.7981 1204 0.0022 1.91 0.94 0.99 1.05 1.93 968.8072 1204 0.001 1.83 0.91 0.84 1.05 2.17 997.3968 1102 0.0011 2.15 0.22 2.39 0.25 0.9 1016.929 1203 6.70E−06 4.91 0.63 3.87 0.8 1.27 1017.934 1203 3.45E−05 4.56 0.65 3.43 1.04 1.33 1018.943 1203 3.17E−05 4.22 0.7 3.11 0.96 1.35 1019.95 1203 9.64E−06 3.37 0.7 2.07 1.1 1.63 1040.934 1203 0.0011 2.27 1.16 1.13 1.12 2 1176.777 1204 0.0452 4.32 1.09 4.92 0.96 0.88 1225.093 1203 0.0048 3.34 0.82 2.59 0.96 1.29 1226.098 1203 0.0077 3.11 0.94 2.49 0.55 1.25 1227.107 1203 0.0202 3.47 0.95 2.81 0.98 1.23 1228.113 1203 0.0104 3.07 0.88 2.5 0.59 1.23 1229.118 1203 0.0018 2.11 0.93 1.12 1.16 1.89 1251.115 1203 0.0026 1.62 1.24 0.62 0.93 2.6 1253.129 1203 0.0043 1.91 1.21 0.96 0.99 2 1373.744 1201 0.0039 0.2 0.55 0.89 0.98 0.22 -
TABLE 2 Accurate masses, putative molecular formulae and proposed structures for the seven prostrate cancer biomarkers detected in aqueous extracts (positive chemical ionization) of human serum. Metabolite Detected Exact ID Mass Mass Formula Proposed Structure 1 495.3328 495.3325 C24H50NO7 P 
2 517.3147 517.3168 C26H48NO7 P 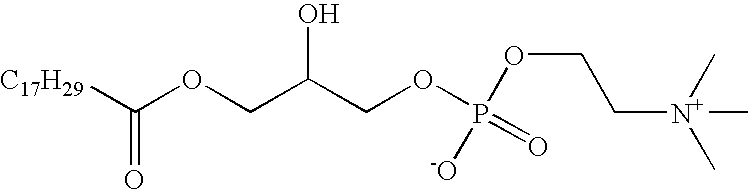
3 519.3328 519.3325 C26H50NO7 P 
4 521.3481 521.3481 C26H52NO7 P 
5 523.3640 523.3638 C26H54NO7P 
6 541.3148 541.3168 C28H48NO7 P 
7 545.3460 545.3481 C28H52NO7P 
-
TABLE 3 MS/MS fragmentation of prostate cancer biomarker 495.3328, C24H50NO7P (m/z represents the [M + H]+ mass) m/z Formula Molecular fragment Fragment loss 496 C24H51NO7P+ 
478 C24H49NO6P+ 
496-H2O 419 C21H40NO6P+ 

313 C19H37O3 + 
478-166 + H+ 283 C17H31O3 + 
313-C2H6 258 C8H21NO7P+ 
496-C16H30O 239 C16H31O 
496- C8H20NO5P 184 C5H15NO4P+ 

166 C5H13NO3P+ 
478-313 104 C5H14NO 
184-HPO3 86 C5H12N 
104-H2O -
TABLE 4 MS/MS fragmentation of prostate cancer biomarker 517.3147, C26H48NO7P (m/z represents the [M + H]+ mass) m/z Formula Molecular fragment Fragment loss 518 C26H49NO7P+ 
459 C23H40NO7P+ 

415 C21H36O6P+ 
459-C2H4O 359 C17H28O6P+ 
415-C4H8 341 C17H26O5P+ 
359-H2O 281 C10H18NO7P+ 
459-C13H22 221 C8H14NO5P+ 
359-C9H14 104 C5H14NO 
86 C5H12N 
104-H2O -
TABLE 5 MS/MS fragmentation of prostate cancer biomarker 519.3328, C26H52NO7P (m/z represents the [M + H]+ mass) m/z Formula Molecular fragment 520 C26H51NO7P+ 
502 C26H49NO6P+ 
461 C23H42NO7P+ 
445 C22H38NO7P+ 
281 C18H33O2 
221 C16H29 
184 C5H15NO4P+ 
166 C5H13NO3P+ 
124 C2H6O4P+ 
86 C5H12N 
m/ z Fragment loss 520 502 520-H2O 461 
445 461-CH4 281 520-C8H20NO5P 221 
184 166 184-H2O 124 
86 166-H3PO4 -
TABLE 6 MS/MS fragmentation of prostate cancer biomarker 521.3481, C26H53NO7P+ (m/z represents the [M + H]+ mass) m/z Formula Molecular fragment Fragment loss 522 C26H53NO7P+ 
504 C26H51NO6P+ 
522-H2O 478 C23H45NO7P+ 
522-C3H8 357 C18H30NO5P+ 

258 C8H21NO6P+ 
C18H33O+ 221 C15H25O+ 
C18H33O+-C3H8 184 C5H15NO4P+ 
522-C21H38O3 124 C2H6H4P+ 

104 C5H14NO 
184-HPO3 86 C5H12N 
104-H2O -
TABLE 7 MS/MS fragmentation of prostate cancer biomarker 523.3640, C26H55NO7P+ (m/z represents the [M + H]+ mass) m/z Formula Molecular fragment Fragment loss 524 C26H55NO7P+ 
506 C26H53NO6P+ 
524-H2O 496 C24H51NO7P+ 
524-C2H4 478 C24H49NO6P+ 
496-H2O 331 C19H39O4 + 
496-166 + H+ 313 C19H37O3 + 

258 C8H21NO6P+ 
524-C18H34O 285 C18H37O3 + 
524-C8H20NO5P 184 C5H15NO4P+ 
524-313 166 C5H13NO3P+ 
184-H2O 124 C2H6O4P+ 

104 C5H14NO 
184-HPO3 86 C5H12N 
104-H2O -
TABLE 8 MS/MS fragmentation of prostate cancer biomarker 541.3148, C28495NO7P+ (m/z represents the [M + H]+ mass) m/z Formula Molecular fragment Fragment loss 542 C28H49NO7P+ 
483 C25H40NO7P+ 

284 C9H19NO7P+ 
542-C19H30 225 C6H10NO7P+ 
483-C19H30 184 C5H15NO4P+ 
542-C23H34O3 104 C5H14NO 
184-HPO3 86 C5H12N 
104-H2O -
TABLE 9 MS/MS fragmentation of prostate cancer biomarker 545.3460, C28H53NO7P+ (m/z represents the [M + H]+ mass) m/z Formula Molecular fragment Fragment loss 546 C28H53NO7P+ 
528 C28H51NO6P+ 
546-H2O 514 C27H49NO6P+ 
528-CH3 487 C25H44NO7P+ 

104 C5H14NO 
86 C5H12N 
104-H2O -
TABLE 10 Comparison of fragment ion patterns for 2-Hydroxy-1- palmitoyl-sn-glycero-3-phosphocholine and 495.3328. Standard 495.3328 Fragment Ion [M + H] % 496 100 90 478 1 5 419 1 1 313 10 1 239 1 1 258 1 1 184 80 90 166 1 1 104 30 100 86 1 70 -
TABLE 11 Accurate masses, putative molecular formulae and proposed structures for the seven prostrate cancer biomarkers detected in aqueous extracts (negative electrospray ionization) of human serum. Detected Mass Calculated Mass Formula Proposed Structure 481.317 481.3168 C23H48NO7P 
531.3123 531.3114 C30H46NO5P 541.3422 541.3380 C25H52NO9P 
555.3101 555.3172 C25H50NO10P 
565.3394 565.3380 C27H52NO9P 
567.3546 567.3536 C27H54NO9P 
569.3687 569.3693 C27H56NO9P 
-
TABLE 12 MS/MS fragmentation of prostate cancer biomarker 481.3171, C23H48NO7P (m/z represents the [M − H]− mass) m/z Formula Molecular fragment Fragment loss 480 C23H47NO7P 
—H+ 462 C23H45NO6P 
—H2O 435 C21H40O7P 
480-NH(CH3)2 391 C19H36NO6P 

255 C16H31O2 

242 C6H13NO7P 
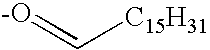
224 C6H11NO6P 
242-H2O 168 C4H11NO4P 

153 C3H6O5P 

79 PO3 
-
TABLE 13 MS/MS fragmentation of prostate cancer biomarker 531.3123, C30H46NO5P (m/z represents the [M − H]− mass) m/z Formula 530 C30H45NO5P 480 255 224 168 78 -
TABLE 14 MS/MS fragmentation of prostate cancer biomarker 541.3380, C25H52NO9P (m/z represents the [M − H]− mass) m/z Formula Molecular fragment Fragment loss 540 C25H51NO9P 
—H+ 480 C23H47NO7P 
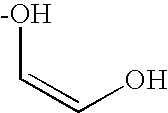
255 C16H31O2 

242 C7H17NO6P 

224 C7H15NO5P 
242-H2O 168 C4H11NO4P 

153 C3H6O5P 

79 PO3 
-
TABLE 15 MS/MS fragmentation of prostate cancer biomarker 555.3172, C26H54NO9P (m/z represents the [M − H]− mass) m/z Formula Molecular fragment Fragment loss 554 C26H53NO9P 
—H+ 508 C25H52NO7P 
—HCOOH 494 C23H45NO8P 

463 C22H40O8P 
494-CH3NH2 281 269 C17H32O2 

242 C7H17NO6P 224 C6H11NO6P 

168 153 79 -
TABLE 16 MS/MS fragmentation of prostate cancer biomarker 565.3394, C27H52NO9P (m/z represents the [M − H]− mass) m/z Formula Molecular fragment Fragment loss 564 C27H51NO9P 
—H+ 504 C25H45NO8P 

454 C19H37NO9P 

279 C18H31O2 

242 C7H17NO6P 

224 C7H15NO5P 
242-H2O 168 C4H11NO4P 

153 C3H6O5P 

79 PO3 
-
TABLE 17 MS/MS fragmentation of prostate cancer biomarker 567.3546, C27H54NO9P (m/z represents the [M − H]− mass) m/z Formula Molecular fragment Fragment loss 566 C27H53NO9P 
—H+ 506 C25H47NO8P 

281 C18H33O2 

242 C7H17NO6P 

224 C7H15NO5P 
242-H2O 168 C4H11NO4P 

153 C3H6O5P 

79 PO3 
-
TABLE 18 MS/MS fragmentation of prostate cancer biomarker 569.368, C27H56NO9P (m/z represents the [M − H]− mass) m/z Formula Molecular fragment Fragment loss 568 C27H35NO9P 
—H+ 508 C25H49NO8P 

283 C18H35O2 

242 C7H17NO6P 

224 C7H15NO5P 
242-H2O 168 C4H11NO4P 

153 C3H6O5P 

79 PO3 
-
TABLE 19 Comparison of MS/MS fragmentation patterns of 569.3687 to it's corresponding lysophospholipid ethanolamine counterpart, 2-hydroxy-1-stearyl-sn- glycero-3-phosphoethanolamine standard. Standard 569.3687 m/z Molecular fragment m/z Molecular fragment 568 
480 
508 (568-60) 
283 
283 
214 
242 
196 
224 
140 
168 
153 
153 
79 
79 
-
TABLE 20 Daughter Daughter Daughter Daughter Parent 1 2 3 4 Daughter 5PESI 496.33 184.2 104.2 313.4 419.4 86.2 518.31 104.2 459.4 313.4 415.5 147.1 520.33 184.2 104.2 337.4 166.2 86.2 522.35 184.2 104.2 339.4 258.4 445.3 524.36 184.2 104.2 341.4 258.2 86.2 542.31 104.2 483.4 337.4 439.4 359.4 546.35 487.4 104.2 341.4 443.5 147.0 IS 609.30 195.2 397.3 NESI 480.32 255.4 224.2 242.2 283.4 153.0 530.31 480.5 255.4 305.4 326.2 484.3 540.34 480.5 255.4 224.2 242.2 153.0 554.31 494.5 269.4 283.4 508.2 224.2 564.34 504.5 279.4 224.2 242.2 415.3 566.35 506.5 281.4 224.2 242.2 153.0 568.37 508.5 283.4 224.2 242.2 419.5 IS 607.20 211.3 152.2 *Note: The parent m/z and the 2 daughter MRM transitions used in each method are in bold. Additional daughter transitions listed could also be used in other methods in the future.
Claims (46)


Priority Applications (1)
| Application Number | Priority Date | Filing Date | Title |
|---|---|---|---|
| US12/294,215 US8409794B2 (en) | 2006-03-24 | 2007-03-23 | Biomarkers useful for diagnosing prostate cancer, and methods thereof |
Applications Claiming Priority (3)
| Application Number | Priority Date | Filing Date | Title |
|---|---|---|---|
| US78548006P | 2006-03-24 | 2006-03-24 | |
| US12/294,215 US8409794B2 (en) | 2006-03-24 | 2007-03-23 | Biomarkers useful for diagnosing prostate cancer, and methods thereof |
| PCT/CA2007/000469 WO2007109881A1 (en) | 2006-03-24 | 2007-03-23 | Biomarkers useful for diagnosing prostate cancer, and methods thereof |
Publications (2)
| Publication Number | Publication Date |
|---|---|
| US20090127454A1 true US20090127454A1 (en) | 2009-05-21 |
| US8409794B2 US8409794B2 (en) | 2013-04-02 |
Family
ID=38540744
Family Applications (2)
| Application Number | Title | Priority Date | Filing Date |
|---|---|---|---|
| US12/294,215 Expired - Fee Related US8409794B2 (en) | 2006-03-24 | 2007-03-23 | Biomarkers useful for diagnosing prostate cancer, and methods thereof |
| US13/801,574 Abandoned US20130330746A1 (en) | 2006-03-24 | 2013-03-13 | Biomarkers useful for diagnosing prostate cancer, and methods thereof |
Family Applications After (1)
| Application Number | Title | Priority Date | Filing Date |
|---|---|---|---|
| US13/801,574 Abandoned US20130330746A1 (en) | 2006-03-24 | 2013-03-13 | Biomarkers useful for diagnosing prostate cancer, and methods thereof |
Country Status (10)
| Country | Link |
|---|---|
| US (2) | US8409794B2 (en) |
| EP (2) | EP2674435A3 (en) |
| JP (2) | JP5612303B2 (en) |
| KR (1) | KR20090006837A (en) |
| CN (1) | CN101454331A (en) |
| AU (1) | AU2007231487B2 (en) |
| BR (1) | BRPI0709176A2 (en) |
| CA (1) | CA2644330C (en) |
| SG (1) | SG170061A1 (en) |
| WO (1) | WO2007109881A1 (en) |
Cited By (57)
| Publication number | Priority date | Publication date | Assignee | Title |
|---|---|---|---|---|
| US20090159793A1 (en) * | 2007-12-21 | 2009-06-25 | Hanas Jay S | Identification of biomarkers in biological samples and methods of using same |
| US20100017145A1 (en) * | 2006-12-21 | 2010-01-21 | Ajinomoto Co., Inc. | Method of evaluating cancer state, cancer-evaluating apparatus, cancer-evaluating method, cancer-evaluating system, cancer-evaluating program and recording medium |
| US20100292331A1 (en) * | 2006-09-19 | 2010-11-18 | Metabalon, Inc. | Biomarkers for Prostate Cancer and Methods Using the Same |
| US20100291690A1 (en) * | 2007-11-07 | 2010-11-18 | Lian Shan | Methods for detecting or monitoring cancer using lpc as a marker |
| US20110059543A1 (en) * | 2007-11-07 | 2011-03-10 | Lian Shan | Methods for detecting or monitoring cancer using lpe as a marker |
| US20110091924A1 (en) * | 2008-03-04 | 2011-04-21 | Ajinomoto Co., Inc. | Method of evaluating cancer type |
| US20110138889A1 (en) * | 2008-06-20 | 2011-06-16 | Ajinomoto Co., Inc. | Method of evaluating prostatic disease |
| US20110151497A1 (en) * | 2009-12-22 | 2011-06-23 | The Regents Of The University Of Michigan | Metabolomic profiling of prostate cancer |
| WO2011100604A2 (en) | 2010-02-12 | 2011-08-18 | Raindance Technologies, Inc. | Digital analyte analysis |
| US20110284735A1 (en) * | 2010-05-07 | 2011-11-24 | Van Berkel Gary J | System and method for extracting a sample from a surface |
| US20120122243A1 (en) * | 2009-06-04 | 2012-05-17 | Charite Universitatsmedizin Berlin | Means and method and means for diagnosing prostate carcinomas |
| US20120326025A1 (en) * | 2010-01-29 | 2012-12-27 | IMG Institut fur Medizinische Genomforschung Planu ngsgesellschaft | Diagnosing prostate cancer relapse |
| US8528589B2 (en) | 2009-03-23 | 2013-09-10 | Raindance Technologies, Inc. | Manipulation of microfluidic droplets |
| WO2013165748A1 (en) | 2012-04-30 | 2013-11-07 | Raindance Technologies, Inc | Digital analyte analysis |
| US8592221B2 (en) | 2007-04-19 | 2013-11-26 | Brandeis University | Manipulation of fluids, fluid components and reactions in microfluidic systems |
| US20140051601A1 (en) * | 2006-09-19 | 2014-02-20 | Metabolan Inc. | Metabolomic profiling of cancer |
| US8658430B2 (en) | 2011-07-20 | 2014-02-25 | Raindance Technologies, Inc. | Manipulating droplet size |
| US8772046B2 (en) | 2007-02-06 | 2014-07-08 | Brandeis University | Manipulation of fluids and reactions in microfluidic systems |
| WO2014093314A3 (en) * | 2012-12-12 | 2014-08-07 | Bio-Rad Laboratories, Inc. | Calibration process and system |
| US20140242711A1 (en) * | 2008-12-18 | 2014-08-28 | Quest Diagnostics Investments Inc. | Vitamin b2 detection by mass spectrometry |
| US8841071B2 (en) | 2011-06-02 | 2014-09-23 | Raindance Technologies, Inc. | Sample multiplexing |
| WO2014172288A2 (en) | 2013-04-19 | 2014-10-23 | Raindance Technologies, Inc. | Digital analyte analysis |
| US8871444B2 (en) | 2004-10-08 | 2014-10-28 | Medical Research Council | In vitro evolution in microfluidic systems |
| US9012390B2 (en) | 2006-08-07 | 2015-04-21 | Raindance Technologies, Inc. | Fluorocarbon emulsion stabilizing surfactants |
| US9150852B2 (en) | 2011-02-18 | 2015-10-06 | Raindance Technologies, Inc. | Compositions and methods for molecular labeling |
| US20150325423A1 (en) * | 2013-01-31 | 2015-11-12 | Purdue Research Foundation | Systems and methods for analyzing an extracted sample |
| US20150346186A1 (en) * | 2014-05-30 | 2015-12-03 | ASTA, Co. Ltd. | Integrated disease diagnostic system using matrix-assisted laser desorption/ionization time-of-flight mass spectrometer |
| US9273308B2 (en) | 2006-05-11 | 2016-03-01 | Raindance Technologies, Inc. | Selection of compartmentalized screening method |
| US9328344B2 (en) | 2006-01-11 | 2016-05-03 | Raindance Technologies, Inc. | Microfluidic devices and methods of use in the formation and control of nanoreactors |
| US9364803B2 (en) | 2011-02-11 | 2016-06-14 | Raindance Technologies, Inc. | Methods for forming mixed droplets |
| US9366632B2 (en) | 2010-02-12 | 2016-06-14 | Raindance Technologies, Inc. | Digital analyte analysis |
| US9399797B2 (en) | 2010-02-12 | 2016-07-26 | Raindance Technologies, Inc. | Digital analyte analysis |
| US9448172B2 (en) | 2003-03-31 | 2016-09-20 | Medical Research Council | Selection by compartmentalised screening |
| US9498759B2 (en) | 2004-10-12 | 2016-11-22 | President And Fellows Of Harvard College | Compartmentalized screening by microfluidic control |
| US9562837B2 (en) | 2006-05-11 | 2017-02-07 | Raindance Technologies, Inc. | Systems for handling microfludic droplets |
| US9562897B2 (en) | 2010-09-30 | 2017-02-07 | Raindance Technologies, Inc. | Sandwich assays in droplets |
| US9620344B2 (en) | 2013-06-25 | 2017-04-11 | Purdue Research Foundation | Mass spectrometry analysis of microorganisms in samples |
| US9733228B2 (en) | 2013-01-31 | 2017-08-15 | Purdue Research Foundation | Methods of analyzing crude oil |
| US9839890B2 (en) | 2004-03-31 | 2017-12-12 | National Science Foundation | Compartmentalised combinatorial chemistry by microfluidic control |
| US10052605B2 (en) | 2003-03-31 | 2018-08-21 | Medical Research Council | Method of synthesis and testing of combinatorial libraries using microcapsules |
| US10256085B2 (en) | 2014-12-05 | 2019-04-09 | Purdue Research Foundation | Zero voltage mass spectrometry probes and systems |
| EP3495817A1 (en) | 2012-02-10 | 2019-06-12 | Raindance Technologies, Inc. | Molecular diagnostic screening assay |
| US10351905B2 (en) | 2010-02-12 | 2019-07-16 | Bio-Rad Laboratories, Inc. | Digital analyte analysis |
| US10381209B2 (en) | 2015-02-06 | 2019-08-13 | Purdue Research Foundation | Probes, systems, cartridges, and methods of use thereof |
| US10520500B2 (en) | 2009-10-09 | 2019-12-31 | Abdeslam El Harrak | Labelled silica-based nanomaterial with enhanced properties and uses thereof |
| US10533998B2 (en) | 2008-07-18 | 2020-01-14 | Bio-Rad Laboratories, Inc. | Enzyme quantification |
| US10647981B1 (en) | 2015-09-08 | 2020-05-12 | Bio-Rad Laboratories, Inc. | Nucleic acid library generation methods and compositions |
| US10761083B2 (en) | 2009-04-30 | 2020-09-01 | Purdue Research Foundation | Sample dispenser including an internal standard and methods of use thereof |
| US10837883B2 (en) | 2009-12-23 | 2020-11-17 | Bio-Rad Laboratories, Inc. | Microfluidic systems and methods for reducing the exchange of molecules between droplets |
| US10879056B2 (en) | 2014-05-30 | 2020-12-29 | ASTA, Co. Ltd | Integrated disease diagnostic system using matrix-assisted laser desorption/ionization time-of-flight mass spectrometer |
| US10998178B2 (en) | 2017-08-28 | 2021-05-04 | Purdue Research Foundation | Systems and methods for sample analysis using swabs |
| US11174509B2 (en) | 2013-12-12 | 2021-11-16 | Bio-Rad Laboratories, Inc. | Distinguishing rare variations in a nucleic acid sequence from a sample |
| US11193176B2 (en) | 2013-12-31 | 2021-12-07 | Bio-Rad Laboratories, Inc. | Method for detecting and quantifying latent retroviral RNA species |
| US11511242B2 (en) | 2008-07-18 | 2022-11-29 | Bio-Rad Laboratories, Inc. | Droplet libraries |
| US11761962B2 (en) | 2014-03-28 | 2023-09-19 | Opko Diagnostics, Llc | Compositions and methods related to diagnosis of prostate cancer |
| US11901041B2 (en) | 2013-10-04 | 2024-02-13 | Bio-Rad Laboratories, Inc. | Digital analysis of nucleic acid modification |
| US11921115B2 (en) | 2015-03-27 | 2024-03-05 | Opko Diagnostics, Llc | Prostate antigen standards and uses thereof |
Families Citing this family (14)
| Publication number | Priority date | Publication date | Assignee | Title |
|---|---|---|---|---|
| WO2010009337A2 (en) * | 2008-07-16 | 2010-01-21 | Dana-Farber Cancer Institute, Inc. | Signatures and pcdeterminants associated with prostate cancer and methods of use thereof |
| KR101018665B1 (en) | 2008-08-18 | 2011-03-04 | 재단법인서울대학교산학협력재단 | Method and apparatus of diagnosing prostate cancer |
| CA2797941C (en) | 2009-10-01 | 2015-01-27 | Phenomenome Discoveries Inc. | Serum-based biomarkers of pancreatic cancer and uses thereof for disease detection and diagnosis |
| EP2585833B1 (en) * | 2010-06-23 | 2017-05-31 | University of Louisville Research Foundation, Inc. | Methods for detecting cancer |
| US20130217647A1 (en) * | 2010-07-28 | 2013-08-22 | Metabolon, Inc. | Biomarkers for Prostate Cancer and Methods Using the Same |
| CN104364788B (en) | 2012-03-05 | 2018-02-06 | 阿克蒂克合伙公司 | Predict prostate cancer risk and the device of prostate gland volume |
| WO2014068144A1 (en) | 2012-11-05 | 2014-05-08 | Ospedale San Raffaele S.R.L. | Biomarkers of multiple myeloma development and progression |
| JP6660291B2 (en) * | 2013-05-14 | 2020-03-11 | セントジーン アーゲー | Methods for diagnosing Niemann-Pick disease |
| CN105424841B (en) * | 2015-12-25 | 2017-11-03 | 齐炼文 | Metabolic markers for diagnosing coronary atherosclerosis |
| JP2017203649A (en) * | 2016-05-09 | 2017-11-16 | 国立大学法人大阪大学 | Prostate cancer determination method |
| US10006925B2 (en) | 2016-05-30 | 2018-06-26 | Universal Diagnostics, S. L. | Methods and systems for metabolite and/or lipid-based detection of colorectal cancer and/or adenomatous polyps |
| JPWO2018016645A1 (en) * | 2016-07-22 | 2019-06-13 | 国立大学法人秋田大学 | Development of novel phospholipid and its utilization and phospholipid separation measurement method |
| US11073522B2 (en) | 2016-10-03 | 2021-07-27 | Lincoln Memorial University | Structural validation of very long chain dicarboxylic acids |
| WO2018158801A1 (en) * | 2017-02-28 | 2018-09-07 | 株式会社島津製作所 | Spectral data feature extraction device and method |
Citations (4)
| Publication number | Priority date | Publication date | Assignee | Title |
|---|---|---|---|---|
| US20030228639A1 (en) * | 2001-03-19 | 2003-12-11 | Wright George L | Prostate cancer markers |
| US20050244973A1 (en) * | 2004-04-29 | 2005-11-03 | Predicant Biosciences, Inc. | Biological patterns for diagnosis and treatment of cancer |
| US20070009970A1 (en) * | 2005-07-08 | 2007-01-11 | Predicant Biosciences, Inc. | Biological patterns for diagnosis and treatment of cancer |
| US7349809B2 (en) * | 2000-02-02 | 2008-03-25 | Yol Bolsum Canada Inc. | Method of non-targeted complex sample analysis |
Family Cites Families (25)
| Publication number | Priority date | Publication date | Assignee | Title |
|---|---|---|---|---|
| US4813171A (en) | 1987-11-24 | 1989-03-21 | Herbert Cooper | Power-operated lateral actuator for a fishing outrigger |
| US4953328A (en) | 1989-05-24 | 1990-09-04 | Sewell Scott R | Air conditioning compressor sectionalized cover |
| AT399867B (en) | 1990-01-11 | 1995-08-25 | Lisec Peter | SYSTEM FOR THE PRODUCTION OF INSULATING GLASS PANELS |
| US5233640A (en) | 1991-01-11 | 1993-08-03 | Detection Systems, Inc. | Security system with backup dialer |
| IT1252437B (en) | 1991-07-19 | 1995-06-14 | Gd Spa | METHOD AND DEVICE FOR THE FOLDING OF WRAPPERS OF LONG WRAPPING PRE-WEAK BENDING LINES |
| CA2089503C (en) | 1992-02-19 | 1996-09-03 | Marcus Mintz | Casing structure for encasing meat products |
| US5213480A (en) | 1992-06-08 | 1993-05-25 | Graco, Inc. | Pump lift mechanism |
| US5313123A (en) | 1992-11-23 | 1994-05-17 | Leonid Simuni | Automobile having the magnetohydrodynamic engine |
| DE4306614A1 (en) | 1993-03-03 | 1994-09-08 | Bayer Ag | Process for recycling paint waste |
| US5441589A (en) | 1993-06-17 | 1995-08-15 | Taurus Impressions, Inc. | Flat bed daisy wheel hot debossing stamper |
| CA2150938C (en) | 1993-10-28 | 1999-09-07 | Ricardo Lim | Demodulator logic unit adaptable to multiple data protocols |
| US5434195A (en) | 1994-06-23 | 1995-07-18 | The Dow Chemical Company | Extruded, open-cell alkenyl aromatic polymer foam and process for making |
| US5653394A (en) | 1995-09-28 | 1997-08-05 | Highline Mfg. Inc. | Disintegration of baled crop materials |
| US5673546A (en) | 1995-12-26 | 1997-10-07 | Abraham; Carl J. | Non-slip shoelaces |
| US5858681A (en) * | 1996-06-17 | 1999-01-12 | Children's Medical Center | Method for prognosis of prostate cancer |
| CA2284630A1 (en) | 1997-03-21 | 1998-10-01 | Atairgin Biotecghnologies, Inc. | Method for detecting cancer associated with altered concentrations of lysophospholipids |
| ATE350662T1 (en) | 1999-10-07 | 2007-01-15 | Ciphergen Biosystems Inc | MARKER PROTEINS FOR PROSTATE CANCER |
| AU4927501A (en) | 2000-03-20 | 2001-10-03 | Eastern Virginia Med School | Prostate cancer markers |
| WO2001078652A2 (en) | 2000-04-14 | 2001-10-25 | Metabolon, Inc. | Methods for drug discovery, disease treatment, and diagnosis using metabolomics |
| IL155953A0 (en) * | 2000-11-28 | 2003-12-23 | Wyeth Corp | Expression analysis of inhibitor of differentiation nucleic acids and polypeptides useful in the diagnosis and treatment of prostate cancer |
| US6919176B2 (en) * | 2001-05-07 | 2005-07-19 | Amgen Inc. | Polypeptides and nucleic acids associated with cancer |
| CA2448355A1 (en) * | 2001-05-25 | 2002-12-05 | Mount Sinai Hospital | Method of detecting and monitoring prostate and ovarian cancers |
| AU2003231084A1 (en) * | 2002-04-26 | 2003-11-10 | The Johns Hopkins University | Identification of biomarkers for detecting prostate cancer |
| EP1575420A4 (en) * | 2002-05-10 | 2007-12-26 | Eastern Virginia Med School | Prostate cancer biomarkers |
| AUPS282602A0 (en) * | 2002-06-07 | 2002-06-27 | Garvan Institute Of Medical Research | Method of inhibiting cell proliferation |
-
2007
- 2007-03-23 EP EP20130176367 patent/EP2674435A3/en not_active Withdrawn
- 2007-03-23 WO PCT/CA2007/000469 patent/WO2007109881A1/en active Application Filing
- 2007-03-23 BR BRPI0709176-1A patent/BRPI0709176A2/en not_active Application Discontinuation
- 2007-03-23 EP EP07710787A patent/EP1922326A4/en not_active Ceased
- 2007-03-23 JP JP2009500679A patent/JP5612303B2/en not_active Expired - Fee Related
- 2007-03-23 KR KR1020087026013A patent/KR20090006837A/en not_active Application Discontinuation
- 2007-03-23 AU AU2007231487A patent/AU2007231487B2/en not_active Ceased
- 2007-03-23 US US12/294,215 patent/US8409794B2/en not_active Expired - Fee Related
- 2007-03-23 CA CA2644330A patent/CA2644330C/en not_active Expired - Fee Related
- 2007-03-23 CN CNA2007800188377A patent/CN101454331A/en active Pending
- 2007-03-23 SG SG201101506-2A patent/SG170061A1/en unknown
-
2012
- 2012-11-28 JP JP2012259409A patent/JP5502972B2/en not_active Expired - Fee Related
-
2013
- 2013-03-13 US US13/801,574 patent/US20130330746A1/en not_active Abandoned
Patent Citations (4)
| Publication number | Priority date | Publication date | Assignee | Title |
|---|---|---|---|---|
| US7349809B2 (en) * | 2000-02-02 | 2008-03-25 | Yol Bolsum Canada Inc. | Method of non-targeted complex sample analysis |
| US20030228639A1 (en) * | 2001-03-19 | 2003-12-11 | Wright George L | Prostate cancer markers |
| US20050244973A1 (en) * | 2004-04-29 | 2005-11-03 | Predicant Biosciences, Inc. | Biological patterns for diagnosis and treatment of cancer |
| US20070009970A1 (en) * | 2005-07-08 | 2007-01-11 | Predicant Biosciences, Inc. | Biological patterns for diagnosis and treatment of cancer |
Non-Patent Citations (1)
| Title |
|---|
| Tockman et al (Cancer Res., 1992, 52:2711s-2718s) * |
Cited By (124)
| Publication number | Priority date | Publication date | Assignee | Title |
|---|---|---|---|---|
| US11187702B2 (en) | 2003-03-14 | 2021-11-30 | Bio-Rad Laboratories, Inc. | Enzyme quantification |
| US9448172B2 (en) | 2003-03-31 | 2016-09-20 | Medical Research Council | Selection by compartmentalised screening |
| US9857303B2 (en) | 2003-03-31 | 2018-01-02 | Medical Research Council | Selection by compartmentalised screening |
| US10052605B2 (en) | 2003-03-31 | 2018-08-21 | Medical Research Council | Method of synthesis and testing of combinatorial libraries using microcapsules |
| US9925504B2 (en) | 2004-03-31 | 2018-03-27 | President And Fellows Of Harvard College | Compartmentalised combinatorial chemistry by microfluidic control |
| US9839890B2 (en) | 2004-03-31 | 2017-12-12 | National Science Foundation | Compartmentalised combinatorial chemistry by microfluidic control |
| US11821109B2 (en) | 2004-03-31 | 2023-11-21 | President And Fellows Of Harvard College | Compartmentalised combinatorial chemistry by microfluidic control |
| US11786872B2 (en) | 2004-10-08 | 2023-10-17 | United Kingdom Research And Innovation | Vitro evolution in microfluidic systems |
| US9029083B2 (en) | 2004-10-08 | 2015-05-12 | Medical Research Council | Vitro evolution in microfluidic systems |
| US9186643B2 (en) | 2004-10-08 | 2015-11-17 | Medical Research Council | In vitro evolution in microfluidic systems |
| US8871444B2 (en) | 2004-10-08 | 2014-10-28 | Medical Research Council | In vitro evolution in microfluidic systems |
| US9498759B2 (en) | 2004-10-12 | 2016-11-22 | President And Fellows Of Harvard College | Compartmentalized screening by microfluidic control |
| US9410151B2 (en) | 2006-01-11 | 2016-08-09 | Raindance Technologies, Inc. | Microfluidic devices and methods of use in the formation and control of nanoreactors |
| US9328344B2 (en) | 2006-01-11 | 2016-05-03 | Raindance Technologies, Inc. | Microfluidic devices and methods of use in the formation and control of nanoreactors |
| US9534216B2 (en) | 2006-01-11 | 2017-01-03 | Raindance Technologies, Inc. | Microfluidic devices and methods of use in the formation and control of nanoreactors |
| US9562837B2 (en) | 2006-05-11 | 2017-02-07 | Raindance Technologies, Inc. | Systems for handling microfludic droplets |
| US9273308B2 (en) | 2006-05-11 | 2016-03-01 | Raindance Technologies, Inc. | Selection of compartmentalized screening method |
| US11351510B2 (en) | 2006-05-11 | 2022-06-07 | Bio-Rad Laboratories, Inc. | Microfluidic devices |
| US9012390B2 (en) | 2006-08-07 | 2015-04-21 | Raindance Technologies, Inc. | Fluorocarbon emulsion stabilizing surfactants |
| US9498761B2 (en) | 2006-08-07 | 2016-11-22 | Raindance Technologies, Inc. | Fluorocarbon emulsion stabilizing surfactants |
| US20140051601A1 (en) * | 2006-09-19 | 2014-02-20 | Metabolan Inc. | Metabolomic profiling of cancer |
| US20100292331A1 (en) * | 2006-09-19 | 2010-11-18 | Metabalon, Inc. | Biomarkers for Prostate Cancer and Methods Using the Same |
| US8518650B2 (en) | 2006-09-19 | 2013-08-27 | Metabolon, Inc. | Biomarkers for prostate cancer and methods using the same |
| US20100017145A1 (en) * | 2006-12-21 | 2010-01-21 | Ajinomoto Co., Inc. | Method of evaluating cancer state, cancer-evaluating apparatus, cancer-evaluating method, cancer-evaluating system, cancer-evaluating program and recording medium |
| US10603662B2 (en) | 2007-02-06 | 2020-03-31 | Brandeis University | Manipulation of fluids and reactions in microfluidic systems |
| US8772046B2 (en) | 2007-02-06 | 2014-07-08 | Brandeis University | Manipulation of fluids and reactions in microfluidic systems |
| US11819849B2 (en) | 2007-02-06 | 2023-11-21 | Brandeis University | Manipulation of fluids and reactions in microfluidic systems |
| US9017623B2 (en) | 2007-02-06 | 2015-04-28 | Raindance Technologies, Inc. | Manipulation of fluids and reactions in microfluidic systems |
| US9440232B2 (en) | 2007-02-06 | 2016-09-13 | Raindance Technologies, Inc. | Manipulation of fluids and reactions in microfluidic systems |
| US10960397B2 (en) | 2007-04-19 | 2021-03-30 | President And Fellows Of Harvard College | Manipulation of fluids, fluid components and reactions in microfluidic systems |
| US8592221B2 (en) | 2007-04-19 | 2013-11-26 | Brandeis University | Manipulation of fluids, fluid components and reactions in microfluidic systems |
| US10675626B2 (en) | 2007-04-19 | 2020-06-09 | President And Fellows Of Harvard College | Manipulation of fluids, fluid components and reactions in microfluidic systems |
| US11618024B2 (en) | 2007-04-19 | 2023-04-04 | President And Fellows Of Harvard College | Manipulation of fluids, fluid components and reactions in microfluidic systems |
| US9068699B2 (en) | 2007-04-19 | 2015-06-30 | Brandeis University | Manipulation of fluids, fluid components and reactions in microfluidic systems |
| US10357772B2 (en) | 2007-04-19 | 2019-07-23 | President And Fellows Of Harvard College | Manipulation of fluids, fluid components and reactions in microfluidic systems |
| US11224876B2 (en) | 2007-04-19 | 2022-01-18 | Brandeis University | Manipulation of fluids, fluid components and reactions in microfluidic systems |
| US8133736B2 (en) * | 2007-11-07 | 2012-03-13 | University Of South Florida | Methods for detecting or monitoring cancer using LPE as a marker |
| US20110059543A1 (en) * | 2007-11-07 | 2011-03-10 | Lian Shan | Methods for detecting or monitoring cancer using lpe as a marker |
| US20100291690A1 (en) * | 2007-11-07 | 2010-11-18 | Lian Shan | Methods for detecting or monitoring cancer using lpc as a marker |
| US20090159793A1 (en) * | 2007-12-21 | 2009-06-25 | Hanas Jay S | Identification of biomarkers in biological samples and methods of using same |
| US8710429B2 (en) * | 2007-12-21 | 2014-04-29 | The Board Of Regents Of The University Of Ok | Identification of biomarkers in biological samples and methods of using same |
| US20110091924A1 (en) * | 2008-03-04 | 2011-04-21 | Ajinomoto Co., Inc. | Method of evaluating cancer type |
| US20110138889A1 (en) * | 2008-06-20 | 2011-06-16 | Ajinomoto Co., Inc. | Method of evaluating prostatic disease |
| US9465031B2 (en) | 2008-06-20 | 2016-10-11 | Ajinomoto Co., Inc. | Method of evaluating prostatic disease |
| US11596908B2 (en) | 2008-07-18 | 2023-03-07 | Bio-Rad Laboratories, Inc. | Droplet libraries |
| US11511242B2 (en) | 2008-07-18 | 2022-11-29 | Bio-Rad Laboratories, Inc. | Droplet libraries |
| US10533998B2 (en) | 2008-07-18 | 2020-01-14 | Bio-Rad Laboratories, Inc. | Enzyme quantification |
| US11534727B2 (en) | 2008-07-18 | 2022-12-27 | Bio-Rad Laboratories, Inc. | Droplet libraries |
| US11300559B2 (en) | 2008-12-18 | 2022-04-12 | Quest Diagnostics Investments Incorporated | Vitamin B2 detection by mass spectrometry |
| US11821889B2 (en) | 2008-12-18 | 2023-11-21 | Quest Diagnostics Investments Incorporated | Vitamin B2 detection by mass spectrometry |
| US10571455B2 (en) | 2008-12-18 | 2020-02-25 | Quest Diagnostics Investments Incorporated | Vitamin B2 detection by mass spectrometry |
| US20150060659A1 (en) * | 2008-12-18 | 2015-03-05 | Quest Diagnostics Investments Inc. | Vitamin b2 detection by mass spectrometry |
| US8916817B2 (en) * | 2008-12-18 | 2014-12-23 | Quest Diagnostics Investments, Inc. | Vitamin B2 detection by mass spectrometry |
| US20140242711A1 (en) * | 2008-12-18 | 2014-08-28 | Quest Diagnostics Investments Inc. | Vitamin b2 detection by mass spectrometry |
| US8528589B2 (en) | 2009-03-23 | 2013-09-10 | Raindance Technologies, Inc. | Manipulation of microfluidic droplets |
| US11268887B2 (en) | 2009-03-23 | 2022-03-08 | Bio-Rad Laboratories, Inc. | Manipulation of microfluidic droplets |
| US10761083B2 (en) | 2009-04-30 | 2020-09-01 | Purdue Research Foundation | Sample dispenser including an internal standard and methods of use thereof |
| US11287414B2 (en) | 2009-04-30 | 2022-03-29 | Purdue Research Foundation | Sample dispenser including an internal standard and methods of use thereof |
| US11867684B2 (en) | 2009-04-30 | 2024-01-09 | Purdue Research Foundation | Sample dispenser including an internal standard and methods of use thereof |
| US20120122243A1 (en) * | 2009-06-04 | 2012-05-17 | Charite Universitatsmedizin Berlin | Means and method and means for diagnosing prostate carcinomas |
| US10520500B2 (en) | 2009-10-09 | 2019-12-31 | Abdeslam El Harrak | Labelled silica-based nanomaterial with enhanced properties and uses thereof |
| WO2011087845A3 (en) * | 2009-12-22 | 2011-11-17 | The Regents Of The University Of Michigan | Metabolomic profiling of prostate cancer |
| US20110151497A1 (en) * | 2009-12-22 | 2011-06-23 | The Regents Of The University Of Michigan | Metabolomic profiling of prostate cancer |
| US10837883B2 (en) | 2009-12-23 | 2020-11-17 | Bio-Rad Laboratories, Inc. | Microfluidic systems and methods for reducing the exchange of molecules between droplets |
| US20120326025A1 (en) * | 2010-01-29 | 2012-12-27 | IMG Institut fur Medizinische Genomforschung Planu ngsgesellschaft | Diagnosing prostate cancer relapse |
| US9399797B2 (en) | 2010-02-12 | 2016-07-26 | Raindance Technologies, Inc. | Digital analyte analysis |
| US8535889B2 (en) | 2010-02-12 | 2013-09-17 | Raindance Technologies, Inc. | Digital analyte analysis |
| US9366632B2 (en) | 2010-02-12 | 2016-06-14 | Raindance Technologies, Inc. | Digital analyte analysis |
| WO2011100604A2 (en) | 2010-02-12 | 2011-08-18 | Raindance Technologies, Inc. | Digital analyte analysis |
| US9074242B2 (en) | 2010-02-12 | 2015-07-07 | Raindance Technologies, Inc. | Digital analyte analysis |
| US11390917B2 (en) | 2010-02-12 | 2022-07-19 | Bio-Rad Laboratories, Inc. | Digital analyte analysis |
| US10351905B2 (en) | 2010-02-12 | 2019-07-16 | Bio-Rad Laboratories, Inc. | Digital analyte analysis |
| US10808279B2 (en) | 2010-02-12 | 2020-10-20 | Bio-Rad Laboratories, Inc. | Digital analyte analysis |
| US9228229B2 (en) | 2010-02-12 | 2016-01-05 | Raindance Technologies, Inc. | Digital analyte analysis |
| US11254968B2 (en) | 2010-02-12 | 2022-02-22 | Bio-Rad Laboratories, Inc. | Digital analyte analysis |
| EP3392349A1 (en) | 2010-02-12 | 2018-10-24 | Raindance Technologies, Inc. | Digital analyte analysis |
| US9063047B2 (en) * | 2010-05-07 | 2015-06-23 | Ut-Battelle, Llc | System and method for extracting a sample from a surface |
| US20110284735A1 (en) * | 2010-05-07 | 2011-11-24 | Van Berkel Gary J | System and method for extracting a sample from a surface |
| US11635427B2 (en) | 2010-09-30 | 2023-04-25 | Bio-Rad Laboratories, Inc. | Sandwich assays in droplets |
| US9562897B2 (en) | 2010-09-30 | 2017-02-07 | Raindance Technologies, Inc. | Sandwich assays in droplets |
| US9364803B2 (en) | 2011-02-11 | 2016-06-14 | Raindance Technologies, Inc. | Methods for forming mixed droplets |
| US11077415B2 (en) | 2011-02-11 | 2021-08-03 | Bio-Rad Laboratories, Inc. | Methods for forming mixed droplets |
| US11747327B2 (en) | 2011-02-18 | 2023-09-05 | Bio-Rad Laboratories, Inc. | Compositions and methods for molecular labeling |
| US11768198B2 (en) | 2011-02-18 | 2023-09-26 | Bio-Rad Laboratories, Inc. | Compositions and methods for molecular labeling |
| US9150852B2 (en) | 2011-02-18 | 2015-10-06 | Raindance Technologies, Inc. | Compositions and methods for molecular labeling |
| US11168353B2 (en) | 2011-02-18 | 2021-11-09 | Bio-Rad Laboratories, Inc. | Compositions and methods for molecular labeling |
| US11754499B2 (en) | 2011-06-02 | 2023-09-12 | Bio-Rad Laboratories, Inc. | Enzyme quantification |
| US8841071B2 (en) | 2011-06-02 | 2014-09-23 | Raindance Technologies, Inc. | Sample multiplexing |
| US8658430B2 (en) | 2011-07-20 | 2014-02-25 | Raindance Technologies, Inc. | Manipulating droplet size |
| US11898193B2 (en) | 2011-07-20 | 2024-02-13 | Bio-Rad Laboratories, Inc. | Manipulating droplet size |
| EP3495817A1 (en) | 2012-02-10 | 2019-06-12 | Raindance Technologies, Inc. | Molecular diagnostic screening assay |
| EP3524693A1 (en) | 2012-04-30 | 2019-08-14 | Raindance Technologies, Inc. | Digital analyte analysis |
| WO2013165748A1 (en) | 2012-04-30 | 2013-11-07 | Raindance Technologies, Inc | Digital analyte analysis |
| WO2014093314A3 (en) * | 2012-12-12 | 2014-08-07 | Bio-Rad Laboratories, Inc. | Calibration process and system |
| US9810703B2 (en) | 2012-12-12 | 2017-11-07 | Bio-Rad Laboratories, Inc. | Calibration process and system |
| US9176154B2 (en) | 2012-12-12 | 2015-11-03 | Bio-Rad Laboratories, Inc. | Calibration process and system |
| AU2013359597B2 (en) * | 2012-12-12 | 2017-05-25 | Bio-Rad Laboratories, Inc. | Calibration process and system |
| US20150325423A1 (en) * | 2013-01-31 | 2015-11-12 | Purdue Research Foundation | Systems and methods for analyzing an extracted sample |
| US9733228B2 (en) | 2013-01-31 | 2017-08-15 | Purdue Research Foundation | Methods of analyzing crude oil |
| US10197547B2 (en) | 2013-01-31 | 2019-02-05 | Purdue Research Foundation | Methods of analyzing crude oil |
| US10008375B2 (en) * | 2013-01-31 | 2018-06-26 | Purdue Research Foundation | Systems and methods for analyzing an extracted sample |
| US11300555B2 (en) | 2013-01-31 | 2022-04-12 | Purdue Research Foundation | Methods of analyzing crude oil |
| WO2014172288A2 (en) | 2013-04-19 | 2014-10-23 | Raindance Technologies, Inc. | Digital analyte analysis |
| US9620344B2 (en) | 2013-06-25 | 2017-04-11 | Purdue Research Foundation | Mass spectrometry analysis of microorganisms in samples |
| US11830716B2 (en) | 2013-06-25 | 2023-11-28 | Purdue Research Foundation | Mass spectrometry analysis of microorganisms in samples |
| US9941105B2 (en) | 2013-06-25 | 2018-04-10 | Purdue Research Foundation | Mass spectrometry analysis of microorganisms in samples |
| US10811241B2 (en) | 2013-06-25 | 2020-10-20 | Purdue Research Foundation | Mass spectrometry analysis of microorganisms in samples |
| US10964517B2 (en) | 2013-06-25 | 2021-03-30 | Purdue Research Foundation | Mass spectrometry analysis of microorganisms in samples |
| US10622198B2 (en) | 2013-06-25 | 2020-04-14 | Purdue Research Foundation | Mass spectrometry analysis of microorganisms in samples |
| US11393668B2 (en) | 2013-06-25 | 2022-07-19 | Purdue Research Foundation | Mass spectrometry analysis of microorganisms in samples |
| US11901041B2 (en) | 2013-10-04 | 2024-02-13 | Bio-Rad Laboratories, Inc. | Digital analysis of nucleic acid modification |
| US11174509B2 (en) | 2013-12-12 | 2021-11-16 | Bio-Rad Laboratories, Inc. | Distinguishing rare variations in a nucleic acid sequence from a sample |
| US11193176B2 (en) | 2013-12-31 | 2021-12-07 | Bio-Rad Laboratories, Inc. | Method for detecting and quantifying latent retroviral RNA species |
| US11761962B2 (en) | 2014-03-28 | 2023-09-19 | Opko Diagnostics, Llc | Compositions and methods related to diagnosis of prostate cancer |
| US10197551B2 (en) * | 2014-05-30 | 2019-02-05 | ASTA, Co. Ltd. | Integrated disease diagnostic system using matrix-assisted laser desorption/ionization time-of-flight mass spectrometer |
| US11348776B2 (en) | 2014-05-30 | 2022-05-31 | ASTA, Co. Ltd. | Integrated disease diagnostic system using matrix-assisted laser desorption/ionization time-of-flight mass spectrometer |
| US20150346186A1 (en) * | 2014-05-30 | 2015-12-03 | ASTA, Co. Ltd. | Integrated disease diagnostic system using matrix-assisted laser desorption/ionization time-of-flight mass spectrometer |
| US10879056B2 (en) | 2014-05-30 | 2020-12-29 | ASTA, Co. Ltd | Integrated disease diagnostic system using matrix-assisted laser desorption/ionization time-of-flight mass spectrometer |
| US10256085B2 (en) | 2014-12-05 | 2019-04-09 | Purdue Research Foundation | Zero voltage mass spectrometry probes and systems |
| US10381209B2 (en) | 2015-02-06 | 2019-08-13 | Purdue Research Foundation | Probes, systems, cartridges, and methods of use thereof |
| US11921115B2 (en) | 2015-03-27 | 2024-03-05 | Opko Diagnostics, Llc | Prostate antigen standards and uses thereof |
| US10647981B1 (en) | 2015-09-08 | 2020-05-12 | Bio-Rad Laboratories, Inc. | Nucleic acid library generation methods and compositions |
| US11710626B2 (en) | 2017-08-28 | 2023-07-25 | Purdue Research Foundation | Systems and methods for sample analysis using swabs |
| US10998178B2 (en) | 2017-08-28 | 2021-05-04 | Purdue Research Foundation | Systems and methods for sample analysis using swabs |
Also Published As
| Publication number | Publication date |
|---|---|
| AU2007231487A1 (en) | 2007-10-04 |
| BRPI0709176A2 (en) | 2011-06-28 |
| JP5502972B2 (en) | 2014-05-28 |
| SG170061A1 (en) | 2011-04-29 |
| WO2007109881A8 (en) | 2007-12-13 |
| AU2007231487B2 (en) | 2014-01-09 |
| JP2013092527A (en) | 2013-05-16 |
| WO2007109881A9 (en) | 2008-10-30 |
| CA2644330C (en) | 2012-05-01 |
| US20130330746A1 (en) | 2013-12-12 |
| CN101454331A (en) | 2009-06-10 |
| US8409794B2 (en) | 2013-04-02 |
| EP1922326A4 (en) | 2011-06-01 |
| KR20090006837A (en) | 2009-01-15 |
| JP5612303B2 (en) | 2014-10-22 |
| EP2674435A3 (en) | 2014-04-30 |
| JP2009530624A (en) | 2009-08-27 |
| EP1922326A1 (en) | 2008-05-21 |
| CA2644330A1 (en) | 2007-10-04 |
| EP2674435A2 (en) | 2013-12-18 |
| WO2007109881A1 (en) | 2007-10-04 |
Similar Documents
| Publication | Publication Date | Title |
|---|---|---|
| US8409794B2 (en) | Biomarkers useful for diagnosing prostate cancer, and methods thereof | |
| US11079385B2 (en) | Serum-based biomarkers of pancreatic cancer and uses thereof for disease detection and diagnosis | |
| AU2006291988B2 (en) | Method for the diagnosis of colorectal cancer and ovarian cancer by the measurement of vitamin E-related metabolites | |
| US20160377623A1 (en) | Methods for the diagnosis of ovarian cancer health states and risk of ovarian cancer health states | |
| US20200363419A1 (en) | A method of diagnosing cancer based on lipidomic analysis of a body fluid | |
| Jelonek et al. | Cancer biomarkers and mass spectrometry-based analyses of phospholipids in body fluids | |
| Buszewska-Forajta et al. | New approach in determination of urinary diagnostic markers for prostate cancer by MALDI-TOF/MS | |
| Zhang et al. | Altered phosphatidylcholines expression in sputum for diagnosis of non-small cell lung cancer | |
| AU2013201305A1 (en) | Method for the diagnosis of colorectal cancer and ovarian cancer by the measurement of vitamin E-related metabolites |
Legal Events
| Date | Code | Title | Description |
|---|---|---|---|
| AS | Assignment |
Owner name: PHENOMENOME DISCOVERIES INC., CANADA Free format text: ASSIGNMENT OF ASSIGNORS INTEREST;ASSIGNORS:RITCHIE, SHAWN;BINGHAM, ERIN;REEL/FRAME:021822/0295 Effective date: 20081105 |
|
| FEPP | Fee payment procedure |
Free format text: PAYOR NUMBER ASSIGNED (ORIGINAL EVENT CODE: ASPN); ENTITY STATUS OF PATENT OWNER: LARGE ENTITY |
|
| STCF | Information on status: patent grant |
Free format text: PATENTED CASE |
|
| CC | Certificate of correction | ||
| FPAY | Fee payment |
Year of fee payment: 4 |
|
| AS | Assignment |
Owner name: MED-LIFE DISCOVERIES LP, CANADA Free format text: ASSIGNMENT OF ASSIGNORS INTEREST;ASSIGNOR:PHENOMENOME DISCOVERIES INC.;REEL/FRAME:045969/0316 Effective date: 20180321 |
|
| FEPP | Fee payment procedure |
Free format text: MAINTENANCE FEE REMINDER MAILED (ORIGINAL EVENT CODE: REM.); ENTITY STATUS OF PATENT OWNER: LARGE ENTITY |
|
| LAPS | Lapse for failure to pay maintenance fees |
Free format text: PATENT EXPIRED FOR FAILURE TO PAY MAINTENANCE FEES (ORIGINAL EVENT CODE: EXP.); ENTITY STATUS OF PATENT OWNER: LARGE ENTITY |
|
| STCH | Information on status: patent discontinuation |
Free format text: PATENT EXPIRED DUE TO NONPAYMENT OF MAINTENANCE FEES UNDER 37 CFR 1.362 |
|
| FP | Lapsed due to failure to pay maintenance fee |
Effective date: 20210402 |