US20080098365A1 - Performance analyzer - Google Patents
Performance analyzer Download PDFInfo
- Publication number
- US20080098365A1 US20080098365A1 US11/536,328 US53632806A US2008098365A1 US 20080098365 A1 US20080098365 A1 US 20080098365A1 US 53632806 A US53632806 A US 53632806A US 2008098365 A1 US2008098365 A1 US 2008098365A1
- Authority
- US
- United States
- Prior art keywords
- information
- callee stack
- data
- callee
- log entries
- Prior art date
- Legal status (The legal status is an assumption and is not a legal conclusion. Google has not performed a legal analysis and makes no representation as to the accuracy of the status listed.)
- Granted
Links
Images


Classifications
-
- G—PHYSICS
- G06—COMPUTING; CALCULATING OR COUNTING
- G06F—ELECTRIC DIGITAL DATA PROCESSING
- G06F11/00—Error detection; Error correction; Monitoring
- G06F11/30—Monitoring
- G06F11/34—Recording or statistical evaluation of computer activity, e.g. of down time, of input/output operation ; Recording or statistical evaluation of user activity, e.g. usability assessment
- G06F11/3466—Performance evaluation by tracing or monitoring
- G06F11/3476—Data logging
-
- G—PHYSICS
- G06—COMPUTING; CALCULATING OR COUNTING
- G06F—ELECTRIC DIGITAL DATA PROCESSING
- G06F11/00—Error detection; Error correction; Monitoring
- G06F11/30—Monitoring
- G06F11/34—Recording or statistical evaluation of computer activity, e.g. of down time, of input/output operation ; Recording or statistical evaluation of user activity, e.g. usability assessment
- G06F11/3409—Recording or statistical evaluation of computer activity, e.g. of down time, of input/output operation ; Recording or statistical evaluation of user activity, e.g. usability assessment for performance assessment
-
- G—PHYSICS
- G06—COMPUTING; CALCULATING OR COUNTING
- G06F—ELECTRIC DIGITAL DATA PROCESSING
- G06F11/00—Error detection; Error correction; Monitoring
- G06F11/30—Monitoring
- G06F11/34—Recording or statistical evaluation of computer activity, e.g. of down time, of input/output operation ; Recording or statistical evaluation of user activity, e.g. usability assessment
- G06F11/3466—Performance evaluation by tracing or monitoring
- G06F11/3495—Performance evaluation by tracing or monitoring for systems
-
- G—PHYSICS
- G06—COMPUTING; CALCULATING OR COUNTING
- G06F—ELECTRIC DIGITAL DATA PROCESSING
- G06F9/00—Arrangements for program control, e.g. control units
- G06F9/06—Arrangements for program control, e.g. control units using stored programs, i.e. using an internal store of processing equipment to receive or retain programs
- G06F9/44—Arrangements for executing specific programs
- G06F9/448—Execution paradigms, e.g. implementations of programming paradigms
- G06F9/4482—Procedural
- G06F9/4484—Executing subprograms
Definitions
- the present invention relates to monitoring analyzing and managing performance of data processing systems, components of such systems, software applications operating on such systems and like, and more particularly to a method and system for performance analysis of data processing systems, such as a Java 2 Platform, Enterprise Edition (J2EE) environment, or similar environment or system.
- J2EE Java 2 Platform, Enterprise Edition
- J2EE Java 2 Platform, Enterprise Edition
- APIs application programming interfaces
- Java and J2EE are trademarks of Sun Microsystems in the United States, other countries or both. Understanding which components and APIs are important to manage requires in-depth knowledge. Considering thousands of lines of code and that hundreds or thousands of components and APIs must be tracked continually, all of which may execute in seconds or milliseconds, the task of manually monitoring such systems becomes unfeasible for the administrator or infrastructure manager. Utilities have been developed to help, but to date these programs have been largely focused on preproduction development processes such as code profiling.
- a method for performance analysis of a system may include capturing data including callee stack information and persisting the callee stack information in a form that can be queried. The method may also include generating a performance analysis report in response to a query.
- a method for performance analysis of a system may include capturing data related to operation of the system.
- the method may also include extracting callee stack trace information from the captured data and persisting the callee stack trace information in a form adapted to be queried.
- the method may further include generating a report using the callee stack trace information to permit identification of any performance issues.
- a system for performance analysis of a data processing system or the like may include an entity manager to generate a plurality of log entries including information related to operation of the data processing system.
- the system may also include a log analyzer to extract callee stack trace information from the log entries.
- the system may further include an output device to present a report related to performance of the data processing system using the extracted callee stack trace information.
- a computer program product for performance analysis of a system may include a computer usable medium having computer usable program code embodied therewith.
- the computer usable medium may include computer usable program code configured to capture data including callee stack information.
- the computer usable medium may also include computer usable program code configured to persist the callee stack information in a form that can be queried.
- the computer usable medium may also include computer usable program code configured to generate a performance analysis report in response to a query.
- FIG. 1 is a flow chart of an example of a method for performance analysis of a data processing system or the like in accordance with an embodiment of the present invention.
- FIG. 2 is a flow chart of an example of a method for data analysis for use with the performance analysis method of FIG. 1 in accordance with an embodiment of the present invention.
- FIG. 3 is block diagram of an example of a system for performance analysis of a data processing system in accordance with an embodiment of the present invention.
- the present invention may be embodied as a method, system, or computer program product. Accordingly, the present invention may take the form of an entirely hardware embodiment, an entirely software embodiment (including firmware, resident software, micro-code, etc.) or an embodiment combining software and hardware aspects that may all generally be referred to herein as a “circuit,” “module” or “system.” Furthermore, the present invention may take the form of a computer program product on a computer-usable storage medium, for example medium 350 in FIG. 3 , having computer-usable program code embodied in the medium.
- the computer-usable or computer-readable medium may be, for example but not limited to, an electronic, magnetic, optical, electromagnetic, infrared, or semiconductor system, apparatus, device, or propagation medium. More specific examples (a non-exhaustive list) of the computer-readable medium would include the following: an electrical connection having one or more wires, a portable computer diskette, a hard disk, a random access memory (RAM), a read-only memory (ROM), an erasable programmable read-only memory (EPROM or Flash memory), an optical fiber, a portable compact disc read-only memory (CD-ROM), an optical storage device, a transmission media such as those supporting the Internet or an intranet, or a magnetic storage device.
- a computer-usable or computer-readable medium may be any medium that can contain, store, communicate, propagate, or transport the program for use by or in connection with the instruction execution system, apparatus, or device.
- the computer-usable medium may include a propagated data signal with the computer-usable program code embodied therewith, either in baseband or as part of a carrier wave.
- the computer usable program code may be transmitted using any appropriate medium, including but not limited to the Internet, wireline, optical fiber cable, radio frequency (RF) or other means.
- Computer program code for carrying out operations of the present invention may be written in an object oriented programming language such as Java, Smalltalk, C++ or the like. However, the computer program code for carrying out operations of the present invention may also be written in conventional procedural programming languages, such as the “C” programming language or similar programming languages.
- the program code may execute entirely on the user's computer, partly on the user's computer, as a stand-alone software package, partly on the user's computer and partly on a remote computer or entirely on the remote computer or server.
- the remote computer may be connected to the user's computer through a local area network (LAN) or a wide area network (WAN), or the connection may be made to an external computer (for example, through the Internet using an Internet Service Provider).
- LAN local area network
- WAN wide area network
- Internet Service Provider for example, AT&T, MCI, Sprint, EarthLink, MSN, GTE, etc.
- These computer program instructions may also be stored in a computer-readable memory that can direct a computer or other programmable data processing apparatus to function in a particular manner, such that the instructions stored in the computer-readable memory produce an article of manufacture including instruction means which implement the function/act specified in the flowchart and/or block diagram block or blocks.
- the computer program instructions may also be loaded onto a computer or other programmable data processing apparatus to cause a series of operational steps to be performed on the computer or other programmable apparatus to produce a computer implemented process such that the instructions which execute on the computer or other programmable apparatus provide steps for implementing the functions/acts specified in the flowchart and/or block diagram block or block.
- FIG. 1 is a flow chart of an example of a method 100 for performance analysis of a data processing system or the like in accordance with an embodiment of the present invention.
- an entity manager operable on a server or embodied in a server may be started in response to a client accessing the server.
- the client may call the entity manager or server using an altered application programming interface (API) or the like.
- API may be altered or adapted to capture information related to performance of the system, such as callee stack information or other performance related data.
- the system performance information may include callee stack information.
- the performance information may include information that identifies the application, a specific portion of the application or operation, identity of the user or other performance related information.
- the callee stack information may include a file name, a code line number or line numbers, parameters associated with the application or operation, machine ID, thread ID, time stamp, or similar information related to the stack and callee stack trace information.
- a callee stack is a location for temporary storage. Parameters may be pushed onto the stack, and then a return address may be pushed onto the stack. The flow of execution must know where to return in a process or operation.
- a processor executes one instruction after the other and has to be told where to go or return. In order to tell the processor how to get back, the return address needs to be saved.
- the return address is the location in the program to be returned to after a function call.
- a “CALL” is an assembly instruction that performs this operation.
- a “RET” is an assembly instruction that uses the current value on the stack and the return address to transfer execution to that location.
- a plurality of log entries may be generated in response to capturing the system performance information.
- the log entries may include the captured system performance information which contains the callee stack information.
- the log entries may be stored in a repository, database or file system for data analysis.
- the log entries may be analyzed.
- Useful information such as the callee stack information
- a data capture program may extract the callee stack trace information from the other captured information in the log entries.
- the captured system performance information in the log entries may be parsed to re-create the callee stack information in correct time order.
- the extracted callee stack information may be persisted or stored in a repository, database or the like that can be queried.
- the extracted callee stack information may be persisted in a format that can be queried to extract data for generating reports related to system performance.
- the callee-stack information may be analyzed and various reports may be generated to help identify system performance issues, bottlenecks or the like in response to queries.
- the analysis may include comparing persisted information to previously stored information to identify trends or changes in performance level. Other statistical analysis of the information may be performed to identify possible performance issues and to help develop remedial measures.
- FIG. 2 is a flow chart of an example of a method 200 for data analysis for use with the performance analysis method 100 of FIG. 1 in accordance with an embodiment of the present invention.
- the log entries or data may be stripped of all information not related to the callee stack trace.
- the log entries may be read into memory or a database.
- a Java program or similar program may be used to read the log data into memory.
- a determination may be made whether the log entry is a “start” type or an “end” type. If the log entry is an “end” type, the method 200 may advance to block 208 .
- a start entry corresponding to the end type entry may be found. The corresponding start entry may be found using a key. Examples of the key may include a machine ID, a thread ID, a time stamp or other data that may lead to the start entry corresponding to the end type entry. From block 208 , the method 200 may advance to block 214 described below.
- the method 200 may advance to block 210 .
- a new log entry may be started for the machine ID, thread ID, time stamp and any other related data.
- a unique key into a hash map of the log entry data structure may be formed. The unique key may be formed using the machine ID, thread ID, time stamp or the like. The unique key may be generated by any known method.
- the sorted hash map may be persisted into a database for generating various reports in response to queries.
- the various reports may include performance reports 216 to permit identification of any performance issues, bottlenecks or the like.
- the sorted hash map may permit reports to be generated enabling a determination of a specific cause for the performance issues, a section of the code or specific line numbers of code in question, specific users or operations when performance issues arise or other information to pin point the cause of performance issues, bottlenecks or the like and to provide possible incite to remedial action.
- FIG. 3 is block diagram of an example of a system 300 for performance analysis of a data processing system or the like in accordance with an embodiment of the present invention.
- the methods 100 and 200 of FIGS. 1 and 2 may be embodied in the system 300 .
- the system 300 may include a server 302 to collect or receive performance information from a client 304 .
- the performance information may be related to a data processing system, a web-based enterprise system, such as a J2EE system, or similar systems and their components and APIs. Similar to that previously discussed, the performance information may include callee stack information or the like.
- An entity manager 306 may be operable on the server 302 to log entries including the performance information related to operation of the data processing system, J2EE system or the like.
- the entity manager 304 may be embodied in the server 302 .
- the log entries may be persisted or stored on a repository, database system 308 or the like.
- the entity manager 302 may be started in response to being accessed by the client 304 .
- An API 310 may be associated with the client 304 and/or the entity manager 306 or server 302 .
- the API may be altered or adapted to capture the system performance information including the callee stack information.
- the system 300 may also include a log analyzer 312 .
- the log analyzer may be operable on or embodied in a processor 314 .
- the log analyzer 312 may process the log entries to extract the callee stack information similar to that previously discussed.
- the log analyzer 312 may parse the captured system performance information to re-create the callee stack information in correct time order.
- the extracted callee stack information may be persisted or stored in another database system 316 or repository that can be queried.
- the callee stack information may be persisted in a form that can be queried to extract data for generating reports related to system performance.
- the system 300 may also include a report generator 318 .
- the report generator may be operable on or may be embodied on a processor 320 .
- the processor 320 and 314 may be one processor or separate processors.
- the report generator 318 may form queries to extract data form the callee stack trace information, format data to generate reports and may perform other analysis related to the callee stack information.
- An output device 322 or devices may be provided to present a report 324 related to performance of the data processing system or the like using the extracted callee stack trace information processed by the report generator 318 .
- the report 324 may be used to facilitate identification of performance issues, such as bottlenecks, inefficient code, code errors or other anomalies affecting performance.
- the output device 322 or devices may include a printer, monitor, disk drives or other output devices.
- the report 324 may include performance information, such as which applications are calling others, how often calling other applications, when calling, what other operations may be going on, what portions of code are calling or operating when call is performed, or other information or statistics.
- each block in the flowchart or block diagrams may represent a module, segment, or portion of code, which comprises one or more executable instructions for implementing the specified logical function(s).
- the functions noted in the block may occur out of the order noted in the figures. For example, two blocks shown in succession may, in fact, be executed substantially concurrently, or the blocks may sometimes be executed in the reverse order, depending upon the functionality involved.
Abstract
Description
- The present invention relates to monitoring analyzing and managing performance of data processing systems, components of such systems, software applications operating on such systems and like, and more particularly to a method and system for performance analysis of data processing systems, such as a Java 2 Platform, Enterprise Edition (J2EE) environment, or similar environment or system.
- Monitoring, analyzing and managing the performance of a data processing system, a web-based enterprise system, such as a Java 2 Platform, Enterprise Edition (J2EE) system, or similar systems and their components and application programming interfaces (APIs), can be extremely challenging, if not a close to an impossible task. Java and J2EE are trademarks of Sun Microsystems in the United States, other countries or both. Understanding which components and APIs are important to manage requires in-depth knowledge. Considering thousands of lines of code and that hundreds or thousands of components and APIs must be tracked continually, all of which may execute in seconds or milliseconds, the task of manually monitoring such systems becomes unfeasible for the administrator or infrastructure manager. Utilities have been developed to help, but to date these programs have been largely focused on preproduction development processes such as code profiling.
- In accordance with an embodiment of the present invention, a method for performance analysis of a system may include capturing data including callee stack information and persisting the callee stack information in a form that can be queried. The method may also include generating a performance analysis report in response to a query.
- In accordance with an embodiment of the present invention, a method for performance analysis of a system may include capturing data related to operation of the system. The method may also include extracting callee stack trace information from the captured data and persisting the callee stack trace information in a form adapted to be queried. The method may further include generating a report using the callee stack trace information to permit identification of any performance issues.
- In accordance with another embodiment of the present invention, a system for performance analysis of a data processing system or the like may include an entity manager to generate a plurality of log entries including information related to operation of the data processing system. The system may also include a log analyzer to extract callee stack trace information from the log entries. The system may further include an output device to present a report related to performance of the data processing system using the extracted callee stack trace information.
- In accordance with another embodiment of the present invention, a computer program product for performance analysis of a system may include a computer usable medium having computer usable program code embodied therewith. The computer usable medium may include computer usable program code configured to capture data including callee stack information. The computer usable medium may also include computer usable program code configured to persist the callee stack information in a form that can be queried. The computer usable medium may also include computer usable program code configured to generate a performance analysis report in response to a query.
- Other aspects and features of the present invention, as defined solely by the claims, will become apparent to those ordinarily skilled in the art upon review of the following non-limited detailed description of the invention in conjunction with the accompanying figures.
-
FIG. 1 is a flow chart of an example of a method for performance analysis of a data processing system or the like in accordance with an embodiment of the present invention. -
FIG. 2 is a flow chart of an example of a method for data analysis for use with the performance analysis method ofFIG. 1 in accordance with an embodiment of the present invention. -
FIG. 3 is block diagram of an example of a system for performance analysis of a data processing system in accordance with an embodiment of the present invention. - The following detailed description of embodiments refers to the accompanying drawings, which illustrate specific embodiments of the invention. Other embodiments having different structures and operations do not depart from the scope of the present invention.
- As will be appreciated by one of skill in the art, the present invention may be embodied as a method, system, or computer program product. Accordingly, the present invention may take the form of an entirely hardware embodiment, an entirely software embodiment (including firmware, resident software, micro-code, etc.) or an embodiment combining software and hardware aspects that may all generally be referred to herein as a “circuit,” “module” or “system.” Furthermore, the present invention may take the form of a computer program product on a computer-usable storage medium, for
example medium 350 inFIG. 3 , having computer-usable program code embodied in the medium. - Any suitable computer usable or computer readable medium may be utilized. The computer-usable or computer-readable medium may be, for example but not limited to, an electronic, magnetic, optical, electromagnetic, infrared, or semiconductor system, apparatus, device, or propagation medium. More specific examples (a non-exhaustive list) of the computer-readable medium would include the following: an electrical connection having one or more wires, a portable computer diskette, a hard disk, a random access memory (RAM), a read-only memory (ROM), an erasable programmable read-only memory (EPROM or Flash memory), an optical fiber, a portable compact disc read-only memory (CD-ROM), an optical storage device, a transmission media such as those supporting the Internet or an intranet, or a magnetic storage device. Note that the computer-usable or computer-readable medium-could even be paper or another suitable medium upon which the program is printed, as the program can be electronically captured, via, for instance, optical scanning of the paper or other medium, then compiled, interpreted, or otherwise processed in a suitable manner, if necessary, and then stored in a computer memory. In the context of this document, a computer-usable or computer-readable medium may be any medium that can contain, store, communicate, propagate, or transport the program for use by or in connection with the instruction execution system, apparatus, or device. The computer-usable medium may include a propagated data signal with the computer-usable program code embodied therewith, either in baseband or as part of a carrier wave. The computer usable program code may be transmitted using any appropriate medium, including but not limited to the Internet, wireline, optical fiber cable, radio frequency (RF) or other means.
- Computer program code for carrying out operations of the present invention may be written in an object oriented programming language such as Java, Smalltalk, C++ or the like. However, the computer program code for carrying out operations of the present invention may also be written in conventional procedural programming languages, such as the “C” programming language or similar programming languages. The program code may execute entirely on the user's computer, partly on the user's computer, as a stand-alone software package, partly on the user's computer and partly on a remote computer or entirely on the remote computer or server. In the latter scenario, the remote computer may be connected to the user's computer through a local area network (LAN) or a wide area network (WAN), or the connection may be made to an external computer (for example, through the Internet using an Internet Service Provider).
- The present invention is described below with reference to flowchart illustrations and/or block diagrams of methods, apparatus (systems) and computer program products according to embodiments of the invention. It will be understood that each block of the flowchart illustrations and/or block diagrams, and combinations of blocks in the flowchart illustrations and/or block diagrams, can be implemented by computer program instructions. These computer program instructions may be provided to a processor of a general purpose computer, special purpose computer, or other programmable data processing apparatus to produce a machine, such that the instructions, which execute via the processor of the computer or other programmable data processing apparatus, create means for implementing the functions/acts specified in the flowchart and/or block diagram block or blocks.
- These computer program instructions may also be stored in a computer-readable memory that can direct a computer or other programmable data processing apparatus to function in a particular manner, such that the instructions stored in the computer-readable memory produce an article of manufacture including instruction means which implement the function/act specified in the flowchart and/or block diagram block or blocks.
- The computer program instructions may also be loaded onto a computer or other programmable data processing apparatus to cause a series of operational steps to be performed on the computer or other programmable apparatus to produce a computer implemented process such that the instructions which execute on the computer or other programmable apparatus provide steps for implementing the functions/acts specified in the flowchart and/or block diagram block or block.
-
FIG. 1 is a flow chart of an example of amethod 100 for performance analysis of a data processing system or the like in accordance with an embodiment of the present invention. Inblock 102, an entity manager operable on a server or embodied in a server may be started in response to a client accessing the server. The client may call the entity manager or server using an altered application programming interface (API) or the like. The API may be altered or adapted to capture information related to performance of the system, such as callee stack information or other performance related data. - In block 106, information related to performance of the system may be captured. The system performance information may include callee stack information. The performance information may include information that identifies the application, a specific portion of the application or operation, identity of the user or other performance related information. The callee stack information may include a file name, a code line number or line numbers, parameters associated with the application or operation, machine ID, thread ID, time stamp, or similar information related to the stack and callee stack trace information.
- A callee stack is a location for temporary storage. Parameters may be pushed onto the stack, and then a return address may be pushed onto the stack. The flow of execution must know where to return in a process or operation. A processor executes one instruction after the other and has to be told where to go or return. In order to tell the processor how to get back, the return address needs to be saved. The return address is the location in the program to be returned to after a function call. A “CALL” is an assembly instruction that performs this operation. A “RET” is an assembly instruction that uses the current value on the stack and the return address to transfer execution to that location. There may also be local variables and possibly other values that may be pushed onto the stack for temporary storage. This is one of the reasons an array or an address of any local variable can never be returned. They disappear when the function returns.
- In
block 108, a plurality of log entries may be generated in response to capturing the system performance information. The log entries may include the captured system performance information which contains the callee stack information. Inblock 110, the log entries may be stored in a repository, database or file system for data analysis. - In
block 112, the log entries may be analyzed. Useful information, such as the callee stack information, may be extracted from the log entries. A data capture program may extract the callee stack trace information from the other captured information in the log entries. The captured system performance information in the log entries may be parsed to re-create the callee stack information in correct time order. An example of a method for analyzing the log entries and callee stack trace information will be described in more detail with reference toFIG. 2 . - In
block 114, the extracted callee stack information may be persisted or stored in a repository, database or the like that can be queried. The extracted callee stack information may be persisted in a format that can be queried to extract data for generating reports related to system performance. - In
block 116, the callee-stack information may be analyzed and various reports may be generated to help identify system performance issues, bottlenecks or the like in response to queries. The analysis may include comparing persisted information to previously stored information to identify trends or changes in performance level. Other statistical analysis of the information may be performed to identify possible performance issues and to help develop remedial measures. -
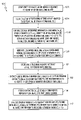
FIG. 2 is a flow chart of an example of amethod 200 for data analysis for use with theperformance analysis method 100 ofFIG. 1 in accordance with an embodiment of the present invention. Inblock 202, the log entries or data may be stripped of all information not related to the callee stack trace. Inblock 204, the log entries may be read into memory or a database. A Java program or similar program may be used to read the log data into memory. - In
block 206, a determination may be made whether the log entry is a “start” type or an “end” type. If the log entry is an “end” type, themethod 200 may advance to block 208. Inblock 208, a start entry corresponding to the end type entry may be found. The corresponding start entry may be found using a key. Examples of the key may include a machine ID, a thread ID, a time stamp or other data that may lead to the start entry corresponding to the end type entry. Fromblock 208, themethod 200 may advance to block 214 described below. - If the log entry is a “start” type in
block 206, themethod 200 may advance to block 210. Inblock 210, a new log entry may be started for the machine ID, thread ID, time stamp and any other related data. A unique key into a hash map of the log entry data structure may be formed. The unique key may be formed using the machine ID, thread ID, time stamp or the like. The unique key may be generated by any known method. - In
block 212, a determination may be made if there is more log data or log entries. If so, themethod 200 may return to block 204 and themethod 200 may proceed as previously described. If there is no more log data, themethod 200 may advance to block 214. - In
block 214, the sorted hash map may be persisted into a database for generating various reports in response to queries. The various reports may include performance reports 216 to permit identification of any performance issues, bottlenecks or the like. The sorted hash map may permit reports to be generated enabling a determination of a specific cause for the performance issues, a section of the code or specific line numbers of code in question, specific users or operations when performance issues arise or other information to pin point the cause of performance issues, bottlenecks or the like and to provide possible incite to remedial action. -
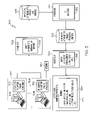
FIG. 3 is block diagram of an example of asystem 300 for performance analysis of a data processing system or the like in accordance with an embodiment of the present invention. Themethods FIGS. 1 and 2 , respectively, may be embodied in thesystem 300. Thesystem 300 may include aserver 302 to collect or receive performance information from aclient 304. The performance information may be related to a data processing system, a web-based enterprise system, such as a J2EE system, or similar systems and their components and APIs. Similar to that previously discussed, the performance information may include callee stack information or the like. Anentity manager 306 may be operable on theserver 302 to log entries including the performance information related to operation of the data processing system, J2EE system or the like. Theentity manager 304 may be embodied in theserver 302. The log entries may be persisted or stored on a repository,database system 308 or the like. - The
entity manager 302 may be started in response to being accessed by theclient 304. AnAPI 310 may be associated with theclient 304 and/or theentity manager 306 orserver 302. The API may be altered or adapted to capture the system performance information including the callee stack information. - The
system 300 may also include alog analyzer 312. The log analyzer may be operable on or embodied in aprocessor 314. Thelog analyzer 312 may process the log entries to extract the callee stack information similar to that previously discussed. Thelog analyzer 312 may parse the captured system performance information to re-create the callee stack information in correct time order. The extracted callee stack information may be persisted or stored in anotherdatabase system 316 or repository that can be queried. The callee stack information may be persisted in a form that can be queried to extract data for generating reports related to system performance. - The
system 300 may also include a report generator 318. The report generator may be operable on or may be embodied on aprocessor 320. Theprocessor - An
output device 322 or devices may be provided to present areport 324 related to performance of the data processing system or the like using the extracted callee stack trace information processed by the report generator 318. Thereport 324 may be used to facilitate identification of performance issues, such as bottlenecks, inefficient code, code errors or other anomalies affecting performance. Theoutput device 322 or devices may include a printer, monitor, disk drives or other output devices. Thereport 324 may include performance information, such as which applications are calling others, how often calling other applications, when calling, what other operations may be going on, what portions of code are calling or operating when call is performed, or other information or statistics. - The flowcharts and block diagrams in the Figures illustrate the architecture, functionality, and operation of possible implementations of systems, methods and computer program products according to various embodiments of the present invention. In this regard, each block in the flowchart or block diagrams may represent a module, segment, or portion of code, which comprises one or more executable instructions for implementing the specified logical function(s). It should also be noted that, in some alternative implementations, the functions noted in the block may occur out of the order noted in the figures. For example, two blocks shown in succession may, in fact, be executed substantially concurrently, or the blocks may sometimes be executed in the reverse order, depending upon the functionality involved. It will also be noted that each block of the block diagrams and/or flowchart illustration, and combinations of blocks in the block diagrams and/or flowchart illustration, can be implemented by special purpose hardware-based systems which perform the specified functions or acts, or combinations of special purpose hardware and computer instructions.
- The terminology used herein is for the purpose of describing particular embodiments only and is not intended to be limiting of the invention. As used herein, the singular forms “a”, “an” and “the” are intended to include the plural forms as well, unless the context clearly indicates otherwise. It will be further understood that the terms “comprises” and/or “comprising,” when used in this specification, specify the presence of stated features, integers, steps, operations, elements, and/or components, but do not preclude the presence or addition of one or more other features, integers, steps, operations, elements, components, and/or groups thereof.
- Although specific embodiments have been illustrated and described herein, those of ordinary skill in the art appreciate that any arrangement which is calculated to achieve the same purpose may be substituted for the specific embodiments shown and that the invention has other applications in other environments. This application is intended to cover any adaptations or variations of the present invention. The following claims are in no way intended to limit the scope of the invention to the specific embodiments described herein.
Claims (34)
Priority Applications (1)
| Application Number | Priority Date | Filing Date | Title |
|---|---|---|---|
| US11/536,328 US7913233B2 (en) | 2006-09-28 | 2006-09-28 | Performance analyzer |
Applications Claiming Priority (1)
| Application Number | Priority Date | Filing Date | Title |
|---|---|---|---|
| US11/536,328 US7913233B2 (en) | 2006-09-28 | 2006-09-28 | Performance analyzer |
Publications (2)
| Publication Number | Publication Date |
|---|---|
| US20080098365A1 true US20080098365A1 (en) | 2008-04-24 |
| US7913233B2 US7913233B2 (en) | 2011-03-22 |
Family
ID=39319536
Family Applications (1)
| Application Number | Title | Priority Date | Filing Date |
|---|---|---|---|
| US11/536,328 Active 2029-11-19 US7913233B2 (en) | 2006-09-28 | 2006-09-28 | Performance analyzer |
Country Status (1)
| Country | Link |
|---|---|
| US (1) | US7913233B2 (en) |
Cited By (9)
| Publication number | Priority date | Publication date | Assignee | Title |
|---|---|---|---|---|
| US20090217006A1 (en) * | 2008-02-27 | 2009-08-27 | Soren Sandmann Pedersen | Heuristic backtracer |
| US20110219265A1 (en) * | 2010-03-02 | 2011-09-08 | Fuji Xerox Co., Ltd. | Computer readable medium, verification support method and verification support apparatus |
| US20120166430A1 (en) * | 2010-12-28 | 2012-06-28 | Sevone, Inc. | Scalable Performance Management System |
| WO2015057617A1 (en) * | 2013-10-14 | 2015-04-23 | Nec Laboratories America, Inc. | Transparent performance inference of whole software layers and context-sensitive performance debugging |
| US20150293832A1 (en) * | 2012-09-25 | 2015-10-15 | Sk Planet Co., Ltd. | System and method for linking debugging message |
| CN105183489A (en) * | 2015-10-10 | 2015-12-23 | 南京国电南自轨道交通工程有限公司 | Extjs frame based intelligent data analysis system and method |
| US20160019057A1 (en) * | 2014-07-18 | 2016-01-21 | Ab lnitio Technology LLC | Managing parameter sets |
| CN110618940A (en) * | 2019-09-19 | 2019-12-27 | 腾讯科技(深圳)有限公司 | Stack information tracking method and device, computer readable medium and computing device |
| CN112083976A (en) * | 2020-08-12 | 2020-12-15 | 北京字节跳动网络技术有限公司 | Information acquisition method, device, medium and equipment |
Families Citing this family (2)
| Publication number | Priority date | Publication date | Assignee | Title |
|---|---|---|---|---|
| US8904412B2 (en) | 2012-09-26 | 2014-12-02 | International Business Machines Corporation | Dynamic performance data collection in large computer servers |
| US9436533B2 (en) * | 2014-05-30 | 2016-09-06 | Apteligent, Inc. | System for monitoring and tracking application crashes occurring on different mobile devices |
Citations (13)
| Publication number | Priority date | Publication date | Assignee | Title |
|---|---|---|---|---|
| US5828883A (en) * | 1994-03-31 | 1998-10-27 | Lucent Technologies, Inc. | Call path refinement profiles |
| US6438512B1 (en) * | 1999-09-28 | 2002-08-20 | Convergys Cmg Utah, Inc. | System and method for performance monitoring of application code |
| US6643613B2 (en) * | 2001-07-03 | 2003-11-04 | Altaworks Corporation | System and method for monitoring performance metrics |
| US6823382B2 (en) * | 2001-08-20 | 2004-11-23 | Altaworks Corporation | Monitoring and control engine for multi-tiered service-level management of distributed web-application servers |
| US20050155019A1 (en) * | 2004-01-14 | 2005-07-14 | International Business Machines Corporation | Method and apparatus for maintaining performance monitoring structures in a page table for use in monitoring performance of a computer program |
| US20050155026A1 (en) * | 2004-01-14 | 2005-07-14 | International Business Machines Corporation | Method and apparatus for optimizing code execution using annotated trace information having performance indicator and counter information |
| US20060075386A1 (en) * | 2004-10-01 | 2006-04-06 | Microsoft Corporation | Method and system for a call stack capture |
| US20060130001A1 (en) * | 2004-11-30 | 2006-06-15 | International Business Machines Corporation | Apparatus and method for call stack profiling for a software application |
| US20070220495A1 (en) * | 2006-03-16 | 2007-09-20 | Chen Wen-Tzer T | Method and apparatus for profiling execution of code using multiple processors |
| US20070294673A1 (en) * | 2006-06-16 | 2007-12-20 | Microsoft Corporation | Automated method and system for collecting and reporting API performance profiles |
| US20080049640A1 (en) * | 2006-08-22 | 2008-02-28 | Heinz John M | System and method for provisioning resources of a packet network based on collected network performance information |
| US20080095049A1 (en) * | 2006-10-19 | 2008-04-24 | Embarq Holdings Company, Llc | System and method for establishing a communications session with an end-user based on the state of a network connection |
| US7389497B1 (en) * | 2000-07-06 | 2008-06-17 | International Business Machines Corporation | Method and system for tracing profiling information using per thread metric variables with reused kernel threads |
-
2006
- 2006-09-28 US US11/536,328 patent/US7913233B2/en active Active
Patent Citations (13)
| Publication number | Priority date | Publication date | Assignee | Title |
|---|---|---|---|---|
| US5828883A (en) * | 1994-03-31 | 1998-10-27 | Lucent Technologies, Inc. | Call path refinement profiles |
| US6438512B1 (en) * | 1999-09-28 | 2002-08-20 | Convergys Cmg Utah, Inc. | System and method for performance monitoring of application code |
| US7389497B1 (en) * | 2000-07-06 | 2008-06-17 | International Business Machines Corporation | Method and system for tracing profiling information using per thread metric variables with reused kernel threads |
| US6643613B2 (en) * | 2001-07-03 | 2003-11-04 | Altaworks Corporation | System and method for monitoring performance metrics |
| US6823382B2 (en) * | 2001-08-20 | 2004-11-23 | Altaworks Corporation | Monitoring and control engine for multi-tiered service-level management of distributed web-application servers |
| US20050155019A1 (en) * | 2004-01-14 | 2005-07-14 | International Business Machines Corporation | Method and apparatus for maintaining performance monitoring structures in a page table for use in monitoring performance of a computer program |
| US20050155026A1 (en) * | 2004-01-14 | 2005-07-14 | International Business Machines Corporation | Method and apparatus for optimizing code execution using annotated trace information having performance indicator and counter information |
| US20060075386A1 (en) * | 2004-10-01 | 2006-04-06 | Microsoft Corporation | Method and system for a call stack capture |
| US20060130001A1 (en) * | 2004-11-30 | 2006-06-15 | International Business Machines Corporation | Apparatus and method for call stack profiling for a software application |
| US20070220495A1 (en) * | 2006-03-16 | 2007-09-20 | Chen Wen-Tzer T | Method and apparatus for profiling execution of code using multiple processors |
| US20070294673A1 (en) * | 2006-06-16 | 2007-12-20 | Microsoft Corporation | Automated method and system for collecting and reporting API performance profiles |
| US20080049640A1 (en) * | 2006-08-22 | 2008-02-28 | Heinz John M | System and method for provisioning resources of a packet network based on collected network performance information |
| US20080095049A1 (en) * | 2006-10-19 | 2008-04-24 | Embarq Holdings Company, Llc | System and method for establishing a communications session with an end-user based on the state of a network connection |
Cited By (19)
| Publication number | Priority date | Publication date | Assignee | Title |
|---|---|---|---|---|
| US8566797B2 (en) * | 2008-02-27 | 2013-10-22 | Red Hat, Inc. | Heuristic backtracer |
| US20090217006A1 (en) * | 2008-02-27 | 2009-08-27 | Soren Sandmann Pedersen | Heuristic backtracer |
| US20110219265A1 (en) * | 2010-03-02 | 2011-09-08 | Fuji Xerox Co., Ltd. | Computer readable medium, verification support method and verification support apparatus |
| US8621436B2 (en) * | 2010-03-02 | 2013-12-31 | Fuji Xerox Co., Ltd. | Computer readable medium, verification support method and verification support apparatus |
| US20120166430A1 (en) * | 2010-12-28 | 2012-06-28 | Sevone, Inc. | Scalable Performance Management System |
| US9009185B2 (en) * | 2010-12-28 | 2015-04-14 | Sevone, Inc. | Scalable performance management system |
| US9720801B2 (en) * | 2012-09-25 | 2017-08-01 | Sk Planet Co., Ltd. | System and method for linking debugging message |
| US20150293832A1 (en) * | 2012-09-25 | 2015-10-15 | Sk Planet Co., Ltd. | System and method for linking debugging message |
| WO2015057617A1 (en) * | 2013-10-14 | 2015-04-23 | Nec Laboratories America, Inc. | Transparent performance inference of whole software layers and context-sensitive performance debugging |
| US10318283B2 (en) * | 2014-07-18 | 2019-06-11 | Ab Initio Technology Llc | Managing parameter sets |
| KR20170031749A (en) * | 2014-07-18 | 2017-03-21 | 아브 이니티오 테크놀로지 엘엘시 | Managing parameter sets |
| US20160019057A1 (en) * | 2014-07-18 | 2016-01-21 | Ab lnitio Technology LLC | Managing parameter sets |
| US20190243639A1 (en) * | 2014-07-18 | 2019-08-08 | Ab Initio Technology Llc | Managing parameter sets |
| AU2019236625B2 (en) * | 2014-07-18 | 2020-11-26 | Ab Initio Technology Llc | Managing parameter sets |
| KR102279859B1 (en) * | 2014-07-18 | 2021-07-20 | 아브 이니티오 테크놀로지 엘엘시 | Managing parameter sets |
| US11210086B2 (en) * | 2014-07-18 | 2021-12-28 | Ab Initio Technology Llc | Managing parameter sets |
| CN105183489A (en) * | 2015-10-10 | 2015-12-23 | 南京国电南自轨道交通工程有限公司 | Extjs frame based intelligent data analysis system and method |
| CN110618940A (en) * | 2019-09-19 | 2019-12-27 | 腾讯科技(深圳)有限公司 | Stack information tracking method and device, computer readable medium and computing device |
| CN112083976A (en) * | 2020-08-12 | 2020-12-15 | 北京字节跳动网络技术有限公司 | Information acquisition method, device, medium and equipment |
Also Published As
| Publication number | Publication date |
|---|---|
| US7913233B2 (en) | 2011-03-22 |
Similar Documents
| Publication | Publication Date | Title |
|---|---|---|
| US7913233B2 (en) | Performance analyzer | |
| CN110245078B (en) | Software pressure testing method and device, storage medium and server | |
| CN111522922B (en) | Log information query method and device, storage medium and computer equipment | |
| CN109284269B (en) | Abnormal log analysis method and device, storage medium and server | |
| US8516309B1 (en) | Method of debugging a software system | |
| US8776027B2 (en) | Extracting and collecting platform use data | |
| US9104796B2 (en) | Correlation of source code with system dump information | |
| US8489941B2 (en) | Automatic documentation of ticket execution | |
| US10592327B2 (en) | Apparatus, system, and method for analyzing logs | |
| US20200117587A1 (en) | Log File Analysis | |
| US10509719B2 (en) | Automatic regression identification | |
| CN109885496B (en) | Test log management method and system | |
| US10528456B2 (en) | Determining idle testing periods | |
| US10534700B2 (en) | Separating test verifications from test executions | |
| CN112148610A (en) | Test case execution method and device, computer equipment and storage medium | |
| US20210303380A1 (en) | Method for providing log information, electronic device, and computer program product | |
| CN110737639A (en) | Audit log method, device, computer equipment and storage medium | |
| US20200310952A1 (en) | Comparable user interface object identifications | |
| CN107357731A (en) | Process produces monitoring, analysis and the processing method of core dump problems | |
| US10915510B2 (en) | Method and apparatus of collecting and reporting database application incompatibilities | |
| CN111654495B (en) | Method, apparatus, device and storage medium for determining traffic generation source | |
| WO2015187001A2 (en) | System and method for managing resources failure using fast cause and effect analysis in a cloud computing system | |
| CN115186274A (en) | IAST-based security test method and device | |
| CN111221869A (en) | Method and device for tracking database transaction time and analyzing database lock | |
| CN112799939A (en) | Incremental code coverage rate testing method and device, storage medium and electronic equipment |
Legal Events
| Date | Code | Title | Description |
|---|---|---|---|
| AS | Assignment |
Owner name: BANK OF AMERICAN CORPORATION, NORTH CAROLINA Free format text: ASSIGNMENT OF ASSIGNORS INTEREST;ASSIGNOR:KUMAR, AMIT;REEL/FRAME:018334/0752 Effective date: 20060927 |
|
| AS | Assignment |
Owner name: BANK OF AMERICA CORPORATION, NORTH CAROLINA Free format text: CORRECTIVE ASSIGNMENT TO CORRECT THE ASSIGNEE NAME PREVIOUSLY RECORDED ON REEL 018334 FRAME 0752;ASSIGNOR:KUMAR, AMIT;REEL/FRAME:018340/0882 Effective date: 20060927 Owner name: BANK OF AMERICA CORPORATION, NORTH CAROLINA Free format text: CORRECTIVE ASSIGNMENT TO CORRECT THE ASSIGNEE NAME PREVIOUSLY RECORDED ON REEL 018334 FRAME 0752. ASSIGNOR(S) HEREBY CONFIRMS THE PATENT APPLICATION NUMBER 11/536,328 FILED SEPTEMBER 28, 2006 IS ASSIGNED TO BANK OF AMERICA CORPORATION;ASSIGNOR:KUMAR, AMIT;REEL/FRAME:018340/0882 Effective date: 20060927 |
|
| STCF | Information on status: patent grant |
Free format text: PATENTED CASE |
|
| FPAY | Fee payment |
Year of fee payment: 4 |
|
| MAFP | Maintenance fee payment |
Free format text: PAYMENT OF MAINTENANCE FEE, 8TH YEAR, LARGE ENTITY (ORIGINAL EVENT CODE: M1552); ENTITY STATUS OF PATENT OWNER: LARGE ENTITY Year of fee payment: 8 |
|
| MAFP | Maintenance fee payment |
Free format text: PAYMENT OF MAINTENANCE FEE, 12TH YEAR, LARGE ENTITY (ORIGINAL EVENT CODE: M1553); ENTITY STATUS OF PATENT OWNER: LARGE ENTITY Year of fee payment: 12 |