EP2944958A1 - A method of predicting phenotypic instability in a cell - Google Patents
A method of predicting phenotypic instability in a cell Download PDFInfo
- Publication number
- EP2944958A1 EP2944958A1 EP14163519.3A EP14163519A EP2944958A1 EP 2944958 A1 EP2944958 A1 EP 2944958A1 EP 14163519 A EP14163519 A EP 14163519A EP 2944958 A1 EP2944958 A1 EP 2944958A1
- Authority
- EP
- European Patent Office
- Prior art keywords
- cell
- environmental response
- fingerprint
- environmental
- response
- Prior art date
- Legal status (The legal status is an assumption and is not a legal conclusion. Google has not performed a legal analysis and makes no representation as to the accuracy of the status listed.)
- Ceased
Links
Images
Classifications
-
- G—PHYSICS
- G01—MEASURING; TESTING
- G01N—INVESTIGATING OR ANALYSING MATERIALS BY DETERMINING THEIR CHEMICAL OR PHYSICAL PROPERTIES
- G01N33/00—Investigating or analysing materials by specific methods not covered by groups G01N1/00 - G01N31/00
- G01N33/48—Biological material, e.g. blood, urine; Haemocytometers
- G01N33/50—Chemical analysis of biological material, e.g. blood, urine; Testing involving biospecific ligand binding methods; Immunological testing
- G01N33/5005—Chemical analysis of biological material, e.g. blood, urine; Testing involving biospecific ligand binding methods; Immunological testing involving human or animal cells
- G01N33/5008—Chemical analysis of biological material, e.g. blood, urine; Testing involving biospecific ligand binding methods; Immunological testing involving human or animal cells for testing or evaluating the effect of chemical or biological compounds, e.g. drugs, cosmetics
- G01N33/502—Chemical analysis of biological material, e.g. blood, urine; Testing involving biospecific ligand binding methods; Immunological testing involving human or animal cells for testing or evaluating the effect of chemical or biological compounds, e.g. drugs, cosmetics for testing non-proliferative effects
Definitions
- the invention relates to a method of predicting phenotypic instability in a cell, typically a mammalian producer cell.
- Changes in the cell line can be attributed to changes in gene copy number, mRNA copy number and underlying changes to the cell on the whole (i.e. changes to proteome and metabolome). Changes to a cell's genome implies a degree of phenotypic genetic instability, or a "mutator phenotype" (Loeb et al 1999). It is likely that any cell line clone which has become this phenotype will be subject to other linked changes in phenotype.
- the invention provides a method for predicting the phenotypic stability of a cell line comprising the steps of:
- the step of comparing the plurality of environmental response fingerprints to detect change in the environmental response fingerprint over the assay period comprises the step of detecting a change in the or each chemical cell stressor specific environmental response.
- the environmental response is a growth response.
- the plurality of different time points span one or more passages over the assay period.
- the environmental response fingerprint is generated at three or more time points during the assay period.
- the environmental response fingerprint is generated at four or more time points during the assay period.
- each environmental response fingerprint is generated by determining the environmental response of the cells in the presence of each of at least three different chemical cell stressors.
- each environmental response fingerprint is generated by determining the environmental response of the cells in the presence of each of at least five different chemical cell stressors.
- the chemical cell stressors are selected from amino acid transport inhibitors, cell cycle inhibitors, a source of carbon, a source of osmotic stress, a source of oxidative stress, an inducer of apoptosis, metabolic effectors, a pH modifier, an inhibitor of glycolysis, and a toxin.
- the cell line is a mammalian producer cell line.
- change in the environmental response fingerprint over the assay period is determined means of a mathematical model, suitably a mathematical model generated using one or more environmental response fingerprints of cells having known phenotypic stability or instability, or both.
- the mathematical model employs a means selected from Euclidian distance, mahalanobis distance, LDA distance, PCA distance.
- the invention also provides a system for identifying a cell, the system comprising:
- the environmental response fingerprint is a growth response fingerprint.
- the device is a microtitre plate.
- the comparison system comprises a computational model configured to input an environmental response fingerprints from a cell at a plurality of different time points over an assay period, compare the growth response fingerprints to detect change in the fingerprints, and output a content based in part on the change in the fingerprints.
- the term "cell” refers to any cell type, including prokaryotic or eukaryotic cells.
- the cell is a eukaryotic cell, ideally a mammalian cell.
- the cell is a producer cell, preferably a mammalian producer cell.
- the cell may be clonally-derived or non-clonal.
- the cell is a clone from a panel of clonal cells, derived from a single parental cell population or derived from different transfected cells.
- the cell may also be from a distinct cell line, for example a genetically modified cell (i.e. cells with "knock-out” or "knock-in” mutations.
- the cell line may also be derived by directed evolution, by selection of cells which have adapted to a specific environment of interest.
- panel of distinct cells should be understood to mean a panel of cells that are different from each other.
- the panel of cell may comprise a panel of clones that are all derived from a single parental cell population.
- the panel of cells may comprise cells of independent clonal origin, for example cells carrying different transgenes or different mutations, of the panel of cells may comprise non-clonal cells.
- the cell line may also be derived by directed evolution, by selection of cells which have adapted to a specific environment of interest.
- the panel of cells may also comprise cells of different cell type, for example different cell lines, different strains of bacteria or fungi, cells of the same cell type but at a different stage of development, and cells of the same cell type that differ genetically, for example cells of the same type or origin or cells derived from the same parental cell population that carry different transgenes.
- the term "panel of clonal cells” should be understood to mean a panel of clonal cell populations derived from a single cell line, and comprising from 2 to 500 or more clonal cell populations. Methods for generating panels of clonal cells are well known to a person skilled in the art, and described in Production of recombinant protein therapeutics in cultivated mammalian cells (2004) , Wurm, Florian M, New York, NY, Nature Biotechnology 22 (2004), S. 1393-1398 . Typically, the panel of clonal cell populations include from 10-500, 20-500, 30-500, 40-500, 50-500, 60-500, 70-500, 80-500, 90-500 or 100-500 clonal cell populations. Typically, the panel of clonal cell populations include from 100-500, 100-400, 150-400, 150-350 clonal cell populations.
- the invention involves incubating a cell with a plurality of cell stressor molecules. This means that the cell is incubated with each of the cell stressor molecules individually, to obtain a growth response of the cell in the presence of each cell stressor molecule. Incubation of the cell with the cell stressor molecule may be performed in any suitable reaction vessel, for example in the wells of a microtitre plate.
- the assay involves mixing a cell sample with a chemical cell stressor, and incubating the mixture from 1 to 4 days, and assaying the level of growth of the cells.
- the cell sample is provided at a concentration of from 0.1 to 1.0 x 10 6 cells per ml of mixture.
- the cell stressor is provided at a concentration of 0.5 to 2 x IC50, ideally about 1 x IC50.
- the growth of each clone is assayed after a period of incubation of less than 5 days.
- the growth of each clone is assayed after a period of incubation of between 1-4 days, and ideally after 2 and 3 days.
- the growth of each clone is assayed simultaneously.
- cell stressor molecule or “cell stressor” should be understood to mean a molecule or compound that causes a reduction in cell growth via one or more of multiple cellular pathways.
- the plurality of chemical cell stressors are selected from the group consisting of amino acid transport inhibitors, cell cycle inhibitors, a source of carbon, a source of osmotic stress, a source of oxidative stress, an inducer of apoptosis, metabolic effectors, a pH modifier, an inhibitor of glycolysis, and a toxin.
- the plurality of chemical cell stressors include stressors selected from at least 4, 5, 6 or 7 of the groups consisting of amino acid transport inhibitors, cell cycle inhibitors, a source of carbon, a source of osmotic stress, a source of oxidative stress, an inducer of apoptosis, metabolic effectors, a pH modifier, an inhibitor of glycolysis, and a toxin.
- the term "plurality” as applied to cell stressor molecules should be understood to mean at least three different cell stressor molecules. Typically, the term refers to at least 4, 5, 6, 7, 8, 9, 10, 11, 12, 13, 14, 15, 16, 17, 18, 19 or 20 different cell stressor molecules.
- the method of the invention may be performed by employing as few as three distinct cell stressor molecules to generate the cell-specific growth response fingerprint, for example: CoCl 2 , NAV and MSB; Cadm, MSB and 2DG; Cadm, dphe, MeiAB; dphe, MeIAB, Cadm; Dphe, Cadm, 2dg; Dphe, sodium lactate, 2dg; Dphe, NaOx, citric acid; MeIAB, Cad, 2dg.
- the term "environmental response" refers to a measurable response of the cell when exposed to a cell stressor molecule, for example growth response, production response (for example monoclonal antibody titre), or glycosylation response.
- the environmental response is a normalised environmental response, which is determined by measuring the environmental response of the cell in the presence and absence of the cell stressor molecule and determining the difference in environmental response due to the presence of the cell stressor molecule.
- growth response refers to the growth of the cell in the presence of a cell stressor molecule.
- the growth response is a normalised growth response, which is determined by measuring the growth of in the presence and absence of the cell stressor molecule and determining the difference in growth response due to the presence of the cell stressor molecule. Growth of cells may be determined using any technique known in the art.
- a dye is added to the incubation mixture and a signal emitted by the dye is monitored over time and correlated with growth.
- a fluorescent or phosphorescent dye may be employed.
- suitable dyes are redox dyes, such as Presto blue®. (Invitrogen, Paisley, UK).
- phenotypic instability should be understood to mean instability of one or more phenotypic characteristics of a cell, for example growth, productivity, and reombinant protein product characteristics.
- the term "environmental response fingerprint” refers to a plurality of environmental responses for a specific cell obtained by reacting the cell with a plurality of cell stressor molecules individually.
- the fingerprint may be embodied as a plurality of environmental response values, or may be embodied in the form of a graph or any other type of visual presentation such as a pattern. Change in fingerprint over time may be determined by monitoring environmental change in the or each chemical microenvironment.
- growth response fingerprint refers to a plurality of growth responses for a specific cell obtained by reacting the cell with a plurality of cell stressor molecules individually.
- the fingerprint may be embodied as a plurality of growth response values, or may be embodied in the form of a graph or any other type of visual presentation such as a pattern.
- assay period refers to a period of time during which the cells to be tested are cultured. Typically, the assay period spans at least 5, 6, 7, 8, 9,10, 11, 12, 13, 14, 15, 16, 17, 18, 19 or 20 passages of the cells.
- plurality of different time points refers to at least 2, 3, 4, 5, 6, 7, 8, 9, or 10 different time points. Generally each time point is separated by at least 1, 2 or 3 passages.
- One aspect of the invention involves comparing environmental response fingerprints (i.e. growth response fingerprint) for a cell over the course of an assay period to detect change in the environmental response fingerprint, which is then correlated with the stability or instability of the cell.
- the term "change" as applied to an environmental response fingerprint refers to at least one difference in environmental response fingerprint that occurs during the assay period.
- Various methods may be employed to detect changes in environmental response fingerprints over time including mathematical modelling, pattern recognition, or by visual inspection. For example, the environmental responses for a cell at time points A, B and C may be plotted against cell stressors to provide graphs representing the environmental response fingerprint for the cell at time points A, B and C. The environmental response fingerprints may be compared visually to identify changes in the fingerprint over time.
- the comparison step may be performed by mathematical modelling, typically using a mathematical model generated using environmental response fingerprints (or chemical specific environmental response) from cells have known phenotypic stability and/or instability, for example cell lines that have a predetermined stability and predetermined instability.
- the modelling approach may employ'Linear discriminant analysis' and 'nearest neighbour elucidian distance minimisation', using a subset of the chemical growth responses.
- the method involves the steps of inputting an environmental response fingerprint for a test cell line into a computational model, in which the computational model is generated from environmental response fingerprints obtained from a calibration set of cell lines with known phenotypic stability, wherein the computational model is configured to output the predicted stability for the cell line.
- the environmental response fingerprint may be one or more chemical-specific change in environmental responses ( ⁇ CE).
- the invention also provides a system or kit for identifying a cell.
- the system or kit typically comprises a device having a plurality of reaction chambers.
- the device is a microtitre plate, typically a microtitre plate having at least 12, 24, 48, or 96 wells.
- the system or kit typically comprises a plurality of cell stressor molecules.
- the cell stressor molecules are disposed individually within the wells of the microtitre plate, and are preferably adhered to the wells of the microtitre plate.
- the system or kit comprises a determination system for determining the environmental (i.e.growth) response of the cell in the presence of each of the plurality of chemical cell stressors.
- the determination system comprises a microtitre plate reader configured to detect growth of cells in the wells of the microtitre plate. Suitable microtitre plate readers are commercially available, and are sold by the company BMG.
- the determination system typically has computer executable instructions to provide e.g., growth response data in computer readable form.
- the system or kit also comprises a storage system and a comparison system (for comparing growth response fingerprint data for cells at different time points). These functional modules can be executed on one, or multiple, computers, or by using one, or multiple, computer networks.
- the determination system has computer executable instructions to provide e.g., sequence information in computer readable form.
- the information determined in the determination system can be read by the storage system.
- the "storage system” is intended to include any suitable computing or processing apparatus or other device configured or adapted for storing data or information. Examples of an electronic apparatus suitable for use with the present invention include a stand-alone computing apparatus, data telecommunications networks, including local area networks (LAN), wide area networks (WAN), Internet, Intranet, and Extranet, and local and distributed computer processing systems.
- Storage devices also include, but are not limited to: magnetic storage media, such as floppy discs, hard disc storage media, magnetic tape, optical storage media such as CD-ROM, DVD, electronic storage media such as RAM, ROM, EPROM, EEPROM and the like, general hard disks and hybrids of these categories such as magnetic/optical storage media.
- the storage system is adapted or configured for having recorded thereon growth response information and growth response fingerprint information.
- Such information may be provided in digital form that can be transmitted and read electronically, e.g., via the Internet, on diskette, via USB (universal serial bus) or via any other suitable mode of communication.
- the storage system may have reference environmental (i.e.growth) response fingerprint information stored thereon.
- reference environmental (i.e.growth) response fingerprint information stored thereon.
- stored refers to a process for encoding information on the storage device.
- the reference data stored in the storage device to be read by the comparison module is compared, e.g., comparison of a query cell-specific growth response fingerprint with a set or panel of reference growth response fingerprints.
- the “comparison system” can use a variety of available software programs and formats for the comparison operative to compare environmental response fingerprints from a cell at different time points over an assay period to detect change in the environmental (i.e. growth) response fingerprints.
- the comparison module is configured to use pattern recognition techniques to compare information from one or more entries to one or more reference data patterns.
- the comparison module may be configured using existing commercially-available or freely-available software for comparing patterns, and may be optimized for particular data comparisons that are conducted.
- the comparison module provides computer readable information related to the genotype of the sample.
- the comparison system employs a computational model for comparison purposes.
- the comparison module may include an operating system (e.g., UNIX) on which runs a relational database management system, a World Wide Web application, and a World Wide Web server.
- World Wide Web application includes the executable code necessary for generation of database language statements (e.g., Structured Query Language (SQL) statements).
- SQL Structured Query Language
- the executables will include embedded SQL statements.
- the World Wide Web application may include a configuration file which contains pointers and addresses to the various software entities that comprise the server as well as the various external and internal databases which must be accessed to service user requests.
- the Configuration file also directs requests for server resources to the appropriate hardware--as may be necessary should the server be distributed over two or more separate computers.
- the World Wide Web server supports a TCP/IP protocol.
- Local networks such as this are sometimes referred to as "Intranets.”
- An advantage of such Intranets is that they allow easy communication with public domain databases residing on the World Wide Web (e.g., the GenBank or Swiss Pro World Wide Web site).
- users can directly access data (via Hypertext links for example) residing on Internet databases using a HTML interface provided by Web browsers and Web servers.
- the comparison module typically provides a computer readable comparison result that can be processed in computer readable form by predefined criteria, or criteria defined by a user, to provide a content based in part on the comparison result that may be stored and output as requested by a user using a display system.
- the content based on the comparison result is displayed on a computer monitor. In one embodiment of the invention, the content based on the comparison result is displayed through printable media.
- the display module can be any suitable device configured to receive from a computer and display computer readable information to a user. Non-limiting examples include, for example, general-purpose computers such as those based on Intel PENTIUM-type processor, Motorola PowerPC, Sun UltraSPARC, Hewlett-Packard PA-RISC processors, any of a variety of processors available from Advanced Micro Devices (AMD) of Sunnyvale, California, or any other type of processor, visual display devices such as flat panel displays, cathode ray tubes and the like, as well as computer printers of various types.
- AMD Advanced Micro Devices
- a World Wide Web browser is used for providing a user interface for display of the content based on the comparison result.
- modules of the invention can be adapted to have a web browser interface.
- a user may construct requests for retrieving data from the comparison module.
- the user will typically point and click to user interface elements such as buttons, pull down menus, scroll bars and the like conventionally employed in graphical user interfaces.
- inhibitory dose 50 concentrations of the above chemicals were identified through growth studies.
- IC50 is defined as the concentration of the chemical, in question, which inhibits normal cell growth by 50% over a 3 day period.
- the first fingerprint taken is henceforth referred to as the "reference fingerprint”.
- the metrics of interest here are not the growth responses in the microenvironments but the change in growth responses relative to the reference fingerprint.
- ⁇ CE change in chemical specific growth response
- This model employed to predict stability is selected from a variety of models.
- One suitable example is a "linear discriminant model” (LDA) model where linear combinations of the ⁇ CEs are used to maximally separate the stable cell lines from unstable cell lines.
- LDA linear discriminant model
- the model is be a logistic regression model or isbased on simple Euclidian distance or distance in another "space” such as PCA or LDA space. Additionally techniques such as “support vector machines” could be employed.
- ⁇ CE fingerprints For the evaluation of a new cell line of interest, a reference fingerprint and a number of subsequent fingerprints are taken to generate the ⁇ CE fingerprints. These ⁇ CEs from subsequent fingerprints are used in a modeling approach to predict "stable or unstable” or alternatively some other continuous metric of stability such as "degree of instability". In one embodiment, aspects of stability are predicted as soon as the first passage after the "reference fingerprint”.
- a "calibration set" of cell lines is not required and stability is consistently predicted by looking for a change from the reference fingerprint over time, for example by simple distance from the reference fingerprint or any modeling, pattern recognition or “by eye” methods.
Abstract
A method for predicting the phenotypic stability of a cell line comprises the steps of culturing the cell line over an assay period, and generating an environmental response fingerprint for the cell line at a plurality of different time points over the assay period, wherein each environmental response fingerprint is generated by determining the environmental response of the cells in the presence of each of a plurality of chemical cell stressors. The plurality of environmental response fingerprints are compared to detect change in the environmental response fingerprint over the assay period. The level of change in the environmental response fingerprint over the assay period is indicative of the level of predicted phenotypic instability in the cell line. The environmental response may be growth response, productivity response, or another detectable environmental response.
Description
- The invention relates to a method of predicting phenotypic instability in a cell, typically a mammalian producer cell.
- From a regulatory point of view the main aspects of stability purely concern the product, namely consistent characteristics of the product (for example consistent glycoforms and more generally, in-vivo activity).
- However, from a manufacturing point of view, important aspects of stability are naturally product quality but also consistent growth and productivity of the producing cell line clone. For example, from Lonza™ guidelines, a change of over 30% in product titre over 40 doublings (roughly 10 passages) is deemed an unstable cell line.
- Changes in the cell line can be attributed to changes in gene copy number, mRNA copy number and underlying changes to the cell on the whole (i.e. changes to proteome and metabolome). Changes to a cell's genome implies a degree of phenotypic genetic instability, or a "mutator phenotype" (Loeb et al 1999). It is likely that any cell line clone which has become this phenotype will be subject to other linked changes in phenotype.
- It is an object of the invention to overcome at least one of the above-referenced problems.
- The invention provides a method for predicting the phenotypic stability of a cell line comprising the steps of:
- culturing the cell line over an assay period;
- generating an environmental response fingerprint for the cell line at a plurality of different time points over the assay period, wherein each environmental response fingerprint is generated by determining the environmental response of the cells in the presence of each of a plurality of chemical cell stressors; and
- comparing the plurality of environmental response fingerprints to detect change in the environmental response fingerprint over the assay period,
wherein the level of change in the environmental response fingerprint over the assay period is indicative of the level of predicted phenotypic instability in the cell line. - Typically, the step of comparing the plurality of environmental response fingerprints to detect change in the environmental response fingerprint over the assay period comprises the step of detecting a change in the or each chemical cell stressor specific environmental response.
- Suitably, the environmental response is a growth response.
- Preferably, the plurality of different time points span one or more passages over the assay period.
- Typically, the environmental response fingerprint is generated at three or more time points during the assay period.
- Suitably, the environmental response fingerprint is generated at four or more time points during the assay period.
- Generally, each environmental response fingerprint is generated by determining the environmental response of the cells in the presence of each of at least three different chemical cell stressors.
- Preferably, each environmental response fingerprint is generated by determining the environmental response of the cells in the presence of each of at least five different chemical cell stressors.
- Suitably, the chemical cell stressors are selected from amino acid transport inhibitors, cell cycle inhibitors, a source of carbon, a source of osmotic stress, a source of oxidative stress, an inducer of apoptosis, metabolic effectors, a pH modifier, an inhibitor of glycolysis, and a toxin.
- Generally, the cell line is a mammalian producer cell line.
- Typically, change in the environmental response fingerprint over the assay period is determined means of a mathematical model, suitably a mathematical model generated using one or more environmental response fingerprints of cells having known phenotypic stability or instability, or both. Typically, the mathematical model employs a means selected from Euclidian distance, mahalanobis distance, LDA distance, PCA distance.
- The invention also provides a system for identifying a cell, the system comprising:
- a device comprising a plurality of reaction chambers;
- a plurality of chemical cell stressors disposed individually within the reaction chambers;
- a determination system for determining an environmental response of the cell in the presence of each of the plurality of chemical cell stressors;
- a storage system for storing a plurality of environmental response fingerprints, each corresponding to the plurality of environmental responses of the cell;
- a comparison system configured to compare at least some of the plurality of environmental response fingerprint to detect change in the environmental response fingerprints; and
- a display system for displaying an output of the comparison step.
- Suitably, the environmental response fingerprint is a growth response fingerprint.
- Typically, the device is a microtitre plate.
- Suitably, the comparison system comprises a computational model configured to input an environmental response fingerprints from a cell at a plurality of different time points over an assay period, compare the growth response fingerprints to detect change in the fingerprints, and output a content based in part on the change in the fingerprints.
- In this specification, the term "cell" refers to any cell type, including prokaryotic or eukaryotic cells. Suitably, the cell is a eukaryotic cell, ideally a mammalian cell. Typically, the cell is a producer cell, preferably a mammalian producer cell. The cell may be clonally-derived or non-clonal. In a preferred embodiment, the cell is a clone from a panel of clonal cells, derived from a single parental cell population or derived from different transfected cells. The cell may also be from a distinct cell line, for example a genetically modified cell (i.e. cells with "knock-out" or "knock-in" mutations. The cell line may also be derived by directed evolution, by selection of cells which have adapted to a specific environment of interest. The term "panel of distinct cells" should be understood to mean a panel of cells that are different from each other. For example, the panel of cell may comprise a panel of clones that are all derived from a single parental cell population. Alternatively, the panel of cells may comprise cells of independent clonal origin, for example cells carrying different transgenes or different mutations, of the panel of cells may comprise non-clonal cells. The cell line may also be derived by directed evolution, by selection of cells which have adapted to a specific environment of interest. The panel of cells may also comprise cells of different cell type, for example different cell lines, different strains of bacteria or fungi, cells of the same cell type but at a different stage of development, and cells of the same cell type that differ genetically, for example cells of the same type or origin or cells derived from the same parental cell population that carry different transgenes.
- In this specification, the term "panel of clonal cells" should be understood to mean a panel of clonal cell populations derived from a single cell line, and comprising from 2 to 500 or more clonal cell populations. Methods for generating panels of clonal cells are well known to a person skilled in the art, and described in Production of recombinant protein therapeutics in cultivated mammalian cells (2004) ,Wurm, Florian M, New York, NY, Nature Biotechnology 22 (2004), S. 1393-1398. Typically, the panel of clonal cell populations include from 10-500, 20-500, 30-500, 40-500, 50-500, 60-500, 70-500, 80-500, 90-500 or 100-500 clonal cell populations. Typically, the panel of clonal cell populations include from 100-500, 100-400, 150-400, 150-350 clonal cell populations.
- The invention involves incubating a cell with a plurality of cell stressor molecules. This means that the cell is incubated with each of the cell stressor molecules individually, to obtain a growth response of the cell in the presence of each cell stressor molecule. Incubation of the cell with the cell stressor molecule may be performed in any suitable reaction vessel, for example in the wells of a microtitre plate. Typically, the assay involves mixing a cell sample with a chemical cell stressor, and incubating the mixture from 1 to 4 days, and assaying the level of growth of the cells. Suitably, the cell sample is provided at a concentration of from 0.1 to 1.0 x 10⁶ cells per ml of mixture. Typically, the cell stressor is provided at a concentration of 0.5 to 2 x IC50, ideally about 1 x IC50. Suitably, the growth of each clone is assayed after a period of incubation of less than 5 days. Ideally, the growth of each clone is assayed after a period of incubation of between 1-4 days, and ideally after 2 and 3 days. Preferably, the growth of each clone is assayed simultaneously.
- The term "cell stressor molecule" or "cell stressor" should be understood to mean a molecule or compound that causes a reduction in cell growth via one or more of multiple cellular pathways. Typically, the plurality of chemical cell stressors are selected from the group consisting of amino acid transport inhibitors, cell cycle inhibitors, a source of carbon, a source of osmotic stress, a source of oxidative stress, an inducer of apoptosis, metabolic effectors, a pH modifier, an inhibitor of glycolysis, and a toxin. Typically, the plurality of chemical cell stressors include stressors selected from at least 4, 5, 6 or 7 of the groups consisting of amino acid transport inhibitors, cell cycle inhibitors, a source of carbon, a source of osmotic stress, a source of oxidative stress, an inducer of apoptosis, metabolic effectors, a pH modifier, an inhibitor of glycolysis, and a toxin.
- In this specification, the term "plurality" as applied to cell stressor molecules should be understood to mean at least three different cell stressor molecules. Typically, the term refers to at least 4, 5, 6, 7, 8, 9, 10, 11, 12, 13, 14, 15, 16, 17, 18, 19 or 20 different cell stressor molecules. Thus, the method of the invention may be performed by employing as few as three distinct cell stressor molecules to generate the cell-specific growth response fingerprint, for example: CoCl2, NAV and MSB; Cadm, MSB and 2DG; Cadm, dphe, MeiAB; dphe, MeIAB, Cadm; Dphe, Cadm, 2dg; Dphe, sodium lactate, 2dg; Dphe, NaOx, citric acid; MeIAB, Cad, 2dg.
- The term "environmental response" refers to a measurable response of the cell when exposed to a cell stressor molecule, for example growth response, production response (for example monoclonal antibody titre), or glycosylation response. Typically, the environmental response is a normalised environmental response, which is determined by measuring the environmental response of the cell in the presence and absence of the cell stressor molecule and determining the difference in environmental response due to the presence of the cell stressor molecule.
- The term "growth response" refers to the growth of the cell in the presence of a cell stressor molecule. Typically, the growth response is a normalised growth response, which is determined by measuring the growth of in the presence and absence of the cell stressor molecule and determining the difference in growth response due to the presence of the cell stressor molecule. Growth of cells may be determined using any technique known in the art. In one embodiment, a dye is added to the incubation mixture and a signal emitted by the dye is monitored over time and correlated with growth. For example, a fluorescent or phosphorescent dye may be employed. Examples of suitable dyes are redox dyes, such as Presto blue®. (Invitrogen, Paisley, UK).
- The term "phenotypic instability" should be understood to mean instability of one or more phenotypic characteristics of a cell, for example growth, productivity, and reombinant protein product characteristics.
- The term "environmental response fingerprint" refers to a plurality of environmental responses for a specific cell obtained by reacting the cell with a plurality of cell stressor molecules individually. The fingerprint may be embodied as a plurality of environmental response values, or may be embodied in the form of a graph or any other type of visual presentation such as a pattern. Change in fingerprint over time may be determined by monitoring environmental change in the or each chemical microenvironment.
- The term "growth response fingerprint" refers to a plurality of growth responses for a specific cell obtained by reacting the cell with a plurality of cell stressor molecules individually. The fingerprint may be embodied as a plurality of growth response values, or may be embodied in the form of a graph or any other type of visual presentation such as a pattern.
- The term "assay period" refers to a period of time during which the cells to be tested are cultured. Typically, the assay period spans at least 5, 6, 7, 8, 9,10, 11, 12, 13, 14, 15, 16, 17, 18, 19 or 20 passages of the cells.
- The term "plurality of different time points" refers to at least 2, 3, 4, 5, 6, 7, 8, 9, or 10 different time points. Generally each time point is separated by at least 1, 2 or 3 passages.
- One aspect of the invention involves comparing environmental response fingerprints (i.e. growth response fingerprint) for a cell over the course of an assay period to detect change in the environmental response fingerprint, which is then correlated with the stability or instability of the cell. The term "change" as applied to an environmental response fingerprint refers to at least one difference in environmental response fingerprint that occurs during the assay period. Various methods may be employed to detect changes in environmental response fingerprints over time including mathematical modelling, pattern recognition, or by visual inspection. For example, the environmental responses for a cell at time points A, B and C may be plotted against cell stressors to provide graphs representing the environmental response fingerprint for the cell at time points A, B and C. The environmental response fingerprints may be compared visually to identify changes in the fingerprint over time. Generally, the greater the change in the fingerprint over the assay period, the more unstable the cell. For example, from Lonza™ guidelines, a change of over 30% in product titre over 40 doublings (roughly 10 passages) is deemed an unstable cell line. It is possible using the method of the invention to quantitatively determine the level of change in growth response fingerprint that correlates with an unstable cell line according to the Lonza definition, and thereby use the method of the invention to identify unstable cell lines. In a preferred embodiment, the comparison step may be performed by mathematical modelling, typically using a mathematical model generated using environmental response fingerprints (or chemical specific environmental response) from cells have known phenotypic stability and/or instability, for example cell lines that have a predetermined stability and predetermined instability. The modelling approach may employ'Linear discriminant analysis' and 'nearest neighbour elucidian distance minimisation', using a subset of the chemical growth responses. Thus, in one embodiment, the method involves the steps of inputting an environmental response fingerprint for a test cell line into a computational model, in which the computational model is generated from environmental response fingerprints obtained from a calibration set of cell lines with known phenotypic stability, wherein the computational model is configured to output the predicted stability for the cell line. The environmental response fingerprint may be one or more chemical-specific change in environmental responses (ΔCE).
- The invention also provides a system or kit for identifying a cell. The system or kit typically comprises a device having a plurality of reaction chambers. Preferably, the device is a microtitre plate, typically a microtitre plate having at least 12, 24, 48, or 96 wells.
- The system or kit typically comprises a plurality of cell stressor molecules. Preferably, the cell stressor molecules are disposed individually within the wells of the microtitre plate, and are preferably adhered to the wells of the microtitre plate.
- The system or kit comprises a determination system for determining the environmental (i.e.growth) response of the cell in the presence of each of the plurality of chemical cell stressors. Typically, the determination system comprises a microtitre plate reader configured to detect growth of cells in the wells of the microtitre plate. Suitable microtitre plate readers are commercially available, and are sold by the company BMG. The determination system typically has computer executable instructions to provide e.g., growth response data in computer readable form.
- The system or kit also comprises a storage system and a comparison system (for comparing growth response fingerprint data for cells at different time points). These functional modules can be executed on one, or multiple, computers, or by using one, or multiple, computer networks. The determination system has computer executable instructions to provide e.g., sequence information in computer readable form.
- The information determined in the determination system can be read by the storage system. As used herein the "storage system" is intended to include any suitable computing or processing apparatus or other device configured or adapted for storing data or information. Examples of an electronic apparatus suitable for use with the present invention include a stand-alone computing apparatus, data telecommunications networks, including local area networks (LAN), wide area networks (WAN), Internet, Intranet, and Extranet, and local and distributed computer processing systems. Storage devices also include, but are not limited to: magnetic storage media, such as floppy discs, hard disc storage media, magnetic tape, optical storage media such as CD-ROM, DVD, electronic storage media such as RAM, ROM, EPROM, EEPROM and the like, general hard disks and hybrids of these categories such as magnetic/optical storage media. The storage system is adapted or configured for having recorded thereon growth response information and growth response fingerprint information. Such information may be provided in digital form that can be transmitted and read electronically, e.g., via the Internet, on diskette, via USB (universal serial bus) or via any other suitable mode of communication.
- The storage system may have reference environmental (i.e.growth) response fingerprint information stored thereon. As used herein, "stored" refers to a process for encoding information on the storage device. In one embodiment the reference data stored in the storage device to be read by the comparison module is compared, e.g., comparison of a query cell-specific growth response fingerprint with a set or panel of reference growth response fingerprints.
- The "comparison system" can use a variety of available software programs and formats for the comparison operative to compare environmental response fingerprints from a cell at different time points over an assay period to detect change in the environmental (i.e. growth) response fingerprints. In one embodiment, the comparison module is configured to use pattern recognition techniques to compare information from one or more entries to one or more reference data patterns. The comparison module may be configured using existing commercially-available or freely-available software for comparing patterns, and may be optimized for particular data comparisons that are conducted. The comparison module provides computer readable information related to the genotype of the sample. Preferably, the comparison system employs a computational model for comparison purposes.
- The comparison module, or any other module of the invention, may include an operating system (e.g., UNIX) on which runs a relational database management system, a World Wide Web application, and a World Wide Web server. World Wide Web application includes the executable code necessary for generation of database language statements (e.g., Structured Query Language (SQL) statements). Generally, the executables will include embedded SQL statements. In addition, the World Wide Web application may include a configuration file which contains pointers and addresses to the various software entities that comprise the server as well as the various external and internal databases which must be accessed to service user requests. The Configuration file also directs requests for server resources to the appropriate hardware--as may be necessary should the server be distributed over two or more separate computers. In one embodiment, the World Wide Web server supports a TCP/IP protocol. Local networks such as this are sometimes referred to as "Intranets." An advantage of such Intranets is that they allow easy communication with public domain databases residing on the World Wide Web (e.g., the GenBank or Swiss Pro World Wide Web site). Thus, in a particular preferred embodiment of the present invention, users can directly access data (via Hypertext links for example) residing on Internet databases using a HTML interface provided by Web browsers and Web servers.
- The comparison module typically provides a computer readable comparison result that can be processed in computer readable form by predefined criteria, or criteria defined by a user, to provide a content based in part on the comparison result that may be stored and output as requested by a user using a display system.
- In one embodiment of the invention, the content based on the comparison result is displayed on a computer monitor. In one embodiment of the invention, the content based on the comparison result is displayed through printable media. The display module can be any suitable device configured to receive from a computer and display computer readable information to a user. Non-limiting examples include, for example, general-purpose computers such as those based on Intel PENTIUM-type processor, Motorola PowerPC, Sun UltraSPARC, Hewlett-Packard PA-RISC processors, any of a variety of processors available from Advanced Micro Devices (AMD) of Sunnyvale, California, or any other type of processor, visual display devices such as flat panel displays, cathode ray tubes and the like, as well as computer printers of various types.
- In one embodiment, a World Wide Web browser is used for providing a user interface for display of the content based on the comparison result. It should be understood that other modules of the invention can be adapted to have a web browser interface. Through the Web browser, a user may construct requests for retrieving data from the comparison module. Thus, the user will typically point and click to user interface elements such as buttons, pull down menus, scroll bars and the like conventionally employed in graphical user interfaces.
-
-
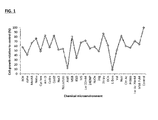
Figure 1 : An example of a chemical growth fingerprint from a clone. Cells were grown for 72 hours in the presence or absence of a chemical of interest in a 96 well plate. Relative levels of cell growth were assayed using the "Presto-Blue" method as described above. - Assaying cell growth in 96 well plates: "Presto Blue" (Invitrogen, Paisley, UK) was mixed 1:1 with CD-CHO media and 20 ul of this was added to each well. The plate was machine shaken and subsequently incubated for 30 minutes at 37C in a static humidified incubator. After incubation the fluorescence of the wells was measured (excitation 535nm emission 620 nm) using a fluoroskan ascent (Thermo-Fisher, Loughborough, UK) plate reader. It has been demonstrated prior that fluorescence is linearly correlated with viable cell density in the wells.
- Method: The plurality of cell stressor molecules employed were:
- 2-aminobicyclo-(2,2,1)heptane-carboxylic acid (BCH)
- D-phenylalanine -(D-Phe)
- α-(methylamino)isobutyric acid (MeAIB)
- Sodium Butyrate (NaBu)
- Cycloheximide
- Ammonium chloride
- Cadmium acetate hexhydrate
- Cobalt chloride (CoCl2)
- Sodium Chloride (NaCl)
- Sodium lactate (Na Lac)
- Aminotriazole (AMT)
- Menadione Sodium Bisulphite (MSB)
- Buthionine Sulfoximine (BSO)
- Mercaptosuccinic Acid (MS)
- 2,4,Dinitrophenol (24DNP)
- Sodium Oxamate
- 2-deoxyglucose (2dg)
- 3-bromopyruvate (3-BrPA)
- Dichloroacetate (DCA)
- 6-diazo-5-oxo-1-norleucine (1-don)
- Valproic acid (Val)
- Sodium Orthovandate (NaV)
- Citric acid
- FK866
- Lactic acid
- Using an 'in house' parental cell line, inhibitory dose 50 (IC50) concentrations of the above chemicals were identified through growth studies. Here IC50 is defined as the concentration of the chemical, in question, which inhibits normal cell growth by 50% over a 3 day period. Once IC50s were established, 96 well plates were set up containing the above selection of chemicals at the IC50 concentration and including control wells which contained only cell growth media.
- Starting with an early passage, before any instability has become apparent, fingerprints are taken over a number of passages. The first fingerprint taken is henceforth referred to as the "reference fingerprint". The metrics of interest here are not the growth responses in the microenvironments but the change in growth responses relative to the reference fingerprint.
- Thus for each fingerprint taken after the reference fingerprint, a "change in chemical specific growth response" (ΔCE) iscalculated for each microenvironment. It is likely that this is the most informative metric pertaining to stability. These ΔCEs for each micro-environment are used as the parameters in a predictive model to give a binary output of stable or unstable.
- This model employed to predict stability is selected from a variety of models. One suitable example is a "linear discriminant model" (LDA) model where linear combinations of the ΔCEs are used to maximally separate the stable cell lines from unstable cell lines. Alternatively, the model is be a logistic regression model or isbased on simple Euclidian distance or distance in another "space" such as PCA or LDA space. Additionally techniques such as "support vector machines" could be employed.
- For the evaluation of a new cell line of interest, a reference fingerprint and a number of subsequent fingerprints are taken to generate the ΔCE fingerprints. These ΔCEs from subsequent fingerprints are used in a modeling approach to predict "stable or unstable" or alternatively some other continuous metric of stability such as "degree of instability". In one embodiment, aspects of stability are predicted as soon as the first passage after the "reference fingerprint".
- In one embodiment a "calibration set" of cell lines is not required and stability is consistently predicted by looking for a change from the reference fingerprint over time, for example by simple distance from the reference fingerprint or any modeling, pattern recognition or "by eye" methods.
- The invention is not limited to the embodiment hereinbefore described which may be varied in construction and detail without departing from the spirit of the invention.
Claims (15)
- A method for predicting the phenotypic stability of a cell line comprising the steps of:- culturing the cell line over an assay period;- generating an environmental response fingerprint for the cell line at a plurality of different time points over the assay period, wherein each environmental response fingerprint is generated by determining the environmental response of the cells in the presence of each of a plurality of chemical cell stressors; and- comparing the plurality of environmental response fingerprints to detect change in the environmental response fingerprint over the assay period,
wherein the level of change in the environmental response fingerprint over the assay period is indicative of the level of predicted phenotypic instability in the cell line. - A method as claimed in Claim 1 wherein the step of comparing the plurality of environmental response fingerprints to detect change in the environmental response fingerprint over the assay period comprises the step of detecting a change in the or each chemical cell stressor specific environmental response.
- A method as claimed in Claim 1 or 2 in which the environmental response is a growth response.
- A method as claimed in Claim 1, 2 or 3 in which the plurality of different time points span one or more passage over the assay period.
- A method as claimed in any preceding Claim in which the environmental response fingerprint is generated at three or more time points during the assay period.
- A method as claimed in any preceding Claim in which the environmental response fingerprint is generated at four or more time points during the assay period.
- A method as claimed in any preceding Claim in which each environmental response fingerprint is generated by determining the environmental response of the cells in the presence of each of at least three different chemical cell stressors.
- A method as claimed in any preceding Claim in which each environmental response fingerprint is generated by determining the environmental response of the cells in the presence of each of at least five different chemical cell stressors.
- A method as claimed in any preceding Claim in which the chemical cell stressors are selected from amino acid transport inhibitors, cell cycle inhibitors, a source of carbon, a source of osmotic stress, a source of oxidative stress, an inducer of apoptosis, metabolic effectors, a pH modifier, an inhibitor of glycolysis, and a toxin.
- A method as claimed in any preceding Claim in which the cell line is a mammalian producer cell line.
- A method as claimed in any preceding Claim in which change in the environmental response fingerprint over the assay period is determined
by means selected from Euclidian distance, mahalanobis distance, LDA distance, PCA distance. - A system for identifying a cell, the system comprising:- a device comprising a plurality of reaction chambers;- a plurality of chemical cell stressors disposed individually within the reaction chambers;- a determination system for determining an environmental response of the cell in the presence of each of the plurality of chemical cell stressors;- a storage system for storing a plurality of environmental response fingerprints, each corresponding to the plurality of environmental responses of the cell;- a comparison system configured to compare at least some of the plurality of environmental response fingerprint to detect change in the environmental response fingerprints; and- a display system for displaying an output of the comparison step.
- A system as claimed in Claim 11 in which the environmental response fingerprint is a growth response fingerprint.
- A system as claimed in Claim 12 or 13 in which the device is a microtitre plate.
- A system as claimed in any of Claims 12 to 14 in which the comparison system comprises a computational model configured to input an environmental response fingerprints from a cell at a plurality of different time points over an assay period, compare the growth response fingerprints to detect change in the fingerprints, and output a content based in part on the change in the fingerprints.
Priority Applications (6)
| Application Number | Priority Date | Filing Date | Title |
|---|---|---|---|
| EP14163519.3A EP2944958A1 (en) | 2014-04-04 | 2014-04-04 | A method of predicting phenotypic instability in a cell |
| US15/301,319 US10591463B2 (en) | 2014-04-04 | 2015-04-02 | Method of predicting phenotypic instability in a cell |
| JP2017503067A JP6581178B2 (en) | 2014-04-04 | 2015-04-02 | Methods for predicting phenotypic instability in cells |
| EP15718799.8A EP3126833B1 (en) | 2014-04-04 | 2015-04-02 | A method of predicting phenotypic instability in a cell |
| CN201580027265.3A CN106662574B (en) | 2014-04-04 | 2015-04-02 | A kind of instable method of prediction cell phenotype |
| PCT/EP2015/057392 WO2015150551A1 (en) | 2014-04-04 | 2015-04-02 | A method of predicting phenotypic instability in a cell |
Applications Claiming Priority (1)
| Application Number | Priority Date | Filing Date | Title |
|---|---|---|---|
| EP14163519.3A EP2944958A1 (en) | 2014-04-04 | 2014-04-04 | A method of predicting phenotypic instability in a cell |
Publications (1)
| Publication Number | Publication Date |
|---|---|
| EP2944958A1 true EP2944958A1 (en) | 2015-11-18 |
Family
ID=50434087
Family Applications (2)
| Application Number | Title | Priority Date | Filing Date |
|---|---|---|---|
| EP14163519.3A Ceased EP2944958A1 (en) | 2014-04-04 | 2014-04-04 | A method of predicting phenotypic instability in a cell |
| EP15718799.8A Active EP3126833B1 (en) | 2014-04-04 | 2015-04-02 | A method of predicting phenotypic instability in a cell |
Family Applications After (1)
| Application Number | Title | Priority Date | Filing Date |
|---|---|---|---|
| EP15718799.8A Active EP3126833B1 (en) | 2014-04-04 | 2015-04-02 | A method of predicting phenotypic instability in a cell |
Country Status (5)
| Country | Link |
|---|---|
| US (1) | US10591463B2 (en) |
| EP (2) | EP2944958A1 (en) |
| JP (1) | JP6581178B2 (en) |
| CN (1) | CN106662574B (en) |
| WO (1) | WO2015150551A1 (en) |
Families Citing this family (3)
| Publication number | Priority date | Publication date | Assignee | Title |
|---|---|---|---|---|
| EP2944958A1 (en) | 2014-04-04 | 2015-11-18 | Techno-Path (Distribution) | A method of predicting phenotypic instability in a cell |
| EP3075844A1 (en) | 2015-04-01 | 2016-10-05 | Valitacell Limited | A method of determining a compositional or functional characteristic of a cell culture media |
| CN108388768A (en) * | 2018-02-08 | 2018-08-10 | 南京恺尔生物科技有限公司 | Utilize the biological nature prediction technique for the neural network model that biological knowledge is built |
Citations (5)
| Publication number | Priority date | Publication date | Assignee | Title |
|---|---|---|---|---|
| WO2001081895A2 (en) * | 2000-04-26 | 2001-11-01 | Cytokinetics, Inc. | Method and apparatus for predictive cellular bioinformatics |
| WO2002037102A2 (en) * | 2000-10-20 | 2002-05-10 | Children's Medical Center Corporation | Methods for analyzing dynamic changes in cellular informatics |
| US20030235813A1 (en) * | 1999-10-06 | 2003-12-25 | Frank Luyten | In vivo assay and molecular markers for testing the phenotypic stability of cell populations, and selecting cell populations for autologous transplantation |
| WO2006135992A1 (en) * | 2005-06-24 | 2006-12-28 | Eppendorf Array Technologies S.A. | Method and means for detecting and/or quantifying hierarchical molecular change of a cell in response to an external stimulus |
| US20100330036A1 (en) * | 2007-10-18 | 2010-12-30 | Universiteit Gent | Markers of matrix gene expression and cellular differentiation in chondrocytes |
Family Cites Families (38)
| Publication number | Priority date | Publication date | Assignee | Title |
|---|---|---|---|---|
| US5328985A (en) | 1991-07-12 | 1994-07-12 | The Regents Of The University Of California | Recombinant streptavidin-protein chimeras useful for conjugation of molecules in the immune system |
| US5660991A (en) | 1994-10-28 | 1997-08-26 | Lakowicz; Joseph R. | Long lifetime anisotropy (polarization) probes for clinical chemistry, immunoassays, affinity assays and biomedical research |
| EP0805872A1 (en) * | 1995-01-23 | 1997-11-12 | Microcide Pharmaceuticals, Inc. | Screening for modulators of biomolecules |
| US5962249A (en) | 1995-12-22 | 1999-10-05 | Microcide Pharmaceuticals, Inc. | Sized-based marker identification technology |
| DE19614982C1 (en) | 1996-04-16 | 1997-10-16 | Hatz Motoren | High pressure line connection |
| WO1997039326A2 (en) | 1996-04-18 | 1997-10-23 | Ariad Pharmaceuticals, Inc. | In vitro fluorescence polarization assay |
| CA2270233A1 (en) | 1997-09-05 | 1999-03-18 | Matsushita Electric Industrial Co., Ltd. | Fluorescence polarization method |
| US7741533B2 (en) | 2000-11-07 | 2010-06-22 | Pioneer Hi-Bred International, Inc. | Grain quality through altered expression of seed proteins |
| FR2847268B1 (en) * | 2002-11-19 | 2006-09-29 | Coletica | METHOD FOR IDENTIFYING AN EVENTUALLY MODIFICATION OF AT LEAST ONE BIOLOGICAL PARAMETER USING LIVING CELLS SUBJECT TO STRESS AND LIVING CELLS NOT SUBJECT TO THIS SAME STRESS |
| WO2005047902A1 (en) | 2003-11-03 | 2005-05-26 | Beckman Coulter, Inc. | Solution-based methods for detecting mhc-binding peptides |
| US20060105397A1 (en) | 2003-11-05 | 2006-05-18 | Cullum Malford E | Method for the detection of stress biomarkers including cortisol by fluorescence polarization |
| EP1716243B1 (en) | 2004-02-04 | 2014-11-05 | Merck Sharp & Dohme Corp. | Process for large scale production of plasmid dna by e coli fermentation |
| US7427473B2 (en) | 2004-02-25 | 2008-09-23 | Avalon Pharmaceuticals, Inc. | Chemo-centric selection of disease-related genetic profiles |
| JP2005337805A (en) | 2004-05-25 | 2005-12-08 | Olympus Corp | Antibody or antigen measuring method |
| JP4392502B2 (en) | 2005-06-10 | 2010-01-06 | 国立大学法人 岡山大学 | Fluorescent amino acid derivatives |
| WO2008042003A2 (en) | 2006-01-12 | 2008-04-10 | Biosense Technologies, Inc. | Method and composition for rapid viability testing of cells |
| CN101395472A (en) * | 2006-01-17 | 2009-03-25 | 协乐民公司 | Method for predicting biological systems responses |
| US9034655B2 (en) | 2006-06-19 | 2015-05-19 | Seta Biomedicals, Llc | Highly water-soluble, cationic luminescent labels |
| CN101484572A (en) | 2006-07-14 | 2009-07-15 | Abb研究有限公司 | A method for on-line optimization of a fed-batch fermentation unit to maximize the product yield |
| US8823234B2 (en) | 2006-10-13 | 2014-09-02 | Black & Decker Inc. | Motor with permanent magnets having essentially the same inner and outer radius; and method of manufacturing a motor stator housing with permanent magnets |
| US8571690B2 (en) | 2006-10-31 | 2013-10-29 | Rockwell Automation Technologies, Inc. | Nonlinear model predictive control of a biofuel fermentation process |
| CN101186880A (en) | 2007-11-29 | 2008-05-28 | 上海交通大学 | Feeding optimizing method for heterotrophically culturing chlorella |
| WO2009078876A1 (en) | 2007-12-18 | 2009-06-25 | Bellbrook Labs, Llc | Assay method for group transfer reactions |
| US20090287320A1 (en) | 2008-05-13 | 2009-11-19 | Macgregor John | System and Method for the Model Predictive Control of Batch Processes using Latent Variable Dynamic Models |
| MX2010013729A (en) | 2008-06-13 | 2011-01-14 | Centocor Ortho Biotech Inc | Methods for improving viability and productivity in cell culture. |
| CA2682439A1 (en) * | 2008-10-17 | 2010-04-17 | F. Hoffmann-La Roche Ag | Cell monitoring and molecular analysis |
| WO2010129294A2 (en) * | 2009-04-27 | 2010-11-11 | Schulz Thomas C | Small molecules supporting pluripotent cell growth and methods thereof |
| AU2010248784A1 (en) * | 2009-05-15 | 2011-12-01 | Sru Biosystems, Inc | Detection of changes in cell populations and mixed cell populations |
| CN201569914U (en) | 2009-12-21 | 2010-09-01 | 山东省科学院生物研究所 | Fermentation fed-batch optimizing control system |
| CN102220239A (en) | 2011-03-24 | 2011-10-19 | 苏州百器智能装备系统有限公司 | Fed-batch control system based on growth predictive model |
| GB201205607D0 (en) | 2012-03-29 | 2012-05-16 | Ltd Technopath Distrib | A fluorescence microtitre plate reader |
| US20140199728A1 (en) | 2013-01-14 | 2014-07-17 | Amgen Inc. | Methods of using cell-cycle inhibitors to modulate one or more properties of a cell culture |
| EP3014268B1 (en) | 2013-06-26 | 2020-08-05 | Valitacell Limited | A method of determining or predicting a characteristic of a cell |
| US20170017891A1 (en) | 2014-01-30 | 2017-01-19 | Valitacell Limited | A method of predicting relative fed batch production titer of a panel of clonally-derived producer cells |
| EP2944958A1 (en) | 2014-04-04 | 2015-11-18 | Techno-Path (Distribution) | A method of predicting phenotypic instability in a cell |
| CN106662581B (en) | 2014-07-15 | 2019-04-09 | 瓦里泰细胞有限公司 | A kind of method of antibody concentration in measurement sample |
| EP3075844A1 (en) | 2015-04-01 | 2016-10-05 | Valitacell Limited | A method of determining a compositional or functional characteristic of a cell culture media |
| US20190011437A1 (en) | 2015-12-18 | 2019-01-10 | Valitacell Limited | A method of determining the abundance of a target molecule in a sample |
-
2014
- 2014-04-04 EP EP14163519.3A patent/EP2944958A1/en not_active Ceased
-
2015
- 2015-04-02 JP JP2017503067A patent/JP6581178B2/en active Active
- 2015-04-02 US US15/301,319 patent/US10591463B2/en active Active
- 2015-04-02 EP EP15718799.8A patent/EP3126833B1/en active Active
- 2015-04-02 CN CN201580027265.3A patent/CN106662574B/en active Active
- 2015-04-02 WO PCT/EP2015/057392 patent/WO2015150551A1/en active Application Filing
Patent Citations (5)
| Publication number | Priority date | Publication date | Assignee | Title |
|---|---|---|---|---|
| US20030235813A1 (en) * | 1999-10-06 | 2003-12-25 | Frank Luyten | In vivo assay and molecular markers for testing the phenotypic stability of cell populations, and selecting cell populations for autologous transplantation |
| WO2001081895A2 (en) * | 2000-04-26 | 2001-11-01 | Cytokinetics, Inc. | Method and apparatus for predictive cellular bioinformatics |
| WO2002037102A2 (en) * | 2000-10-20 | 2002-05-10 | Children's Medical Center Corporation | Methods for analyzing dynamic changes in cellular informatics |
| WO2006135992A1 (en) * | 2005-06-24 | 2006-12-28 | Eppendorf Array Technologies S.A. | Method and means for detecting and/or quantifying hierarchical molecular change of a cell in response to an external stimulus |
| US20100330036A1 (en) * | 2007-10-18 | 2010-12-30 | Universiteit Gent | Markers of matrix gene expression and cellular differentiation in chondrocytes |
Non-Patent Citations (7)
| Title |
|---|
| "Production of recombinant protein therapeutics in cultivated mammalian cells", 2004 |
| CHRISTOPHE CUDRÉ-MAUROUX ET AL: "Lentivector-Mediated Transfer of Bmi-1 and Telomerase in Muscle Satellite Cells Yields a Duchenne Myoblast Cell Line with Long-Term Genotypic and Phenotypic Stability", HUMAN GENE THERAPY, vol. 14, no. 16, 2003, pages 1525 - 1533, XP055142786 * |
| DATABASE MEDLINE [online] US NATIONAL LIBRARY OF MEDICINE (NLM), BETHESDA, MD, US; 1993, GIGNAC S M ET AL: "Multiparameter approach in the identification of cross-contaminated leukemia cell lines.", XP002730560, Database accession no. NLM8220135 * |
| LEUKEMIA & LYMPHOMA, vol. 10, no. 4-5, 1993, pages 359 - 368 * |
| N. NAKATSU ET AL: "Evaluation of Action Mechanisms of Toxic Chemicals Using JFCR39, a Panel of Human Cancer Cell Lines", MOLECULAR PHARMACOLOGY, vol. 72, no. 5, 2007, pages 1171 - 1180, XP055101018 * |
| NATURE BIOTECHNOLOGY, vol. 22, 2004, pages 1393 - 1398 |
| SCHWARTZ R ET AL: "Heterogeneity of glycoprotein synthesis in human tumor cell lines", EUROPEAN JOURNAL OF CANCER AND CLINICAL ONCOLOGY, vol. 22, no. 3, 1986, pages 273 - 281, XP026200832 * |
Also Published As
| Publication number | Publication date |
|---|---|
| JP6581178B2 (en) | 2019-09-25 |
| CN106662574B (en) | 2018-07-17 |
| EP3126833A1 (en) | 2017-02-08 |
| WO2015150551A1 (en) | 2015-10-08 |
| JP2017512501A (en) | 2017-05-25 |
| CN106662574A (en) | 2017-05-10 |
| US20170030894A1 (en) | 2017-02-02 |
| US10591463B2 (en) | 2020-03-17 |
| EP3126833B1 (en) | 2018-06-13 |
Similar Documents
| Publication | Publication Date | Title |
|---|---|---|
| Mittell et al. | Are molecular markers useful predictors of adaptive potential? | |
| Warringer et al. | Automated screening in environmental arrays allows analysis of quantitative phenotypic profiles in Saccharomyces cerevisiae | |
| Kruuk et al. | When environmental variation short-circuits natural selection | |
| EP3014268B1 (en) | A method of determining or predicting a characteristic of a cell | |
| EP3126833B1 (en) | A method of predicting phenotypic instability in a cell | |
| Fowler‐Finn et al. | The causes of variation in the presence of genetic covariance between sexual traits and preferences | |
| EP3277798B1 (en) | A method of determining a compositional or functional characteristic of a cell culture media | |
| EP3099807B1 (en) | A method of predicting relative fed batch production titer of a panel of clonally-derived producer cells | |
| Van der Werf et al. | Genomic selection in sheep breeding programs | |
| Wang et al. | Genetic nurture effects on education: a systematic review and meta-analysis | |
| Kilfoil et al. | Characterization of a high throughput human stem cell cardiomyocyte assay to predict drug-induced changes in clinical electrocardiogram parameters | |
| Shokhirev et al. | FlowMax: A computational tool for maximum likelihood deconvolution of CFSE time courses | |
| Rubio-Ponce et al. | Combined statistical modeling enables accurate mining of circadian transcription | |
| Song et al. | Optimization and validation of patient‐based real‐time quality control procedure using moving average and average of normals with multi‐rules for TT3, TT4, FT3, FT3, and TSH on three analyzers | |
| Zarecki et al. | Maximal sum of metabolic exchange fluxes outperforms biomass yield as a predictor of growth rate of microorganisms | |
| Széliová et al. | Error propagation in constraint‐based modeling of Chinese hamster ovary cells | |
| JP7153131B2 (en) | Method for verifying performance of culture device | |
| Kedzierski et al. | Precision medicine: The future of diagnostic approach to pulmonary hypertension? | |
| Simensen et al. | Quantification of macromolecular biomass composition for constraint-based metabolic modeling | |
| Blöbaum et al. | Quantifying microbial robustness in dynamic environments using microfluidic single-cell cultivation | |
| Kustatscher et al. | The human proteome co-regulation map reveals functional relationships between proteins | |
| Ren et al. | Reference Materials for Improving Reliability of Multiomics Profiling | |
| Koellensperger et al. | Error propagation in constraint-based modeling of Chinese hamster ovary cells | |
| Crowell | Computational Techniques for Proteome and Genome Wide Circadian Studies | |
| Tak Ka | Uncertainty Component Evaluation in Conventional Microbiological Qualitative Measurements |
Legal Events
| Date | Code | Title | Description |
|---|---|---|---|
| PUAI | Public reference made under article 153(3) epc to a published international application that has entered the european phase |
Free format text: ORIGINAL CODE: 0009012 |
|
| AK | Designated contracting states |
Kind code of ref document: A1 Designated state(s): AL AT BE BG CH CY CZ DE DK EE ES FI FR GB GR HR HU IE IS IT LI LT LU LV MC MK MT NL NO PL PT RO RS SE SI SK SM TR |
|
| AX | Request for extension of the european patent |
Extension state: BA ME |
|
| STAA | Information on the status of an ep patent application or granted ep patent |
Free format text: STATUS: THE APPLICATION HAS BEEN REFUSED |
|
| 18R | Application refused |
Effective date: 20151205 |