EP2851823A1 - Data management unit for supporting health control - Google Patents
Data management unit for supporting health control Download PDFInfo
- Publication number
- EP2851823A1 EP2851823A1 EP13185396.2A EP13185396A EP2851823A1 EP 2851823 A1 EP2851823 A1 EP 2851823A1 EP 13185396 A EP13185396 A EP 13185396A EP 2851823 A1 EP2851823 A1 EP 2851823A1
- Authority
- EP
- European Patent Office
- Prior art keywords
- trend
- measurement values
- time interval
- mean value
- group
- Prior art date
- Legal status (The legal status is an assumption and is not a legal conclusion. Google has not performed a legal analysis and makes no representation as to the accuracy of the status listed.)
- Ceased
Links
Images


Classifications
-
- G—PHYSICS
- G01—MEASURING; TESTING
- G01N—INVESTIGATING OR ANALYSING MATERIALS BY DETERMINING THEIR CHEMICAL OR PHYSICAL PROPERTIES
- G01N33/00—Investigating or analysing materials by specific methods not covered by groups G01N1/00 - G01N31/00
- G01N33/48—Biological material, e.g. blood, urine; Haemocytometers
- G01N33/483—Physical analysis of biological material
- G01N33/487—Physical analysis of biological material of liquid biological material
- G01N33/48785—Electrical and electronic details of measuring devices for physical analysis of liquid biological material not specific to a particular test method, e.g. user interface or power supply
- G01N33/48792—Data management, e.g. communication with processing unit
-
- G—PHYSICS
- G01—MEASURING; TESTING
- G01N—INVESTIGATING OR ANALYSING MATERIALS BY DETERMINING THEIR CHEMICAL OR PHYSICAL PROPERTIES
- G01N27/00—Investigating or analysing materials by the use of electric, electrochemical, or magnetic means
- G01N27/26—Investigating or analysing materials by the use of electric, electrochemical, or magnetic means by investigating electrochemical variables; by using electrolysis or electrophoresis
- G01N27/416—Systems
- G01N27/4166—Systems measuring a particular property of an electrolyte
-
- G—PHYSICS
- G16—INFORMATION AND COMMUNICATION TECHNOLOGY [ICT] SPECIALLY ADAPTED FOR SPECIFIC APPLICATION FIELDS
- G16H—HEALTHCARE INFORMATICS, i.e. INFORMATION AND COMMUNICATION TECHNOLOGY [ICT] SPECIALLY ADAPTED FOR THE HANDLING OR PROCESSING OF MEDICAL OR HEALTHCARE DATA
- G16H40/00—ICT specially adapted for the management or administration of healthcare resources or facilities; ICT specially adapted for the management or operation of medical equipment or devices
- G16H40/60—ICT specially adapted for the management or administration of healthcare resources or facilities; ICT specially adapted for the management or operation of medical equipment or devices for the operation of medical equipment or devices
- G16H40/63—ICT specially adapted for the management or administration of healthcare resources or facilities; ICT specially adapted for the management or operation of medical equipment or devices for the operation of medical equipment or devices for local operation
-
- G—PHYSICS
- G16—INFORMATION AND COMMUNICATION TECHNOLOGY [ICT] SPECIALLY ADAPTED FOR SPECIFIC APPLICATION FIELDS
- G16H—HEALTHCARE INFORMATICS, i.e. INFORMATION AND COMMUNICATION TECHNOLOGY [ICT] SPECIALLY ADAPTED FOR THE HANDLING OR PROCESSING OF MEDICAL OR HEALTHCARE DATA
- G16H50/00—ICT specially adapted for medical diagnosis, medical simulation or medical data mining; ICT specially adapted for detecting, monitoring or modelling epidemics or pandemics
- G16H50/20—ICT specially adapted for medical diagnosis, medical simulation or medical data mining; ICT specially adapted for detecting, monitoring or modelling epidemics or pandemics for computer-aided diagnosis, e.g. based on medical expert systems
-
- G—PHYSICS
- G16—INFORMATION AND COMMUNICATION TECHNOLOGY [ICT] SPECIALLY ADAPTED FOR SPECIFIC APPLICATION FIELDS
- G16H—HEALTHCARE INFORMATICS, i.e. INFORMATION AND COMMUNICATION TECHNOLOGY [ICT] SPECIALLY ADAPTED FOR THE HANDLING OR PROCESSING OF MEDICAL OR HEALTHCARE DATA
- G16H50/00—ICT specially adapted for medical diagnosis, medical simulation or medical data mining; ICT specially adapted for detecting, monitoring or modelling epidemics or pandemics
- G16H50/50—ICT specially adapted for medical diagnosis, medical simulation or medical data mining; ICT specially adapted for detecting, monitoring or modelling epidemics or pandemics for simulation or modelling of medical disorders
-
- G—PHYSICS
- G16—INFORMATION AND COMMUNICATION TECHNOLOGY [ICT] SPECIALLY ADAPTED FOR SPECIFIC APPLICATION FIELDS
- G16H—HEALTHCARE INFORMATICS, i.e. INFORMATION AND COMMUNICATION TECHNOLOGY [ICT] SPECIALLY ADAPTED FOR THE HANDLING OR PROCESSING OF MEDICAL OR HEALTHCARE DATA
- G16H20/00—ICT specially adapted for therapies or health-improving plans, e.g. for handling prescriptions, for steering therapy or for monitoring patient compliance
- G16H20/10—ICT specially adapted for therapies or health-improving plans, e.g. for handling prescriptions, for steering therapy or for monitoring patient compliance relating to drugs or medications, e.g. for ensuring correct administration to patients
Definitions
- the present invention relates to a data management unit for supporting health control, a method and a computer program for indicating a trend within a plurality of measurement values of a physiological parameter, a respective computer program product, and a medical device for supporting health control.
- the following description of the invention mainly refers to diabetes as a health problem and the blood glucose level as the physiological parameter to be controlled in order to assess the effectiveness of the prescribed treatment.
- the invention may also be used with regard to other health problems and for management of other physiological parameter data like (a) blood pressure in hypertensive heart disease, (b) cholesterol or lipoprotein profile in patients with risk factors for heart disease and stroke, (c) peak flow in asthmatic patients, or (d) coagulation in patients treated for hemophilia.
- Diabetes mellitus is a group of metabolic diseases in which a person has high blood sugar, either because the pancreas does not produce enough insulin, or because cells do not respond to the insulin that is produced.
- the treatment of diabetes concentrates on keeping blood sugar levels as close to normal (“euglycemia") as possible, without causing hypoglycemia. This can usually be accomplished with diet, exercise, and use of appropriate medications (insulin in the case of type 1 diabetes; oral medications, as well as possibly insulin, in type 2 diabetes).
- Essential elements of the management of diabetes with insulin are periodic checks of the glucose concentration in the blood performed by the patients themselves, in order to obtain regular information on the progress and success of the prescribed treatment. This understanding, and patient participation is vital, since the complications of diabetes are far less common and less severe in people who have well-managed blood sugar levels. With regard to this it has to be considered that the blood glucose level fluctuates throughout the day and is directly influenced by the amount of insulin administered, as well as lifestyle factors such as the amount and kind of food that is consumed, the exercise level and stress.
- the monitoring of the sugar level in the blood serves a dual purpose: on the one hand it provides the patient with information about the current status of glycemic control. On the other hand can the measured values serve as information for the patient or a healthcare professional (HCP) to determine whether an adjustment in the medication, namely the amount of insulin to be taken, is indicated.
- HCP healthcare professional
- BGM blood glucose measurement
- FBG fasting blood glucose measurement value
- a fasting blood glucose value is derived after several hours without eating (6 to 8 hours).
- the fasting blood glucose measurement value is typically taken in the morning before breakfast and is the most commonly performed test among insulin treated patients as it is used to assess the quality of the titration of long-acting basal insulin or analogs such as insulin glargine.
- a portable monitor is used which may be able to measure the blood glucose level as well or which receives the measurement values from a blood glucose measurement device.
- a wireless or wired data transfer can be used to transport the results from the measurement device to the data management unit.
- Data management units of prior art usually store the measurement values and are typically able to show graphical representation of data and statistical measures such as average values, which are often difficult for a user to interpret and not or not very suitable to make decisions on the improvement of the treatment.
- the existing data displays typically require an experienced user and further analysis of the results, which is time consuming.
- Document WO 2011/007051 A1 discloses a method for controlling the measurement process of blood glucose of a patient and a respective arrangement wherein a first average value of the blood glucose level difference of a measurement value pair, that means of values taken before a meal and after a meal, over a recent first block of three days is calculated and compared to a second average value of such a difference of a second block of three days prior the recent three days. From the comparison of the first and second average value a trend may be determined which is, however, very brittle to outliers.
- Documents WO 2010/149392 A1 and EP 2 486 851 A1 disclose a method and system for providing an estimated true mean blood glucose value from spot blood glucose measurements.
- This system comprises a display, memory and a processor program to collect spot blood glucose measurement values and associated context of the blood glucose measurements at daily times and events specified by a structured sampling schema provided in memory, to weight each of the connected blood glucose measurement values based on the associated context and to determine the estimated true mean blood glucose value from the weighted measurements of the collected blood glucose measurements and to provide the estimated true mean blood glucose value to the display. Any trend information cannot be derived from these true mean blood glucose values.
- Documents WO 03/057027 A2 and EP 2 259 057 A1 refer to a system for monitoring physiological characteristics according to the user biological state comprising a sensor input capable of receiving a signal from a sensor, the signal being based on a sensed physiological characteristic value of a user, a memory for storing a plurality of measurements of the sensed physiological characteristic value of the user from the received signal from the sensor and a display for presenting a graphical representation of the plurality of measurements of the sensed physiological characteristic value preferably continuously in real time.
- the graphical representation may comprise one or more trend indicators indicating an approximate rate trend in the sensed physiological characteristic value over a recent series of the plurality of measurements.
- a high positive trend threshold which defines a limit at 3 mg/dl per minute averaged over 20 minutes.
- a low positive trend threshold defines a limit at 1 mg/dl per minute, a high negative trend threshold a limit at -3 mg/dl per minute and a low negative trend threshold a limit at -1 mg/dl per minute, each averaged over 20 minutes.
- This prior art method of trend representation is only useful for continuous measurement of blood glucose level.
- Document EP 2 031 534 A1 refers to a diabetes management system and process that may be used to analyze and recognize pattern for a large number of blood glucose concentration measurements and other physiological parameters related to the glycemia of a patient. It is disclosed that a display area includes a graphical pattern of blood glucose variability about a median blood glucose value by at least one of time of day, of day in a week, of both time of day and day of week, or at different predetermined intervals. A diagram shows a graphical blood glucose variability pattern in relation to a specific day as spanning from 24 hours starting at about 12 a.m. to about 12 a.m. of the next day.
- the median of glucose concentration values and a median of test times during this temporal period are shown defining a data point on a graph depicted by a bold line. As one can derive from the respective diagram such a trend representation is rather difficult to interpret by the patient.
- the object of the present invention is to provide a data management unit and a respective method which avoids the above drawbacks and provides information for self-monitoring of a physiological parameter containing reliable trend information which is easy to understand by the patient and useful to the HCP when adjusting the prescribed therapy.
- inventive data management unit for supporting health control comprises
- the time stamp associated to each measurement value comprises date and time information of a certain time point during the measurement process resulting in the respective measurement value, for example the completion of the measurement process.
- the first and the second time interval mentioned above refer to an interval including both, the date and time information of the time stamp. If, for example the second time interval is defined as the recent 3 days the second group contains all measurement values with the time stamp referring to the present day and the two days before (days 0, -1 and -2). Accordingly, if, for example the first time interval is defined as the 7 days before the recent 3 days the first group contains all measurement values with the time stamp referring to the days -3 to -9.
- the trend is calculated and indicated with regard to the fasting blood glucose level considering fasting blood glucose measurement values of the first and second time interval only. Indicating the trend with regard to this physiological parameter is particularly interesting and helpful as this parameter is an outstanding parameter and often used for titration of basal long-acting insulin as explained above.
- the comparison of the second mean value to the first mean value is preferably executed by calculation of a difference of both values.
- the inventive data management unit on the one hand provides the patient with trend information that is robust to exclude outliers from any potential consideration to adjust therapy because the median of the first group of measurement values is used as basis for comparison.
- the median is the middle measurement value of the first group when the measurement values are ranked in order. If there is an even number of measurement values in the first group, the arithmetic mean of the middle two measurement values is taken. Alternatively, one value of the middle two measurement values is taken. For example, either the lower value is taken or the higher value is taken, or the most recent value is taken.
- inventive unit is in particular useful for self-monitoring spot measurements wherein a comparatively small number of measurement values per middle-size time interval comprising some days is received. Additionally, because only one of different trend categories, for example the increasing trend, the steady trend or the decreasing trend, is displayed dependent on the comparison of the second mean value to the first mean value, it is easy to understand for the patient even without higher mathematical education. Additionally, the inventive data management unit providing trend information gives the patient information to continue to adhere with therapy and/or to continue behavior that leads to desired trends.
- a medical device for supporting health control the device comprising the above explained data management unit.
- a system comprising the above mentioned medical device and a case adapted to carry and secure the medical device and preferably a box containing test strips and/or a lancet.
- the case further comprises additionally at least one flash card containing information related to the use of the device, preferably with regard to the different trend categories or tags as well as to the operation of the medical device.
- the at least one flash card is fixed by two rings or a hinge to the case so that an easy access is provided for the user/patient to the information contained at the backside of such a flash card by hinging down the respective card. In this position the card is still fixed to the case and therefore cannot get lost.
- the first time interval is larger than the second time interval, preferably the first time interval encompasses seven days and the second time interval three days.
- the larger first time interval provides a better statistical approach for the comparison with the recent measurements. Further, the patient still remembers what happens on recent three days and a seven day period is meaningful for potential therapy adjustments.
- the second mean value is the arithmetic mean value of the measurement values of the second group which is an easily computable mean value for a smaller number of measurement values.
- a geometric mean value or a harmonic mean value may be used.
- the data storage further stores a relative tolerance range of the second mean value, preferably 15% or 20% or 25% of the second mean value, wherein the trend indicator is adapted to indicate one predefined of the different trend categories, for example the steady trend, if the result of the comparison is within the relative tolerance range, preferably if the second mean value is greater than a predefined low limit.
- the advantage of providing a tolerance range is that otherwise the indicated trend would be confusing, for example by changing too frequently.
- the aim of the data management is to be on the safe side for the patient.
- the definition of the relative tolerance range is more useful if the most recent second mean value is above a predefined low limit. In case the second mean value is below the low limit the relative tolerance range value would be too small.
- the data storage further stores an absolute tolerance range, wherein the trend indicator is adapted to indicate one predefined of the different trend categories, for example the steady trend, if the result of the comparison is within the absolute tolerance range, preferably if the second mean value is less than or equal the predefined low limit.
- the second mean value is so small that it is below or equal to the predefined low limit it is useful to define an absolute tolerance range in order to prevent confusing up and down change of the trend indication.
- the predefined low limit may be chosen between 100 mg/dl and 150 mg/dl, preferably at 125 mg/dl.
- the second time interval encompasses the present day so that the trend calculation is as up-to-date as possible.
- the first time interval and the second time interval do not overlap so that the first mean value and the second mean value are calculated based on fully different measurement values. Otherwise the one or more measurement values of the overlapping time interval would be weighted more than the other measurement values.
- the processor interacts with the trend indicator such that in case the first time interval encompasses less than a predefined first number limit of measurement values and/or the second time interval encompasses less than a predefined second number limit of measurement values the trend indicator does not indicate the one of the different trend categories, for example the increasing trend, the steady trend and the decreasing trend, in this case preferably the trend indicator is adapted to indicate an error as there are not enough measurement values to provide a good statistics.
- the first number limit is 5 or more, preferably 7 or 9, and the second number limit is 2, 3 or 5, also dependent on the definition of the first number limit.
- the trend indicator is adapted to show on the display an up arrow as the increasing trend sign, a down arrow as the decreasing trend sign and a horizontal arrow as the steady trend sign. These signs are easy to understand for the user/patient.
- the data storage is further adapted to store an associated event tag for each measurement value in order to further categorize the measurement values, and the event tag is considered additionally for selection of the first group of measurement values and the second group of measurement values from the plurality of measurement values.
- blood glucose measurement values could be categorized as fasting blood glucose measurement value, as a pre-meal blood glucose measurement value or a past-meal blood glucose measurement value, or as a measurement value of a control solution or with a no-tag.
- an event tag it can be guaranteed that only (the mean values of) the measurement values of the same category, e.g. the fasting blood glucose measurement values, are compared.
- a computer program for indicating a trend within a plurality of measurement values of a physiological parameter stored in a storage, wherein each measurement value is stored with an associated time stamp, the computer program comprising:
- the above computer program may be realized with the embodiments as mentioned above with regard to the inventive trend indicating method.
- a computer program product comprising a computer-readable medium bearing computer program code embodied therein for use with a computer, wherein the computer program code comprises the above mentioned computer program.
- the embodiments are outlined in relation to a medical device supporting health control and the trend indication method with regard to blood glucose level measurement, in particular with regard to fasting blood glucose level measurement.
- the used terminology and the description of the embodiments with respect to the medical device or health indicating method are not intended to limit the principles and ideas of the invention to such a single device or method and may be adapted to other physiological values accordingly.
- Figure 1 is a schematic drawing and Figure 2 is a schematic diagram of the medical device 100 according to a preferred embodiment of the invention.
- the medical device 100 comprises a blood glucose measurement unit 110, which is arranged to measure the blood glucose level.
- the measurement unit 110 comprises an interface and a slot 112 for inserting a test strip.
- the blood glucose measurement unit 110 is connected to a receiving unit 120, which is arranged to forward e.g. blood glucose measurement data received from blood glucose measurement unit 110 to a data storage 130 (storage unit or means) or memory, such as a Flash memory.
- the receiving unit 120 may retrieve stored data such as e.g. blood glucose value data from the storage 130 and forward it to a processor 140 (processing unit or means), such as a microcontroller or microprocessor, a digital signal processor, and / or the like.
- the receiving unit 120 directly forwards the blood glucose value data received from the blood glucose measurement unit 110 to the processor 140.
- Receiving unit 120 is further connected to a user input unit 150 of a user interface.
- the user input unit 150 is arranged to receive input from the user of the medical device 100 for example by key 151, confirmation key (OK button) 152, key 153 for scrolling down (downward button) and key 154 for scrolling up (upward button).
- the user input data are forwarded from the user input unit 150 to the receiving unit 120, which either forwards it to the processor 140 or to the data storage 130.
- the user interface of medical device 100 comprises a display unit 160 with a display 162, which is connected to the receiving unit 120 as well.
- the display unit 160 receives data to be displayed by the display 162 from the receiving unit 120 or the processor 140.
- the medical device 100 additionally comprises a further interface 170, for example a wired interface such as a serial port, a Universal Serial Bus (USB) interface, a mini-USB interface, or a wireless interface such as an infrared (e.g. an IRDA) interface, a BluetoothTM interface, and / or the like, in order to receive data and / or to transmit data.
- the interface 170 is preferably connected to the receiving unit 120 in order to receive data from the receiving unit 120 and/or to forward data to the receiving unit 120.
- the medical device 100 comprises a clock unit 180 which provides a date and time information, preferably based on a clock generator, which may be displayed at the display 162. Further, the clock unit 180 provides date and time information in particular for generating a time stamp for an associated blood glucose measurement.
- the medical device 100 preferably comprises a blood glucose measurement unit 110.
- the blood glucose measurement unit 110 is arranged to measure the blood glucose level in the blood of e.g. the user by testing a drop of blood on a test strip that is inserted into the slot 112. The measurement may be made by e.g. an electrochemical method or an optical method. Full insertion of the test strip in the slot 112 may be detected by a respective sensor. The measured blood glucose value is transformed to blood glucose value data and forwarded preferably immediately or on demand to the receiving unit 120.
- the blood glucose measurement unit 110 is arranged to measure the blood glucose level of the user via infrared diagnosis or an alternative contactless measurement method.
- the blood glucose measurement unit 110 is implanted in the body of the user of the medical device and forwards the data to the receiving unit 120 either via a wired connection or via a wireless connection.
- an implanted blood glucose measurement unit 110 is a continuous measurement sensor e.g. based on a chip which may allow a continuous closed loop control.
- the medical device comprises two parts, one part contains the measurement unit 110 and the other part the remaining units of the medical device.
- the blood glucose measurement unit 110 preferably forwards the blood glucose measurement value data to the receiving unit 120 via interface 170.
- the medical device does not comprise a blood glucose measurement unit which measures the blood glucose values, but receives blood glucose value data from an external unit.
- the measurement of the blood glucose measurement is preferably triggered by the receiving unit 120 which sends a respective signal to the blood glucose measurement unit 110.
- the receiving unit 120 receives a trigger signal generated by user input which is received via user input unit 150 or based on a signal from the slot 112 detecting a test strip.
- the trigger signal is generated automatically by the clock unit 180 or by the processor 140.
- the receiving unit 120 is represented e.g. by the input ports and output ports of a microprocessor or a bus system managing the data handling between several functional units.
- bus systems such as e.g. Advanced Microprocessor Bus Architecture bus systems implemented in a microprocessor or external bus systems connected to a microprocessor.
- control signals such as trigger signals or control signals e.g. to the blood glucose measurement unit 110, the display unit 160 or the interface 170.
- the data storage 130 is arranged to store data entered via the user input unit 150, a plurality of blood glucose measurement data received from the blood glucose measurement unit 110 together with the time stamp and/or at least one event tag associated to each measurement data, data calculated from the plurality of blood glucose measurement values processed by the processor 140 and/or data received via interface 170.
- the data storage 130 stores parameter data like an associated time range for tagging preselection regarding for example a fasting tag, a pre-meal tag or a post meal tag.
- a time range is defined using a center time and a duration, wherein the time range comprises the time around the center time with the size of 1/2 duration in both directions.
- the time range for fasting tagging preselection is defined with a duration of 2 hours and a center time at 7 a.m., so that the time range for fasting tagging preselection encompasses the time between 6 a.m. and 8 a.m.
- the data storage 130 stores the following preset time ranges for preand post-meal times, preferably for tagging preselection:
- Mealtime and fasting time ranges may be settable by the user "Settings" mode of the medical device.
- data storage 130 is arranged to provide the stored data to the processor 140, to the display unit 160 and/or to the interface 170.
- the data storage 130 is preferably implemented as a semiconductor memory such as a Flash memory. Alternatively, it is implemented as a hard disk memory or an on-chip memory of the processor 140.
- the processor 140 is preferably a microprocessor or any other functional unit capable of processing data.
- the user input unit 150 is preferably implemented as a keyboard comprising one or more push buttons 151, 152, 153, 154.
- the keyboard may comprise one or more soft keys, wherein the function of the soft keys may be displayed on the display 162.
- the user input unit 150 is a key board or a touch screen.
- the user input unit 150 comprises a microphone for receiving speech input so that data can be entered via speech input.
- a tag may be associated to the measurement value referring to lifestyle data by pressing the up or down keys 153, 154 scrolling upwards or downwards through the different tags which are for example the fasting tag, pre-meal tag, post-meal tag and no-tag respectively referring to a measurement value which is a fasting blood glucose value, a pre-meal blood glucose value, a post-meal blood glucose value and a blood glucose value that cannot be associated to one of the previous lifestyle parameter.
- the display unit 160 preferably comprises an LCD or LED display 162.
- the display displays a number of alphanumerical characters so that e.g. the presently measured blood glucose value can be displayed together with additional instructions for the user.
- the display unit 160 comprises a graphic display in order to display graphs or graphics such as icons. Further the display of the display unit 160 may comprise a touchscreen.
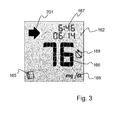
- the display unit 160 further may also show a trend indicator 164 (trend indicating unit or means) which is adapted to indicate different trend categories, for example an increasing trend, a steady trend and a decreasing trend, symbolized e.g. as an arrow pointing up, an horizontal arrow 201 and an arrow pointing down 202, respectively, at the display 162 (see Figures 3 and 4 ).
- the trend may be communicated by a loud speaker, wherein the increasing trend may be represented by a tone with an increasing pitch, the steady trend by a tone with a constant pitch and the decreasing trend by a tone with a decreasing pitch.
- the interface 170 is preferably a wireless interface, such as IRDA, BluetoothTM, GSM, UMTS, ZigBee, or WI-FI, etc.
- the interface is a wired interface, such as a USB port, mini-USB port, serial data port, parallel data port, etc., for receiving and transmitting data.
- the medical device 100 does not comprise an interface 170.
- medical device 100 comprises a memory card reader or a memory card reader interface.
- the memory card reader is preferably adapted to read information from a memory card, such as a Flash memory card, or any type of SIM card.
- the memory card comprises a memory, wherein at least one of a selected algorithms together with corresponding parameters, a history of the blood glucose values and / or insulin doses administered, etc. is stored.
- the relevant data may still be stored on the memory card which can be easily removed from the memory card reader of the medical device 100 and transferred to a new medical device 100.
- the memory card 100 may be used in order to provide information on the history of the treatment to e.g. an HCP.
- the memory card is a SIM card providing subscriber identification for a mobile communication network and the interface unit 170 is additionally a mobile communication interface
- additional functions of the medical device 100 can be unlocked by the provider of the SIM card via a telecommunication channel.
- This offers the possibility that the medical device 100 can communicate with other telecommunication devices via predefined channels, such as UMTS or GSM.
- IMSI international mobile subscriber identity
- the medical device 100 identifies itself within the network and, thus, can be addressed via the network.
- the medical device 100 can be easily checked, remote controlled, updated, monitored, etc., via interface unit 170, e.g. by addressing the mobile communication unit with a phone number.
- the medical device 100 is able to transmit data via SMS, e-mail or via mobile internet connection. Moreover, this offers the possibility to locate the medical device 100 in an emergency case.
- the blood glucose measurement unit 110 is a continuous sensor which is e.g. implanted a dose delivery unit with an insulin pump forming an automatic delivery system may be additionally provided.
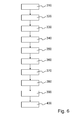
- the medical device 100 is capable to perform a number of operating processes. According to a preferred alternative after switching on, e.g. by pressing a key 151, 152, 153 or 154, preferably the confirmation key 152 for a predetermined time, or detection of a test strip within the slot 112, the medical device 100 performs initialization step 310 for initializing the functional components of the medical device 100. After this, the different operation modes which are implemented in the medical device 100, are displayed in the display step 320, preferably operation modes such as "Measure BG", "Logbook” and/or "Settings".
- step 330 the user selects one of the displayed operation modes via the user input unit 150, for example by means of the keys 153, 154 for scrolling down or up, and confirms the selection using the confirmation key 152.
- step 340 the selected operation mode is executed.
- the mode "Measure BG" is selected for executing a blood glucose measurement.
- the user/patient is requested to provide a test strip with a blood sample.
- the “Logbook” mode the history of previous measurements and statistical results may be calculated and displayed.
- the “Settings” mode allows the user to define and change some parameters of the medical device 100.
- step 350 a drop of blood is applied to the test portion of the test strip which is inserted in slot 112 of the medical device 100.
- steps 310 to 340 may be skipped in the case that a specific operation mode is preselected.
- the preselected operation mode which is either preselected by the user or automatically selected in accordance with a specific event, for example the detection of a fully inserted test strip in slot 112
- the operating process proceeds with the following step 350 and asks the user to apply a drop of blood.
- step 360 it executes the preselected one or more operation modes, for example the mode "Measure BG".
- step 360 the measurement unit 110 determines e. g. by an electrochemical method the blood glucose level and displays the respective measurement value at the display 162.
- the clock unit 180 generates the time stamp of the present measurement comprising a date and time information. The time stamp is also displayed in display 162 and both, the present blood glucose measurement value and the associated time stamp is transferred by receiving unit 120 to the data storage 130.
- the processor 140 compares the time stamp of the present blood glucose measurement value with the time ranges of the events stored in the data storage 130 which events may be selected as the associated event tag. If the time stamp of the present measurement value, in particular the time information of the time stamp, lies within the current time range of e. g. the fasting event automatically the fasting tag is provided for confirmation by the user and displayed with a respective sign 168, for example a struck out, empty apple, at display 162. In order to show that a confirmation is necessary the tag sign 168 displayed on display 162 is blinking/flashing. Now, the user may confirm the fasting tag for example by pressing the confirmation key 152.
- the user may change the tag using the up and down keys 153, 154 into the pre-meal tag, the post-meal tag or the no-tag (nil). If the correct tag is chosen the user confirms the tag by pressing the confirmation key 152. By confirmation of the tag with the confirmation key 152 the flashing of the displayed tag sign is stopped and the tag sign is displayed continuously without blinking. In this state, pressing the up/down keys 153, 154 will not change the tag. Then, the processor 140 initiates storage of the associated, confirmed tag with regard to the recent measurement value in the data storage 130 via receiving unit 120.
- step 380 the processor 140 cannot find any range for tagging pre-selection which refers to the time information of the time stamp of the present measurement value, the no-tag is preselected.
- the user is allowed to change the tag in the above explained manner but only within a predefined time range from the associated time stamp of the blood glucose measurement value, for example within 10 days.
- time stamp of the recent measurement value falls within the current time range for tagging pre-selection and there is already a measurement value in that day marked as fasting the fasting tag is not automatically displayed and not selectable and therefore may not be associated to the recent measurement value.
- the fasting tag has priority over the pre-meal tag.
- the fasting tag is automatically preselected if the time stamp of the present measurement value lies within the time range for the fasting tag and the time range for pre-meal breakfast.
- a flashing tag may not only be confirmed by the user by pressing the confirmation key 152 but also by removal of the strip from the port 112 after a blood glucose test, or when the medical device goes into sleep mode.
- a comment to the present measurement value may be selected by the user using the up and down keys 153, 154.
- the comment may then be confirmed with the confirmation key 152, wherein the chosen comment is then stored in the data storage 130 associated to the present measurement value as well.
- step 400 after each measurement (and finishing tagging in step 380) the processor 140 compares whether the time information of the time stamp of the last e.g. three consecutive measurement values tagged with the same event tag, for example with the fasting tag, including, if applicable, the present measurement value are outside the current time range for tagging pre-selection of the fasting event in the same direction. If not all three associated time stamps are outside the current time range in the same direction the current time range for tagging preselection of the fasting tag stored in the data storage 130 is not changed. If the processor 140 detects that all three time stamps of the three consecutive previous measurement values tagged with the fasting tag are outside the current time range in the same direction (i.e.
- the time range is shifted. Therefore, the arithmetic mean value of the time information of the three time stamps is calculated and used as the new center time for the time range for tagging pre-selection of the fasting tag.
- the duration of the time range may stay the same.
- the time information of the time stamps of the recent 3 measurement values comprising the fasting tag are 8:10 a.m., 8:27 a.m. and 8:23 a.m. and the present time range for fasting tag preselection refers to a center time at 7 a.m. and a duration of 2 hours.
- the processor 140 determines that all time information is outside the current time range for fasting tag preselection in the same direction. In this case the time range for fasting tagging preselection is changed to a center time at 8:20 a.m. which is the arithmetic mean value of the three time stamps. This new current time range center value is then stored in the data storage 130.
- the time range now is between 7:20 a.m. and 9:20 a.m., as the duration is not changed, so that if the user now measures a blood glucose value within this time range automatically the fasting tag sign is displayed after finishing measurement for user confirmation.
- the device may turn into the sleep state automatically after for example 120 seconds without any new action. Once the device has returned a new measurement value, the device turns to the sleep state automatically after for example 60 seconds without any user interaction.
- the medical device 100 provides at least one memory review mode which is called “Logbook” mode.
- the respective display and calculations are explained in the following.
- the "Logbook” mode is entered when the user activates the medical device 100 by pressing e.g. the confirmation button 152. Then a display as depicted in Figures 3 and 4 is shown.
- the measurement values preferably are preferably displayed in the order in which the entries are entered into the device, or alternatively according to the time and date assigned to the measurement values. In particular the most recent blood glucose measurement value is shown upon entry into the "Logbook” mode. Pressing the up and down keys 153, 154 the user may scroll through the records, for example by pressing the down key 153 the user may scroll backwards in time and by pressing the up key 154 the user scrolls forward in time.
- FIG. 3 Examples of a display 162 showing a measurement value are shown in Figures 3 and 4 .
- the user knows from the "Book” sign 165 in the lower left corner of the display that he/she has entered the "Logbook” mode.
- the display 162 in the "Logbook" mode further shows the blood glucose measurement value 166 as biggest number in the center of the screen.
- the associated time stamp 167 including date and time is displayed.
- the associated tag as a sign 168 is provided, wherein the sign may show for example an empty, struck out apple as shown in Figures 3 and 4 in case of an associated fasting tag, a full apple as shown in Figure 5b ) in case of an associated pre-meal tag, a bitten apple as shown in Figure 5c ) in case of an associated post-meal tag or a struck out circle as shown in Figure 5a ) in case of an associated no-tag.
- the measurement unit 169 for the blood glucose value is provided in the lower right corner of the display 162 .
- the upper left corner of the display 162 in the "Logbook” mode shows a sign representing a trend for fasting blood glucose values controlled by the trend indicator 164 which is activated in the "Logbook” mode.
- the trend indicator 164 shows the trend of the respective fasting blood glucose measurement value using an arrow pointing up, an arrow pointing horizontally 201 (see Figure 3 ) or an arrow pointing down 202 (see Figure 4 ).
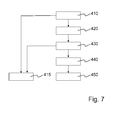
- the processor 140 selects in step 410 via the receiving unit 120 from the data storage 130 a second group of measurement values containing the fasting tag of the recent e.g. three days, for example the fasting measurement values of the present day and the two days before (days 0, -1 and -2), wherein at least two fasting measurement values within the three day period must be available. If less than two fasting measurement values, i.e. only one fasting measurement value, within the three day period is available the procedure moves to step 415 and the trend indicator 164 does not calculate and display a respective trend arrow and the display 162 stays empty in the upper left corner or shows an error sign.
- step 420 the arithmetic mean value is determined from these 3 or 2 fasting measurement values as the second mean value CURR_FAST_AVG.
- step 430 the processor 140 selects from the data storage 130 via the receiving unit 120 a first group of measurement values based on the associated time stamp comprising seven days before the recent three days, i.e. three days to nine days prior the recent fasting measurement value (days -3 to -9), wherein at least a first number limit of for example 5 fasting measurement values within the seven day period must be available. Otherwise, the procedure moves to step 415 and the processor 140 does not calculate a trend and the trend indicator 164 does not display any trend arrow or shows an error sign.
- step 440 if there are enough fasting measurement values, from the fasting measurement values of the first group the median is determined as a first mean value PAST_FAST_MED.
- the second mean value CURR_FAST_AVG is greater than a low limit of 125 mg/dl and the difference between the second mean value and the first mean value is greater than 20% of the second mean value (corresponding to a relative tolerance range), i.e. CURR_FAST_AVG - PAST_FAST_MED > CURR_FAST_AVG * 20 % , the fasting trend up arrow is displayed on the display 162.
- the fasting trend up arrow is displayed on the display 162 if the second mean value CURR_FAST_AVG is less than or equal the low limit of 125 mg/dl and the difference between the second mean value and the first mean value is greater than 25 mg/dl (corresponding to an absolute tolerance range), i.e. CURR_FAST_AVG - PAST_FAST_MED > 25 mg / dl .
- the fasting trend down arrow 202 is displayed on the display 162.
- the fasting trend down arrow 202 is displayed on the display 162 if the second mean value CURR_FAST_AVG is less than or equal the low limit of 125 mg/dl and the difference between the first mean value and the second mean value is greater than 25 mg/dl (corresponding to an absolute tolerance range), i.e. PAST_FAST_MED - CURR_FAST_AVG > 25 mg / dl .
- the fasting trend steady arrow 201 is displayed by the trend indicator 164 at the display 162.
- the fasting trend arrows showing in upward, downward or horizontal direction are easy to understand for the patient and provide a reliable and descriptive assessment of the fasting blood glucose value development over a time range of about 1.5 weeks.
- device 100 may be realized as a two-part device, wherein the data storage 130, the receiving unit 120, the processor 140, the user input unit 150, the display unit 160 with the trend indicator 164, the interface unit 170, and the clock unit 180 are realized as a software program (application or "app") to run on the hardware of a smartphone.
- the keys 151, 152, 153 and 154 are realized in this case as button fields on the display of a touchscreen.
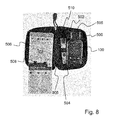
- Figure 8 shows a case 500 for a medical device in an open state comprising the medical device 100, a box 502 with test strips and a lancet 504.
- the case 500 is made of a textile material.
- the case may be made of a plastic material, a leather material, a combination of any of these materials, and/or the like.
- the medical device 100, the box 502 and the lancet 504 are fixed to left side the case 500 by means of flexible straps 505 so that each of these elements may be easily removed from the case 500.
- each flash card 506 On the left side of the case several flash cards 506 are fixed hingedly by two rings 508 to the case 500. Each ring 508 may be opened so that one card or more cards 506 may be removed from the case 500.
- Each flash card 506 provides important information to the user/patient like explanations and pictures with regard to the buttons, the display, the symbols of the display and their meaning, or the operation of the medical device 100, for example how to tag a measurement value.
- the flash card 506 provides such information on the front side, but may also provide information on the back side. In order to access the information printed on the backside of each card 506 it may be hinged down (pivoted around the axis of ring 508) by the patient/user so that the backside information is visible.
- each flash card 506 may be marked at a top area with a different color.
- the ring 508 further has the advantage that the card is still fixed to the case when the patient/user reads the backside so that the card cannot get lost.
- the case In the state where all flash cards 506 are pivoted such that they are positioned fully within the case 500 the case may be closed using the zipper 510. In the closed state of the case 500 the interior is well protected against environmental impact.
Abstract
The present invention refers to a data management unit for supporting health control and a corresponding medical device comprising
¢ a data storage (130) adapted to store a plurality of measurement values of a physiological parameter, for example the fasting blood glucose level, and for each measurement value an associated time stamp and
¢ a trend indicator (164), wherein the trend indicator is adapted to indicate different trend categories, for example an increasing trend, a steady trend and a decreasing trend, preferably as a respective visible sign (201,202) on a display (162) and/or as a respective audible signal by a loudspeaker,
¢ a processor (140) adapted to select a first group of measurement values and a second group of measurement values from the plurality of measurement values of the data storage (130) such that the associated time stamp of the measurement values of the first group encompasses a predefined first time interval and the associated time stamp of the measurement values of the second group encompasses a predefined second time interval, wherein the second time interval is more recent than the first time interval, wherein the processor is further adapted to calculate a first mean value as a median from the first group of measurement values and a second mean value from the second group of measurement values,
wherein the processor (140) interacts with the trend indicator (164) such that the trend indicator (164) indicate one of the different trend categories, for example the increasing trend, the steady trend or the decreasing trend, dependent on a result of a comparison of the second mean value to the first mean value. Additionally, the invention refers to a corresponding method and a computer program for indicating a trend, and to a corresponding computer program product.
Description
- The present invention relates to a data management unit for supporting health control, a method and a computer program for indicating a trend within a plurality of measurement values of a physiological parameter, a respective computer program product, and a medical device for supporting health control.
- The following description of the invention mainly refers to diabetes as a health problem and the blood glucose level as the physiological parameter to be controlled in order to assess the effectiveness of the prescribed treatment. However, the invention may also be used with regard to other health problems and for management of other physiological parameter data like (a) blood pressure in hypertensive heart disease, (b) cholesterol or lipoprotein profile in patients with risk factors for heart disease and stroke, (c) peak flow in asthmatic patients, or (d) coagulation in patients treated for hemophilia.
- Diabetes mellitus is a group of metabolic diseases in which a person has high blood sugar, either because the pancreas does not produce enough insulin, or because cells do not respond to the insulin that is produced. The treatment of diabetes concentrates on keeping blood sugar levels as close to normal ("euglycemia") as possible, without causing hypoglycemia. This can usually be accomplished with diet, exercise, and use of appropriate medications (insulin in the case of type 1 diabetes; oral medications, as well as possibly insulin, in type 2 diabetes).
- Essential elements of the management of diabetes with insulin are periodic checks of the glucose concentration in the blood performed by the patients themselves, in order to obtain regular information on the progress and success of the prescribed treatment. This understanding, and patient participation is vital, since the complications of diabetes are far less common and less severe in people who have well-managed blood sugar levels. With regard to this it has to be considered that the blood glucose level fluctuates throughout the day and is directly influenced by the amount of insulin administered, as well as lifestyle factors such as the amount and kind of food that is consumed, the exercise level and stress.
- Therefore, the monitoring of the sugar level in the blood serves a dual purpose: on the one hand it provides the patient with information about the current status of glycemic control. On the other hand can the measured values serve as information for the patient or a healthcare professional (HCP) to determine whether an adjustment in the medication, namely the amount of insulin to be taken, is indicated.
- In order to achieve these goals or to get as close as possible to the desired glycemic control, it is common practice that blood glucose measurement (BGM) values are monitored once or several times during the day, following a testing regime normally prescribed by an HCP.
- A special role is played by the so-called fasting blood glucose measurement value (FBG). A fasting blood glucose value is derived after several hours without eating (6 to 8 hours). The fasting blood glucose measurement value is typically taken in the morning before breakfast and is the most commonly performed test among insulin treated patients as it is used to assess the quality of the titration of long-acting basal insulin or analogs such as insulin glargine.
- In order to adjust or to adapt the therapy it is helpful to record the results of all blood glucose measurements and to analyze these results with a data management unit. Therefore, typically a portable monitor is used which may be able to measure the blood glucose level as well or which receives the measurement values from a blood glucose measurement device. A wireless or wired data transfer can be used to transport the results from the measurement device to the data management unit.
- Data management units of prior art usually store the measurement values and are typically able to show graphical representation of data and statistical measures such as average values, which are often difficult for a user to interpret and not or not very suitable to make decisions on the improvement of the treatment. The existing data displays typically require an experienced user and further analysis of the results, which is time consuming.
- Further it is observed that a single self-monitoring blood glucose measurement value may be interpreted differently if it is seen in context of previous measurement values of the same time range. Common devices of prior art allow the individual test result to be associated by the user with a tag, intended to indicate a result taken as before or after a meal.
- Especially for morning fasting readings and the purpose of determining the quality of the titration of long-acting insulin though, it is important to detect trends over a certain period of time as common treatment algorithms for long-acting insulin rely mainly on morning fasting values. Therefore, the need exists to provide a reliable trend indicating method for a plurality of measurement values, providing a trend analysis over a midrange time interval, which is easy to understand for the patient and useful to the HCP when adjusting the prescribed therapy.
- Document
WO 2011/007051 A1 discloses a method for controlling the measurement process of blood glucose of a patient and a respective arrangement wherein a first average value of the blood glucose level difference of a measurement value pair, that means of values taken before a meal and after a meal, over a recent first block of three days is calculated and compared to a second average value of such a difference of a second block of three days prior the recent three days. From the comparison of the first and second average value a trend may be determined which is, however, very brittle to outliers. - Documents
US 7,904,310 B2 andUS 7,853,455 B2 disclose a system and method that enables a health care provider to monitor and manage a health condition of a patient wherein the user can select graphic display of blood glucose test results over a specific period of time such as a particular week. When such a weekly trend graph is displayed, small icons identify points on the graphic representation that correspond to the blood glucose test results, wherein coordinate values for blood glucose level and measurement time of day can be displayed if desired. Further, the graph consists of lines interconnecting points that correspond to the blood glucose test results and the average blood glucose level as well as the standard deviation of the measurement values may be displayed. For people without higher mathematical education the interpretation of such a graph, the average value and the standard deviation is too difficult. - Documents
WO 2010/149392 A1 andEP 2 486 851 A1 disclose a method and system for providing an estimated true mean blood glucose value from spot blood glucose measurements. This system comprises a display, memory and a processor program to collect spot blood glucose measurement values and associated context of the blood glucose measurements at daily times and events specified by a structured sampling schema provided in memory, to weight each of the connected blood glucose measurement values based on the associated context and to determine the estimated true mean blood glucose value from the weighted measurements of the collected blood glucose measurements and to provide the estimated true mean blood glucose value to the display. Any trend information cannot be derived from these true mean blood glucose values. - Documents
WO 03/057027 A2 EP 2 259 057 A1 refer to a system for monitoring physiological characteristics according to the user biological state comprising a sensor input capable of receiving a signal from a sensor, the signal being based on a sensed physiological characteristic value of a user, a memory for storing a plurality of measurements of the sensed physiological characteristic value of the user from the received signal from the sensor and a display for presenting a graphical representation of the plurality of measurements of the sensed physiological characteristic value preferably continuously in real time. Further, the graphical representation may comprise one or more trend indicators indicating an approximate rate trend in the sensed physiological characteristic value over a recent series of the plurality of measurements. Therefore, different trend values are defined, for example a high positive trend threshold which defines a limit at 3 mg/dl per minute averaged over 20 minutes. A low positive trend threshold defines a limit at 1 mg/dl per minute, a high negative trend threshold a limit at -3 mg/dl per minute and a low negative trend threshold a limit at -1 mg/dl per minute, each averaged over 20 minutes. This prior art method of trend representation is only useful for continuous measurement of blood glucose level. - Document
EP 2 031 534 A1 refers to a diabetes management system and process that may be used to analyze and recognize pattern for a large number of blood glucose concentration measurements and other physiological parameters related to the glycemia of a patient. It is disclosed that a display area includes a graphical pattern of blood glucose variability about a median blood glucose value by at least one of time of day, of day in a week, of both time of day and day of week, or at different predetermined intervals. A diagram shows a graphical blood glucose variability pattern in relation to a specific day as spanning from 24 hours starting at about 12 a.m. to about 12 a.m. of the next day. Therein, the median of glucose concentration values and a median of test times during this temporal period are shown defining a data point on a graph depicted by a bold line. As one can derive from the respective diagram such a trend representation is rather difficult to interpret by the patient. - Hence, the object of the present invention is to provide a data management unit and a respective method which avoids the above drawbacks and provides information for self-monitoring of a physiological parameter containing reliable trend information which is easy to understand by the patient and useful to the HCP when adjusting the prescribed therapy.
- The above problem is solved by a data management unit with the features of claim 1.
- In particular the inventive data management unit for supporting health control comprises
- a data storage adapted to store a plurality of measurement values of a physiological parameter, for example the fasting blood glucose level, and for each measurement value an associated time stamp, and
- a trend indicator, wherein the trend indicator is adapted to indicate different trend categories, for example an increasing trend, a steady trend and a decreasing trend, preferably as a respective visible sign on a display and/or as a respective audible signal by a loudspeaker,
- a processor adapted to select a first group of measurement values and a second group of measurement values from the plurality of measurement values of the data storage such that the associated time stamp of the measurement values of the first group encompasses a predefined first time interval and the associated time stamp of the measurement values of the second group encompasses a predefined second time interval, wherein the second time interval is more recent than the first time interval, wherein the processor is further adapted to calculate a first mean value as a median from the first group of measurement values and a second mean value from the second group of measurement values,
- The time stamp associated to each measurement value comprises date and time information of a certain time point during the measurement process resulting in the respective measurement value, for example the completion of the measurement process. The first and the second time interval mentioned above refer to an interval including both, the date and time information of the time stamp. If, for example the second time interval is defined as the recent 3 days the second group contains all measurement values with the time stamp referring to the present day and the two days before (days 0, -1 and -2). Accordingly, if, for example the first time interval is defined as the 7 days before the recent 3 days the first group contains all measurement values with the time stamp referring to the days -3 to -9.
- In an embodiment the trend is calculated and indicated with regard to the fasting blood glucose level considering fasting blood glucose measurement values of the first and second time interval only. Indicating the trend with regard to this physiological parameter is particularly interesting and helpful as this parameter is an outstanding parameter and often used for titration of basal long-acting insulin as explained above.
- The comparison of the second mean value to the first mean value is preferably executed by calculation of a difference of both values.
- The inventive data management unit on the one hand provides the patient with trend information that is robust to exclude outliers from any potential consideration to adjust therapy because the median of the first group of measurement values is used as basis for comparison. The median is the middle measurement value of the first group when the measurement values are ranked in order. If there is an even number of measurement values in the first group, the arithmetic mean of the middle two measurement values is taken. Alternatively, one value of the middle two measurement values is taken. For example, either the lower value is taken or the higher value is taken, or the most recent value is taken.
- Further, the inventive unit is in particular useful for self-monitoring spot measurements wherein a comparatively small number of measurement values per middle-size time interval comprising some days is received. Additionally, because only one of different trend categories, for example the increasing trend, the steady trend or the decreasing trend, is displayed dependent on the comparison of the second mean value to the first mean value, it is easy to understand for the patient even without higher mathematical education. Additionally, the inventive data management unit providing trend information gives the patient information to continue to adhere with therapy and/or to continue behavior that leads to desired trends.
- Accordingly, the above problem is solved by a medical device for supporting health control, the device comprising the above explained data management unit.
- The above problem is also solved by a system comprising the above mentioned medical device and a case adapted to carry and secure the medical device and preferably a box containing test strips and/or a lancet. The case further comprises additionally at least one flash card containing information related to the use of the device, preferably with regard to the different trend categories or tags as well as to the operation of the medical device. In an embodiment the at least one flash card is fixed by two rings or a hinge to the case so that an easy access is provided for the user/patient to the information contained at the backside of such a flash card by hinging down the respective card. In this position the card is still fixed to the case and therefore cannot get lost.
- For the same reason the above problem is also solved by a method for indicating a trend within a plurality of measurement values of a physiological parameter stored in a data storage, wherein each measurement value is stored with an associated time stamp, comprising
- selecting a first group of measurement values and a second group of measurement values from the plurality of measurement values such that the associated time stamp of the measurement values of the first group encompasses a predefined first time interval and the associated time stamp of the measurement values of the second group encompasses a predefined second time interval, wherein the second time interval is more recent than the first time interval,
- calculating a first mean value as a median from the first group of measurement values,
- calculating a second mean value from the second group of measurement values, and
- indicating one of different trend categories, preferably as a respective visible sign on a display and/or as a respective audible signal by a loudspeaker, based at least in part on a result of a comparison of the second mean value to the first mean value, preferably based on a difference of the first mean value and the second mean value.
- In another embodiment of the data management unit or trend indicating method the first time interval is larger than the second time interval, preferably the first time interval encompasses seven days and the second time interval three days. The larger first time interval provides a better statistical approach for the comparison with the recent measurements. Further, the patient still remembers what happens on recent three days and a seven day period is meaningful for potential therapy adjustments.
- In another embodiment of the data management unit or trend indicating method the second mean value is the arithmetic mean value of the measurement values of the second group which is an easily computable mean value for a smaller number of measurement values. Alternatively, a geometric mean value or a harmonic mean value may be used.
- In another embodiment of the data management unit or trend indicating method the data storage further stores a relative tolerance range of the second mean value, preferably 15% or 20% or 25% of the second mean value, wherein the trend indicator is adapted to indicate one predefined of the different trend categories, for example the steady trend, if the result of the comparison is within the relative tolerance range, preferably if the second mean value is greater than a predefined low limit. The advantage of providing a tolerance range is that otherwise the indicated trend would be confusing, for example by changing too frequently. The aim of the data management is to be on the safe side for the patient. Further, the definition of the relative tolerance range is more useful if the most recent second mean value is above a predefined low limit. In case the second mean value is below the low limit the relative tolerance range value would be too small.
- In an example embodiment of the data management unit or trend indicating method the data storage further stores an absolute tolerance range, wherein the trend indicator is adapted to indicate one predefined of the different trend categories, for example the steady trend, if the result of the comparison is within the absolute tolerance range, preferably if the second mean value is less than or equal the predefined low limit. Preferably, if the second mean value is so small that it is below or equal to the predefined low limit it is useful to define an absolute tolerance range in order to prevent confusing up and down change of the trend indication.
- For a fasting blood glucose trend calculation the predefined low limit may be chosen between 100 mg/dl and 150 mg/dl, preferably at 125 mg/dl.
- In another embodiment of the data management unit or trend indicating method the second time interval encompasses the present day so that the trend calculation is as up-to-date as possible.
- In another embodiment of the data management unit or trend indicating method the first time interval and the second time interval do not overlap so that the first mean value and the second mean value are calculated based on fully different measurement values. Otherwise the one or more measurement values of the overlapping time interval would be weighted more than the other measurement values.
- In another embodiment of the data management unit or trend indicating method the processor interacts with the trend indicator such that in case the first time interval encompasses less than a predefined first number limit of measurement values and/or the second time interval encompasses less than a predefined second number limit of measurement values the trend indicator does not indicate the one of the different trend categories, for example the increasing trend, the steady trend and the decreasing trend, in this case preferably the trend indicator is adapted to indicate an error as there are not enough measurement values to provide a good statistics. With regard to the fasting blood glucose level as the physiological parameter the first number limit is 5 or more, preferably 7 or 9, and the second number limit is 2, 3 or 5, also dependent on the definition of the first number limit.
- In another embodiment of the data management unit or trend indicating method the trend indicator is adapted to show on the display an up arrow as the increasing trend sign, a down arrow as the decreasing trend sign and a horizontal arrow as the steady trend sign. These signs are easy to understand for the user/patient.
- In another embodiment of the data management unit or trend indicating method the data storage is further adapted to store an associated event tag for each measurement value in order to further categorize the measurement values, and the event tag is considered additionally for selection of the first group of measurement values and the second group of measurement values from the plurality of measurement values. For example blood glucose measurement values could be categorized as fasting blood glucose measurement value, as a pre-meal blood glucose measurement value or a past-meal blood glucose measurement value, or as a measurement value of a control solution or with a no-tag. By using such an event tag it can be guaranteed that only (the mean values of) the measurement values of the same category, e.g. the fasting blood glucose measurement values, are compared.
- For the same reason as explained above the above problem is solved by a computer program for indicating a trend within a plurality of measurement values of a physiological parameter stored in a storage, wherein each measurement value is stored with an associated time stamp, the computer program comprising:
- code for selecting a first group of measurement values and a second group of measurement values from the plurality of measurement values such that the associated time stamp of the measurement values of the first group encompasses a predefined first time interval and the associated time stamp of the measurement values of the second group encompasses a predefined second time interval, wherein the second time interval is more recent than the first time interval,
- code for calculating a first mean value as a median from the first group of measurement values,
- code for calculating a second mean value from the second group of measurement values, and
- code for indicating one of the different trend categories, for example an increasing trend, a steady trend or a decreasing trend, preferably as a respective visible sign on a display and/or as a respective audible signal by a loudspeaker, based at least in part on a result of a comparison of the second mean value to the first mean value.
- The above computer program may be realized with the embodiments as mentioned above with regard to the inventive trend indicating method.
- The above problem is further solved by a computer program product comprising a computer-readable medium bearing computer program code embodied therein for use with a computer, wherein the computer program code comprises the above mentioned computer program.
- The above-mentioned advantages as well as other advantages of various aspects of the present invention will become apparent to those of ordinary skill in the art by reading the following detailed description with the explanation of the accompanying drawings. All features described above and below and/or illustrated per se or in any combination form the subject-matter of the invention, independent of their inclusion in the claims or their back-reference. Exemplary embodiments of the present invention are described herein with reference to schematic drawings, in which
- Figure 1
- shows the medical device according to a preferred embodiment of the invention in a perspective view;
- Figure 2
- shows a diagram of the medical device as shown in
Figure 1 ; - Figure 3
- a first example of the display of the medical device as shown in
Figure 1 in a "Logbook" mode; - Figure 4
- a second example of the display of the medical device as shown in
Figure 1 in a "Logbook" mode; - Figure 5
- further examples of tag signs as they are displayed on a display of the medical device as shown in
Figure 1 ; - Figure 6
- a flow diagram containing a procedure realized by the inventive medical device in the "Measure BG" mode;
- Figure 7
- another flow diagram comprising an embodiment of the inventive method for indicating a trend; and
- Figure 8
- an inventive system comprising a case and the medical device according to
Figure 1 in a top view, wherein the case is in an open state. - The following paragraphs will describe various embodiments of the invention. For exemplary purpose only, the embodiments are outlined in relation to a medical device supporting health control and the trend indication method with regard to blood glucose level measurement, in particular with regard to fasting blood glucose level measurement. However, the used terminology and the description of the embodiments with respect to the medical device or health indicating method are not intended to limit the principles and ideas of the invention to such a single device or method and may be adapted to other physiological values accordingly.
-
Figure 1 is a schematic drawing andFigure 2 is a schematic diagram of themedical device 100 according to a preferred embodiment of the invention. Preferably, themedical device 100 comprises a bloodglucose measurement unit 110, which is arranged to measure the blood glucose level. Further, themeasurement unit 110 comprises an interface and aslot 112 for inserting a test strip. - The blood
glucose measurement unit 110 is connected to a receivingunit 120, which is arranged to forward e.g. blood glucose measurement data received from bloodglucose measurement unit 110 to a data storage 130 (storage unit or means) or memory, such as a Flash memory. Alternatively, the receivingunit 120 may retrieve stored data such as e.g. blood glucose value data from thestorage 130 and forward it to a processor 140 (processing unit or means), such as a microcontroller or microprocessor, a digital signal processor, and / or the like. Alternatively, the receivingunit 120 directly forwards the blood glucose value data received from the bloodglucose measurement unit 110 to theprocessor 140. - Receiving
unit 120 is further connected to auser input unit 150 of a user interface. Theuser input unit 150 is arranged to receive input from the user of themedical device 100 for example bykey 151, confirmation key (OK button) 152, key 153 for scrolling down (downward button) andkey 154 for scrolling up (upward button). The user input data are forwarded from theuser input unit 150 to the receivingunit 120, which either forwards it to theprocessor 140 or to thedata storage 130. - Furthermore, the user interface of
medical device 100 comprises adisplay unit 160 with adisplay 162, which is connected to the receivingunit 120 as well. Preferably, thedisplay unit 160 receives data to be displayed by thedisplay 162 from the receivingunit 120 or theprocessor 140. - Preferably, the
medical device 100 additionally comprises afurther interface 170, for example a wired interface such as a serial port, a Universal Serial Bus (USB) interface, a mini-USB interface, or a wireless interface such as an infrared (e.g. an IRDA) interface, a Bluetooth™ interface, and / or the like, in order to receive data and / or to transmit data. Theinterface 170 is preferably connected to the receivingunit 120 in order to receive data from the receivingunit 120 and/or to forward data to the receivingunit 120. - Additionally, the
medical device 100 comprises aclock unit 180 which provides a date and time information, preferably based on a clock generator, which may be displayed at thedisplay 162. Further, theclock unit 180 provides date and time information in particular for generating a time stamp for an associated blood glucose measurement. - As outlined above, the
medical device 100 preferably comprises a bloodglucose measurement unit 110. Preferably, the bloodglucose measurement unit 110 is arranged to measure the blood glucose level in the blood of e.g. the user by testing a drop of blood on a test strip that is inserted into theslot 112. The measurement may be made by e.g. an electrochemical method or an optical method. Full insertion of the test strip in theslot 112 may be detected by a respective sensor. The measured blood glucose value is transformed to blood glucose value data and forwarded preferably immediately or on demand to the receivingunit 120. Alternatively, the bloodglucose measurement unit 110 is arranged to measure the blood glucose level of the user via infrared diagnosis or an alternative contactless measurement method. - According to a further alternative (not depicted in
Figure 1 ) the bloodglucose measurement unit 110 is implanted in the body of the user of the medical device and forwards the data to the receivingunit 120 either via a wired connection or via a wireless connection. In an embodiment, such an implanted bloodglucose measurement unit 110 is a continuous measurement sensor e.g. based on a chip which may allow a continuous closed loop control. In the latter case the medical device comprises two parts, one part contains themeasurement unit 110 and the other part the remaining units of the medical device. The bloodglucose measurement unit 110 preferably forwards the blood glucose measurement value data to the receivingunit 120 viainterface 170. According to a further alternative the medical device does not comprise a blood glucose measurement unit which measures the blood glucose values, but receives blood glucose value data from an external unit. - The measurement of the blood glucose measurement is preferably triggered by the receiving
unit 120 which sends a respective signal to the bloodglucose measurement unit 110. According to one preferred alternative the receivingunit 120 receives a trigger signal generated by user input which is received viauser input unit 150 or based on a signal from theslot 112 detecting a test strip. Alternatively, the trigger signal is generated automatically by theclock unit 180 or by theprocessor 140. - Preferably, the receiving
unit 120 is represented e.g. by the input ports and output ports of a microprocessor or a bus system managing the data handling between several functional units. This includes bus systems, such as e.g. Advanced Microprocessor Bus Architecture bus systems implemented in a microprocessor or external bus systems connected to a microprocessor. Via the receivingunit 120, data are retrieved from thedata storage 130 on demand and forwarded to theprocessor 140, to thedisplay unit 160 or to theinterface 170. Moreover, the receivingunit 120 forwards control signals, such as trigger signals or control signals e.g. to the bloodglucose measurement unit 110, thedisplay unit 160 or theinterface 170. - The
data storage 130 is arranged to store data entered via theuser input unit 150, a plurality of blood glucose measurement data received from the bloodglucose measurement unit 110 together with the time stamp and/or at least one event tag associated to each measurement data, data calculated from the plurality of blood glucose measurement values processed by theprocessor 140 and/or data received viainterface 170. - Further the
data storage 130 stores parameter data like an associated time range for tagging preselection regarding for example a fasting tag, a pre-meal tag or a post meal tag. Preferably such a time range is defined using a center time and a duration, wherein the time range comprises the time around the center time with the size of 1/2 duration in both directions. For example, the time range for fasting tagging preselection is defined with a duration of 2 hours and a center time at 7 a.m., so that the time range for fasting tagging preselection encompasses the time between 6 a.m. and 8 a.m. - Additionally, for example the
data storage 130 stores the following preset time ranges for preand post-meal times, preferably for tagging preselection: - pre-meal breakfast: 5:00 a.m. to 8:59 a.m.
- post-meal breakfast: 9:00 a.m.to 10:59 a.m.
- pre-meal lunch: 11:00 a.m. to 11:59 a.m.
- post-meal lunch: 12:00 p.m. to 3:59 p.m.
- pre-meal supper: 4:00 p.m. to 6:59 p.m.
- post-meal supper: 7:00 p.m. to 8:59 p.m.
- night time or bedtime: 9:00 p.m. to 11:59 p.m.
- Mealtime and fasting time ranges may be settable by the user "Settings" mode of the medical device.
- Furthermore,
data storage 130 is arranged to provide the stored data to theprocessor 140, to thedisplay unit 160 and/or to theinterface 170. Thedata storage 130 is preferably implemented as a semiconductor memory such as a Flash memory. Alternatively, it is implemented as a hard disk memory or an on-chip memory of theprocessor 140. - The
processor 140 is preferably a microprocessor or any other functional unit capable of processing data. - The
user input unit 150 is preferably implemented as a keyboard comprising one ormore push buttons display 162. Alternatively, theuser input unit 150 is a key board or a touch screen. Alternatively, theuser input unit 150 comprises a microphone for receiving speech input so that data can be entered via speech input. - After a blood glucose measurement a tag may be associated to the measurement value referring to lifestyle data by pressing the up or down
keys - The
display unit 160 preferably comprises an LCD orLED display 162. Preferably, the display displays a number of alphanumerical characters so that e.g. the presently measured blood glucose value can be displayed together with additional instructions for the user. Alternatively or additionally, thedisplay unit 160 comprises a graphic display in order to display graphs or graphics such as icons. Further the display of thedisplay unit 160 may comprise a touchscreen. - The
display unit 160 further may also show a trend indicator 164 (trend indicating unit or means) which is adapted to indicate different trend categories, for example an increasing trend, a steady trend and a decreasing trend, symbolized e.g. as an arrow pointing up, anhorizontal arrow 201 and an arrow pointing down 202, respectively, at the display 162 (seeFigures 3 and4 ). Alternatively or additionally, the trend may be communicated by a loud speaker, wherein the increasing trend may be represented by a tone with an increasing pitch, the steady trend by a tone with a constant pitch and the decreasing trend by a tone with a decreasing pitch. - The
interface 170 is preferably a wireless interface, such as IRDA, Bluetooth™, GSM, UMTS, ZigBee, or WI-FI, etc. Alternatively, the interface is a wired interface, such as a USB port, mini-USB port, serial data port, parallel data port, etc., for receiving and transmitting data. In a further alternative embodiment themedical device 100 does not comprise aninterface 170. - According to another alternative embodiment,
medical device 100 comprises a memory card reader or a memory card reader interface. The memory card reader is preferably adapted to read information from a memory card, such as a Flash memory card, or any type of SIM card. For this purpose, the memory card comprises a memory, wherein at least one of a selected algorithms together with corresponding parameters, a history of the blood glucose values and / or insulin doses administered, etc. is stored. Thus, in the case that themedical device 100 has a defect, the relevant data may still be stored on the memory card which can be easily removed from the memory card reader of themedical device 100 and transferred to a newmedical device 100. Moreover, thememory card 100 may be used in order to provide information on the history of the treatment to e.g. an HCP. - In the case that the memory card is a SIM card providing subscriber identification for a mobile communication network and the
interface unit 170 is additionally a mobile communication interface, additional functions of themedical device 100 can be unlocked by the provider of the SIM card via a telecommunication channel. This offers the possibility that themedical device 100 can communicate with other telecommunication devices via predefined channels, such as UMTS or GSM. Via the international mobile subscriber identity, also called IMSI, stored in the SIM card, themedical device 100 identifies itself within the network and, thus, can be addressed via the network. In such a case themedical device 100 can be easily checked, remote controlled, updated, monitored, etc., viainterface unit 170, e.g. by addressing the mobile communication unit with a phone number. - Furthermore, the
medical device 100 is able to transmit data via SMS, e-mail or via mobile internet connection. Moreover, this offers the possibility to locate themedical device 100 in an emergency case. - In the case that the blood
glucose measurement unit 110 is a continuous sensor which is e.g. implanted a dose delivery unit with an insulin pump forming an automatic delivery system may be additionally provided. - As shown in
Figure 6 , themedical device 100 is capable to perform a number of operating processes. According to a preferred alternative after switching on, e.g. by pressing a key 151, 152, 153 or 154, preferably theconfirmation key 152 for a predetermined time, or detection of a test strip within theslot 112, themedical device 100 performsinitialization step 310 for initializing the functional components of themedical device 100. After this, the different operation modes which are implemented in themedical device 100, are displayed in thedisplay step 320, preferably operation modes such as "Measure BG", "Logbook" and/or "Settings". - In
step 330 the user selects one of the displayed operation modes via theuser input unit 150, for example by means of thekeys confirmation key 152. - In
step 340 the selected operation mode is executed. As an example the mode "Measure BG" is selected for executing a blood glucose measurement. Upon execution of this mode the user/patient is requested to provide a test strip with a blood sample. - In the "Logbook" mode the history of previous measurements and statistical results may be calculated and displayed. The "Settings" mode allows the user to define and change some parameters of the
medical device 100. - After selecting the mode "Measure BG", in step 350 a drop of blood is applied to the test portion of the test strip which is inserted in
slot 112 of themedical device 100. - According to an alternative version of the operation process steps 310 to 340 may be skipped in the case that a specific operation mode is preselected. In this case, after initialization, the preselected operation mode, which is either preselected by the user or automatically selected in accordance with a specific event, for example the detection of a fully inserted test strip in
slot 112, the operating process proceeds with the followingstep 350 and asks the user to apply a drop of blood. Instep 360 it executes the preselected one or more operation modes, for example the mode "Measure BG". - Now in
step 360 themeasurement unit 110 determines e. g. by an electrochemical method the blood glucose level and displays the respective measurement value at thedisplay 162. In thenext step 370 theclock unit 180 generates the time stamp of the present measurement comprising a date and time information. The time stamp is also displayed indisplay 162 and both, the present blood glucose measurement value and the associated time stamp is transferred by receivingunit 120 to thedata storage 130. - In the
next step 380 theprocessor 140 compares the time stamp of the present blood glucose measurement value with the time ranges of the events stored in thedata storage 130 which events may be selected as the associated event tag. If the time stamp of the present measurement value, in particular the time information of the time stamp, lies within the current time range of e. g. the fasting event automatically the fasting tag is provided for confirmation by the user and displayed with arespective sign 168, for example a struck out, empty apple, atdisplay 162. In order to show that a confirmation is necessary thetag sign 168 displayed ondisplay 162 is blinking/flashing. Now, the user may confirm the fasting tag for example by pressing theconfirmation key 152. Alternatively, the user may change the tag using the up and downkeys confirmation key 152. By confirmation of the tag with theconfirmation key 152 the flashing of the displayed tag sign is stopped and the tag sign is displayed continuously without blinking. In this state, pressing the up/downkeys processor 140 initiates storage of the associated, confirmed tag with regard to the recent measurement value in thedata storage 130 via receivingunit 120. - If in
step 380 theprocessor 140 cannot find any range for tagging pre-selection which refers to the time information of the time stamp of the present measurement value, the no-tag is preselected. - After pressing the
confirmation key 152, if the user presses the confirmation key again, the tag will start flashing again and pressing the up/down key will again allow the user to change the tag as explained above. - Further, in the "Logbook" mode the user is allowed to change the tag in the above explained manner but only within a predefined time range from the associated time stamp of the blood glucose measurement value, for example within 10 days.
- If the time stamp of the recent measurement value falls within the current time range for tagging pre-selection and there is already a measurement value in that day marked as fasting the fasting tag is not automatically displayed and not selectable and therefore may not be associated to the recent measurement value.
- Further, if, for example the fasting time range for tagging preselection overlaps with, for example the time range for pre-meal breakfast, the fasting tag has priority over the pre-meal tag. Hence, in this case, if no fasting value is recorded for that day, the fasting tag is automatically preselected if the time stamp of the present measurement value lies within the time range for the fasting tag and the time range for pre-meal breakfast.
- In another embodiment a flashing tag may not only be confirmed by the user by pressing the
confirmation key 152 but also by removal of the strip from theport 112 after a blood glucose test, or when the medical device goes into sleep mode. - In the next optional step 390 a comment to the present measurement value may be selected by the user using the up and down
keys confirmation key 152, wherein the chosen comment is then stored in thedata storage 130 associated to the present measurement value as well. - In
step 400 after each measurement (and finishing tagging in step 380) theprocessor 140 compares whether the time information of the time stamp of the last e.g. three consecutive measurement values tagged with the same event tag, for example with the fasting tag, including, if applicable, the present measurement value are outside the current time range for tagging pre-selection of the fasting event in the same direction. If not all three associated time stamps are outside the current time range in the same direction the current time range for tagging preselection of the fasting tag stored in thedata storage 130 is not changed. If theprocessor 140 detects that all three time stamps of the three consecutive previous measurement values tagged with the fasting tag are outside the current time range in the same direction (i.e. all three time stamps exceeds the time range above or below) the time range is shifted. Therefore, the arithmetic mean value of the time information of the three time stamps is calculated and used as the new center time for the time range for tagging pre-selection of the fasting tag. The duration of the time range may stay the same. - For example, the time information of the time stamps of the recent 3 measurement values comprising the fasting tag are 8:10 a.m., 8:27 a.m. and 8:23 a.m. and the present time range for fasting tag preselection refers to a center time at 7 a.m. and a duration of 2 hours. Then, in
step 400 theprocessor 140 determines that all time information is outside the current time range for fasting tag preselection in the same direction. In this case the time range for fasting tagging preselection is changed to a center time at 8:20 a.m. which is the arithmetic mean value of the three time stamps. This new current time range center value is then stored in thedata storage 130. Hence, the time range now is between 7:20 a.m. and 9:20 a.m., as the duration is not changed, so that if the user now measures a blood glucose value within this time range automatically the fasting tag sign is displayed after finishing measurement for user confirmation. - The above explained method to adjust the time range for fasting tag preselection provides a comfortable way to cope with the user's/patient's needs and to ease the tagging procedure. Hence, correct tagging is supported by the above procedure.
- The above explained adjustment may be analogously used with other tags and respective time ranges as well.
- When the
medical device 100 is in the "Measure BG" mode, the device may turn into the sleep state automatically after for example 120 seconds without any new action. Once the device has returned a new measurement value, the device turns to the sleep state automatically after for example 60 seconds without any user interaction. - As explained above the
medical device 100 provides at least one memory review mode which is called "Logbook" mode. The respective display and calculations are explained in the following. - The "Logbook" mode is entered when the user activates the
medical device 100 by pressing e.g. theconfirmation button 152. Then a display as depicted inFigures 3 and4 is shown. - In the "Logbook" the measurement values preferably are preferably displayed in the order in which the entries are entered into the device, or alternatively according to the time and date assigned to the measurement values. In particular the most recent blood glucose measurement value is shown upon entry into the "Logbook" mode. Pressing the up and down
keys down key 153 the user may scroll backwards in time and by pressing theup key 154 the user scrolls forward in time. - Examples of a
display 162 showing a measurement value are shown inFigures 3 and4 . The user knows from the "Book"sign 165 in the lower left corner of the display that he/she has entered the "Logbook" mode. - The
display 162 in the "Logbook" mode further shows the bloodglucose measurement value 166 as biggest number in the center of the screen. Above themeasurement value 166 the associatedtime stamp 167 including date and time is displayed. On the right side the associated tag as asign 168 is provided, wherein the sign may show for example an empty, struck out apple as shown inFigures 3 and4 in case of an associated fasting tag, a full apple as shown inFigure 5b ) in case of an associated pre-meal tag, a bitten apple as shown inFigure 5c ) in case of an associated post-meal tag or a struck out circle as shown inFigure 5a ) in case of an associated no-tag. Additionally, in the lower right corner of thedisplay 162 themeasurement unit 169 for the blood glucose value is provided. - The upper left corner of the
display 162 in the "Logbook" mode shows a sign representing a trend for fasting blood glucose values controlled by thetrend indicator 164 which is activated in the "Logbook" mode. Thetrend indicator 164 shows the trend of the respective fasting blood glucose measurement value using an arrow pointing up, an arrow pointing horizontally 201 (seeFigure 3 ) or an arrow pointing down 202 (seeFigure 4 ). - The operating process of the
medical device 100 for trend indication is explained in the following and is depicted inFigure 7 . - For each fasting measurement value the
processor 140 selects instep 410 via the receivingunit 120 from the data storage 130 a second group of measurement values containing the fasting tag of the recent e.g. three days, for example the fasting measurement values of the present day and the two days before (days 0, -1 and -2), wherein at least two fasting measurement values within the three day period must be available. If less than two fasting measurement values, i.e. only one fasting measurement value, within the three day period is available the procedure moves to step 415 and thetrend indicator 164 does not calculate and display a respective trend arrow and thedisplay 162 stays empty in the upper left corner or shows an error sign. - Then, in
step 420 the arithmetic mean value is determined from these 3 or 2 fasting measurement values as the second mean value CURR_FAST_AVG. - Further in
step 430, theprocessor 140 selects from thedata storage 130 via the receiving unit 120 a first group of measurement values based on the associated time stamp comprising seven days before the recent three days, i.e. three days to nine days prior the recent fasting measurement value (days -3 to -9), wherein at least a first number limit of for example 5 fasting measurement values within the seven day period must be available. Otherwise, the procedure moves to step 415 and theprocessor 140 does not calculate a trend and thetrend indicator 164 does not display any trend arrow or shows an error sign. - In
step 440, if there are enough fasting measurement values, from the fasting measurement values of the first group the median is determined as a first mean value PAST_FAST_MED. - Now, in the
next step 450 the trend is calculated and displayed using respective arrows in the following way. - If the second mean value CURR_FAST_AVG is greater than a low limit of 125 mg/dl and the difference between the second mean value and the first mean value is greater than 20% of the second mean value (corresponding to a relative tolerance range), i.e.

display 162. - Also, the fasting trend up arrow is displayed on the
display 162 if the second mean value CURR_FAST_AVG is less than or equal the low limit of 125 mg/dl and the difference between the second mean value and the first mean value is greater than 25 mg/dl (corresponding to an absolute tolerance range), i.e.
- If the second mean value CURR_FAST_AVG is greater than the low limit 125 mg/dl and the difference between the first mean value and the second mean value is greater than 20% of the second mean value (corresponding to the relative tolerance range), i.e.

the fasting trend downarrow 202 is displayed on thedisplay 162. - Also, the fasting trend down
arrow 202 is displayed on thedisplay 162 if the second mean value CURR_FAST_AVG is less than or equal the low limit of 125 mg/dl and the difference between the first mean value and the second mean value is greater than 25 mg/dl (corresponding to an absolute tolerance range), i.e.
- If there is a valid calculation, i.e. at least two fasting measurement values in the second group and at least 5 fasting measurement values in the first group of measurement values, in all other cases the fasting trend
steady arrow 201 is displayed by thetrend indicator 164 at thedisplay 162. - The fasting trend arrows showing in upward, downward or horizontal direction are easy to understand for the patient and provide a reliable and descriptive assessment of the fasting blood glucose value development over a time range of about 1.5 weeks.
- In an example embodiment,
device 100 may be realized as a two-part device, wherein thedata storage 130, the receivingunit 120, theprocessor 140, theuser input unit 150, thedisplay unit 160 with thetrend indicator 164, theinterface unit 170, and theclock unit 180 are realized as a software program (application or "app") to run on the hardware of a smartphone. Thekeys -
Figure 8 shows acase 500 for a medical device in an open state comprising themedical device 100, abox 502 with test strips and alancet 504. In the example embodiment ofFigure 8 , thecase 500 is made of a textile material. In an alternative embodiment, the case may be made of a plastic material, a leather material, a combination of any of these materials, and/or the like. Themedical device 100, thebox 502 and thelancet 504 are fixed to left side thecase 500 by means offlexible straps 505 so that each of these elements may be easily removed from thecase 500. - On the left side of the case
several flash cards 506 are fixed hingedly by tworings 508 to thecase 500. Eachring 508 may be opened so that one card ormore cards 506 may be removed from thecase 500. Eachflash card 506 provides important information to the user/patient like explanations and pictures with regard to the buttons, the display, the symbols of the display and their meaning, or the operation of themedical device 100, for example how to tag a measurement value. Theflash card 506 provides such information on the front side, but may also provide information on the back side. In order to access the information printed on the backside of eachcard 506 it may be hinged down (pivoted around the axis of ring 508) by the patient/user so that the backside information is visible. Therefore, the information on the backside is inversely printed so that it is easily readable when the card is hinged down as it is shown inFig. 8 . For easy orientation eachflash card 506 may be marked at a top area with a different color. Thering 508 further has the advantage that the card is still fixed to the case when the patient/user reads the backside so that the card cannot get lost. In the state where allflash cards 506 are pivoted such that they are positioned fully within thecase 500 the case may be closed using thezipper 510. In the closed state of thecase 500 the interior is well protected against environmental impact.
Claims (24)
- A data management unit for supporting health control comprising• a data storage (130) adapted to store a plurality of measurement values of a physiological parameter, for example the fasting blood glucose level, and for each measurement value an associated time stamp, and• a trend indicator (164), wherein the trend indicator is adapted to indicate different trend categories, for example an increasing trend, a steady trend and a decreasing trend, preferably as a respective visible sign (201, 202) on a display (162) and/or as a respective audible signal by a loudspeaker,• a processor (140) adapted to select a first group of measurement values and a second group of measurement values from the plurality of measurement values of the data storage (130) such that the associated time stamp of the measurement values of the first group encompasses a predefined first time interval and the associated time stamp of the measurement values of the second group encompasses a predefined second time interval, wherein the second time interval is more recent than the first time interval, wherein the processor is further adapted to calculate a first mean value as a median from the first group of measurement values and a second mean value from the second group of measurement values,
wherein the processor (140) interacts with the trend indicator (164) such that the trend indicator (164) indicates one of the different trend categories, for example the increasing trend, the steady trend or the decreasing trend, based at least in part on a result of a comparison of the second mean value to the first mean value. - The data management unit according to claim 1, wherein the first time interval is larger than the second time interval, preferably the first time interval encompasses seven days and the second time interval three days.
- The data management unit according to any of the preceding claims, wherein the second mean value is the arithmetic mean value of the measurement values of the second group.
- The data management unit according to any of the preceding claims, wherein the data storage (130) further stores a relative tolerance range of the second mean value, preferably 15% or 20% or 25% of the second mean value, wherein the trend indicator (164) is adapted to indicate one predefined of the different trend categories, for example the steady trend, if the result of the comparison is within the relative tolerance range, preferably if the second mean value is greater than a predefined low limit.
- The data management unit according to any of the preceding claims, wherein the data storage (130) further stores an absolute tolerance range, wherein the trend indicator (164) is adapted to indicate the steady trend if the result of the comparison is within the absolute tolerance range, preferably if the second mean value is less than or equal the predefined low limit.
- The data management unit according to any of the preceding claims, wherein the second time interval encompasses the present day.
- The data management unit according to any of the preceding claims, wherein the first time interval and the second time interval do not overlap.
- The data management unit according to any of the preceding claims, wherein the processor (140) interacts with the trend indicator (164) such that in case the first time interval encompasses less than a predefined first number limit of measurement values and/or the second time interval encompasses less than a predefined second number limit of measurement values the trend indicator (164) does not indicate the one of the different trend categories, for example increasing trend, the steady trend and the decreasing trend, in this case the trend indicator is adapted to indicate an error.
- The data management unit according to any of the preceding claims, wherein the trend indicator (164) is adapted to show on the display (162) an up arrow as the increasing trend sign, a down arrow (202) as the decreasing trend sign and a horizontal arrow (201) as the steady trend sign.
- The data management unit according to any of the preceding claims, wherein the data storage is further adapted to store an associated event tag for each measurement value and the event tag is considered for a selection of the first group of measurement values and the second group of measurement values from the plurality of measurement values.
- A method for indicating a trend within a plurality of measurement values of a physiological parameter stored in a data storage (130), wherein each measurement value is stored with an associated time stamp, comprising• selecting a first group of measurement values and a second group of measurement values from the plurality of measurement values such that the associated time stamp of the measurement values of the first group encompasses a predefined first time interval and the associated time stamp of the measurement values of the second group encompasses a predefined second time interval, wherein the second time interval is more recent than the first time interval,• calculating a first mean value as a median from the first group of measurement values,• calculating a second mean value from the second group of measurement values, and• indicating one of different trend categories, for example of an increasing trend, a steady trend and a decreasing trend, preferably as a respective visible sign (201, 202) on a display (162) and/or as a respective audible signal by a loudspeaker, based at least in part on a result of a comparison of the second mean value to the first mean value.
- The method according to claim 11, wherein the first time interval is larger than the second time interval, preferably the first time interval encompasses seven days and the second time interval three days.
- The method according to any of the claims 11 to 12, wherein the second mean value is calculated as the arithmetic mean value of the measurement values of the second group.
- The method according to any of the claims 11 to 13, wherein one predefined of the different trend categories, for example the steady trend, is indicated if the result of the comparison is within a relative tolerance range of the second mean value, preferably if the second mean value is greater than a predefined low limit.
- The method according to any of the claims 11 to 14, wherein one predefined of the different trend categories, for example the steady trend, is indicated if the result of the comparison is within an absolute tolerance range, preferably if the second mean value is equal or less than the predefined low limit.
- The method according to any of the claims 11 to 15, wherein the second time interval encompasses the present day.
- The method according to any of the claims 11 to 16, wherein the first time interval and the second time interval do not overlap.
- The method according to any of the claims 11 to 17, wherein in case the first time interval encompasses less than a predefined first number limit of measurement values and/or the second time interval encompasses less than a predefined second number limit of measurement values the increasing trend sign, the steady trend sign and the decreasing trend sign are not indicated, in this case an error is indicated.
- The method according to any of the claims 11 to 18, wherein an up arrow as the increasing trend sign, a down arrow (202) as the decreasing trend sign and a horizontal arrow (201) as the steady trend sign is shown on the display (162).
- The method according to any of the claims 11 to 19, wherein an event tag is considered for selection of the first group of measurement values and the second group of measurement values from the plurality of measurement values, wherein each measurement value is stored with an associated event tag in the storage (130).
- A computer program for indicating a trend within a plurality of measurement values of a physiological parameter stored in a storage (130), wherein each measurement value is stored with an associated time stamp, the computer program comprising:• code for selecting a first group of measurement values and a second group of measurement values from the plurality of measurement values such that the associated time stamp of the measurement values of the first group encompasses a predefined first time interval and the associated time stamp of the measurement values of the second group encompasses a predefined second time interval, wherein the second time interval is more recent than the first time interval,• code for calculating a first mean value as a median from the first group of measurement values and a second mean value from the second group of measurement values,• code for indicating one of different trend categories, for example an increasing trend, a steady trend and a decreasing trend, preferably as a respective visible sign on a display (162) and/or as a respective audible signal by a loudspeaker, dependent on a result of a comparison of the second mean value to the first mean value.
- A computer program product comprising a computer-readable medium bearing computer program code embodied therein for use with a computer, wherein the computer program code comprises the computer program according to claim 21.
- A medical device (100) for supporting health control, the device comprising the data management unit according to any of the claims 1 to 10.
- A system comprising the medical device (100) according to claim 23 and a case (500) adapted to carry and secure the medical device (100) and preferably a box (502) with test strips and/or a lancet (504), wherein the case comprises at least one flash card (506) containing information related to a use of the medical device (100), preferably with regard to the different trend categories or tags.
Priority Applications (8)
| Application Number | Priority Date | Filing Date | Title |
|---|---|---|---|
| EP13185396.2A EP2851823A1 (en) | 2013-09-20 | 2013-09-20 | Data management unit for supporting health control |
| ARP140103473A AR097698A1 (en) | 2013-09-20 | 2014-09-18 | HEALTH CONTROL SUPPORT DATA MANAGEMENT UNIT |
| PCT/EP2014/070004 WO2015040166A1 (en) | 2013-09-20 | 2014-09-19 | Data management unit for supporting health control |
| JP2016515370A JP6764784B2 (en) | 2013-09-20 | 2014-09-19 | Data management unit that supports health management |
| CN201480063259.9A CN105745654A (en) | 2013-09-20 | 2014-09-19 | Data management unit for supporting health control |
| US15/023,026 US10663452B2 (en) | 2013-09-20 | 2014-09-19 | Data management unit for supporting health control |
| EP14771310.1A EP3047411A1 (en) | 2013-09-20 | 2014-09-19 | Data management unit for supporting health control |
| HK16113770A HK1225468A1 (en) | 2013-09-20 | 2016-12-02 | Data management unit for supporting health control |
Applications Claiming Priority (1)
| Application Number | Priority Date | Filing Date | Title |
|---|---|---|---|
| EP13185396.2A EP2851823A1 (en) | 2013-09-20 | 2013-09-20 | Data management unit for supporting health control |
Publications (1)
| Publication Number | Publication Date |
|---|---|
| EP2851823A1 true EP2851823A1 (en) | 2015-03-25 |
Family
ID=49223645
Family Applications (2)
| Application Number | Title | Priority Date | Filing Date |
|---|---|---|---|
| EP13185396.2A Ceased EP2851823A1 (en) | 2013-09-20 | 2013-09-20 | Data management unit for supporting health control |
| EP14771310.1A Withdrawn EP3047411A1 (en) | 2013-09-20 | 2014-09-19 | Data management unit for supporting health control |
Family Applications After (1)
| Application Number | Title | Priority Date | Filing Date |
|---|---|---|---|
| EP14771310.1A Withdrawn EP3047411A1 (en) | 2013-09-20 | 2014-09-19 | Data management unit for supporting health control |
Country Status (7)
| Country | Link |
|---|---|
| US (1) | US10663452B2 (en) |
| EP (2) | EP2851823A1 (en) |
| JP (1) | JP6764784B2 (en) |
| CN (1) | CN105745654A (en) |
| AR (1) | AR097698A1 (en) |
| HK (1) | HK1225468A1 (en) |
| WO (1) | WO2015040166A1 (en) |
Families Citing this family (11)
| Publication number | Priority date | Publication date | Assignee | Title |
|---|---|---|---|---|
| CA2993830A1 (en) | 2015-08-07 | 2017-02-16 | Trustees Of Boston University | Glucose control system with automatic adaptation of glucose target |
| MA45527A (en) * | 2016-06-30 | 2019-05-08 | Novo Nordisk As | SYSTEMS AND METHODS FOR THE ANALYSIS OF INSULIN REGIME ADHESION DATA |
| CN106202944A (en) * | 2016-07-15 | 2016-12-07 | 鼎泰生物科技(海南)有限公司 | A kind of blood glucose meter user interface display control method and device |
| CN108073781A (en) * | 2016-11-16 | 2018-05-25 | 腾讯科技(深圳)有限公司 | Sign data display methods and device |
| EP3559838A1 (en) | 2016-12-23 | 2019-10-30 | Sanofi-Aventis Deutschland GmbH | Data management unit for supporting health control |
| DE112020003392T5 (en) | 2019-07-16 | 2022-05-19 | Beta Bionics, Inc. | BLOOD SUGAR CONTROL SYSTEM |
| WO2021011697A1 (en) | 2019-07-16 | 2021-01-21 | Beta Bionics, Inc. | Blood glucose control system |
| CA3151777A1 (en) * | 2019-10-04 | 2021-04-08 | Firas H. EL-KHATIB | Blood glucose control system |
| JP6876258B2 (en) * | 2019-11-05 | 2021-05-26 | 永健生技醫療器材有限公司eTouch Medical Inc. | Non-invasive blood glucose meter system and its method |
| US20220188388A1 (en) | 2020-12-07 | 2022-06-16 | Beta Bionics, Inc. | Ambulatory medicament pump with safe access control |
| CN116616787B (en) * | 2023-07-26 | 2023-09-22 | 苏州维伟思医疗科技有限公司 | Electrocardiogram data display method, terminal equipment and storage medium in wireless communication |
Citations (8)
| Publication number | Priority date | Publication date | Assignee | Title |
|---|---|---|---|---|
| WO2003057027A2 (en) | 2001-12-27 | 2003-07-17 | Medtronic Minimed, Inc. | System for monitoring physiological characteristics |
| US20080234992A1 (en) * | 2007-03-20 | 2008-09-25 | Pinaki Ray | Systems and methods for pattern recognition in diabetes management |
| US20080255707A1 (en) * | 2007-04-10 | 2008-10-16 | Hebblewhite Harry R | Method and system for categorizing blood glucose tests at test time in a portable device or later in a downloading program and then analyzing the categories separately |
| EP2256495A2 (en) * | 2004-06-03 | 2010-12-01 | Medtronic MiniMed, Inc. | System for monitoring physiological characteristics according to the user biological state |
| US7853455B2 (en) | 1992-11-17 | 2010-12-14 | Health Hero Network, Inc. | Remote health monitoring and maintenance system |
| WO2010149392A1 (en) | 2009-06-26 | 2010-12-29 | Roche Diagnostics Gmbh | Method, system, and computer program product for providing both an estimated true mean blood glucose value and estimated glycated hemoglobin (hba1c) value from structured spot measurements of blood glucose |
| WO2011007051A1 (en) | 2009-07-15 | 2011-01-20 | Mendor Oy | Measuring control method and arrangement |
| EP2486851A1 (en) | 2011-01-31 | 2012-08-15 | Roche Diagnostics GmbH | Display for biological values |
Family Cites Families (12)
| Publication number | Priority date | Publication date | Assignee | Title |
|---|---|---|---|---|
| JPS5969059A (en) | 1982-10-15 | 1984-04-19 | 松下電工株式会社 | Pulse meter |
| JP2003270241A (en) * | 2002-03-12 | 2003-09-25 | Omron Corp | Health care apparatus |
| ES2384558T3 (en) * | 2002-09-11 | 2012-07-06 | Becton Dickinson And Company | Blood glucose monitoring including convenient visual presentation of averages and measurement values |
| EP1735729A2 (en) | 2004-03-26 | 2006-12-27 | Novo Nordisk A/S | Device for displaying data relevant for a diabetic patient |
| WO2006021051A1 (en) | 2004-08-26 | 2006-03-02 | Luana Pty Ltd | Diabetes blood glucose test site cleaning kit |
| JP2010075354A (en) | 2008-09-25 | 2010-04-08 | Takenori Uchiyama | Blood capillary blood flow measurement apparatus, blood capillary blood flow measurement method, and program |
| JP2010082009A (en) | 2008-09-29 | 2010-04-15 | Terumo Corp | Blood sugar information processor, blood sugar information processing method, and blood sugar information processing program |
| US8597570B2 (en) | 2008-11-04 | 2013-12-03 | Panasonic Corporation | Measurement device, insulin infusion device, measurement method, method for controlling insulin infusion device, and program |
| CA2728831A1 (en) * | 2010-01-22 | 2011-07-22 | Lifescan, Inc. | Diabetes management unit, method, and system |
| US9041730B2 (en) * | 2010-02-12 | 2015-05-26 | Dexcom, Inc. | Receivers for analyzing and displaying sensor data |
| US8707392B2 (en) | 2010-10-15 | 2014-04-22 | Roche Diagnostics Operations, Inc. | Systems and methods for disease management |
| JP5654931B2 (en) | 2011-03-31 | 2015-01-14 | テルモ株式会社 | Blood sugar level measuring device, blood sugar level measuring method and program |
-
2013
- 2013-09-20 EP EP13185396.2A patent/EP2851823A1/en not_active Ceased
-
2014
- 2014-09-18 AR ARP140103473A patent/AR097698A1/en unknown
- 2014-09-19 CN CN201480063259.9A patent/CN105745654A/en active Pending
- 2014-09-19 EP EP14771310.1A patent/EP3047411A1/en not_active Withdrawn
- 2014-09-19 WO PCT/EP2014/070004 patent/WO2015040166A1/en active Application Filing
- 2014-09-19 JP JP2016515370A patent/JP6764784B2/en active Active
- 2014-09-19 US US15/023,026 patent/US10663452B2/en active Active
-
2016
- 2016-12-02 HK HK16113770A patent/HK1225468A1/en unknown
Patent Citations (11)
| Publication number | Priority date | Publication date | Assignee | Title |
|---|---|---|---|---|
| US7853455B2 (en) | 1992-11-17 | 2010-12-14 | Health Hero Network, Inc. | Remote health monitoring and maintenance system |
| US7904310B2 (en) | 1994-04-26 | 2011-03-08 | Health Hero Network, Inc. | Blood glucose monitoring system |
| WO2003057027A2 (en) | 2001-12-27 | 2003-07-17 | Medtronic Minimed, Inc. | System for monitoring physiological characteristics |
| EP2256495A2 (en) * | 2004-06-03 | 2010-12-01 | Medtronic MiniMed, Inc. | System for monitoring physiological characteristics according to the user biological state |
| EP2259057A1 (en) | 2004-06-03 | 2010-12-08 | Medtronic MiniMed, Inc. | System for monitoring physiological characteristics according to the user biological state |
| US20080234992A1 (en) * | 2007-03-20 | 2008-09-25 | Pinaki Ray | Systems and methods for pattern recognition in diabetes management |
| EP2031534A1 (en) | 2007-03-20 | 2009-03-04 | Lifescan, Inc. | Systems and methods for pattern recognition in diabetes management |
| US20080255707A1 (en) * | 2007-04-10 | 2008-10-16 | Hebblewhite Harry R | Method and system for categorizing blood glucose tests at test time in a portable device or later in a downloading program and then analyzing the categories separately |
| WO2010149392A1 (en) | 2009-06-26 | 2010-12-29 | Roche Diagnostics Gmbh | Method, system, and computer program product for providing both an estimated true mean blood glucose value and estimated glycated hemoglobin (hba1c) value from structured spot measurements of blood glucose |
| WO2011007051A1 (en) | 2009-07-15 | 2011-01-20 | Mendor Oy | Measuring control method and arrangement |
| EP2486851A1 (en) | 2011-01-31 | 2012-08-15 | Roche Diagnostics GmbH | Display for biological values |
Non-Patent Citations (1)
| Title |
|---|
| R. E. RATNER ET AL: "Less hypoglycemia with insulin glargine in intensive insulin therapy for type 1 diabetes. U.S. Study Group of Insulin Glargine in Type 1 Diabetes", DIABETES CARE, vol. 23, no. 5, 1 May 2000 (2000-05-01), pages 639 - 643, XP055113032, ISSN: 0149-5992, DOI: 10.2337/diacare.23.5.639 * |
Also Published As
| Publication number | Publication date |
|---|---|
| US10663452B2 (en) | 2020-05-26 |
| AR097698A1 (en) | 2016-04-06 |
| JP2016535606A (en) | 2016-11-17 |
| US20160224756A1 (en) | 2016-08-04 |
| JP6764784B2 (en) | 2020-10-07 |
| HK1225468A1 (en) | 2017-09-08 |
| EP3047411A1 (en) | 2016-07-27 |
| WO2015040166A1 (en) | 2015-03-26 |
| CN105745654A (en) | 2016-07-06 |
Similar Documents
| Publication | Publication Date | Title |
|---|---|---|
| US10663452B2 (en) | Data management unit for supporting health control | |
| EP3047412B1 (en) | Medical device and method operating same | |
| US20210030323A1 (en) | Systems, devices, and methods for meal information collection, meal assessment, and analyte data correlation | |
| WO2018132315A1 (en) | Systems, devices, and methods for experiential medication dosage calculations | |
| EP3047413B1 (en) | Data management unit and method operating same | |
| US20220000399A1 (en) | Systems, devices, and methods for meal information collection, meal assessment, and analyte data correlation | |
| US11017891B2 (en) | Titration of basal insulin with two modes | |
| CN102802522A (en) | Analyte testing method and system with safety warnings for insulin dosing | |
| CN102770868A (en) | Analyte testing method and system with high and low blood glucose trends notification | |
| EP3567594A1 (en) | Diabetes management system with dynamic selection of prediction logic | |
| US20160210430A1 (en) | Data management unit for supporting health control | |
| TWI668664B (en) | Method for dynamic analyzing blood sugar level, system thereof and computer program product | |
| TW201528018A (en) | Data management unit for supporting health control |
Legal Events
| Date | Code | Title | Description |
|---|---|---|---|
| PUAI | Public reference made under article 153(3) epc to a published international application that has entered the european phase |
Free format text: ORIGINAL CODE: 0009012 |
|
| 17P | Request for examination filed |
Effective date: 20130920 |
|
| AK | Designated contracting states |
Kind code of ref document: A1 Designated state(s): AL AT BE BG CH CY CZ DE DK EE ES FI FR GB GR HR HU IE IS IT LI LT LU LV MC MK MT NL NO PL PT RO RS SE SI SK SM TR |
|
| AX | Request for extension of the european patent |
Extension state: BA ME |
|
| STAA | Information on the status of an ep patent application or granted ep patent |
Free format text: STATUS: THE APPLICATION HAS BEEN REFUSED |
|
| 18R | Application refused |
Effective date: 20150420 |