EP2700357A1 - Concentration-measurement device and concentration-measurement method - Google Patents
Concentration-measurement device and concentration-measurement method Download PDFInfo
- Publication number
- EP2700357A1 EP2700357A1 EP12774805.1A EP12774805A EP2700357A1 EP 2700357 A1 EP2700357 A1 EP 2700357A1 EP 12774805 A EP12774805 A EP 12774805A EP 2700357 A1 EP2700357 A1 EP 2700357A1
- Authority
- EP
- European Patent Office
- Prior art keywords
- change amount
- relative change
- concentration
- temporal
- hemoglobin concentration
- Prior art date
- Legal status (The legal status is an assumption and is not a legal conclusion. Google has not performed a legal analysis and makes no representation as to the accuracy of the status listed.)
- Granted
Links
- 238000005259 measurement Methods 0.000 title claims abstract description 89
- 238000000691 measurement method Methods 0.000 title claims abstract description 40
- 230000008859 change Effects 0.000 claims abstract description 161
- 102000001554 Hemoglobins Human genes 0.000 claims abstract description 143
- 108010054147 Hemoglobins Proteins 0.000 claims abstract description 143
- 230000002123 temporal effect Effects 0.000 claims abstract description 137
- 238000007906 compression Methods 0.000 claims abstract description 78
- 230000006835 compression Effects 0.000 claims abstract description 76
- 238000000034 method Methods 0.000 claims abstract description 65
- 230000008569 process Effects 0.000 claims abstract description 55
- 238000001914 filtration Methods 0.000 claims abstract description 52
- 238000001514 detection method Methods 0.000 claims abstract description 49
- 230000000644 propagated effect Effects 0.000 claims abstract description 8
- 238000009499 grossing Methods 0.000 claims description 6
- 210000000038 chest Anatomy 0.000 description 69
- 210000003128 head Anatomy 0.000 description 30
- 239000000523 sample Substances 0.000 description 22
- 210000004556 brain Anatomy 0.000 description 15
- 239000008280 blood Substances 0.000 description 13
- 210000004369 blood Anatomy 0.000 description 13
- 206010007617 Cardio-respiratory arrest Diseases 0.000 description 11
- 208000010496 Heart Arrest Diseases 0.000 description 11
- 238000010586 diagram Methods 0.000 description 11
- 230000029058 respiratory gaseous exchange Effects 0.000 description 6
- 230000002269 spontaneous effect Effects 0.000 description 6
- QVGXLLKOCUKJST-UHFFFAOYSA-N atomic oxygen Chemical compound [O] QVGXLLKOCUKJST-UHFFFAOYSA-N 0.000 description 5
- 229910052760 oxygen Inorganic materials 0.000 description 5
- 239000001301 oxygen Substances 0.000 description 5
- 239000013307 optical fiber Substances 0.000 description 4
- 230000000694 effects Effects 0.000 description 3
- 210000001061 forehead Anatomy 0.000 description 3
- 230000006870 function Effects 0.000 description 3
- 210000001562 sternum Anatomy 0.000 description 3
- 230000017531 blood circulation Effects 0.000 description 2
- 230000003247 decreasing effect Effects 0.000 description 2
- 230000002349 favourable effect Effects 0.000 description 2
- 230000001121 heart beat frequency Effects 0.000 description 2
- 230000031700 light absorption Effects 0.000 description 2
- 238000002835 absorbance Methods 0.000 description 1
- 125000002015 acyclic group Chemical group 0.000 description 1
- 239000002390 adhesive tape Substances 0.000 description 1
- 238000006243 chemical reaction Methods 0.000 description 1
- 230000006872 improvement Effects 0.000 description 1
- 239000000463 material Substances 0.000 description 1
- 238000012986 modification Methods 0.000 description 1
- 230000004048 modification Effects 0.000 description 1
- 230000008450 motivation Effects 0.000 description 1
- 238000012845 near infrared spectroscopy analysis Methods 0.000 description 1
- 230000035945 sensitivity Effects 0.000 description 1
- 229920002379 silicone rubber Polymers 0.000 description 1
- 239000004945 silicone rubber Substances 0.000 description 1
- 238000004611 spectroscopical analysis Methods 0.000 description 1
- 230000000287 tissue oxygenation Effects 0.000 description 1
Images


Classifications
-
- A—HUMAN NECESSITIES
- A61—MEDICAL OR VETERINARY SCIENCE; HYGIENE
- A61B—DIAGNOSIS; SURGERY; IDENTIFICATION
- A61B5/00—Measuring for diagnostic purposes; Identification of persons
- A61B5/02—Detecting, measuring or recording pulse, heart rate, blood pressure or blood flow; Combined pulse/heart-rate/blood pressure determination; Evaluating a cardiovascular condition not otherwise provided for, e.g. using combinations of techniques provided for in this group with electrocardiography or electroauscultation; Heart catheters for measuring blood pressure
- A61B5/026—Measuring blood flow
- A61B5/0261—Measuring blood flow using optical means, e.g. infrared light
-
- A—HUMAN NECESSITIES
- A61—MEDICAL OR VETERINARY SCIENCE; HYGIENE
- A61B—DIAGNOSIS; SURGERY; IDENTIFICATION
- A61B5/00—Measuring for diagnostic purposes; Identification of persons
- A61B5/145—Measuring characteristics of blood in vivo, e.g. gas concentration, pH value; Measuring characteristics of body fluids or tissues, e.g. interstitial fluid, cerebral tissue
- A61B5/14535—Measuring characteristics of blood in vivo, e.g. gas concentration, pH value; Measuring characteristics of body fluids or tissues, e.g. interstitial fluid, cerebral tissue for measuring haematocrit
-
- A—HUMAN NECESSITIES
- A61—MEDICAL OR VETERINARY SCIENCE; HYGIENE
- A61B—DIAGNOSIS; SURGERY; IDENTIFICATION
- A61B5/00—Measuring for diagnostic purposes; Identification of persons
- A61B5/145—Measuring characteristics of blood in vivo, e.g. gas concentration, pH value; Measuring characteristics of body fluids or tissues, e.g. interstitial fluid, cerebral tissue
- A61B5/14546—Measuring characteristics of blood in vivo, e.g. gas concentration, pH value; Measuring characteristics of body fluids or tissues, e.g. interstitial fluid, cerebral tissue for measuring analytes not otherwise provided for, e.g. ions, cytochromes
-
- A—HUMAN NECESSITIES
- A61—MEDICAL OR VETERINARY SCIENCE; HYGIENE
- A61B—DIAGNOSIS; SURGERY; IDENTIFICATION
- A61B5/00—Measuring for diagnostic purposes; Identification of persons
- A61B5/145—Measuring characteristics of blood in vivo, e.g. gas concentration, pH value; Measuring characteristics of body fluids or tissues, e.g. interstitial fluid, cerebral tissue
- A61B5/1455—Measuring characteristics of blood in vivo, e.g. gas concentration, pH value; Measuring characteristics of body fluids or tissues, e.g. interstitial fluid, cerebral tissue using optical sensors, e.g. spectral photometrical oximeters
- A61B5/14551—Measuring characteristics of blood in vivo, e.g. gas concentration, pH value; Measuring characteristics of body fluids or tissues, e.g. interstitial fluid, cerebral tissue using optical sensors, e.g. spectral photometrical oximeters for measuring blood gases
- A61B5/14553—Measuring characteristics of blood in vivo, e.g. gas concentration, pH value; Measuring characteristics of body fluids or tissues, e.g. interstitial fluid, cerebral tissue using optical sensors, e.g. spectral photometrical oximeters for measuring blood gases specially adapted for cerebral tissue
-
- A—HUMAN NECESSITIES
- A61—MEDICAL OR VETERINARY SCIENCE; HYGIENE
- A61B—DIAGNOSIS; SURGERY; IDENTIFICATION
- A61B5/00—Measuring for diagnostic purposes; Identification of persons
- A61B5/68—Arrangements of detecting, measuring or recording means, e.g. sensors, in relation to patient
- A61B5/6801—Arrangements of detecting, measuring or recording means, e.g. sensors, in relation to patient specially adapted to be attached to or worn on the body surface
- A61B5/6813—Specially adapted to be attached to a specific body part
- A61B5/6814—Head
-
- A—HUMAN NECESSITIES
- A61—MEDICAL OR VETERINARY SCIENCE; HYGIENE
- A61B—DIAGNOSIS; SURGERY; IDENTIFICATION
- A61B5/00—Measuring for diagnostic purposes; Identification of persons
- A61B5/72—Signal processing specially adapted for physiological signals or for diagnostic purposes
-
- A—HUMAN NECESSITIES
- A61—MEDICAL OR VETERINARY SCIENCE; HYGIENE
- A61B—DIAGNOSIS; SURGERY; IDENTIFICATION
- A61B5/00—Measuring for diagnostic purposes; Identification of persons
- A61B5/74—Details of notification to user or communication with user or patient ; user input means
- A61B5/742—Details of notification to user or communication with user or patient ; user input means using visual displays
-
- A—HUMAN NECESSITIES
- A61—MEDICAL OR VETERINARY SCIENCE; HYGIENE
- A61B—DIAGNOSIS; SURGERY; IDENTIFICATION
- A61B5/00—Measuring for diagnostic purposes; Identification of persons
- A61B5/02—Detecting, measuring or recording pulse, heart rate, blood pressure or blood flow; Combined pulse/heart-rate/blood pressure determination; Evaluating a cardiovascular condition not otherwise provided for, e.g. using combinations of techniques provided for in this group with electrocardiography or electroauscultation; Heart catheters for measuring blood pressure
- A61B5/026—Measuring blood flow
- A61B5/0295—Measuring blood flow using plethysmography, i.e. measuring the variations in the volume of a body part as modified by the circulation of blood therethrough, e.g. impedance plethysmography
-
- A—HUMAN NECESSITIES
- A61—MEDICAL OR VETERINARY SCIENCE; HYGIENE
- A61H—PHYSICAL THERAPY APPARATUS, e.g. DEVICES FOR LOCATING OR STIMULATING REFLEX POINTS IN THE BODY; ARTIFICIAL RESPIRATION; MASSAGE; BATHING DEVICES FOR SPECIAL THERAPEUTIC OR HYGIENIC PURPOSES OR SPECIFIC PARTS OF THE BODY
- A61H2201/00—Characteristics of apparatus not provided for in the preceding codes
- A61H2201/50—Control means thereof
- A61H2201/5058—Sensors or detectors
- A61H2201/5092—Optical sensor
-
- A—HUMAN NECESSITIES
- A61—MEDICAL OR VETERINARY SCIENCE; HYGIENE
- A61H—PHYSICAL THERAPY APPARATUS, e.g. DEVICES FOR LOCATING OR STIMULATING REFLEX POINTS IN THE BODY; ARTIFICIAL RESPIRATION; MASSAGE; BATHING DEVICES FOR SPECIAL THERAPEUTIC OR HYGIENIC PURPOSES OR SPECIFIC PARTS OF THE BODY
- A61H2230/00—Measuring physical parameters of the user
- A61H2230/20—Blood composition characteristics
- A61H2230/201—Blood composition characteristics used as a control parameter for the apparatus
-
- A—HUMAN NECESSITIES
- A61—MEDICAL OR VETERINARY SCIENCE; HYGIENE
- A61H—PHYSICAL THERAPY APPARATUS, e.g. DEVICES FOR LOCATING OR STIMULATING REFLEX POINTS IN THE BODY; ARTIFICIAL RESPIRATION; MASSAGE; BATHING DEVICES FOR SPECIAL THERAPEUTIC OR HYGIENIC PURPOSES OR SPECIFIC PARTS OF THE BODY
- A61H2230/00—Measuring physical parameters of the user
- A61H2230/20—Blood composition characteristics
- A61H2230/207—Blood composition characteristics partial O2-value
- A61H2230/208—Blood composition characteristics partial O2-value used as a control parameter for the apparatus
-
- A—HUMAN NECESSITIES
- A61—MEDICAL OR VETERINARY SCIENCE; HYGIENE
- A61H—PHYSICAL THERAPY APPARATUS, e.g. DEVICES FOR LOCATING OR STIMULATING REFLEX POINTS IN THE BODY; ARTIFICIAL RESPIRATION; MASSAGE; BATHING DEVICES FOR SPECIAL THERAPEUTIC OR HYGIENIC PURPOSES OR SPECIFIC PARTS OF THE BODY
- A61H31/00—Artificial respiration or heart stimulation, e.g. heart massage
- A61H31/004—Heart stimulation
- A61H31/005—Heart stimulation with feedback for the user
Definitions
- the present invention relates to a concentration measurement apparatus and a concentration measurement method.
- Patent Document 1 An example of a device for noninvasively measuring hemoglobin concentration information inside a living body is described in Patent Document 1.
- light is made incident inside the living body, and thereafter, light scattered inside the living body is detected by each of a plurality of photodiodes. Then, based on the intensities of the detected light components, a rate of change of the detected light amount in the direction of distance from the light incidence point is calculated. Hemoglobin oxygen saturation is calculated based on a predetermined relationship of the rate of change of the detected light amount and the light absorption coefficient.
- Patent Document 1 Japanese Patent Application Laid-Open No. H7-255709
- Non-Patent Document 1 Susumu Suzuki et al., "Tissue oxygenation monitor using NIR spatially resolved spectroscopy,” Proceedings of SPIE 3597, pp.582-592
- the primary patients in the emergency medical field in recent years are those suffering cardiopulmonary arrest outside a hospital.
- the number of out-of-hospital cardiopulmonary arrest persons exceeds 100 thousand per year, and emergency medical care of these persons is a major social demand.
- An essential procedure for out-of-hospital cardiopulmonary arrest persons is chest compression performed in combination with artificial respiration. Chest compression is an act where the lower half of the sternum is cyclically compressed by another person's hands to apply an artificial pulse to the arrested heart.
- a primary object of chest compression is to supply blood oxygen to the brain of the cardiopulmonary arrest person. Whether or not chest compression is being performed appropriately thus has a large influence on the life or death of the cardiopulmonary arrest person. Methods and devices that are useful for objectively judging whether or not chest compression is being performed appropriately are thus being demanded.
- the present invention has been made in view of the above situation, and an object thereof is to provide a concentration measurement apparatus and a concentration measurement method that enable objective judgment of whether or not chest compression is being performed appropriately.
- a concentration measurement apparatus is a concentration measurement apparatus measuring a temporal relative change amount of at least one of total hemoglobin concentration and oxygenated hemoglobin concentration in the head that vary due to repetition of chest compression, and includes a light incidence section making measurement light incident on the head, a light detection section detecting the measurement light that has propagated through the interior of the head and generating a detection signal in accordance with an intensity of the measurement light, and a calculation section determining, based on the detection signal, the temporal relative change amount of at least one of the total hemoglobin concentration and the oxygenated hemoglobin concentration, and performing a filtering process of removing frequency components less than a predetermined frequency from frequency components contained in the relative change amount.
- a concentration measurement method is a concentration measurement method of measuring a temporal relative change amount of at least one of total hemoglobin concentration and oxygenated hemoglobin concentration in the head that vary due to repetition of chest compression, and includes a light incidence step of making measurement light incident on the head, a light detection step of detecting the measurement light that has propagated through the interior of the head and generating a detection signal in accordance with an intensity of the measurement light, and a calculation step of determining, based on the detection signal, the temporal relative change amount of at least one of the total hemoglobin concentration and the oxygenated hemoglobin concentration, and performing a filtering process of removing frequency components less than a predetermined frequency from frequency components contained in the relative change amount.
- the present inventors used a concentration measurement apparatus using near-infrared light to measure relative change amounts of total hemoglobin concentration and oxygenated hemoglobin concentration in the head at a frequency sufficiently higher than the heartbeat frequency.
- the present inventors found that, in chest compression, certain changes occur in the total hemoglobin concentration and the oxygenated hemoglobin concentration of the interior of the head (that is, the brain) each time the sternum is compressed cyclically. This phenomenon is considered to be due to increase of blood flow within the brain by the chest compression, and may be usable as a material for objectively judging whether or not chest compression is being performed appropriately.
- the amplitude (for example, of approximately 1 ⁇ mol) of such a concentration change due to chest compression is extremely small in comparison to the amplitudes (normally of not less than several ⁇ mol) of changes of even longer cycle that occur in a normally active state of a healthy person or in a state where various procedures are being performed on a cardiopulmonary arrest person. It is thus extremely difficult to observe the variations due to chest compression if simply values corresponding to the total hemoglobin concentration and the oxygenated hemoglobin concentration are measured.
- the frequency components less than the predetermined frequency are removed from the frequency components contained in the relative change amount in the calculation section or the calculation step.
- the cycle of concentration changes due to chest compression that is, the preferable compression cycle in the chest compression process
- the cycles of the primary concentration changes in the state where various procedures are being performed on a cardiopulmonary arrest person are shorter than the cycles of the primary concentration changes in the state where various procedures are being performed on a cardiopulmonary arrest person. Therefore, by removing the low frequency components (that is, the long cycle components) from the measured relative change amount as in the above-described concentration measurement apparatus and concentration measurement method, information on concentration changes due to chest compression can be extracted favorably.
- the "filtering process of removing frequency components less than a predetermined frequency" in the above-described concentration measurement apparatus and the concentration measurement method refers to a process of decreasing the proportion of frequency components less than the predetermined frequency until the frequency component due to chest compression appears at a sufficiently recognizable level, and is not limited to completely removing the frequency components less than the predetermined frequency.
- FIG. 1 is a conceptual diagram of a concentration measurement apparatus 1 according to an embodiment of the present invention.
- the concentration measurement apparatus 1 measures respective temporal variations (relative change amounts) from initial amounts of total hemoglobin (cHb) concentration, oxygenated hemoglobin (O 2 Hb) concentration, and deoxygenated hemoglobin (HHb) concentration of the head 51 that vary due to repeated chest compression and displays the measurement results on a display section 15 to notify a person performing the chest compression.
- cHb total hemoglobin
- O 2 Hb oxygenated hemoglobin
- HHb deoxygenated hemoglobin
- the concentration measurement apparatus 1 makes light beams of predetermined wavelengths ( ⁇ 1 , ⁇ 2 , and ⁇ 3 ) be incident on a predetermined light incidence position from a probe 20 fixed to the head 51, and detects intensities of light components emitted from predetermined light detection positions on the head 51 to examine the effects of the oxygenated hemoglobin (O 2 Hb) and the deoxygenated hemoglobin (HHb) on the light, and based thereon, repeatedly calculates the temporal relative change amounts of the oxygenated hemoglobin (O 2 Hb) and the deoxygenated hemoglobin (HHb).
- predetermined wavelengths ⁇ 1 , ⁇ 2 , and ⁇ 3
- the apparatus applies a filtering process to time series data that are the calculation results, and thereby removes low frequency components to extract a short-cycle temporal variation component due to the repetition of chest compression, and displays the temporal variation component in a visible manner.
- the light of predetermined wavelengths for example, near-infrared light is used.
- FIG. 2 is a plan view of a configuration of a probe 20.
- (b) in FIG. 2 is a sectional side view taken along line II-II of (a) in FIG 2 .
- the probe 20 has a light incidence section 21 and a light detection section 22.
- the light incidence section 21 and the light detection section 22 are disposed with an interval, for example, of 5 cm from each other, and are practically integrated by a holder 23 made of flexible, black silicone rubber.
- the interval suffices to be not less than approximately 3 to 4 cm.
- the light incidence section 21 includes an optical fiber 24 and a prism 25, and has a structure that makes the measurement light, transmitted from a main unit section 10 of the concentration measurement apparatus 1, incident substantially perpendicularly on the skin of the head.
- the measurement light is, for example, a laser light beam of pulse form, and is transmitted from the main unit section 10.
- the light detection section 22 detects measurement light components that have propagated through the interior of the head, and generates detection signals that are in accordance with the intensities of the measurement light components.
- the light detection section 22 is, for example, a one-dimensional photosensor having an array of N photodetection elements 26 aligned in a direction of distance from the light incidence section 21.
- the light detection section 22 further has a pre-amplifier section 27 that integrates and amplifies photocurrents output from the photodetection elements 26.
- the light detection section 22 may instead be a two-dimensional photosensor, or may be configured by a charge coupled device (CCD).
- the probe 20 is, for example, fixed by an adhesive tape or a stretchable band, etc., onto a forehead portion without hair.
- FIG. 3 is a block diagram of a configuration example of the concentration measurement apparatus 1.
- the concentration measurement apparatus 1 shown in FIG 3 includes the main unit section 10 in addition to the probe 20 described above.
- the main unit section 10 includes a light emitting section (for example, a laser section) 11, a sample hold circuit 12, an A/D converter circuit 13, a CPU 14, a display section 15, a ROM 16, a RAM 17, and a data bus 18.
- the light emitting section 11 is configured by a laser diode and a circuit that drives the laser diode.
- the light emitting section 11 is electrically connected to the data bus 18 and receives an instruction signal for instructing the driving of the laser diode from the CPU 14 that is likewise electrically connected to the data bus 18.
- the instruction signal contains information on the light intensity and wavelength (for example, a wavelength among wavelengths ⁇ 1 , ⁇ 2 , and ⁇ 3 ) of the laser light output from the laser diode.
- the light emitting section 11 drives the laser diode based on the instruction signal received from the CPU 14 and outputs laser light as measurement light to the probe 20 via the optical fiber 24.
- the light emitting element of the light emitting section 11 does not have to be a laser diode, and suffices to be an element that can successively output light beams of a plurality of wavelengths in the near-infrared region.
- a light emitting diode such as an LED that is built into the probe 20 may be used as the light incidence section 21.
- the sample hold circuit 12 and the A/D converter circuit 13 input the detection signals transmitted via the cable 28 from the probe 20 and perform holding and conversion of the signals to digital signals that are then output to the CPU 14.
- the sample hold circuit 12 simultaneously holds the values of N detection signals.
- the sample hold circuit 12 is electrically connected to the data bus 18, and receives a sample signal, indicating the timing of holding of the detection signals, from the CPU 14 via the data bus 18. Upon receiving the sample signal, the sample hold circuit 12 simultaneously holds N detection signals input from the probe 20.
- the sample hold circuit 12 is electrically connected to the A/D converter circuit 13, and outputs each of the held N detection signals to the A/D converter circuit 13.
- the A/D converter circuit 13 is means for converting the detection signals from analog signals to digital signals.
- the A/D convertor circuit 13 successively converts the N detection signals received from the sample hold circuit 12 into digital signals.
- the A/D convertor circuit 13 is electrically connected to the data bus 18, and outputs the converted detection signals to the CPU 14 via the data bus 18.
- the CPU 14 is a calculation section in the present embodiment and, based on the detection signals received from the A/D converter circuit 13, calculates the required amounts among the temporal relative change amount ( ⁇ O 2 Hb) of the oxygenated hemoglobin concentration contained in the interior of the head, the temporal relative change amount ( ⁇ HHb) of the deoxygenated hemoglobin concentration, and the temporal relative change amount ( ⁇ cHb) of the total hemoglobin concentration, which is the sum of the above two concentrations. Further, the CPU 14 applies a filtering process to the temporal relative change amounts ( ⁇ O 2 Hb, ⁇ HHb, and ⁇ cHb) to remove frequency components less than a predetermined frequency from frequency components contained in the amounts to thereby extract a temporal variation component due to repetition of chest compression.
- the CPU 14 After performing such a process, the CPU 14 transmits the results via the data bus 18 to the display section 15.
- a method of calculating the temporal relative change amounts ( ⁇ O 2 Hb, ⁇ HHb, and ⁇ cHb) based on the detection signals and a method of the filtering process shall be described later.
- the display section 15 is electrically connected to the data bus 18, and displays the results transmitted from the CPU 14 via the data bus 18.
- FIG 4 is a flowchart of the concentration measurement method according to the present embodiment.
- the light emitting section 11 successively outputs the laser light beams of wavelengths ⁇ 1 to ⁇ 3 based on the instruction signal from the CPU 14.
- the laser light beams (measurement light beams) propagate through the optical fiber 24, reach the light incidence position at the forehead portion, and enter inside the head from the light incidence position (light incidence step, S11).
- the laser light beam made to enter inside the head propagates while being scattered inside the head and being absorbed by measurement object components, and parts of the light reach the light detection positions of the forehead portion.
- the laser light components that reach the light detection positions are detected by the N photodetection elements 26 (light detection step, S12).
- Each photodetection element 26 generates a photocurrent in accordance with the intensity of the detected laser light component.
- These photocurrents are converted into voltage signals (detection signals) by the pre-amplifier section 27, and the voltage signals are transmitted to and held by the sample hold circuit 12 of the main unit section 10, and thereafter, converted to digital signals by the A/D converter circuit 13.
- (a) in FIG 5 is a diagram of incidence timings of the laser light beams of wavelengths ⁇ 1 to ⁇ 3
- (b) in FIG 5 is a diagram of output timings of the digital signals from the A/D converter circuit 13.
- N digital signals D 1 (1) to D 1 (N) corresponding to the N photodetection elements 26 are obtained sequentially.
- N digital signals D 2 (1) to D 2 (N) corresponding to the N photodetection elements 26 are obtained sequentially.
- (3 ⁇ N) digital signals D 1 (1) to D 3 (N) are output from the A/D converter circuit 13.
- the calculation section 14 calculates the hemoglobin oxygen saturation (TOI) based on the digital signals D(1) to D(N). Also, the calculation section 14 uses at least one digital signal from the digital signals D(1) to D(N) to calculate the temporal relative change amount ( ⁇ O 2 Hb) of the oxygenated hemoglobin concentration, the temporal relative change amount ( ⁇ HHb) of the deoxygenated hemoglobin concentration, and the temporal relative change amount ( ⁇ cHb) of the total hemoglobin concentration, which is the sum of these (calculation step, step S13).
- TOI hemoglobin oxygen saturation
- the frequency components contained in the relative change amounts ( ⁇ cHb, ⁇ O 2 Hb, and ⁇ HHb) are removed by a filtering process (calculation step, S14).
- the relative change amounts ( ⁇ cHb, ⁇ O 2 Hb, and ⁇ HHb) after the filtering process are displayed on the display section 15 (step S15).
- the above-described steps S 11 to S 15 are repeated.
- D ⁇ 1 (T 0 ) to D ⁇ 3 (T 0 ) are values of the detection signals, respectively corresponding to the laser light wavelengths ⁇ 1 to ⁇ 3 , at a time To at a certain light detection position, and D ⁇ 1 (T 1 ) ⁇ D ⁇ 3 (T 1 ) are likewise values at a time T 1 , the change amounts of the detected light intensities in the time T 0 to T 1 are expressed by the following formulas (1) to (3).
- ⁇ OD 1 (T 1 ) is the temporal change amount of the detected light intensity of wavelength ⁇ 1
- ⁇ OD 2 (T 1 ) is the temporal change amount of the detected light intensity of wavelength ⁇ 2
- ⁇ OD 3 (T 1 ) is the temporal change amount of the detected light intensity of wavelength ⁇ 3 .
- ⁇ O 2 Hb(T 1 ) and ⁇ HHb(T 1 ) are the temporal relative change amounts of the concentrations of oxygenated hemoglobin and deoxygenated hemoglobin, respectively, in the period from time To to time T 1 , these can be determined by the following formula (4).
- [Formula 4] ⁇ ⁇ O 2 ⁇ Hb T 1 ⁇ ⁇ HHb T 1 a 11 a 12 a 13 a 21 a 22 a 23 ⁇ ⁇ ⁇ O ⁇ D 1 T 1 ⁇ ⁇ O ⁇ D 2 T 1 ⁇ ⁇ O ⁇ D 3 T 1
- the coefficients a11 to a23 are constants determined from absorbance coefficients of O 2 Hb and HHb for light components of wavelengths ⁇ 1 , ⁇ 2 , and ⁇ 3 .
- the temporal relative change amount ⁇ cHb(T 1 ) of the total hemoglobin concentration in the head can be determined by the following formula (5).
- ⁇ ⁇ cHb T 1 ⁇ ⁇ O 2 ⁇ Hb T 1 + ⁇ ⁇ HHb T 1
- the CPU 14 performs the above calculation on detection signals from one position among the N light detection positions to calculate the respective temporal relative change amounts ( ⁇ O 2 Hb, ⁇ HHb, and ⁇ cHb) of the oxygenated hemoglobin concentration, deoxygenated hemoglobin concentration, and total hemoglobin concentration. Further, the CPU 14 performs, for example, any of the following filtering processes on the temporal relative change amounts ( ⁇ O 2 Hb, ⁇ HHb, and ⁇ cHb) that have thus been calculated.
- X(n) be a data string related to a temporal relative change amount ( ⁇ O 2 Hb, ⁇ HHb, or ⁇ cHb) obtained at a predetermined cycle.
- n is an integer.
- a 0 3 / 4
- a delay operator for the data string X(n) is represented by the following formula (6).
- f is the time frequency (units: 1/sec).
- T is the cycle at which the data string X(n) is obtained, and is set, for example, to a cycle of 1/20 seconds for measuring a variation waveform at approximately 150 times per minute (2.5 Hz).
- FIG. 6 is a graph of R(F), and shows the filter characteristics of the digital filter.
- the horizontal axis represents the number of heartbeats per minute, and the vertical axis represents the value of R(F).
- FIG. 7 is a graph of results of using the digital filter shown in FIG. 6 to remove (reduce) frequency components less than the predetermined frequency from the frequency components contained in the temporal relative change amount ( ⁇ O 2 Hb) of oxygenated hemoglobin to extract a temporal variation component due to a spontaneous heartbeat that simulates the repetition of chest compression.
- ⁇ O 2 Hb temporal relative change amount
- a graph G31 represents the relative change amount ( ⁇ O 2 Hb) before the filtering process
- a graph G32 represents the long cycle components (frequency components less than the predetermined frequency) contained in the relative change amount ( ⁇ O 2 Hb) before the filtering process
- a graph G33 represents the relative change amount ( ⁇ O 2 Hb) after the filtering process.
- FIG. 8 is a graph of results of using such a filtering process to remove (reduce) frequency components less than the predetermined frequency from the frequency components contained in the temporal relative change amount ( ⁇ cHb) of the total hemoglobin to extract a temporal variation component due to a spontaneous heartbeat that simulates the repetition of chest compression.
- ⁇ cHb temporal relative change amount
- a graph G41 represents the relative change amount ( ⁇ cHb) before the filtering process
- a graph G42 represents the long cycle components (frequency components less than the predetermined frequency) contained in the relative change amount ( ⁇ cHb) before the filtering process
- a graph G43 represents the relative change amount ( ⁇ cHb) after the filtering process
- a graph G44 indicates the 5-second average amplitudes in the relative change amount ( ⁇ cHb) after the filtering process.
- FIG. 9 and (b) in FIG. 9 are diagrams for describing the concepts of the present filtering process.
- the maximal values in the temporal variation of the relative change amount ( ⁇ O 2 Hb, ⁇ HHb, or ⁇ cHb) are determined, and by deeming the maximal values P1 in the temporal variation graph G51 to be of fixed value as shown in (a) in FIG. 9 , the frequency components less than the predetermined frequency that are contained in the relative change amount ( ⁇ O 2 Hb, ⁇ HHb, or ⁇ cHb) are removed.
- the minimal values in the temporal variation of the relative change amount ( ⁇ O 2 Hb, ⁇ HHb, or ⁇ cHb) are determined, and by deeming the minimal values P2 in the temporal variation graph G51 to be of fixed value as shown in (b) in FIG. 9 , the frequency components less than the predetermined frequency that are contained in the relative change amount ( ⁇ O 2 Hb, ⁇ HHb, or ⁇ cHb) are removed.
- the maximal values P1 and minimal values P2 closer to fixed values, the temporal variation component due to the repetition of chest compression can be extracted favorably.
- concentration measurement apparatus 1 used a concentration measurement apparatus using near-infrared light to measure the relative change amounts ( ⁇ cHb and ⁇ O 2 Hb) of the total hemoglobin concentration and the oxygenated hemoglobin concentration in the head at a frequency sufficiently higher than the heartbeat frequency.
- ⁇ cHb and ⁇ O 2 Hb the relative change amounts
- This phenomenon is considered to be due to increase of blood flow within the brain by the chest compression, and may be usable as information for objectively judging whether or not chest compression is being performed appropriately.
- the amplitude (for example, of approximately 1 ⁇ mol) of such a concentration change due to chest compression is extremely small in comparison to the amplitudes (normally of not less than several ⁇ mol) of changes of even longer cycle that occur in a normally active state of a healthy person or in a state where various procedures are being performed on a cardiopulmonary arrest person. It is thus extremely difficult to observe the variations due to chest compression if simply values corresponding to the total hemoglobin concentration and the oxygenated hemoglobin concentration are measured.
- the frequency components less than the predetermined frequency are removed from the frequency components contained in the relative change amounts ( ⁇ cHb, ⁇ O 2 Hb, and ⁇ HHb).
- the cycle of concentration changes due to chest compression is shorter than the cycles of the primary concentration changes in the state where various procedures are being performed on a cardiopulmonary arrest person.
- the concentration measurement apparatus 1 and the concentration measurement method according to the present embodiment by removing the low frequency components (that is, the long cycle components) from the measured relative change amounts ( ⁇ cHb, ⁇ O 2 Hb, and ⁇ HHb) as in the concentration measurement apparatus 1 and the concentration measurement method according to the present embodiment, information on the concentration changes due to chest compression can be extracted favorably. Further, based on this information, a performer can objectively judge whether or not the chest compression is being performed appropriately. It thus becomes possible for the performer to perform or maintain the chest compression more appropriately.
- the "filtering process of removing frequency components less than a predetermined frequency” refers to a process of decreasing the proportion of frequency components less than the predetermined frequency until the frequency component due to chest compression appears at a sufficiently recognizable level, and is not restricted to completely removing the frequency components less than the predetermined frequency.
- the calculation cycle of the relative change amounts is preferably not more than 0.2 seconds (not less than 5 Hz as calculation frequency).
- a favorable cycle of chest compression is generally said to be not less than approximately 100 times per minute (that is, once every 0.6 seconds). If the calculation cycle of the relative change amount is not more than one-third of the chest compression cycle, the concentration changes due to the chest compression can be detected favorably.
- the frequency components less than the predetermined frequency are removed from the frequency components contained in the relative change amounts ( ⁇ cHb, ⁇ O 2 Hb, and ⁇ HHb) to extract the temporal variation component due to the repetition of sternal compression.
- the predetermined frequency is preferably not more than 1.66 Hz. Information on the concentration changes due to the not less than approximately 100 times per minute of chest compression can thereby be extracted favorably.
- FIG. 10 a screen display on the display section 15 shall now be described.
- FIG. 10 and (b) in FIG. 10 are examples of a display screen on the display section 15.
- the temporal relative change amount ( ⁇ O 2 Hb) of the oxygenated hemoglobin concentration after the filtering process and the temporal relative change amount ( ⁇ HHb) of the deoxygenated hemoglobin concentration after the filtering process are displayed respectively as individual graphs G11 and G12.
- the horizontal axis of the graphs G11 and G12 represents time
- the vertical axis represents the change amount.
- a graph G21 representing the temporal relative change amount ( ⁇ cHb) of the total hemoglobin concentration after the filtering process is displayed, and further, a region B22 of the amplitude of the graph G21 that is taken up by the temporal relative change amount ( ⁇ O 2 Hb) of the oxygenated hemoglobin concentration, and a region B23 taken up by the temporal relative change amount ( ⁇ HHb) of the deoxygenated hemoglobin concentration are displayed in a color-coded manner.
- the horizontal axis of the graph G21 represents time
- the vertical axis represents the change amount.
- the chest compression performer can refer to the displayed information to visually and intuitively recognize the proportion of oxygenated hemoglobin in the blood delivered to the head, and thereby rapidly judge the need for artificial respiration.
- the display section 15 may also display information (first information) of numerical values, etc., related to a ratio (A2/A1) of the amplitude (the amplitude Al shown in (b) in FIG 10 ) of the temporal variation of the temporal relative change amount ( ⁇ cHb) of the total hemoglobin concentration and the amplitude (A2 shown in (b) in FIG 10 ) of the temporal variation of the temporal relative change amount ( ⁇ O 2 Hb) of the oxygenated hemoglobin concentration.
- the display section 15 may display information (second information) of numerical values, etc., related to a ratio (I2/I1) of the integrated value I1 (the sum of the areas of the region B22 and the region B23 shown in (b) in FIG.
- the chest compression performer can refer to the displayed information to know the proportion of oxygenated hemoglobin in the blood delivered to the head, and thereby favorably judge the need for artificial respiration.
- the above information is calculated by the CPU 14 and transmitted to the display section 15. Further, the above information may be average values for a predetermined time (for example, 5 seconds).
- the CPU 14 may issue a warning to the chest compression performer, when the calculated value of the ratio (A2/A1) or ratio (I2/I1) is less than a predetermined threshold value (for example, 90%).
- a predetermined threshold value for example, 90%.
- the chest compression performer can thereby be more reliably notified of the lowering of the proportion of oxygenated hemoglobin in the blood delivered to the head.
- a method for such warning for example, an output of a warning sound or an indication of a warning display on the display section 15 is preferable.
- the display section 15 may display information (third information) related to variation frequencies of the temporal relative change amounts ( ⁇ cHb and ⁇ O 2 Hb) of either or both of the total hemoglobin concentration and the oxygenated hemoglobin concentration after the filtering process has been performed.
- the performer can thereby be notified of the current frequency (cycle) of chest compression, and urged to make it approach an appropriate frequency (cycle), for example, of 100 times per minute.
- the above information is calculated by the CPU 14 and transmitted to the display section 15. Further, the above information may be an average value for a predetermined time (for example, 5 seconds).
- the display section 15 may display the numerical value of the amplitude (A1 shown in (b) in FIG. 10 ) of the temporal variation of the temporal relative change amount of the total hemoglobin concentration.
- the chest compression performer can thereby refer to the displayed numerical values to know the blood amount delivered into the brain, and thereby favorably judge whether or not the strength of chest compression is sufficient.
- the above numerical value may be an average value for a predetermined time (for example, 5 seconds).
- the main unit section 10 may also output a sound (for example, a simulated pulse sound such as blip, blip) each time the numerical value of the amplitude is not less than a predetermined value. The performer can thereby be notified more reliably of whether or not an appropriate blood amount is being delivered into the brain.
- concentration measurement apparatus and the concentration measurement method according to the present invention are not limited to the embodiment described above, and various modifications are possible.
- the concentration measurement apparatus 1 and the concentration measurement method according to the above-described embodiment the respective relative change amounts
- the filtering process in the concentration measurement apparatus and concentration measurement method according to the present invention is not limited to those given as examples in regard to the embodiment, and any filtering process capable of removing frequency components less than a predetermined frequency from the relative change amounts ( ⁇ cHb and ⁇ O 2 Hb) may be used favorably in the present invention.
- the hemoglobin oxygen saturation (TOI), determined by near-infrared spectroscopic analysis in a manner similar to the respective relative change amounts ( ⁇ cHb, ⁇ O 2 Hb, and ⁇ HHb) of the total hemoglobin concentration, oxygenated hemoglobin concentration, and deoxygenated hemoglobin concentration, may be displayed in a graph or as a numerical value together with the relative change amounts on the display section. Improvement of the brain oxygen state by the chest compression can thereby be confirmed to maintain the motivation of the performer.
- the TOI may be an average value for a predetermined time (for example, 5 seconds).
- the concentration measurement apparatus and the concentration measurement method may be of a configuration where a calculation cycle of the relative change amount is not more than 0.2 seconds.
- a favorable cycle of chest compression is generally said to be not less than approximately 100 times per minute (that is, once every 0.6 seconds). If the calculation cycle of the relative change amount is not more than one-third of the chest compression cycle, the concentration changes due to the chest compression can be detected. That is, by the calculation cycle of the relative change amount being not more than 0.2 seconds, the concentration change due to the chest compression can be detected favorably.
- the concentration measurement apparatus and the concentration measurement method may be of a configuration where the predetermined frequency is not more than 1.66 Hz. Information on the concentration changes due to the chest compression can thereby be extracted favorably.
- the concentration measurement apparatus may be of a configuration that further includes a display section displaying the calculation result by the calculation section, and where the calculation section determines the temporal relative change amount of the total hemoglobin concentration and the temporal relative change amount of the oxygenated hemoglobin concentration, and determines first information related to a ratio (A2/A1) of an amplitude (A1) of the temporal variation of the temporal relative change amount of the total hemoglobin concentration and an amplitude (A2) of the temporal variation of the temporal relative change amount of the oxygenated hemoglobin concentration, after the filtering process, and the display section displays the first information.
- A2/A1 an amplitude of the temporal variation of the temporal relative change amount of the total hemoglobin concentration
- A2 amplitude of the temporal relative change amount of the oxygenated hemoglobin concentration
- the concentration measurement method may be of a configuration where, in the calculation step, the temporal relative change amount of the total hemoglobin concentration and the temporal relative change amount of the oxygenated hemoglobin concentration are determined, first information related to a ratio (A2/A1) of an amplitude (A1) of the temporal variation of the temporal relative change amount of the total hemoglobin concentration and an amplitude (A2) of the temporal variation of the temporal relative change amount of the oxygenated hemoglobin concentration, after the filtering process, is determined, and the first information is displayed.
- the performer can refer to the displayed first information to know the proportion of oxygenated hemoglobin in the blood delivered into the brain, and thereby favorably judge the need for artificial respiration.
- the concentration measurement apparatus may be of a configuration where the calculation section performs at least one of an output of a warning sound and an indication of a warning display on the display section when the ratio (A2/A1) is less than a predetermined threshold.
- the concentration measurement method may be of a configuration where at least one of an output of a warning sound and a warning display is performed when the ratio (A2/A1) is less than a predetermined threshold in the calculation step. The performer can thereby be more reliably notified of the lowering of the proportion of oxygenated hemoglobin in the blood delivered into the brain.
- the concentration measurement apparatus may be of a configuration that further includes a display section displaying the calculation result by the calculation section, and where the calculation section determines the temporal relative change amount of the total hemoglobin concentration and the temporal relative change amount of the oxygenated hemoglobin concentration, and determines at least one of an integrated value (I1) of the temporal variation of the temporal relative change amount of the total hemoglobin concentration and an integrated value (I2) of the temporal variation of the temporal relative change amount of the oxygenated hemoglobin concentration, after the filtering process, and the display section displays at least one of the integrated value (I1) and the integrated value (I2).
- the concentration measurement method may be of a configuration where, in the calculation step, the temporal relative change amount of the total hemoglobin concentration and the temporal relative change amount of the oxygenated hemoglobin concentration are determined, at least one of an integrated value (I1) of the temporal variation of the temporal relative change amount of the total hemoglobin concentration and an integrated value (I2) of the temporal variation of the temporal relative change amount of the oxygenated hemoglobin concentration, after the filtering process, is determined, and at least one of the integrated value (I1) and the integrated value (I2) is displayed.
- the performer can thereby refer to the displayed values to judge whether or not the strength of chest compression is sufficient.
- the concentration measurement apparatus may be of a configuration where the calculation section determines both the integrated value (I1) and the integrated value (I2), and thereafter, further determines second information related to a ratio (I2/I1) of the integrated value (I1) and the integrated value (I2), and the display section further displays the second information.
- the concentration measurement method may be of a configuration where, in the calculation step, both of the integrated value (I1) and the integrated value (I2) are determined, second information related to a ratio (I2/I1) of the integrated value (I1) and the integrated value (I2) is further determined thereafter, and the second information is further displayed.
- the performer can thereby refer to the displayed second information to know the proportion of oxygenated hemoglobin in the blood delivered into the brain, and favorably judge the need for artificial respiration.
- the concentration measurement apparatus may be of a configuration where the calculation section performs at least one of an output of a warning sound and an indication of a warning display on the display section when the ratio (I2/I1) is less than a predetermined threshold.
- the concentration measurement method may be of a configuration where at least one of an output of a warning sound and a warning display is performed when the ratio (I2/I1) is less than a predetermined threshold in the calculation step. The performer can thereby be more reliably notified of the lowering of the proportion of oxygenated hemoglobin in the blood delivered into the brain.
- the concentration measurement apparatus may be of a configuration that further includes a display section displaying the calculation result by the calculation section, and where the calculation section determines an amplitude (A1) of the temporal variation of the temporal relative change amount of the total hemoglobin concentration after the filtering process, and the display section displays the numerical value of the amplitude (A1).
- the concentration measurement method may be of a configuration where, in the calculation step, an amplitude (A1) of the temporal variation of the temporal relative change amount of the total hemoglobin concentration after the filtering process is determined, and the numerical value of the amplitude (A1) is displayed. The performer can thereby refer to the displayed numerical value to know the blood amount delivered into the brain, and thereby favorably judge whether or not the strength of chest compression is sufficient.
- the concentration measurement apparatus may be of a configuration where the calculation section performs an output of a sound each time the numerical value of the amplitude (A1) is not less than a predetermined value.
- the concentration measurement method may be of a configuration where a sound is output each time the numerical value of the amplitude (A1) is not less than a predetermined value in the calculation step. The performer can thereby be more reliably notified that the blood amount being delivered into the brain is insufficient.
- the concentration measurement apparatus may be of a configuration that further includes a display section displaying the calculation result by the calculation section, and where the calculation section determines the temporal relative change amount of the total hemoglobin concentration and the temporal relative change amount of the oxygenated hemoglobin concentration, and the display section displays graphs of the temporal relative change amount of the oxygenated hemoglobin concentration and the temporal relative change amount of the deoxygenated hemoglobin concentration contained in the total hemoglobin concentration, after the filtering process, in a color-coded manner.
- the concentration measurement method may be of a configuration where, in the calculation step, the temporal relative change amount of the total hemoglobin concentration and the temporal relative change amount of the oxygenated hemoglobin concentration are determined, and graphs of the temporal relative change amount of the oxygenated hemoglobin concentration and the temporal relative change amount of the deoxygenated hemoglobin concentration contained in the total hemoglobin concentration, after the filtering process, are displayed in a color-coded manner.
- the performer can thereby refer to the displayed information to visually and intuitively recognize the proportion of oxygenated hemoglobin in the blood delivered into the brain, and thereby more rapidly judge the need for artificial respiration.
- the concentration measurement apparatus may be of a configuration that further includes a display section displaying the calculation result by the calculation section, and where the calculation section calculates third information related to a variation frequency of the relative change amount after the filtering process, and the display section displays the third information.
- the concentration measurement method may be of a configuration where, in the calculation step, third information related to a variation frequency of the relative change amount after the filtering process is calculated, and the third information is displayed. The performer can thereby be notified of the current frequency (cycle) of chest compression, and urged to make it approach the appropriate frequency (cycle).
- the concentration measurement apparatus may be of a configuration where the calculation section removes the frequency components less than the predetermined frequency from the frequency components contained in the relative change amount by a digital filter.
- the concentration measurement method may be of a configuration where, in the calculation step, the frequency components less than the predetermined frequency are removed from the frequency components contained in the temporal relative change amount by a digital filter. Long cycle components can thereby be removed favorably from the measured relative change amount, and information related to the concentration changes due to chest compression can be extracted with high precision.
- the concentration measurement apparatus may be of a configuration where the calculation section calculates data resulting from smoothing of the temporal variation of the relative change amount, and subtracts the data from the relative change amount to remove the frequency components less than the predetermined frequency from the frequency components contained in the relative change amount.
- the concentration measurement method may be of a configuration where, in the calculation step, data resulting from smoothing of the temporal variation of the temporal relative change amount are calculated, and the data are subtracted from the temporal relative change amount to remove the frequency components less than the predetermined frequency from the frequency components contained in the temporal relative change amount. Long cycle components can thereby be removed favorably from the measured relative change amount, and information related to the concentration changes due to chest compression can be extracted with high precision.
- the concentration measurement apparatus may be of a configuration where the calculation section determines at least one of a maximal value and a minimal value in the temporal variation of the relative change amount, and removes the frequency components less than the predetermined frequency from the frequency components contained in the relative change amount based on at least one of the maximal value and the minimal value.
- the concentration measurement method may be of a configuration where, in the calculation step, at least one of a maximal value and a minimal value in the temporal variation of the temporal relative change amount is determined, and the frequency components less than the predetermined frequency are removed from the frequency components contained in the temporal relative change amount based on at least one of the maximal value and the minimal value. Long cycle components can thereby be removed favorably from the measured relative change amount, and information related to the concentration changes due to chest compression can be extracted with high precision.
- the present invention can be used as a concentration measurement apparatus and a concentration measurement method that enable objective judgment of whether or not chest compression is being performed appropriately.
- 1 - concentration measurement apparatus 10 - main unit section, 11 - light emitting section, 12 - sample hold circuit, 13 - converter circuit, 14 - calculation section, 15 - display section, 16 - ROM, 17 - RAM, 18 - data bus, 20 - probe, 21 - light incidence section, 22 - light detection section, 23 - holder, 24 - optical fiber, 25 - prism, 26 - photodetection element, 27 - pre-amplifier section, 28 - cable, 50 - cardiopulmonary arrest person, 51 - head, P1 - maximal value, P2 - minimal value.
Abstract
Description
- The present invention relates to a concentration measurement apparatus and a concentration measurement method.
- An example of a device for noninvasively measuring hemoglobin concentration information inside a living body is described in
Patent Document 1. With this device, light is made incident inside the living body, and thereafter, light scattered inside the living body is detected by each of a plurality of photodiodes. Then, based on the intensities of the detected light components, a rate of change of the detected light amount in the direction of distance from the light incidence point is calculated. Hemoglobin oxygen saturation is calculated based on a predetermined relationship of the rate of change of the detected light amount and the light absorption coefficient. Also, based on a predetermined relationship of the temporal change of the rate of change of the detected light amount and the temporal change of the light absorption coefficient, respective concentration changes of oxygenated hemoglobin (O2Hb), deoxygenated hemoglobin (HHb), and total hemoglobin (cHb) are calculated. - Patent Document 1: Japanese Patent Application Laid-Open No.
H7-255709 - Non-Patent Document 1: Susumu Suzuki et al., "Tissue oxygenation monitor using NIR spatially resolved spectroscopy," Proceedings of SPIE 3597, pp.582-592
- The primary patients in the emergency medical field in recent years are those suffering cardiopulmonary arrest outside a hospital. The number of out-of-hospital cardiopulmonary arrest persons exceeds 100 thousand per year, and emergency medical care of these persons is a major social demand. An essential procedure for out-of-hospital cardiopulmonary arrest persons is chest compression performed in combination with artificial respiration. Chest compression is an act where the lower half of the sternum is cyclically compressed by another person's hands to apply an artificial pulse to the arrested heart. A primary object of chest compression is to supply blood oxygen to the brain of the cardiopulmonary arrest person. Whether or not chest compression is being performed appropriately thus has a large influence on the life or death of the cardiopulmonary arrest person. Methods and devices that are useful for objectively judging whether or not chest compression is being performed appropriately are thus being demanded.
- The present invention has been made in view of the above situation, and an object thereof is to provide a concentration measurement apparatus and a concentration measurement method that enable objective judgment of whether or not chest compression is being performed appropriately.
- In order to solve the above-described problem, a concentration measurement apparatus according to the present invention is a concentration measurement apparatus measuring a temporal relative change amount of at least one of total hemoglobin concentration and oxygenated hemoglobin concentration in the head that vary due to repetition of chest compression, and includes a light incidence section making measurement light incident on the head, a light detection section detecting the measurement light that has propagated through the interior of the head and generating a detection signal in accordance with an intensity of the measurement light, and a calculation section determining, based on the detection signal, the temporal relative change amount of at least one of the total hemoglobin concentration and the oxygenated hemoglobin concentration, and performing a filtering process of removing frequency components less than a predetermined frequency from frequency components contained in the relative change amount.
- Further, a concentration measurement method according to the present invention is a concentration measurement method of measuring a temporal relative change amount of at least one of total hemoglobin concentration and oxygenated hemoglobin concentration in the head that vary due to repetition of chest compression, and includes a light incidence step of making measurement light incident on the head, a light detection step of detecting the measurement light that has propagated through the interior of the head and generating a detection signal in accordance with an intensity of the measurement light, and a calculation step of determining, based on the detection signal, the temporal relative change amount of at least one of the total hemoglobin concentration and the oxygenated hemoglobin concentration, and performing a filtering process of removing frequency components less than a predetermined frequency from frequency components contained in the relative change amount.
- The present inventors used a concentration measurement apparatus using near-infrared light to measure relative change amounts of total hemoglobin concentration and oxygenated hemoglobin concentration in the head at a frequency sufficiently higher than the heartbeat frequency. As a result, the present inventors found that, in chest compression, certain changes occur in the total hemoglobin concentration and the oxygenated hemoglobin concentration of the interior of the head (that is, the brain) each time the sternum is compressed cyclically. This phenomenon is considered to be due to increase of blood flow within the brain by the chest compression, and may be usable as a material for objectively judging whether or not chest compression is being performed appropriately. However, the amplitude (for example, of approximately 1µmol) of such a concentration change due to chest compression is extremely small in comparison to the amplitudes (normally of not less than several µmol) of changes of even longer cycle that occur in a normally active state of a healthy person or in a state where various procedures are being performed on a cardiopulmonary arrest person. It is thus extremely difficult to observe the variations due to chest compression if simply values corresponding to the total hemoglobin concentration and the oxygenated hemoglobin concentration are measured.
- Therefore, with the above-described concentration measurement apparatus and concentration measurement method, in addition to determining the temporal relative change amount of either or both of the total hemoglobin concentration and the oxygenated hemoglobin concentration, the frequency components less than the predetermined frequency are removed from the frequency components contained in the relative change amount in the calculation section or the calculation step. Normally, the cycle of concentration changes due to chest compression (that is, the preferable compression cycle in the chest compression process) is shorter than the cycles of the primary concentration changes in the state where various procedures are being performed on a cardiopulmonary arrest person. Therefore, by removing the low frequency components (that is, the long cycle components) from the measured relative change amount as in the above-described concentration measurement apparatus and concentration measurement method, information on concentration changes due to chest compression can be extracted favorably. Further, based on this information, a performer can objectively judge whether or not the chest compression is being performed appropriately. It thus becomes possible for the performer to perform or maintain the chest compression more appropriately. Here, the "filtering process of removing frequency components less than a predetermined frequency" in the above-described concentration measurement apparatus and the concentration measurement method refers to a process of decreasing the proportion of frequency components less than the predetermined frequency until the frequency component due to chest compression appears at a sufficiently recognizable level, and is not limited to completely removing the frequency components less than the predetermined frequency.
- In accordance with the concentration measurement apparatus and concentration measurement method according to the present invention, whether or not chest compression is being performed appropriately can be judged objectively.
-
- [
FIG 1] FIG. 1 is a conceptual diagram of a concentration measurement apparatus according to an embodiment. - [
FIG. 2] FIG. 2 includes (a) a plan view of a configuration of a probe, and (b) a sectional side view taken along line II-II of (a). - [
FIG 3] FIG. 3 is a block diagram of a configuration example of the concentration measurement apparatus. - [
FIG. 4] FIG. 4 is a flowchart of a concentration measurement method according to an embodiment. - [
FIG 5] FIG 5 includes (a) a diagram of incidence timings of laser light beams of wavelengths λ1 to λ3, and (b) a diagram of output timings of digital signals from an A/D converter circuit. - [
FIG 6] FIG 6 is a graph of filter characteristics of a digital filter. - [
FIG 7] FIG 7 is a graph of results of using the digital filter having the characteristics shown inFIG 6 to remove frequency components less than a predetermined frequency from frequency components contained in a temporal relative change amount (ΔO2Hb) of oxygenated hemoglobin to thereby extract a temporal variation component due to a spontaneous heartbeat that simulates the repetition of chest compression. - [
FIG. 8] FIG. 8 is a graph of results of using a filtering process by smoothing to remove frequency components less than a predetermined frequency from frequency components contained in a temporal relative change amount (ΔcHb) of total hemoglobin to thereby extract a temporal variation component due to a spontaneous heartbeat that simulates the repetition of chest compression. - [
FIG 9] FIG. 9 shows diagrams for describing concepts of a filtering process by which maximal portions or minimal portions of a variation are uniformized. - [
FIG 10] FIG. 10 shows diagrams of examples of a display screen in a display section. - Hereinafter, an embodiment of a concentration measurement apparatus and a concentration measurement method according to the present invention will be described in detail with reference to the accompanying drawings. In the description of the drawings, elements that are the same are provided with the same reference symbols, and redundant description is omitted.
-
FIG. 1 is a conceptual diagram of aconcentration measurement apparatus 1 according to an embodiment of the present invention. To provide information for objectively judging whether or not chest compression (arrow A in the figure) is being performed appropriately on acardiopulmonary arrest person 50, theconcentration measurement apparatus 1 measures respective temporal variations (relative change amounts) from initial amounts of total hemoglobin (cHb) concentration, oxygenated hemoglobin (O2Hb) concentration, and deoxygenated hemoglobin (HHb) concentration of thehead 51 that vary due to repeated chest compression and displays the measurement results on adisplay section 15 to notify a person performing the chest compression. Theconcentration measurement apparatus 1 makes light beams of predetermined wavelengths (λ1, λ2, and λ3) be incident on a predetermined light incidence position from aprobe 20 fixed to thehead 51, and detects intensities of light components emitted from predetermined light detection positions on thehead 51 to examine the effects of the oxygenated hemoglobin (O2Hb) and the deoxygenated hemoglobin (HHb) on the light, and based thereon, repeatedly calculates the temporal relative change amounts of the oxygenated hemoglobin (O2Hb) and the deoxygenated hemoglobin (HHb). Also, the apparatus applies a filtering process to time series data that are the calculation results, and thereby removes low frequency components to extract a short-cycle temporal variation component due to the repetition of chest compression, and displays the temporal variation component in a visible manner. As the light of predetermined wavelengths, for example, near-infrared light is used. - (a) in
FIG. 2 is a plan view of a configuration of aprobe 20. (b) inFIG. 2 is a sectional side view taken along line II-II of (a) inFIG 2 . Theprobe 20 has alight incidence section 21 and alight detection section 22. Thelight incidence section 21 and thelight detection section 22 are disposed with an interval, for example, of 5 cm from each other, and are practically integrated by aholder 23 made of flexible, black silicone rubber. Here, the interval suffices to be not less than approximately 3 to 4 cm. - The
light incidence section 21 includes anoptical fiber 24 and aprism 25, and has a structure that makes the measurement light, transmitted from amain unit section 10 of theconcentration measurement apparatus 1, incident substantially perpendicularly on the skin of the head. The measurement light is, for example, a laser light beam of pulse form, and is transmitted from themain unit section 10. - The
light detection section 22 detects measurement light components that have propagated through the interior of the head, and generates detection signals that are in accordance with the intensities of the measurement light components. Thelight detection section 22 is, for example, a one-dimensional photosensor having an array of N photodetectionelements 26 aligned in a direction of distance from thelight incidence section 21. Also, thelight detection section 22 further has apre-amplifier section 27 that integrates and amplifies photocurrents output from thephotodetection elements 26. By this arrangement, weak signals can be detected with high sensitivity to generate detection signals, and the signals can be transmitted via acable 28 to themain unit section 10. Here, thelight detection section 22 may instead be a two-dimensional photosensor, or may be configured by a charge coupled device (CCD). Theprobe 20 is, for example, fixed by an adhesive tape or a stretchable band, etc., onto a forehead portion without hair. -
FIG. 3 is a block diagram of a configuration example of theconcentration measurement apparatus 1. Theconcentration measurement apparatus 1 shown inFIG 3 includes themain unit section 10 in addition to theprobe 20 described above. Themain unit section 10 includes a light emitting section (for example, a laser section) 11, asample hold circuit 12, an A/D converter circuit 13, aCPU 14, adisplay section 15, aROM 16, aRAM 17, and adata bus 18. - The
light emitting section 11 is configured by a laser diode and a circuit that drives the laser diode. Thelight emitting section 11 is electrically connected to thedata bus 18 and receives an instruction signal for instructing the driving of the laser diode from theCPU 14 that is likewise electrically connected to thedata bus 18. The instruction signal contains information on the light intensity and wavelength (for example, a wavelength among wavelengths λ1, λ2, and λ3) of the laser light output from the laser diode. Thelight emitting section 11 drives the laser diode based on the instruction signal received from theCPU 14 and outputs laser light as measurement light to theprobe 20 via theoptical fiber 24. Here, the light emitting element of thelight emitting section 11 does not have to be a laser diode, and suffices to be an element that can successively output light beams of a plurality of wavelengths in the near-infrared region. Also, a light emitting diode such as an LED that is built into theprobe 20 may be used as thelight incidence section 21. - The
sample hold circuit 12 and the A/D converter circuit 13 input the detection signals transmitted via thecable 28 from theprobe 20 and perform holding and conversion of the signals to digital signals that are then output to theCPU 14. Thesample hold circuit 12 simultaneously holds the values of N detection signals. Thesample hold circuit 12 is electrically connected to thedata bus 18, and receives a sample signal, indicating the timing of holding of the detection signals, from theCPU 14 via thedata bus 18. Upon receiving the sample signal, thesample hold circuit 12 simultaneously holds N detection signals input from theprobe 20. Thesample hold circuit 12 is electrically connected to the A/D converter circuit 13, and outputs each of the held N detection signals to the A/D converter circuit 13. - The A/
D converter circuit 13 is means for converting the detection signals from analog signals to digital signals. The A/D convertor circuit 13 successively converts the N detection signals received from thesample hold circuit 12 into digital signals. The A/D convertor circuit 13 is electrically connected to thedata bus 18, and outputs the converted detection signals to theCPU 14 via thedata bus 18. - The
CPU 14 is a calculation section in the present embodiment and, based on the detection signals received from the A/D converter circuit 13, calculates the required amounts among the temporal relative change amount (ΔO2Hb) of the oxygenated hemoglobin concentration contained in the interior of the head, the temporal relative change amount (ΔHHb) of the deoxygenated hemoglobin concentration, and the temporal relative change amount (ΔcHb) of the total hemoglobin concentration, which is the sum of the above two concentrations. Further, theCPU 14 applies a filtering process to the temporal relative change amounts (ΔO2Hb, ΔHHb, and ΔcHb) to remove frequency components less than a predetermined frequency from frequency components contained in the amounts to thereby extract a temporal variation component due to repetition of chest compression. After performing such a process, theCPU 14 transmits the results via thedata bus 18 to thedisplay section 15. Here, a method of calculating the temporal relative change amounts (ΔO2Hb, ΔHHb, and ΔcHb) based on the detection signals and a method of the filtering process shall be described later. Thedisplay section 15 is electrically connected to thedata bus 18, and displays the results transmitted from theCPU 14 via thedata bus 18. - The operation of the
concentration measurement apparatus 1 shall now be described. In addition, the concentration measurement method according to the present embodiment shall be described.FIG 4 is a flowchart of the concentration measurement method according to the present embodiment. - First, the
light emitting section 11 successively outputs the laser light beams of wavelengths λ1 to λ3 based on the instruction signal from theCPU 14. The laser light beams (measurement light beams) propagate through theoptical fiber 24, reach the light incidence position at the forehead portion, and enter inside the head from the light incidence position (light incidence step, S11). The laser light beam made to enter inside the head propagates while being scattered inside the head and being absorbed by measurement object components, and parts of the light reach the light detection positions of the forehead portion. The laser light components that reach the light detection positions are detected by the N photodetection elements 26 (light detection step, S12). Eachphotodetection element 26 generates a photocurrent in accordance with the intensity of the detected laser light component. These photocurrents are converted into voltage signals (detection signals) by thepre-amplifier section 27, and the voltage signals are transmitted to and held by thesample hold circuit 12 of themain unit section 10, and thereafter, converted to digital signals by the A/D converter circuit 13. - Here, (a) in
FIG 5 is a diagram of incidence timings of the laser light beams of wavelengths λ1 to λ3, and (b) inFIG 5 is a diagram of output timings of the digital signals from the A/D converter circuit 13. As shown inFIG 5 , when the laser light of wavelength λ1 is made incident, N digital signals D1(1) to D1(N) corresponding to theN photodetection elements 26 are obtained sequentially. Next, when the laser light of wavelength λ2 is made incident, N digital signals D2(1) to D2(N) corresponding to theN photodetection elements 26 are obtained sequentially. Thus, (3×N) digital signals D1(1) to D3(N) are output from the A/D converter circuit 13. - Subsequently, the
calculation section 14 calculates the hemoglobin oxygen saturation (TOI) based on the digital signals D(1) to D(N). Also, thecalculation section 14 uses at least one digital signal from the digital signals D(1) to D(N) to calculate the temporal relative change amount (ΔO2Hb) of the oxygenated hemoglobin concentration, the temporal relative change amount (ΔHHb) of the deoxygenated hemoglobin concentration, and the temporal relative change amount (ΔcHb) of the total hemoglobin concentration, which is the sum of these (calculation step, step S13). Then, of the frequency components contained in the relative change amounts (ΔcHb, ΔO2Hb, and ΔHHb), the frequency components less than the predetermined frequency are removed by a filtering process (calculation step, S14). The relative change amounts (ΔcHb, ΔO2Hb, and ΔHHb) after the filtering process are displayed on the display section 15 (step S15). In theconcentration measurement apparatus 1 and the concentration measurement method according to the present embodiment, the above-described steps S 11 toS 15 are repeated. - The above-described calculation performed by the
calculation section 14 in the calculation stepsS 13 andS 14 shall now be described in detail. - If Dλ1(T0) to Dλ3(T0) are values of the detection signals, respectively corresponding to the laser light wavelengths λ1 to λ3, at a time To at a certain light detection position, and Dλ1(T1)∼Dλ3(T1) are likewise values at a time T1, the change amounts of the detected light intensities in the time T0 to T1 are expressed by the following formulas (1) to (3).
[Formula 1]


- Here, in the formulas (1) to (3), ΔOD1(T1) is the temporal change amount of the detected light intensity of wavelength λ1, ΔOD2(T1) is the temporal change amount of the detected light intensity of wavelength λ2, and ΔOD3(T1) is the temporal change amount of the detected light intensity of wavelength λ3.
- Further, if ΔO2Hb(T1) and ΔHHb(T1) are the temporal relative change amounts of the concentrations of oxygenated hemoglobin and deoxygenated hemoglobin, respectively, in the period from time To to time T1, these can be determined by the following formula (4).
[Formula 4]
- Here, in the formula (4), the coefficients a11 to a23 are constants determined from absorbance coefficients of O2Hb and HHb for light components of wavelengths λ1, λ2, and λ3. Also, the temporal relative change amount ΔcHb(T1) of the total hemoglobin concentration in the head can be determined by the following formula (5).
[Formula 5]
- The
CPU 14 performs the above calculation on detection signals from one position among the N light detection positions to calculate the respective temporal relative change amounts (ΔO2Hb, ΔHHb, and ΔcHb) of the oxygenated hemoglobin concentration, deoxygenated hemoglobin concentration, and total hemoglobin concentration. Further, theCPU 14 performs, for example, any of the following filtering processes on the temporal relative change amounts (ΔO2Hb, ΔHHb, and ΔcHb) that have thus been calculated. - Let X(n) be a data string related to a temporal relative change amount (ΔO2Hb, ΔHHb, or ΔcHb) obtained at a predetermined cycle. Here, n is an integer. By multiplying the respective data of the data string X(n) by, for example, the following filter coefficients A(n), with n=0 being the time center, an acyclic linear phase digital filter is realized.


- To describe in further detail, a delay operator for the data string X(n) is represented by the following formula (6). Here, f is the time frequency (units: 1/sec). Also, ω is the angular frequency, and ω=2πf. T is the cycle at which the data string X(n) is obtained, and is set, for example, to a cycle of 1/20 seconds for measuring a variation waveform at approximately 150 times per minute (2.5 Hz).
[Formula 6]
- In this case, the digital filter characteristics when the above-described filter coefficients A(n) are used are described by the following formula (7).
[Formula 7]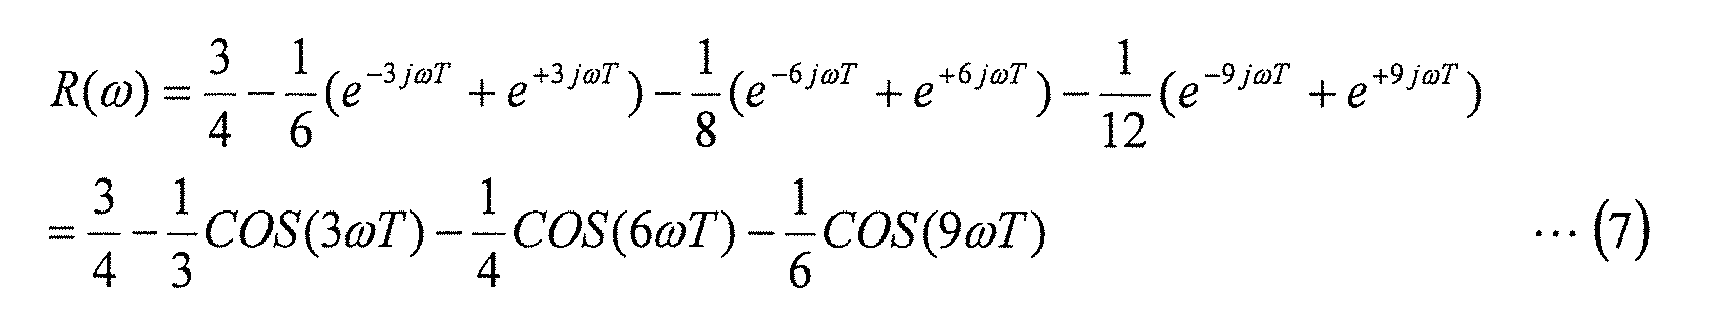
- The digital filter is thus expressed by a product-sum operation of the data string X(n) and the corresponding coefficients. Further, by converting the time frequency f in formula (7) to a time frequency F per minute (units: 1/min), the following formula (8) is obtained.
[Formula 8]
-
FIG. 6 is a graph of R(F), and shows the filter characteristics of the digital filter. InFIG 6 , the horizontal axis represents the number of heartbeats per minute, and the vertical axis represents the value of R(F). Further,FIG. 7 is a graph of results of using the digital filter shown inFIG. 6 to remove (reduce) frequency components less than the predetermined frequency from the frequency components contained in the temporal relative change amount (ΔO2Hb) of oxygenated hemoglobin to extract a temporal variation component due to a spontaneous heartbeat that simulates the repetition of chest compression. InFIG. 7 , a graph G31 represents the relative change amount (ΔO2Hb) before the filtering process, a graph G32 represents the long cycle components (frequency components less than the predetermined frequency) contained in the relative change amount (ΔO2Hb) before the filtering process, and a graph G33 represents the relative change amount (ΔO2Hb) after the filtering process. As shown inFIG 7 , by the above digital filter, the temporal variation component due to the spontaneous heartbeat or the repetition of chest compression can be extracted favorably. - A least square error curve fitting using a high-order function (for example, a fourth-order function) is performed on a data string X(n), within the above-described data string X(n), that is obtained in a predetermined time (for example, 3 seconds, corresponding to 5 beats) before and after n=0 as the time center. The constant term of the high-order function obtained is then deemed to be a smoothed component (frequency component less than the predetermined frequency) at n=0. That is, by subtracting the smoothed frequency component from the original data X(0), the frequency component less than the predetermined frequency can be removed from the frequency components contained in the relative change amount to separate/extract the temporal variation component due to repeated chest compression.
-
FIG. 8 is a graph of results of using such a filtering process to remove (reduce) frequency components less than the predetermined frequency from the frequency components contained in the temporal relative change amount (ΔcHb) of the total hemoglobin to extract a temporal variation component due to a spontaneous heartbeat that simulates the repetition of chest compression. InFIG. 8 , a graph G41 represents the relative change amount (ΔcHb) before the filtering process, a graph G42 represents the long cycle components (frequency components less than the predetermined frequency) contained in the relative change amount (ΔcHb) before the filtering process, a graph G43 represents the relative change amount (ΔcHb) after the filtering process, and a graph G44 indicates the 5-second average amplitudes in the relative change amount (ΔcHb) after the filtering process. As shown inFIG 8 , by the filtering process by the above-described smoothing calculation, the temporal variation component due to the spontaneous heartbeat or the repetition of chest compression can be extracted favorably. -
(a) in FIG. 9 and (b) inFIG. 9 are diagrams for describing the concepts of the present filtering process. In this filtering process, for example, the maximal values in the temporal variation of the relative change amount (ΔO2Hb, ΔHHb, or ΔcHb) are determined, and by deeming the maximal values P1 in the temporal variation graph G51 to be of fixed value as shown in (a) inFIG. 9 , the frequency components less than the predetermined frequency that are contained in the relative change amount (ΔO2Hb, ΔHHb, or ΔcHb) are removed. Or, for example, the minimal values in the temporal variation of the relative change amount (ΔO2Hb, ΔHHb, or ΔcHb) are determined, and by deeming the minimal values P2 in the temporal variation graph G51 to be of fixed value as shown in (b) inFIG. 9 , the frequency components less than the predetermined frequency that are contained in the relative change amount (ΔO2Hb, ΔHHb, or ΔcHb) are removed. By thus making either or both the maximal values P1 and minimal values P2 closer to fixed values, the temporal variation component due to the repetition of chest compression can be extracted favorably. - The effects of the
concentration measurement apparatus 1 and the concentration measurement method according to the present embodiment with the above arrangements shall now be described. In view of the problem to be solved described above, present inventors used a concentration measurement apparatus using near-infrared light to measure the relative change amounts (ΔcHb and ΔO2Hb) of the total hemoglobin concentration and the oxygenated hemoglobin concentration in the head at a frequency sufficiently higher than the heartbeat frequency. As a result, the present inventors found that, in chest compression, certain changes occur in the total hemoglobin concentration and the oxygenated hemoglobin concentration of the interior of the head (that is, the brain) each time the sternum is compressed cyclically. This phenomenon is considered to be due to increase of blood flow within the brain by the chest compression, and may be usable as information for objectively judging whether or not chest compression is being performed appropriately. However, the amplitude (for example, of approximately 1 µmol) of such a concentration change due to chest compression is extremely small in comparison to the amplitudes (normally of not less than several µmol) of changes of even longer cycle that occur in a normally active state of a healthy person or in a state where various procedures are being performed on a cardiopulmonary arrest person. It is thus extremely difficult to observe the variations due to chest compression if simply values corresponding to the total hemoglobin concentration and the oxygenated hemoglobin concentration are measured. - Therefore, in the
concentration measurement apparatus 1 and the concentration measurement method according to the present embodiment, in addition to theCPU 14 determining the temporal relative change amounts (ΔcHb, ΔO2Hb, and ΔHHb) of the total hemoglobin concentration, the oxygenated hemoglobin concentration, and the deoxygenated hemoglobin concentration in the calculation step S13, the frequency components less than the predetermined frequency are removed from the frequency components contained in the relative change amounts (ΔcHb, ΔO2Hb, and ΔHHb). Normally, the cycle of concentration changes due to chest compression (that is, the preferable compression cycle of the chest compression process) is shorter than the cycles of the primary concentration changes in the state where various procedures are being performed on a cardiopulmonary arrest person. Therefore, by removing the low frequency components (that is, the long cycle components) from the measured relative change amounts (ΔcHb, ΔO2Hb, and ΔHHb) as in theconcentration measurement apparatus 1 and the concentration measurement method according to the present embodiment, information on the concentration changes due to chest compression can be extracted favorably. Further, based on this information, a performer can objectively judge whether or not the chest compression is being performed appropriately. It thus becomes possible for the performer to perform or maintain the chest compression more appropriately. - Here, in the present embodiment, the "filtering process of removing frequency components less than a predetermined frequency" refers to a process of decreasing the proportion of frequency components less than the predetermined frequency until the frequency component due to chest compression appears at a sufficiently recognizable level, and is not restricted to completely removing the frequency components less than the predetermined frequency.
- Also, the calculation cycle of the relative change amounts (ΔcHb, ΔO2Hb, and ΔHHb) is preferably not more than 0.2 seconds (not less than 5 Hz as calculation frequency). A favorable cycle of chest compression is generally said to be not less than approximately 100 times per minute (that is, once every 0.6 seconds). If the calculation cycle of the relative change amount is not more than one-third of the chest compression cycle, the concentration changes due to the chest compression can be detected favorably.
- Further, in the filtering process described above, the frequency components less than the predetermined frequency are removed from the frequency components contained in the relative change amounts (ΔcHb, ΔO2Hb, and ΔHHb) to extract the temporal variation component due to the repetition of sternal compression. The predetermined frequency is preferably not more than 1.66 Hz. Information on the concentration changes due to the not less than approximately 100 times per minute of chest compression can thereby be extracted favorably.
- Here, a screen display on the
display section 15 shall now be described.(a) in FIG. 10 and (b) inFIG. 10 are examples of a display screen on thedisplay section 15. In the display screen shown in (a) inFIG. 10 , the temporal relative change amount (ΔO2Hb) of the oxygenated hemoglobin concentration after the filtering process and the temporal relative change amount (ΔHHb) of the deoxygenated hemoglobin concentration after the filtering process are displayed respectively as individual graphs G11 and G12. In one example, the horizontal axis of the graphs G11 and G12 represents time, and the vertical axis represents the change amount. - Further, in the display screen shown in (b) in
FIG 10 , a graph G21 representing the temporal relative change amount (ΔcHb) of the total hemoglobin concentration after the filtering process is displayed, and further, a region B22 of the amplitude of the graph G21 that is taken up by the temporal relative change amount (ΔO2Hb) of the oxygenated hemoglobin concentration, and a region B23 taken up by the temporal relative change amount (ΔHHb) of the deoxygenated hemoglobin concentration are displayed in a color-coded manner. In one example, the horizontal axis of the graph G21 represents time, and the vertical axis represents the change amount. By thus displaying the region B22 and the region B23 in a color-coded manner, the chest compression performer can refer to the displayed information to visually and intuitively recognize the proportion of oxygenated hemoglobin in the blood delivered to the head, and thereby rapidly judge the need for artificial respiration. - The
display section 15 may also display information (first information) of numerical values, etc., related to a ratio (A2/A1) of the amplitude (the amplitude Al shown in (b) inFIG 10 ) of the temporal variation of the temporal relative change amount (ΔcHb) of the total hemoglobin concentration and the amplitude (A2 shown in (b) inFIG 10 ) of the temporal variation of the temporal relative change amount (ΔO2Hb) of the oxygenated hemoglobin concentration. Or, thedisplay section 15 may display information (second information) of numerical values, etc., related to a ratio (I2/I1) of the integrated value I1 (the sum of the areas of the region B22 and the region B23 shown in (b) inFIG. 10 ) of the temporal variation of the temporal relative change amount (ΔcHb) of the total hemoglobin concentration and the integrated value I2 (the area of the region B22 shown in (b) inFIG 10 ) of the temporal variation of the temporal relative change amount (ΔO2Hb) of the oxygenated hemoglobin concentration. By displaying either or both of the above, the chest compression performer can refer to the displayed information to know the proportion of oxygenated hemoglobin in the blood delivered to the head, and thereby favorably judge the need for artificial respiration. Here, the above information is calculated by theCPU 14 and transmitted to thedisplay section 15. Further, the above information may be average values for a predetermined time (for example, 5 seconds). - Further, the
CPU 14 may issue a warning to the chest compression performer, when the calculated value of the ratio (A2/A1) or ratio (I2/I1) is less than a predetermined threshold value (for example, 90%). The chest compression performer can thereby be more reliably notified of the lowering of the proportion of oxygenated hemoglobin in the blood delivered to the head. As a method for such warning, for example, an output of a warning sound or an indication of a warning display on thedisplay section 15 is preferable. - Also, the
display section 15 may display information (third information) related to variation frequencies of the temporal relative change amounts (ΔcHb and ΔO2Hb) of either or both of the total hemoglobin concentration and the oxygenated hemoglobin concentration after the filtering process has been performed. The performer can thereby be notified of the current frequency (cycle) of chest compression, and urged to make it approach an appropriate frequency (cycle), for example, of 100 times per minute. Here, the above information is calculated by theCPU 14 and transmitted to thedisplay section 15. Further, the above information may be an average value for a predetermined time (for example, 5 seconds). - Also, the
display section 15 may display the numerical value of the amplitude (A1 shown in (b) inFIG. 10 ) of the temporal variation of the temporal relative change amount of the total hemoglobin concentration. The chest compression performer can thereby refer to the displayed numerical values to know the blood amount delivered into the brain, and thereby favorably judge whether or not the strength of chest compression is sufficient. Here, the above numerical value may be an average value for a predetermined time (for example, 5 seconds). Further, themain unit section 10 may also output a sound (for example, a simulated pulse sound such as blip, blip) each time the numerical value of the amplitude is not less than a predetermined value. The performer can thereby be notified more reliably of whether or not an appropriate blood amount is being delivered into the brain. - The concentration measurement apparatus and the concentration measurement method according to the present invention are not limited to the embodiment described above, and various modifications are possible. For example, although with the
concentration measurement apparatus 1 and the concentration measurement method according to the above-described embodiment, the respective relative change amounts - (ΔcHb, ΔO2Hb, and ΔHHb) of the total hemoglobin concentration, oxygenated hemoglobin concentration, and deoxygenated hemoglobin concentration are determined, with the concentration measurement apparatus and concentration measurement method according to the present invention, information for making an objective judgment of whether or not chest compression is being performed appropriately can be indicated by determining at least one of the respective relative change amounts (ΔcHb and ΔO2Hb) of the total hemoglobin concentration and oxygenated hemoglobin concentration.
- Also, the filtering process in the concentration measurement apparatus and concentration measurement method according to the present invention is not limited to those given as examples in regard to the embodiment, and any filtering process capable of removing frequency components less than a predetermined frequency from the relative change amounts (ΔcHb and ΔO2Hb) may be used favorably in the present invention.
- Also with the present invention, the hemoglobin oxygen saturation (TOI), determined by near-infrared spectroscopic analysis in a manner similar to the respective relative change amounts (ΔcHb, ΔO2Hb, and ΔHHb) of the total hemoglobin concentration, oxygenated hemoglobin concentration, and deoxygenated hemoglobin concentration, may be displayed in a graph or as a numerical value together with the relative change amounts on the display section. Improvement of the brain oxygen state by the chest compression can thereby be confirmed to maintain the motivation of the performer. The TOI may be an average value for a predetermined time (for example, 5 seconds).
- In the concentration measurement apparatus according to the above-described embodiment, a configuration of a concentration measurement apparatus measuring a temporal relative change amount of at least one of total hemoglobin concentration and oxygenated hemoglobin concentration in the head that vary due to repetition of sternal compression, and including a light incidence section making measurement light incident on the head, a light detection section detecting the measurement light that has propagated through the interior of the head and generating a detection signal in accordance with the intensity of the measurement light, and a calculation section determining, based on the detection signal, the temporal relative change amount of at least one of the total hemoglobin concentration and the oxygenated hemoglobin concentration, and performing a filtering process of removing frequency components less than a predetermined frequency from frequency components contained in the relative change amount, is used.
- Further, in the concentration measurement method according to the above-described embodiment, a configuration of a concentration measurement method of measuring a temporal relative change amount of at least one of total hemoglobin concentration and oxygenated hemoglobin concentration in the head that vary due to repetition of sternal compression, and including a light incidence step of making measurement light incident on the head, a light detection step of detecting the measurement light that has propagated through the interior of the head and generating a detection signal in accordance with the intensity of the measurement light, and a calculation step of determining, based on the detection signal, the temporal relative change amount of at least one of the total hemoglobin concentration and the oxygenated hemoglobin concentration, and performing a filtering process of removing frequency components less than a predetermined frequency from frequency components contained in the relative change amount, is used.
- The concentration measurement apparatus and the concentration measurement method may be of a configuration where a calculation cycle of the relative change amount is not more than 0.2 seconds. A favorable cycle of chest compression is generally said to be not less than approximately 100 times per minute (that is, once every 0.6 seconds). If the calculation cycle of the relative change amount is not more than one-third of the chest compression cycle, the concentration changes due to the chest compression can be detected. That is, by the calculation cycle of the relative change amount being not more than 0.2 seconds, the concentration change due to the chest compression can be detected favorably.
- Further, the concentration measurement apparatus and the concentration measurement method may be of a configuration where the predetermined frequency is not more than 1.66 Hz. Information on the concentration changes due to the chest compression can thereby be extracted favorably.
- Further, the concentration measurement apparatus may be of a configuration that further includes a display section displaying the calculation result by the calculation section, and where the calculation section determines the temporal relative change amount of the total hemoglobin concentration and the temporal relative change amount of the oxygenated hemoglobin concentration, and determines first information related to a ratio (A2/A1) of an amplitude (A1) of the temporal variation of the temporal relative change amount of the total hemoglobin concentration and an amplitude (A2) of the temporal variation of the temporal relative change amount of the oxygenated hemoglobin concentration, after the filtering process, and the display section displays the first information. Similarly, the concentration measurement method may be of a configuration where, in the calculation step, the temporal relative change amount of the total hemoglobin concentration and the temporal relative change amount of the oxygenated hemoglobin concentration are determined, first information related to a ratio (A2/A1) of an amplitude (A1) of the temporal variation of the temporal relative change amount of the total hemoglobin concentration and an amplitude (A2) of the temporal variation of the temporal relative change amount of the oxygenated hemoglobin concentration, after the filtering process, is determined, and the first information is displayed. By the above, the performer can refer to the displayed first information to know the proportion of oxygenated hemoglobin in the blood delivered into the brain, and thereby favorably judge the need for artificial respiration.
- Further, the concentration measurement apparatus may be of a configuration where the calculation section performs at least one of an output of a warning sound and an indication of a warning display on the display section when the ratio (A2/A1) is less than a predetermined threshold. Similarly, the concentration measurement method may be of a configuration where at least one of an output of a warning sound and a warning display is performed when the ratio (A2/A1) is less than a predetermined threshold in the calculation step. The performer can thereby be more reliably notified of the lowering of the proportion of oxygenated hemoglobin in the blood delivered into the brain.
- Further, the concentration measurement apparatus may be of a configuration that further includes a display section displaying the calculation result by the calculation section, and where the calculation section determines the temporal relative change amount of the total hemoglobin concentration and the temporal relative change amount of the oxygenated hemoglobin concentration, and determines at least one of an integrated value (I1) of the temporal variation of the temporal relative change amount of the total hemoglobin concentration and an integrated value (I2) of the temporal variation of the temporal relative change amount of the oxygenated hemoglobin concentration, after the filtering process, and the display section displays at least one of the integrated value (I1) and the integrated value (I2). Similarly, the concentration measurement method may be of a configuration where, in the calculation step, the temporal relative change amount of the total hemoglobin concentration and the temporal relative change amount of the oxygenated hemoglobin concentration are determined, at least one of an integrated value (I1) of the temporal variation of the temporal relative change amount of the total hemoglobin concentration and an integrated value (I2) of the temporal variation of the temporal relative change amount of the oxygenated hemoglobin concentration, after the filtering process, is determined, and at least one of the integrated value (I1) and the integrated value (I2) is displayed. The performer can thereby refer to the displayed values to judge whether or not the strength of chest compression is sufficient.
- Further, the concentration measurement apparatus may be of a configuration where the calculation section determines both the integrated value (I1) and the integrated value (I2), and thereafter, further determines second information related to a ratio (I2/I1) of the integrated value (I1) and the integrated value (I2), and the display section further displays the second information. Similarly, the concentration measurement method may be of a configuration where, in the calculation step, both of the integrated value (I1) and the integrated value (I2) are determined, second information related to a ratio (I2/I1) of the integrated value (I1) and the integrated value (I2) is further determined thereafter, and the second information is further displayed. The performer can thereby refer to the displayed second information to know the proportion of oxygenated hemoglobin in the blood delivered into the brain, and favorably judge the need for artificial respiration.
- Further, the concentration measurement apparatus may be of a configuration where the calculation section performs at least one of an output of a warning sound and an indication of a warning display on the display section when the ratio (I2/I1) is less than a predetermined threshold. Similarly, the concentration measurement method may be of a configuration where at least one of an output of a warning sound and a warning display is performed when the ratio (I2/I1) is less than a predetermined threshold in the calculation step. The performer can thereby be more reliably notified of the lowering of the proportion of oxygenated hemoglobin in the blood delivered into the brain.
- Further, the concentration measurement apparatus may be of a configuration that further includes a display section displaying the calculation result by the calculation section, and where the calculation section determines an amplitude (A1) of the temporal variation of the temporal relative change amount of the total hemoglobin concentration after the filtering process, and the display section displays the numerical value of the amplitude (A1). Similarly, the concentration measurement method may be of a configuration where, in the calculation step, an amplitude (A1) of the temporal variation of the temporal relative change amount of the total hemoglobin concentration after the filtering process is determined, and the numerical value of the amplitude (A1) is displayed. The performer can thereby refer to the displayed numerical value to know the blood amount delivered into the brain, and thereby favorably judge whether or not the strength of chest compression is sufficient.
- Further, the concentration measurement apparatus may be of a configuration where the calculation section performs an output of a sound each time the numerical value of the amplitude (A1) is not less than a predetermined value. Similarly, the concentration measurement method may be of a configuration where a sound is output each time the numerical value of the amplitude (A1) is not less than a predetermined value in the calculation step. The performer can thereby be more reliably notified that the blood amount being delivered into the brain is insufficient.
- Further, the concentration measurement apparatus may be of a configuration that further includes a display section displaying the calculation result by the calculation section, and where the calculation section determines the temporal relative change amount of the total hemoglobin concentration and the temporal relative change amount of the oxygenated hemoglobin concentration, and the display section displays graphs of the temporal relative change amount of the oxygenated hemoglobin concentration and the temporal relative change amount of the deoxygenated hemoglobin concentration contained in the total hemoglobin concentration, after the filtering process, in a color-coded manner. Similarly, the concentration measurement method may be of a configuration where, in the calculation step, the temporal relative change amount of the total hemoglobin concentration and the temporal relative change amount of the oxygenated hemoglobin concentration are determined, and graphs of the temporal relative change amount of the oxygenated hemoglobin concentration and the temporal relative change amount of the deoxygenated hemoglobin concentration contained in the total hemoglobin concentration, after the filtering process, are displayed in a color-coded manner. The performer can thereby refer to the displayed information to visually and intuitively recognize the proportion of oxygenated hemoglobin in the blood delivered into the brain, and thereby more rapidly judge the need for artificial respiration.
- Further, the concentration measurement apparatus may be of a configuration that further includes a display section displaying the calculation result by the calculation section, and where the calculation section calculates third information related to a variation frequency of the relative change amount after the filtering process, and the display section displays the third information. Similarly, the concentration measurement method may be of a configuration where, in the calculation step, third information related to a variation frequency of the relative change amount after the filtering process is calculated, and the third information is displayed. The performer can thereby be notified of the current frequency (cycle) of chest compression, and urged to make it approach the appropriate frequency (cycle).
- Further, the concentration measurement apparatus may be of a configuration where the calculation section removes the frequency components less than the predetermined frequency from the frequency components contained in the relative change amount by a digital filter. Similarly, the concentration measurement method may be of a configuration where, in the calculation step, the frequency components less than the predetermined frequency are removed from the frequency components contained in the temporal relative change amount by a digital filter. Long cycle components can thereby be removed favorably from the measured relative change amount, and information related to the concentration changes due to chest compression can be extracted with high precision.
- Further, the concentration measurement apparatus may be of a configuration where the calculation section calculates data resulting from smoothing of the temporal variation of the relative change amount, and subtracts the data from the relative change amount to remove the frequency components less than the predetermined frequency from the frequency components contained in the relative change amount. Similarly, the concentration measurement method may be of a configuration where, in the calculation step, data resulting from smoothing of the temporal variation of the temporal relative change amount are calculated, and the data are subtracted from the temporal relative change amount to remove the frequency components less than the predetermined frequency from the frequency components contained in the temporal relative change amount. Long cycle components can thereby be removed favorably from the measured relative change amount, and information related to the concentration changes due to chest compression can be extracted with high precision.
- Further, the concentration measurement apparatus may be of a configuration where the calculation section determines at least one of a maximal value and a minimal value in the temporal variation of the relative change amount, and removes the frequency components less than the predetermined frequency from the frequency components contained in the relative change amount based on at least one of the maximal value and the minimal value. Similarly, the concentration measurement method may be of a configuration where, in the calculation step, at least one of a maximal value and a minimal value in the temporal variation of the temporal relative change amount is determined, and the frequency components less than the predetermined frequency are removed from the frequency components contained in the temporal relative change amount based on at least one of the maximal value and the minimal value. Long cycle components can thereby be removed favorably from the measured relative change amount, and information related to the concentration changes due to chest compression can be extracted with high precision.
- The present invention can be used as a concentration measurement apparatus and a concentration measurement method that enable objective judgment of whether or not chest compression is being performed appropriately.
- 1 - concentration measurement apparatus, 10 - main unit section, 11 - light emitting section, 12 - sample hold circuit, 13 - converter circuit, 14 - calculation section, 15 - display section, 16 - ROM, 17 - RAM, 18 - data bus, 20 - probe, 21 - light incidence section, 22 - light detection section, 23 - holder, 24 - optical fiber, 25 - prism, 26 - photodetection element, 27 - pre-amplifier section, 28 - cable, 50 - cardiopulmonary arrest person, 51 - head, P1 - maximal value, P2 - minimal value.
Claims (12)
- A concentration measurement apparatus measuring a temporal relative change amount of at least one of total hemoglobin concentration and oxygenated hemoglobin concentration in the head that vary due to repetition of chest compression, comprising:a light incidence section making measurement light incident on the head;a light detection section detecting the measurement light that has propagated through the interior of the head and generating a detection signal in accordance with an intensity of the measurement light; anda calculation section determining, based on the detection signal, the temporal relative change amount of at least one of the total hemoglobin concentration and the oxygenated hemoglobin concentration, and performing a filtering process of removing frequency components less than a predetermined frequency from frequency components contained in the relative change amount.
- The concentration measurement apparatus according to Claim 1, wherein a calculation cycle of the relative change amount is not more than 0.2 seconds.
- The concentration measurement apparatus according to Claim 1 or 2, wherein the predetermined frequency is not more than 1.66 Hz.
- The concentration measurement apparatus according to any one of Claims 1 to 3, further comprising a display section displaying the calculation result by the calculation section, and wherein
the calculation section determines the temporal relative change amount of the total hemoglobin concentration and the temporal relative change amount of the oxygenated hemoglobin concentration, and determines first information related to a ratio (A2/A1) of an amplitude (A1) of the temporal variation of the temporal relative change amount of the total hemoglobin concentration and an amplitude (A2) of the temporal variation of the temporal relative change amount of the oxygenated hemoglobin concentration, after the filtering process, and
the display section displays the first information. - The concentration measurement apparatus according to any one of Claims 1 to 3, further comprising a display section displaying the calculation result by the calculation section, and wherein
the calculation section determines the temporal relative change amount of the total hemoglobin concentration and the temporal relative change amount of the oxygenated hemoglobin concentration, and determines at least one of an integrated value (I1) of the temporal variation of the temporal relative change amount of the total hemoglobin concentration and an integrated value (I2) of the temporal variation of the temporal relative change amount of the oxygenated hemoglobin concentration, after the filtering process, and
the display section displays at least one of the integrated value (I1) and the integrated value (I2). - The concentration measurement apparatus according to Claim 5, wherein the calculation section determines both the integrated value (I1) and the integrated value (I2), and thereafter, further determines second information related to a ratio (I2/I1) of the integrated value (I1) and the integrated value (I2), and
the display section further displays the second information. - The concentration measurement apparatus according to any one of Claims 1 to 3, further comprising a display section displaying the calculation result by the calculation section, and wherein
the calculation section determines an amplitude (A1) of the temporal variation of the temporal relative change amount of the total hemoglobin concentration after the filtering process, and
the display section displays the numerical value of the amplitude (A1). - The concentration measurement apparatus according to any one of Claims 1 to 3, further comprising a display section displaying the calculation result by the calculation section, and wherein
the calculation section determines the temporal relative change amount of the total hemoglobin concentration and the temporal relative change amount of the oxygenated hemoglobin concentration, and
the display section displays graphs of the temporal relative change amount of the oxygenated hemoglobin concentration and the temporal relative change amount of the deoxygenated hemoglobin concentration contained in the total hemoglobin concentration, after the filtering process, in a color-coded manner. - The concentration measurement apparatus according to any one of Claims 1 to 8, wherein the calculation section removes the frequency components less than the predetermined frequency from the frequency components contained in the relative change amount by a digital filter.
- The concentration measurement apparatus according to any one of Claims 1 to 8, wherein the calculation section calculates data resulting from smoothing of the temporal variation of the relative change amount, and subtracts the data from the relative change amount to remove the frequency components less than the predetermined frequency from the frequency components contained in the relative change amount.
- The concentration measurement apparatus according to any one of Claims 1 to 8, wherein the calculation section determines at least one of a maximal value and a minimal value in the temporal variation of the relative change amount, and removes the frequency components less than the predetermined frequency from the frequency components contained in the relative change amount based on at least one of the maximal value and the minimal value.
- A concentration measurement method of measuring a temporal relative change amount of at least one of total hemoglobin concentration and oxygenated hemoglobin concentration in the head that vary due to repetition of chest compression, the method comprising:a light incidence step of making measurement light incident on the head;a light detection step of detecting the measurement light that has propagated through the interior of the head and generating a detection signal in accordance with an intensity of the measurement light; anda calculation step of determining, based on the detection signal, the temporal relative change amount of at least one of the total hemoglobin concentration and the oxygenated hemoglobin concentration, and performing a filtering process of removing frequency components less than a predetermined frequency from frequency components contained in the relative change amount.
Priority Applications (1)
| Application Number | Priority Date | Filing Date | Title |
|---|---|---|---|
| EP16182348.9A EP3111843B1 (en) | 2011-04-21 | 2012-04-06 | Concentration-measurement device and concentration-measurement method |
Applications Claiming Priority (2)
| Application Number | Priority Date | Filing Date | Title |
|---|---|---|---|
| JP2011095318A JP5382666B2 (en) | 2011-04-21 | 2011-04-21 | Concentration measuring device and concentration measuring method |
| PCT/JP2012/059581 WO2012144356A1 (en) | 2011-04-21 | 2012-04-06 | Concentration-measurement device and concentration-measurement method |
Related Child Applications (2)
| Application Number | Title | Priority Date | Filing Date |
|---|---|---|---|
| EP16182348.9A Division-Into EP3111843B1 (en) | 2011-04-21 | 2012-04-06 | Concentration-measurement device and concentration-measurement method |
| EP16182348.9A Division EP3111843B1 (en) | 2011-04-21 | 2012-04-06 | Concentration-measurement device and concentration-measurement method |
Publications (3)
| Publication Number | Publication Date |
|---|---|
| EP2700357A1 true EP2700357A1 (en) | 2014-02-26 |
| EP2700357A4 EP2700357A4 (en) | 2014-12-31 |
| EP2700357B1 EP2700357B1 (en) | 2016-10-26 |
Family
ID=47041468
Family Applications (2)
| Application Number | Title | Priority Date | Filing Date |
|---|---|---|---|
| EP16182348.9A Active EP3111843B1 (en) | 2011-04-21 | 2012-04-06 | Concentration-measurement device and concentration-measurement method |
| EP12774805.1A Active EP2700357B1 (en) | 2011-04-21 | 2012-04-06 | Concentration-measurement device and concentration-measurement method |
Family Applications Before (1)
| Application Number | Title | Priority Date | Filing Date |
|---|---|---|---|
| EP16182348.9A Active EP3111843B1 (en) | 2011-04-21 | 2012-04-06 | Concentration-measurement device and concentration-measurement method |
Country Status (6)
| Country | Link |
|---|---|
| US (2) | US9808189B2 (en) |
| EP (2) | EP3111843B1 (en) |
| JP (1) | JP5382666B2 (en) |
| CN (2) | CN103491873B (en) |
| TW (1) | TWI549656B (en) |
| WO (1) | WO2012144356A1 (en) |
Cited By (2)
| Publication number | Priority date | Publication date | Assignee | Title |
|---|---|---|---|---|
| WO2016118588A1 (en) * | 2015-01-20 | 2016-07-28 | Covidien Lp | System and method for cardiopulmonary resuscitation |
| US10426695B2 (en) | 2015-09-08 | 2019-10-01 | Covidien Lp | System and method for cardiopulmonary resuscitation |
Families Citing this family (13)
| Publication number | Priority date | Publication date | Assignee | Title |
|---|---|---|---|---|
| JP2016522040A (en) * | 2013-05-22 | 2016-07-28 | ネモデバイシズ アクチェンゲゼルシャフトNemodevices Ag | Measurement system and method for measuring parameters in human tissue |
| EP3054849B1 (en) | 2013-10-07 | 2022-03-16 | Masimo Corporation | Regional oximetry sensor |
| US11147518B1 (en) | 2013-10-07 | 2021-10-19 | Masimo Corporation | Regional oximetry signal processor |
| US9949892B2 (en) * | 2013-10-11 | 2018-04-24 | Peking Union Medical College Hospital | Pulse oximetry-based cardio-pulmonary resuscitation (CPR) quality feedback systems and methods |
| WO2015121114A1 (en) * | 2014-02-11 | 2015-08-20 | Koninklijke Philips N.V. | Determining return of spontaneous circulation during cpr |
| US10582885B2 (en) | 2014-05-21 | 2020-03-10 | Koninklijke Philips N.V. | Device and method for noninvasively determining the hematocrit value of a subject |
| CN106405068A (en) * | 2016-04-18 | 2017-02-15 | 深圳市华科瑞科技有限公司 | Method for automatically adjusting displayed color during immunoassay |
| JP6191977B1 (en) * | 2016-05-02 | 2017-09-06 | 株式会社トリロバイト | Biological information measurement system and biological information measurement method |
| JP6817755B2 (en) | 2016-09-14 | 2021-01-20 | 浜松ホトニクス株式会社 | How to operate the concentration measuring device and the concentration measuring device |
| JP6846152B2 (en) | 2016-10-03 | 2021-03-24 | 浜松ホトニクス株式会社 | Blood glucose measuring device, blood glucose calculation method and blood glucose calculation program |
| CN108888498B (en) * | 2018-05-22 | 2021-04-02 | 苏州爱琴生物医疗电子有限公司 | Cardio-pulmonary resuscitation feedback control method and system |
| AU2021366274A1 (en) | 2020-10-24 | 2023-06-01 | Spectronix Inc. | Optical device, system and method for monitoring blood-borne chromophores |
| CN117337164A (en) * | 2021-05-18 | 2024-01-02 | 浜松光子学株式会社 | Sternal compression evaluation device and method |
Citations (7)
| Publication number | Priority date | Publication date | Assignee | Title |
|---|---|---|---|---|
| US6393311B1 (en) * | 1998-10-15 | 2002-05-21 | Ntc Technology Inc. | Method, apparatus and system for removing motion artifacts from measurements of bodily parameters |
| US20050131303A1 (en) * | 1994-10-06 | 2005-06-16 | Atsushi Maki | Optical system for measuring metabolism in a body and imaging method |
| US7190999B2 (en) * | 2003-06-27 | 2007-03-13 | Zoll Medical Corporation | Cardio-pulmonary resuscitation device with feedback from measurement of pulse and/or blood oxygenation |
| US20080221464A1 (en) * | 2007-01-20 | 2008-09-11 | Ammar Al-Ali | Perfusion trend indicator |
| US7569018B1 (en) * | 2003-02-18 | 2009-08-04 | Purdue Research Foundation | Apparatus and method for noninvasively detecting the quality of cardiac pumping |
| US20090326353A1 (en) * | 2008-06-30 | 2009-12-31 | Nellcor Puritan Bennett Ireland | Processing and detecting baseline changes in signals |
| US20110034816A1 (en) * | 2004-05-12 | 2011-02-10 | Qing Tan | ECG Rhythm Advisory Method |
Family Cites Families (17)
| Publication number | Priority date | Publication date | Assignee | Title |
|---|---|---|---|---|
| JP3524976B2 (en) | 1994-02-04 | 2004-05-10 | 浜松ホトニクス株式会社 | Concentration measuring device |
| JP3599426B2 (en) * | 1995-07-05 | 2004-12-08 | 株式会社日立製作所 | Biological light measurement device |
| US5603321A (en) * | 1995-08-07 | 1997-02-18 | Biomagnetic Technologies, Inc. | Artifact removal from physiological signals |
| US7998080B2 (en) * | 2002-01-15 | 2011-08-16 | Orsan Medical Technologies Ltd. | Method for monitoring blood flow to brain |
| US20030212316A1 (en) * | 2002-05-10 | 2003-11-13 | Leiden Jeffrey M. | Method and apparatus for determining blood parameters and vital signs of a patient |
| JP3732476B2 (en) * | 2002-10-22 | 2006-01-05 | 株式会社日立製作所 | Biological measuring device |
| JP4164386B2 (en) * | 2003-02-28 | 2008-10-15 | 株式会社日立製作所 | Biological light measurement device |
| JP4590555B2 (en) | 2004-09-02 | 2010-12-01 | 国立大学法人長岡技術科学大学 | Sensitive state discrimination method and apparatus |
| US20110152249A1 (en) * | 2004-12-23 | 2011-06-23 | The General Hospital Corporation | Evaluating central nervous system |
| US20100210947A1 (en) | 2005-11-17 | 2010-08-19 | Koninklijke Philips Electronics N.V. | Vascular Flow Sensor With Acoustic Coupling Detector |
| JP4702107B2 (en) * | 2006-03-03 | 2011-06-15 | 株式会社日立製作所 | Biological light measurement device |
| JP2008167818A (en) * | 2007-01-09 | 2008-07-24 | Konica Minolta Sensing Inc | Biological information measuring apparatus and biometric information measuring system |
| EP3058929A3 (en) * | 2007-11-01 | 2016-10-19 | Zoll Medical Corporation | Synchronization of defibrillation and chest compressions |
| JP5188786B2 (en) * | 2007-11-27 | 2013-04-24 | 株式会社スペクトラテック | Biological information measuring device |
| US20110160555A1 (en) * | 2008-07-31 | 2011-06-30 | Jacques Reifman | Universal Models for Predicting Glucose Concentration in Humans |
| JP2010276407A (en) | 2009-05-27 | 2010-12-09 | Spectratech Inc | Photodetector and device for measuring biological information |
| JP5568037B2 (en) * | 2011-03-11 | 2014-08-06 | 日本光電工業株式会社 | Cardiopulmonary resuscitation monitoring device |
-
2011
- 2011-04-21 JP JP2011095318A patent/JP5382666B2/en active Active
-
2012
- 2012-04-06 EP EP16182348.9A patent/EP3111843B1/en active Active
- 2012-04-06 US US14/112,702 patent/US9808189B2/en active Active
- 2012-04-06 EP EP12774805.1A patent/EP2700357B1/en active Active
- 2012-04-06 CN CN201280019534.8A patent/CN103491873B/en active Active
- 2012-04-06 WO PCT/JP2012/059581 patent/WO2012144356A1/en active Application Filing
- 2012-04-06 CN CN201610098707.XA patent/CN105748059B/en active Active
- 2012-04-19 TW TW101114030A patent/TWI549656B/en active
-
2017
- 2017-09-29 US US15/720,299 patent/US10660551B2/en active Active
Patent Citations (7)
| Publication number | Priority date | Publication date | Assignee | Title |
|---|---|---|---|---|
| US20050131303A1 (en) * | 1994-10-06 | 2005-06-16 | Atsushi Maki | Optical system for measuring metabolism in a body and imaging method |
| US6393311B1 (en) * | 1998-10-15 | 2002-05-21 | Ntc Technology Inc. | Method, apparatus and system for removing motion artifacts from measurements of bodily parameters |
| US7569018B1 (en) * | 2003-02-18 | 2009-08-04 | Purdue Research Foundation | Apparatus and method for noninvasively detecting the quality of cardiac pumping |
| US7190999B2 (en) * | 2003-06-27 | 2007-03-13 | Zoll Medical Corporation | Cardio-pulmonary resuscitation device with feedback from measurement of pulse and/or blood oxygenation |
| US20110034816A1 (en) * | 2004-05-12 | 2011-02-10 | Qing Tan | ECG Rhythm Advisory Method |
| US20080221464A1 (en) * | 2007-01-20 | 2008-09-11 | Ammar Al-Ali | Perfusion trend indicator |
| US20090326353A1 (en) * | 2008-06-30 | 2009-12-31 | Nellcor Puritan Bennett Ireland | Processing and detecting baseline changes in signals |
Non-Patent Citations (1)
| Title |
|---|
| See also references of WO2012144356A1 * |
Cited By (3)
| Publication number | Priority date | Publication date | Assignee | Title |
|---|---|---|---|---|
| WO2016118588A1 (en) * | 2015-01-20 | 2016-07-28 | Covidien Lp | System and method for cardiopulmonary resuscitation |
| US10413476B2 (en) | 2015-01-20 | 2019-09-17 | Covidien Lp | System and method for cardiopulmonary resuscitation |
| US10426695B2 (en) | 2015-09-08 | 2019-10-01 | Covidien Lp | System and method for cardiopulmonary resuscitation |
Also Published As
| Publication number | Publication date |
|---|---|
| US20180020959A1 (en) | 2018-01-25 |
| CN103491873B (en) | 2016-03-23 |
| CN105748059A (en) | 2016-07-13 |
| EP2700357B1 (en) | 2016-10-26 |
| EP2700357A4 (en) | 2014-12-31 |
| CN105748059B (en) | 2017-12-22 |
| JP5382666B2 (en) | 2014-01-08 |
| CN103491873A (en) | 2014-01-01 |
| US10660551B2 (en) | 2020-05-26 |
| US20140058233A1 (en) | 2014-02-27 |
| WO2012144356A1 (en) | 2012-10-26 |
| US9808189B2 (en) | 2017-11-07 |
| JP2012223451A (en) | 2012-11-15 |
| EP3111843A1 (en) | 2017-01-04 |
| TWI549656B (en) | 2016-09-21 |
| TW201249403A (en) | 2012-12-16 |
| EP3111843B1 (en) | 2019-06-05 |
Similar Documents
| Publication | Publication Date | Title |
|---|---|---|
| US10660551B2 (en) | Concentration-measurement device and concentration-measurement method | |
| US10405783B2 (en) | Concentration measurement device and concentration measurement method | |
| EP2818109B1 (en) | Concentration measurement device and concentration measurement method | |
| JP6399528B2 (en) | Concentration measuring device and method of operating the concentration measuring device | |
| JP6006668B2 (en) | Concentration measuring device and concentration measuring method | |
| JP6016145B2 (en) | Concentration measuring device and method of operating the concentration measuring device | |
| JP6412074B2 (en) | Concentration measuring device and concentration measuring method | |
| JP6124371B2 (en) | Concentration measuring device and method of operating the concentration measuring device | |
| JP5828524B2 (en) | Concentration measuring device and concentration measuring method | |
| EP4331555A1 (en) | Device and method for assessing sternal compression | |
| JP6005947B2 (en) | Concentration measuring device and concentration measuring method |
Legal Events
| Date | Code | Title | Description |
|---|---|---|---|
| PUAI | Public reference made under article 153(3) epc to a published international application that has entered the european phase |
Free format text: ORIGINAL CODE: 0009012 |
|
| 17P | Request for examination filed |
Effective date: 20131107 |
|
| AK | Designated contracting states |
Kind code of ref document: A1 Designated state(s): AL AT BE BG CH CY CZ DE DK EE ES FI FR GB GR HR HU IE IS IT LI LT LU LV MC MK MT NL NO PL PT RO RS SE SI SK SM TR |
|
| DAX | Request for extension of the european patent (deleted) | ||
| A4 | Supplementary search report drawn up and despatched |
Effective date: 20141202 |
|
| RIC1 | Information provided on ipc code assigned before grant |
Ipc: A61H 31/00 20060101ALN20141126BHEP Ipc: A61B 5/026 20060101ALI20141126BHEP Ipc: A61B 5/0295 20060101ALN20141126BHEP Ipc: A61B 10/00 20060101ALI20141126BHEP Ipc: A61B 5/1455 20060101AFI20141126BHEP |
|
| GRAP | Despatch of communication of intention to grant a patent |
Free format text: ORIGINAL CODE: EPIDOSNIGR1 |
|
| RIC1 | Information provided on ipc code assigned before grant |
Ipc: A61B 5/0295 20060101ALN20160413BHEP Ipc: A61B 10/00 20060101ALI20160413BHEP Ipc: A61B 5/026 20060101ALI20160413BHEP Ipc: A61H 31/00 20060101ALN20160413BHEP Ipc: A61B 5/1455 20060101AFI20160413BHEP |
|
| INTG | Intention to grant announced |
Effective date: 20160518 |
|
| GRAS | Grant fee paid |
Free format text: ORIGINAL CODE: EPIDOSNIGR3 |
|
| GRAA | (expected) grant |
Free format text: ORIGINAL CODE: 0009210 |
|
| AK | Designated contracting states |
Kind code of ref document: B1 Designated state(s): AL AT BE BG CH CY CZ DE DK EE ES FI FR GB GR HR HU IE IS IT LI LT LU LV MC MK MT NL NO PL PT RO RS SE SI SK SM TR |
|
| REG | Reference to a national code |
Ref country code: GB Ref legal event code: FG4D |
|
| REG | Reference to a national code |
Ref country code: CH Ref legal event code: EP |
|
| REG | Reference to a national code |
Ref country code: AT Ref legal event code: REF Ref document number: 839394 Country of ref document: AT Kind code of ref document: T Effective date: 20161115 |
|
| REG | Reference to a national code |
Ref country code: IE Ref legal event code: FG4D |
|
| REG | Reference to a national code |
Ref country code: DE Ref legal event code: R096 Ref document number: 602012024617 Country of ref document: DE |
|
| REG | Reference to a national code |
Ref country code: LT Ref legal event code: MG4D |
|
| PG25 | Lapsed in a contracting state [announced via postgrant information from national office to epo] |
Ref country code: LV Free format text: LAPSE BECAUSE OF FAILURE TO SUBMIT A TRANSLATION OF THE DESCRIPTION OR TO PAY THE FEE WITHIN THE PRESCRIBED TIME-LIMIT Effective date: 20161026 |
|
| REG | Reference to a national code |
Ref country code: NL Ref legal event code: MP Effective date: 20161026 |
|
| REG | Reference to a national code |
Ref country code: FR Ref legal event code: PLFP Year of fee payment: 6 |
|
| REG | Reference to a national code |
Ref country code: AT Ref legal event code: MK05 Ref document number: 839394 Country of ref document: AT Kind code of ref document: T Effective date: 20161026 |
|
| PG25 | Lapsed in a contracting state [announced via postgrant information from national office to epo] |
Ref country code: NO Free format text: LAPSE BECAUSE OF FAILURE TO SUBMIT A TRANSLATION OF THE DESCRIPTION OR TO PAY THE FEE WITHIN THE PRESCRIBED TIME-LIMIT Effective date: 20170126 Ref country code: SE Free format text: LAPSE BECAUSE OF FAILURE TO SUBMIT A TRANSLATION OF THE DESCRIPTION OR TO PAY THE FEE WITHIN THE PRESCRIBED TIME-LIMIT Effective date: 20161026 Ref country code: GR Free format text: LAPSE BECAUSE OF FAILURE TO SUBMIT A TRANSLATION OF THE DESCRIPTION OR TO PAY THE FEE WITHIN THE PRESCRIBED TIME-LIMIT Effective date: 20170127 Ref country code: LT Free format text: LAPSE BECAUSE OF FAILURE TO SUBMIT A TRANSLATION OF THE DESCRIPTION OR TO PAY THE FEE WITHIN THE PRESCRIBED TIME-LIMIT Effective date: 20161026 |
|
| PG25 | Lapsed in a contracting state [announced via postgrant information from national office to epo] |
Ref country code: RS Free format text: LAPSE BECAUSE OF FAILURE TO SUBMIT A TRANSLATION OF THE DESCRIPTION OR TO PAY THE FEE WITHIN THE PRESCRIBED TIME-LIMIT Effective date: 20161026 Ref country code: FI Free format text: LAPSE BECAUSE OF FAILURE TO SUBMIT A TRANSLATION OF THE DESCRIPTION OR TO PAY THE FEE WITHIN THE PRESCRIBED TIME-LIMIT Effective date: 20161026 Ref country code: PL Free format text: LAPSE BECAUSE OF FAILURE TO SUBMIT A TRANSLATION OF THE DESCRIPTION OR TO PAY THE FEE WITHIN THE PRESCRIBED TIME-LIMIT Effective date: 20161026 Ref country code: HR Free format text: LAPSE BECAUSE OF FAILURE TO SUBMIT A TRANSLATION OF THE DESCRIPTION OR TO PAY THE FEE WITHIN THE PRESCRIBED TIME-LIMIT Effective date: 20161026 Ref country code: BE Free format text: LAPSE BECAUSE OF FAILURE TO SUBMIT A TRANSLATION OF THE DESCRIPTION OR TO PAY THE FEE WITHIN THE PRESCRIBED TIME-LIMIT Effective date: 20161026 Ref country code: AT Free format text: LAPSE BECAUSE OF FAILURE TO SUBMIT A TRANSLATION OF THE DESCRIPTION OR TO PAY THE FEE WITHIN THE PRESCRIBED TIME-LIMIT Effective date: 20161026 Ref country code: PT Free format text: LAPSE BECAUSE OF FAILURE TO SUBMIT A TRANSLATION OF THE DESCRIPTION OR TO PAY THE FEE WITHIN THE PRESCRIBED TIME-LIMIT Effective date: 20170227 Ref country code: ES Free format text: LAPSE BECAUSE OF FAILURE TO SUBMIT A TRANSLATION OF THE DESCRIPTION OR TO PAY THE FEE WITHIN THE PRESCRIBED TIME-LIMIT Effective date: 20161026 Ref country code: IS Free format text: LAPSE BECAUSE OF FAILURE TO SUBMIT A TRANSLATION OF THE DESCRIPTION OR TO PAY THE FEE WITHIN THE PRESCRIBED TIME-LIMIT Effective date: 20170226 Ref country code: NL Free format text: LAPSE BECAUSE OF FAILURE TO SUBMIT A TRANSLATION OF THE DESCRIPTION OR TO PAY THE FEE WITHIN THE PRESCRIBED TIME-LIMIT Effective date: 20161026 |
|
| REG | Reference to a national code |
Ref country code: DE Ref legal event code: R097 Ref document number: 602012024617 Country of ref document: DE |
|
| PG25 | Lapsed in a contracting state [announced via postgrant information from national office to epo] |
Ref country code: SK Free format text: LAPSE BECAUSE OF FAILURE TO SUBMIT A TRANSLATION OF THE DESCRIPTION OR TO PAY THE FEE WITHIN THE PRESCRIBED TIME-LIMIT Effective date: 20161026 Ref country code: EE Free format text: LAPSE BECAUSE OF FAILURE TO SUBMIT A TRANSLATION OF THE DESCRIPTION OR TO PAY THE FEE WITHIN THE PRESCRIBED TIME-LIMIT Effective date: 20161026 Ref country code: RO Free format text: LAPSE BECAUSE OF FAILURE TO SUBMIT A TRANSLATION OF THE DESCRIPTION OR TO PAY THE FEE WITHIN THE PRESCRIBED TIME-LIMIT Effective date: 20161026 Ref country code: DK Free format text: LAPSE BECAUSE OF FAILURE TO SUBMIT A TRANSLATION OF THE DESCRIPTION OR TO PAY THE FEE WITHIN THE PRESCRIBED TIME-LIMIT Effective date: 20161026 Ref country code: CZ Free format text: LAPSE BECAUSE OF FAILURE TO SUBMIT A TRANSLATION OF THE DESCRIPTION OR TO PAY THE FEE WITHIN THE PRESCRIBED TIME-LIMIT Effective date: 20161026 |
|
| PG25 | Lapsed in a contracting state [announced via postgrant information from national office to epo] |
Ref country code: SM Free format text: LAPSE BECAUSE OF FAILURE TO SUBMIT A TRANSLATION OF THE DESCRIPTION OR TO PAY THE FEE WITHIN THE PRESCRIBED TIME-LIMIT Effective date: 20161026 Ref country code: BG Free format text: LAPSE BECAUSE OF FAILURE TO SUBMIT A TRANSLATION OF THE DESCRIPTION OR TO PAY THE FEE WITHIN THE PRESCRIBED TIME-LIMIT Effective date: 20170126 |
|
| PLBE | No opposition filed within time limit |
Free format text: ORIGINAL CODE: 0009261 |
|
| STAA | Information on the status of an ep patent application or granted ep patent |
Free format text: STATUS: NO OPPOSITION FILED WITHIN TIME LIMIT |
|
| 26N | No opposition filed |
Effective date: 20170727 |
|
| PG25 | Lapsed in a contracting state [announced via postgrant information from national office to epo] |
Ref country code: SI Free format text: LAPSE BECAUSE OF FAILURE TO SUBMIT A TRANSLATION OF THE DESCRIPTION OR TO PAY THE FEE WITHIN THE PRESCRIBED TIME-LIMIT Effective date: 20161026 |
|
| REG | Reference to a national code |
Ref country code: CH Ref legal event code: PL |
|
| REG | Reference to a national code |
Ref country code: IE Ref legal event code: MM4A |
|
| PG25 | Lapsed in a contracting state [announced via postgrant information from national office to epo] |
Ref country code: MC Free format text: LAPSE BECAUSE OF FAILURE TO SUBMIT A TRANSLATION OF THE DESCRIPTION OR TO PAY THE FEE WITHIN THE PRESCRIBED TIME-LIMIT Effective date: 20161026 |
|
| PG25 | Lapsed in a contracting state [announced via postgrant information from national office to epo] |
Ref country code: LI Free format text: LAPSE BECAUSE OF NON-PAYMENT OF DUE FEES Effective date: 20170430 Ref country code: LU Free format text: LAPSE BECAUSE OF NON-PAYMENT OF DUE FEES Effective date: 20170406 Ref country code: CH Free format text: LAPSE BECAUSE OF NON-PAYMENT OF DUE FEES Effective date: 20170430 |
|
| REG | Reference to a national code |
Ref country code: FR Ref legal event code: PLFP Year of fee payment: 7 |
|
| PG25 | Lapsed in a contracting state [announced via postgrant information from national office to epo] |
Ref country code: IE Free format text: LAPSE BECAUSE OF NON-PAYMENT OF DUE FEES Effective date: 20170406 |
|
| PG25 | Lapsed in a contracting state [announced via postgrant information from national office to epo] |
Ref country code: MT Free format text: LAPSE BECAUSE OF NON-PAYMENT OF DUE FEES Effective date: 20170406 |
|
| PG25 | Lapsed in a contracting state [announced via postgrant information from national office to epo] |
Ref country code: HU Free format text: LAPSE BECAUSE OF FAILURE TO SUBMIT A TRANSLATION OF THE DESCRIPTION OR TO PAY THE FEE WITHIN THE PRESCRIBED TIME-LIMIT; INVALID AB INITIO Effective date: 20120406 |
|
| PG25 | Lapsed in a contracting state [announced via postgrant information from national office to epo] |
Ref country code: CY Free format text: LAPSE BECAUSE OF NON-PAYMENT OF DUE FEES Effective date: 20161026 |
|
| PG25 | Lapsed in a contracting state [announced via postgrant information from national office to epo] |
Ref country code: MK Free format text: LAPSE BECAUSE OF FAILURE TO SUBMIT A TRANSLATION OF THE DESCRIPTION OR TO PAY THE FEE WITHIN THE PRESCRIBED TIME-LIMIT Effective date: 20161026 |
|
| PG25 | Lapsed in a contracting state [announced via postgrant information from national office to epo] |
Ref country code: TR Free format text: LAPSE BECAUSE OF FAILURE TO SUBMIT A TRANSLATION OF THE DESCRIPTION OR TO PAY THE FEE WITHIN THE PRESCRIBED TIME-LIMIT Effective date: 20161026 |
|
| PG25 | Lapsed in a contracting state [announced via postgrant information from national office to epo] |
Ref country code: AL Free format text: LAPSE BECAUSE OF FAILURE TO SUBMIT A TRANSLATION OF THE DESCRIPTION OR TO PAY THE FEE WITHIN THE PRESCRIBED TIME-LIMIT Effective date: 20161026 |
|
| PGFP | Annual fee paid to national office [announced via postgrant information from national office to epo] |
Ref country code: FR Payment date: 20230309 Year of fee payment: 12 |
|
| PGFP | Annual fee paid to national office [announced via postgrant information from national office to epo] |
Ref country code: IT Payment date: 20230310 Year of fee payment: 12 Ref country code: GB Payment date: 20230302 Year of fee payment: 12 |
|
| P01 | Opt-out of the competence of the unified patent court (upc) registered |
Effective date: 20230510 |
|
| PGFP | Annual fee paid to national office [announced via postgrant information from national office to epo] |
Ref country code: DE Payment date: 20230228 Year of fee payment: 12 |