EP2474626A2 - Detecting neoplasm from a stool sample - Google Patents
Detecting neoplasm from a stool sample Download PDFInfo
- Publication number
- EP2474626A2 EP2474626A2 EP11189541A EP11189541A EP2474626A2 EP 2474626 A2 EP2474626 A2 EP 2474626A2 EP 11189541 A EP11189541 A EP 11189541A EP 11189541 A EP11189541 A EP 11189541A EP 2474626 A2 EP2474626 A2 EP 2474626A2
- Authority
- EP
- European Patent Office
- Prior art keywords
- cancer
- dna
- elevated
- stool
- ras
- Prior art date
- Legal status (The legal status is an assumption and is not a legal conclusion. Google has not performed a legal analysis and makes no representation as to the accuracy of the status listed.)
- Granted
Links
Images


Classifications
-
- C—CHEMISTRY; METALLURGY
- C12—BIOCHEMISTRY; BEER; SPIRITS; WINE; VINEGAR; MICROBIOLOGY; ENZYMOLOGY; MUTATION OR GENETIC ENGINEERING
- C12Q—MEASURING OR TESTING PROCESSES INVOLVING ENZYMES, NUCLEIC ACIDS OR MICROORGANISMS; COMPOSITIONS OR TEST PAPERS THEREFOR; PROCESSES OF PREPARING SUCH COMPOSITIONS; CONDITION-RESPONSIVE CONTROL IN MICROBIOLOGICAL OR ENZYMOLOGICAL PROCESSES
- C12Q1/00—Measuring or testing processes involving enzymes, nucleic acids or microorganisms; Compositions therefor; Processes of preparing such compositions
- C12Q1/68—Measuring or testing processes involving enzymes, nucleic acids or microorganisms; Compositions therefor; Processes of preparing such compositions involving nucleic acids
- C12Q1/6876—Nucleic acid products used in the analysis of nucleic acids, e.g. primers or probes
- C12Q1/6883—Nucleic acid products used in the analysis of nucleic acids, e.g. primers or probes for diseases caused by alterations of genetic material
- C12Q1/6886—Nucleic acid products used in the analysis of nucleic acids, e.g. primers or probes for diseases caused by alterations of genetic material for cancer
-
- C—CHEMISTRY; METALLURGY
- C12—BIOCHEMISTRY; BEER; SPIRITS; WINE; VINEGAR; MICROBIOLOGY; ENZYMOLOGY; MUTATION OR GENETIC ENGINEERING
- C12Q—MEASURING OR TESTING PROCESSES INVOLVING ENZYMES, NUCLEIC ACIDS OR MICROORGANISMS; COMPOSITIONS OR TEST PAPERS THEREFOR; PROCESSES OF PREPARING SUCH COMPOSITIONS; CONDITION-RESPONSIVE CONTROL IN MICROBIOLOGICAL OR ENZYMOLOGICAL PROCESSES
- C12Q1/00—Measuring or testing processes involving enzymes, nucleic acids or microorganisms; Compositions therefor; Processes of preparing such compositions
- C12Q1/34—Measuring or testing processes involving enzymes, nucleic acids or microorganisms; Compositions therefor; Processes of preparing such compositions involving hydrolase
- C12Q1/37—Measuring or testing processes involving enzymes, nucleic acids or microorganisms; Compositions therefor; Processes of preparing such compositions involving hydrolase involving peptidase or proteinase
-
- C—CHEMISTRY; METALLURGY
- C12—BIOCHEMISTRY; BEER; SPIRITS; WINE; VINEGAR; MICROBIOLOGY; ENZYMOLOGY; MUTATION OR GENETIC ENGINEERING
- C12Q—MEASURING OR TESTING PROCESSES INVOLVING ENZYMES, NUCLEIC ACIDS OR MICROORGANISMS; COMPOSITIONS OR TEST PAPERS THEREFOR; PROCESSES OF PREPARING SUCH COMPOSITIONS; CONDITION-RESPONSIVE CONTROL IN MICROBIOLOGICAL OR ENZYMOLOGICAL PROCESSES
- C12Q1/00—Measuring or testing processes involving enzymes, nucleic acids or microorganisms; Compositions therefor; Processes of preparing such compositions
- C12Q1/34—Measuring or testing processes involving enzymes, nucleic acids or microorganisms; Compositions therefor; Processes of preparing such compositions involving hydrolase
- C12Q1/40—Measuring or testing processes involving enzymes, nucleic acids or microorganisms; Compositions therefor; Processes of preparing such compositions involving hydrolase involving amylase
-
- C—CHEMISTRY; METALLURGY
- C12—BIOCHEMISTRY; BEER; SPIRITS; WINE; VINEGAR; MICROBIOLOGY; ENZYMOLOGY; MUTATION OR GENETIC ENGINEERING
- C12Y—ENZYMES
- C12Y302/00—Hydrolases acting on glycosyl compounds, i.e. glycosylases (3.2)
- C12Y302/01—Glycosidases, i.e. enzymes hydrolysing O- and S-glycosyl compounds (3.2.1)
- C12Y302/01001—Alpha-amylase (3.2.1.1)
-
- C—CHEMISTRY; METALLURGY
- C12—BIOCHEMISTRY; BEER; SPIRITS; WINE; VINEGAR; MICROBIOLOGY; ENZYMOLOGY; MUTATION OR GENETIC ENGINEERING
- C12Y—ENZYMES
- C12Y304/00—Hydrolases acting on peptide bonds, i.e. peptidases (3.4)
- C12Y304/21—Serine endopeptidases (3.4.21)
- C12Y304/2107—Pancreatic endopeptidase E (3.4.21.70)
-
- G—PHYSICS
- G01—MEASURING; TESTING
- G01N—INVESTIGATING OR ANALYSING MATERIALS BY DETERMINING THEIR CHEMICAL OR PHYSICAL PROPERTIES
- G01N33/00—Investigating or analysing materials by specific methods not covered by groups G01N1/00 - G01N31/00
- G01N33/48—Biological material, e.g. blood, urine; Haemocytometers
- G01N33/50—Chemical analysis of biological material, e.g. blood, urine; Testing involving biospecific ligand binding methods; Immunological testing
- G01N33/53—Immunoassay; Biospecific binding assay; Materials therefor
- G01N33/574—Immunoassay; Biospecific binding assay; Materials therefor for cancer
- G01N33/57407—Specifically defined cancers
- G01N33/57419—Specifically defined cancers of colon
-
- G—PHYSICS
- G01—MEASURING; TESTING
- G01N—INVESTIGATING OR ANALYSING MATERIALS BY DETERMINING THEIR CHEMICAL OR PHYSICAL PROPERTIES
- G01N33/00—Investigating or analysing materials by specific methods not covered by groups G01N1/00 - G01N31/00
- G01N33/48—Biological material, e.g. blood, urine; Haemocytometers
- G01N33/50—Chemical analysis of biological material, e.g. blood, urine; Testing involving biospecific ligand binding methods; Immunological testing
- G01N33/53—Immunoassay; Biospecific binding assay; Materials therefor
- G01N33/574—Immunoassay; Biospecific binding assay; Materials therefor for cancer
- G01N33/57407—Specifically defined cancers
- G01N33/57438—Specifically defined cancers of liver, pancreas or kidney
-
- C—CHEMISTRY; METALLURGY
- C12—BIOCHEMISTRY; BEER; SPIRITS; WINE; VINEGAR; MICROBIOLOGY; ENZYMOLOGY; MUTATION OR GENETIC ENGINEERING
- C12Q—MEASURING OR TESTING PROCESSES INVOLVING ENZYMES, NUCLEIC ACIDS OR MICROORGANISMS; COMPOSITIONS OR TEST PAPERS THEREFOR; PROCESSES OF PREPARING SUCH COMPOSITIONS; CONDITION-RESPONSIVE CONTROL IN MICROBIOLOGICAL OR ENZYMOLOGICAL PROCESSES
- C12Q2600/00—Oligonucleotides characterized by their use
- C12Q2600/154—Methylation markers
-
- C—CHEMISTRY; METALLURGY
- C12—BIOCHEMISTRY; BEER; SPIRITS; WINE; VINEGAR; MICROBIOLOGY; ENZYMOLOGY; MUTATION OR GENETIC ENGINEERING
- C12Q—MEASURING OR TESTING PROCESSES INVOLVING ENZYMES, NUCLEIC ACIDS OR MICROORGANISMS; COMPOSITIONS OR TEST PAPERS THEREFOR; PROCESSES OF PREPARING SUCH COMPOSITIONS; CONDITION-RESPONSIVE CONTROL IN MICROBIOLOGICAL OR ENZYMOLOGICAL PROCESSES
- C12Q2600/00—Oligonucleotides characterized by their use
- C12Q2600/156—Polymorphic or mutational markers
-
- C—CHEMISTRY; METALLURGY
- C12—BIOCHEMISTRY; BEER; SPIRITS; WINE; VINEGAR; MICROBIOLOGY; ENZYMOLOGY; MUTATION OR GENETIC ENGINEERING
- C12Q—MEASURING OR TESTING PROCESSES INVOLVING ENZYMES, NUCLEIC ACIDS OR MICROORGANISMS; COMPOSITIONS OR TEST PAPERS THEREFOR; PROCESSES OF PREPARING SUCH COMPOSITIONS; CONDITION-RESPONSIVE CONTROL IN MICROBIOLOGICAL OR ENZYMOLOGICAL PROCESSES
- C12Q2600/00—Oligonucleotides characterized by their use
- C12Q2600/158—Expression markers
-
- G—PHYSICS
- G01—MEASURING; TESTING
- G01N—INVESTIGATING OR ANALYSING MATERIALS BY DETERMINING THEIR CHEMICAL OR PHYSICAL PROPERTIES
- G01N2333/00—Assays involving biological materials from specific organisms or of a specific nature
- G01N2333/90—Enzymes; Proenzymes
- G01N2333/914—Hydrolases (3)
- G01N2333/924—Hydrolases (3) acting on glycosyl compounds (3.2)
- G01N2333/926—Hydrolases (3) acting on glycosyl compounds (3.2) acting on alpha -1, 4-glucosidic bonds, e.g. hyaluronidase, invertase, amylase
- G01N2333/928—Hydrolases (3) acting on glycosyl compounds (3.2) acting on alpha -1, 4-glucosidic bonds, e.g. hyaluronidase, invertase, amylase acting on alpha -1, 4-glucosidic bonds, e.g. hyaluronidase, invertase, amylase
-
- G—PHYSICS
- G01—MEASURING; TESTING
- G01N—INVESTIGATING OR ANALYSING MATERIALS BY DETERMINING THEIR CHEMICAL OR PHYSICAL PROPERTIES
- G01N2333/00—Assays involving biological materials from specific organisms or of a specific nature
- G01N2333/90—Enzymes; Proenzymes
- G01N2333/914—Hydrolases (3)
- G01N2333/948—Hydrolases (3) acting on peptide bonds (3.4)
- G01N2333/966—Elastase
-
- G—PHYSICS
- G01—MEASURING; TESTING
- G01N—INVESTIGATING OR ANALYSING MATERIALS BY DETERMINING THEIR CHEMICAL OR PHYSICAL PROPERTIES
- G01N2560/00—Chemical aspects of mass spectrometric analysis of biological material
Definitions
- This document relates to methods and materials involved in detecting premalignant and malignant neoplasms (e.g ., colorectal and pancreatic cancer).
- aero-digestive cancer About half of all cancer deaths in the United States result from aero-digestive cancer. For example, of the estimated annual cancer deaths, about 2.5 percent result from lung cancer; about 10 percent result from colorectal cancer; about 6 percent result from pancreas cancer; about 3 percent result from stomach cancer; and about 3 percent result from esophagus cancer. In addition, over 7 percent of the annual cancer deaths result from other aero-digestive cancers such as naso-ono-pharyngeal, bile duct, gall bladder, and small bowel cancers.
- aero-digestive cancers such as naso-ono-pharyngeal, bile duct, gall bladder, and small bowel cancers.
- This document relates to methods and materials for detecting premalignant and malignant neoplasms (e.g ., colorectal and pancreatic cancer). For example, this document provides methods and materials that can be used to determine whether a sample (e.g ., a stool sample) from a mammal contains a marker for a premalignant and malignant neoplasm such as a marker from a colonic or supracolonic aero-digestive neoplasm located in the mammal. The detection of such a marker in a sample from a mammal can allow a clinician to diagnose cancer at an early stage. In addition, the analysis of a sample such as a stool sample can be much less invasive than other types of diagnostic techniques such as endoscopy.
- a sample e.g ., a stool sample
- a marker for a premalignant and malignant neoplasm such as a marker from a colonic or supracolonic aero-digestive neoplasm located in the mam
- a biological sample e . g., a stool sample
- a biological sample e . g., a stool sample
- a neoplasm located, for example, in a mammal's small intestine, gall bladder, bile duct, pancreas, liver, stomach, esophagus, lung, or naso-oropharyngeal airways.
- stool can be analyzed to identify mammals having cancer. Once a particular mammal is determined to have stool containing a neoplasm-specific marker or collection of markers, additional cancer screening techniques can be used to identify the location and nature of the neoplasm.
- a stool sample can be analyzed to determine that the patient has a neoplasm, while magnetic resonance imaging (MRI), endoscopic analysis, and tissue biopsy techniques can be used to identify the location and nature of the neoplasm.
- MRI magnetic resonance imaging
- endoscopic analysis endoscopic analysis
- tissue biopsy techniques can be used to identify the location and nature of the neoplasm.
- a combination of markers can be used to identify the location and nature of the neoplasm without additional cancer screening techniques such as MRI, endoscopic analysis, and tissue biopsy techniques.
- one aspect of this document features a method of detecting pancreatic cancer in a mammal.
- the method comprises, or consists essentially of determining the ratio of an elastase 3A polypeptide to a pancreatic alpha-amylase polypeptide present within a stool sample.
- the presence of a ratio greater than about 0.5 indicates that the mammal has pancreatic cancer.
- the presence of a ratio less than about 0.5 indicates that the mammal does not have pancreatic cancer.
- this document features a method of detecting pancreatic cancer in a mammal.
- the method comprises or consists essentially of determining the level of an elastase 3A polypeptide in a stool sample from the mammal.
- this document features a method of detecting pancreatic cancer in a mammal.
- the method comprises, or consists essentially of, determining the level of a carboxypeptidase B polypeptide in a stool sample from the mammal. An increase in the level of a carboxypeptidase B polypeptide, when compared to a normal control level, is indicative of pancreatic cancer in the mammal.
- this document features a method of detecting pancreatic cancer in a mammal.
- the method comprises, or consists essentially of, determining whether or not a stool sample from the mammal comprises a ratio of a carboxypeptidase B polypeptide to a carboxypeptidase A2 polypeptide that is greater than about 05. The presence of the ratio greater than about 0.5 indicates that the mammal has pancreatic cancer.
- this document features a method of detecting cancer or pre-cancer in a mammal.
- the method comprises, or consists essentially of, determining whether or not a stool sample from the mammal has an increase in the number of DNA fragments less than 200 base pairs in length, as compared to a normal control.
- the presence of the increase in the number of DNA fragments less than 200 base pairs in length indicates that the mammal has cancer or pre-cancer.
- the DNA fragments can be less than 70 base pairs in length.
- this document features a method of detecting colorectal cancer or pre-cancer in a mammal.
- the method comprises, or consists essentially of, determining whether or not a stool sample from the mammal has an elevated K-ras (Kirsten rat sarcoma-2 viral (v-Ki-ras2) oncogene homolog (GenBank accession no. NM_033360; gi
- K-ras Keratrial rat sarcoma-2 viral (v-Ki-ras2) oncogene homolog
- BMP3 bone morphogenetic protein 3 (GenBank accession no. M22491; gi
- an elevated level of human DNA as compared to
- the presence of the elevated K-ras mutation score, elevated BMP3 methylation status, and elevated level of human DNA level indicates that the mammal has colorectal cancer or pre-cancer.
- the K-ras mutation score can be measured by digital melt curve analysis
- the K-ras mutation score can be measured by quantitative allele specific PCR.
- this document features a method of detecting aero-digestive cancer or pre-cancer in a mammal.
- the method comprises, or consists essentially of, determining whether or not a stool sample from the mammal has an elevated K-ras mutation score, an elevated BMP.3 methylation status, and an elevated level of human DNA as compared to a normal control.
- the presence of the elevated K-ras mutation score, elevated BMP3 methylation status, and elevated level of human DNA level indicates that the mammal has aero-digestive cancer or pre-cancer.
- the K-ras mutation score can be measured by digital melt curve analysis.
- the K-ras mutation score can be measured by quantitative allele-specific PCR.
- the method can further comprise determining whether or not a stool sample from the mammal has an elevated APC mutation score.
- the APC mutation score can be measured by digital melt curve analysis.
- this document features a method of detecting aero-digestive cancer or pre-cancer in a mammal.
- the method comprises, or consists essentially of, determining whether or not the mammal has at least one mutation in six nucleic acids selected from the group consisting of p16, p53, k-ras, APC (adenomatosis polyposis coli tumor suppressor (GenBank accession no NM_000038; gi
- NM_005228 gi
- CTNNB1 catenin (cadherin-associated protein), beta 1 (88kD) (GenBank accession no. X87838; gi
- BRAF B-Raf proto-oncogene serine/threonine-protein kinase (p94) (GenBaxLk accession no. NM_004333; gi
- the presence of at least one mutation in each of the six nucleic acids indicates that the mammal has aero-digestive cancer or pre-cancer.
- the method can further comprise determining whether or not a stool sample from the mammal has an elevated level of a carboxypeptidase B polypeptide as compared to a normal control. The presence of the elevated level of a caboxypeptidase B polypeptide indicates that the mammal has aero-digestive cancer or pre-cancer in the mammal.
- the method can further comprise determining whether or not a stool sample from the mammal has an elevated amount of DNA fragments less than 70 base pairs in length as compared to a normal control. The presence of the elevated amount of DNA fragments less than 70 base pairs in length indicates that the mammal has aero-digestive cancer or pre-cancer.
- the method can further comprise determining whether or not a stool sample from the mammal has an elevated amount of DNA fragments greater than 100 base pairs in length as compared to normal controls. The presence of the elevated amount of DNA fragments greater than 100 base pairs in length indicates that the mammal has aero-digestive cancer or pre-cancer.
- the method can further comprise determining whether or not a stool sample from the mammal has an elevated BMP3 methylation status. The elevated BMP3 methylation status level indicates that the mammal has aero-digestive cancer or pre-cancer.
- the determining step can comprise using digital melt curve analysis.
- this document features a method of detecting aero-digestive cancer or pre-cancer in a mammal.
- the method comprises, or consists essentially of, measuring mutations in a matrix marker panel in a stool sample.
- the marker panel can comprise measuring DNA mutations in p16, p53, k-ras, APC, SMAD4, EGFR, CTNNB1, and BRAF nucleic acids. The presence of a mutation in each of the nucleic acids is indicative of the presence of aero-digestive cancer or pre-cancer in a mammal.
- this document features a method of detecting aero-digestive cancer in a mammal
- the method comprises, or consists essentially of, determining whether or not the methylation status of an ALX4 (aristaless-like homeobox 4 (GenBank accession no. AF294629; gi
- ALX4 accession no. AF294629; gi
- this document features a method of diagnosing pancreatic cancer in a mammal.
- the method comprises, or consists essentially of, obtaining a stool sample from the mammal, determining the ratio of an elastase 3A polypeptide to a pancreatic alpha-amylase polypeptide present within a stool sample, and communicating a diagnosis of pancreatic cancer if the ratio is greater than about 0.5, thereby diagnosing the mammal with pancreatic cancer.
- this document features a method of diagnosing a mammal with pancreatic cancer.
- the method comprises, or consists essentially of, obtaining a stool sample from the mammal, measuring mutations in a matrix marker panel of nucleic acids present in the sample, determining the ratio of a carboxypeptidase B polypeptide to a carboxypeptidase A2 polypeptide present within the sample, and communicating a diagnosis of pancreatic cancer or pre-cancer if a mutation is detected in each of the marker panel nucleic acids and the ratio is greater than 0.5, thereby diagnosing the mammal.
- the matrix marker panel comprises or consists essentially of p16, p53, k-ras, APC, SMAD4, EGFR, CTNNB1, and BRAF nucleic acids.
- this document features method of diagnosing a mammal with colorectal cancer.
- the method comprises, or consists essentially of, obtaining a stool sample from the mammal, detecting mutations in a matrix marker panel comprising of p16, p53, k-ras, APC, SMAD4, EGFR, CTNNB1, and BRAF nucleic acids in DNA present within the sample, measuring the level of a serotransferrin polypeptide present within the sample, and communicating a diagnosis of colorectal cancer or pre-cancer if a mutation is detected in each of the nucleic acids and the level of a serotransferrin polypeptide is elevated as compared to a reference level, thereby diagnosing the mammal.
- This document provides methods and materials related to detecting a neoplasm in a mammal ( e.g. , a human). For example, this document provides methods and materials for using nucleic acid markers, polypeptide markers, and combinations of markers present in a biological sample (e.g. , a stool sample) to detect a neoplasm in a mammal.
- a biological sample e.g. , a stool sample
- Such a neoplasm can be a cancer or precancer in the head and neck, lungs and airways, esophagus, stomach, pancreas, bile ducts, small bowel, or colorectum.
- the methods and materials provided herein can be used to detect neoplasm markers in a mammal having a combination of different neoplasms.
- the methods and materials provided herein can be used to detect nucleic acid and polypeptide markers in a human having lung and stomach neoplasms.
- the methods and materials provided herein can be used to quantify multiple markers in biological samples (e.g. , stool) to yield high sensitivity for detection of lesions (e.g. , neoplasms), while preserving high specificity.
- biological samples e.g. , stool
- lesions e.g. , neoplasms
- Such methods can include, for example, a logistic model that adjusts specificity cut-offs based on age, gender, or other variables in a target population to be tested or screened.
- the methods and materials provided herein can be used to determine whether a mammal (e.g. , a human) has colorectal cancer or pancreatic cancer.
- a mammal e.g. , a human
- serotransferin, methylated BMP3, and mutant BRAF markers in stool can be used to identify a mammal as likely having colorectal cancer
- mutant p16, carboxypeptidase B/A, and elastase 2A markers can be used to identify a mammal as likely having pancreatic cancer.
- any suitable method can be used to detect a nucleic acid marker in a mammalian stool sample.
- such methods can involve isolating DNA from a stool sample, separating out one or more particular DNAs from the total DNA, subjecting the DNAs to bisulfite treatment, and determining whether the separated DNAs are abnormally methylated ( e.g. , hypermethylated or hypomethylated).
- such methods can involve isolating DNA from a stool sample and determining the presence or absence of DNA having a particular size (e.g. , short DNA).
- a single stool sample can be analyzed for one nucleic acid marker or for multiple nucleic acid markers.
- a stool sample can be analyzed using assays that detect a panel of different nucleic acid markers.
- multiple stool samples can be collected from a single mammal and analyzed as described herein.
- Nucleic acid can be isolated from a stool sample using, for example, a kit such as the QIAamp DNA Stool Mini Kit (Qiagen Inc., Valencia, CA).
- nucleic acid can be isolated from a stool sample using the following procedure: (1) homogenizing samples in an excess volume (>1:7 w:v) of a stool stability buffer (0.5M Tris pH 9.0, 1.50mM EDTA, 10mum NaCl) by shaking or mechanical mixing; (2) centrifuging a 10 gram stool equivalent of each sample to remove all particulate matter; (3) adding 1 ⁇ L of 100 ⁇ g/ ⁇ L RNase A to the supernatant and incubating at 37°C for 1 hour; (4) precipitating total nucleic acid with 1/10 volume 3M NaAc and an equal volume isopropanol; and (5) centrifuging and then resuspending the DNA pellet in TE (0.01 M Tris pH 7.4, 0.001 M EDTA).
- a stool stability buffer 0.5M Tris
- One or more specific nucleic acid fragments can be purified from a nucleic acid preparation using, for example, a modified sequence-specific hybrid capture technique (see, e.g. , Ahlquist et al. (2000) Gastroenterology, 119:1219-1227 ).
- a modified sequence-specific hybrid capture technique see, e.g. , Ahlquist et al. (2000) Gastroenterology, 119:1219-1227 .
- Such a protocol can involve:
- Nucleic acid can be subjected to bisulfite treatment to convert unmethylated cytosine residues to uracil residues, while leaving any 5-methylcytosine residues unchanged.
- a bisulfite reaction can be performed using, for example, standard techniques: (1) denaturing approximately 1 ⁇ g of genomic DNA (the amount of DNA can be less when using microdissected DNA specimens) for 15 minutes at 45°C with 2 N NaOH; (2) incubating with 0.1 M hydroquinone and 3.6 M sodium bisulfite (pH 5.0) at 55°C for 4-12 hours; (3) purifying the DNA from the reaction mixture using standard ( e.g ., commercially-available) DNA miniprep columns or other standard techniques for DNA purification; (4) resuspending the purified DNA sample in 55 ⁇ L water and adding 5 ⁇ l 3 N NaOH for a desulfonation reaction that typically is performed at 40°C for 5-10 minutes; (5) precipitating the DNA sample with ethanol, washing the DNA, and resuspending
- PCR reactions can contain, for example, 10 ⁇ L of captured DNA that either has or has not been treated with sodium bisulfite, 1X PCR buffer, 02 mM dNTPs, 0.5 ⁇ M sequence specific primers (e.g.
- a typical PCR protocol can include, for example, an initial denaturation step at 94°C for 5 min, 40 amplification cycles consisting of 1 minute at 94°C, 1 minute at 60°C, and 1 minute at 72°C, and a final extension step at 72°C for 5 minutes.
- sequences of PCR products corresponding to samples treated with and without sodium bisulfite can be compared.
- the sequence from the untreated DNA will reveal the positions of all cytosine residues within the PCR product Cytosines that were methylated will be converted to thymidine residues in the sequence of the bisulfite-treated DNA, while residues that were not methylated will be unaffected by bisulfite treatment.
- Purified nucleic acid fragments from a stool sample or samples can be analyzed to determine the presence or absence of one or more somatic mutations. Mutations can be single base changes, short insertion/deletions, or combinations thereof. Methods of analysis can include conventional Sanger based sequencing, pyrosequencing, next generation sequencing, single molecule sequencing, and sequencing by synthesis. In some cases, mutational status can be determined by digital PCR followed by high resolution melting curve analysis. In other cases, allele specific primers or probes in conjunction with amplification methods can be used to detect specific mutations in stool DNA.
- the mutational signature can comprise not only the event of a base or sequence change in a specific gene, but also the location of the change within the gene, whether it is coding, non-coding, synonymous or non-synonymous, a transversion or transition, and the dinucleotide sequence upstream and downstream from the alteration.
- a sample can be assessed for the presence or absence of a polypeptide marker.
- any appropriate method can be used to assess a stool sample for a polypeptide marker indicative of a neoplasm.
- a stool sample can be used in assays designed to detect one or more polypeptide markers. Appropriate methods such as those described elsewhere ( Aebersold and Mann, Nature, 422:198-207 (2003 ) and McDonald and Yates, Dis. Markers, 18:99-105 (2002 )) can be adapted or designed to detect polypeptides in a stool.
- single-reaction monitoring using a TSQ mass spectrometer can specifically target polypeptides in a stool sample.
- High resolution instruments like the LTQ-FT or LTQ orbitrap can be used to detect polypeptides present in a stool sample.
- the term "increased level" as used herein with respect to the level of an elastase 3A polypeptide is any level that is above a median elastase 3A polypeptide level in a stool sample from a random population of mammals (e.g ., a random population of 10, 20, 30, 40, 50, 100, or 500 mammals) that do not have an aero-digestive cancer.
- Elevated polypeptide levels of an elastase 3A polypeptide can be any level provided that the level is greater than a corresponding reference level.
- an elevated level of an elastase 3A polypeptide can be 0.5, 1, 2, 3, 4, 5, 6, 7, 8, 9, 10, or more fold greater than the reference level of elastase 3A polypeptide in a normal sample.
- a reference level can be any amount.
- a reference level for an elastase 3A polypeptide can be zero.
- an increased level of an elastase 3A polypeptide can be any detectable level of an elastase 3A polypeptide in a stool sample.
- the term "increased level" as used herein with respect to the level of an carboxypeptidase B polypeptide level is any level that is above a median carboxypeptidase B polypeptide level in a stool sample from a random population of mammals (e.g ., a random population of 10, 20, 30, 40, 50, 100, or 500 mammals) that do not have an aero-digestive cancer. Elevated polypeptide levels of carboxypeptidase B polypeptide can be any level provided that the level is greater than a corresponding reference level.
- an elevated level of carboxypeptidase B polypeptide can be 0.5, 1, 2, 3, 4, 5, 6, 7, 8, 9, 10, or more fold greater than the reference level carboxypeptidase B polypeptide observed in a normal stool sample.
- a reference level can be any amount.
- a reference level for a carboxypeptidase B polypeptide can be zero.
- an increased level of a carboxypeptidase B polypeptide can be any detectable level of a carboxypeptidase B polypeptide in a stool sample.
- an increased level of DNA fragments less than about 200 or less than about 70 base pairs in length is any level that is above a median level of DNA fragments less than about 200 or less than about 70 base pairs in length in a stool sample from a random population of mammals (e.g ., a random population of 10, 20, 30, 40, 50, 100, or 500 mammals) that do not have an aero-digestive cancer.
- an increased level of DNA fragments less than about 200 or less than about 70 base pairs in length can be any detectable level of DNA fragments less than about 200 or less than about 70 base pairs in length in a stool sample.
- Elevated methylation as used herein with respect to the methylation status of a BMP3 or ALX nucleic acid is any methylation level that is above a median methylation level in a stool sample from a random population of mammals (e.g. , a random population of 10, 20, 30, 40, 50, 100, or 500 mammals) that do not have an aero-digestive cancer.
- Elevated levels of BMP3 or ALX methylation can be any level provided that the level is greater than a corresponding reference level.
- an elevated level of BMP3 or ALX methylation can be 0.5, 1, 2, 3, 4, 5, 6, 7, 8, 9, 10, or more fold greater than the reference level methylation observed in a normal stool sample. It is noted that a reference level can be any amount.
- elevated mutation score as used herein with respect to detected mutations in a matrix panel of particular nucleic acid markers is any mutation score that is above a median mutation score in a stool sample from a random population of mammals (e.g ., a random population of 10, 20, 30, 40, 50, 100, or 500 mammals) that do not have an aero-digestive cancer.
- An elevated mutation score in a matrix panel of particular nucleic acid markers can be any score provided that the score is greater than a corresponding reference score.
- an elevated score of K-ras or APC mutations can be 0.5, 1, 2, 3, 4, 5, 6, 7, 8, 9, 10, or more fold greater than the reference score of K-ras or APC mutations observed in a normal stool sample. It is noted that a reference score can be any amount.
- a ratio of particular polypeptide markers can be determined and used to identify a mammal having an aero-digestive cancer (e.g ., a colorectal cancer or a pancreatic cancer)
- a ratio provided herein e.g. , the ratio of carboxypeptidase B polypeptide levels to carboxypeptidase A2 polypeptide levels
- a ratio provided herein e.g. , the ratio of carboxypeptidase B polypeptide levels to carboxypeptidase A2 polypeptide levels
- a matrix marker panel can be used to identify mammals having an aero-digestive cancer (e.g ., a colorectal cancer or a pancreatic cancer). In some cases, such panel also can identify the location of the aero-digestive cancer.
- a panel can include nucleic acid markers, polypeptide markers, and combinations thereof and can provide information about a mutated marker gene, the mutated region of the marker gene, and/on type of mutation.
- data can be analyzed using a statistical model to predict tumor site (e.g ., anatomical location or tissue of origin) based on inputs from sequencing data (such as by specific nucleic acid or combination of nucleic acids mutated, specific mutational location on a nucleic acid, and nature of mutation ( e.g . insertion, deletion, transition, or transversion) or by any combination thereof) and/or data from polypeptide or other types of markers.
- sequencing data such as by specific nucleic acid or combination of nucleic acids mutated, specific mutational location on a nucleic acid, and nature of mutation (e.g . insertion, deletion, transition, or transversion) or by any combination thereof
- SITE Site of Tumor Estimate
- data can be analyzed using quantified markers to create a logistic model, which can have both high sensitivity and high specificity.
- a logistic model can also incorporate population variables like gender and age to adjust cut-off levels for test positivity and thereby optimize assay performance in a screening setting"
- Q-LEAD Quantitative Logistic to Enhance Accurate Detection
- This document also provides methods and materials to assist medical or research professionals in determining whether or not a mammal has an aero-digestive cancer.
- Medical professionals can be, for example, doctors, nurses, medical laboratory technologists, and pharmacist.
- Research professionals can be, for example, principle investigators, research technicians, postdoctoral trainees, and graduate students.
- a professional can be assisted by (1) determining the ratio of particular polypeptide markers in a stool sample, and (2) communicating information about the ratio to that professional, for example.
- a professional can be assisted by (1) determining the level of human DNA, the methylation status of genes such as BMP3, and the mutation score of genes such as APC and K-ras, and (2) communicating information about the level of DNA, the methylation status of particular genes, and the mutation score of particular genes to the professional.
- a professional can be assisted by (1) detecting mutations in cancer-related genes such as K-ras, p53, APC, p16, EGFR, CTNNB1, BRAF, and SMAD4, as a matrix marker panel, and (2) communicating information regarding the mutations to the professional,
- a medical professional can take one or more actions that can affect patient care. For example, a medical professional can record the results in a patient's medical record. In some cases, a medical professional can record a diagnosis of an aero-digestive cancer, or otherwise transform the patient's medical record, to reflect the patient's medical condition. In some cases, a medical professional can review and evaluate a patient's entire medical record, and assess multiple treatment strategies, for clinical intervention of a patient's condition. In some cases, a medical professional can record a tumor site prediction with the reported mutations. In some cases, a medical professional can request a determination of the ratio of particular polypeptide markers to predict tumor site. In some cases, a medical professional can review and evaluate a patient's entire medical record and assess multiple treatment strategies, for clinical intervention of a patient's condition.
- a medical professional can initiate or modify treatment of an aero-digestive cancer after receiving information regarding a ratio of particular polypeptide markers or the presence of nucleic acid markers in a patient's stool sample.
- a medical professional can compare previous reports and the recently communicated ratio of particular polypeptide markers, or presence of nucleic acid markers, and recommend a change in therapy.
- a medical professional can enroll a patient in a clinical trial for novel therapeutic intervention of an aero-digestive cancer
- a medical professional can elect waiting to begin therapy until the patient's symptoms require clinical intervention.
- a medical professional can communicate the ratio of particular polypeptide markers to a patient or a patient's family.
- a medical professional can provide a patient and/or a patient's family with information regarding aero-digestive cancers, including treatment options, prognosis, and referrals to specialists, e.g. , oncologists and/or radiologists.
- a medical professional can provide a copy of a patient's medical records to communicate the ratio of particular polypeptide markers to a specialist.
- a research professional can apply information regarding a subject's ratio of particular polypeptide markers to advance aero-digestive cancer research For example, a researcher can compile data on the ratio of particular polypeptide markers, and/or presence of particular nucleic acid markers, with information regarding the efficacy of a drug for treatment of aero-digestive cancer to identify an effective treatment.
- a research professional can obtain a subject's ratio of particular polypeptide markers, and/or determine the presence of particular nucleic acid markers to evaluate a subject's enrollment, or continued participation in a research study or clinical trial.
- a research professional can classify the severity of a subject's condition, based on the ratio of particular polypeptide markers and/or the levels of particular nucleic acid markers.
- a research professional can communicate a subject's ratio of particular polypeptide markers, and/or the presence of particular nucleic acid markers to a medical professional.
- a research professional can refer a subject to a medical professional for clinical assessment of an aero-digestive cancer, and treatment of an aero-digestive cancer.
- Any appropriate method can be used to communicate information to another person (e.g ., a professional).
- information can be given directly or indirectly to a professional.
- a laboratory technician can input the ratio of particular polypeptide markers and/or particular nucleic acid markers into a computer-based record
- information is communicated by making a physical alteration to medical or research records.
- a medical professional can make a permanent notation or flag a medical record for communicating a diagnosis to other medical professionals reviewing the record
- any type of communication can be used to communicate the information
- mail, e-mail, telephone, and face-to-face interactions can be used.
- the information also can be communicated to a professional by making that information electronically available to the professional.
- the information can be communicated to a professional by placing the information on a computer database such that the professional can access the information.
- the information can be communicated to a hospital, clinic, or research facility serving as an agent for the professional.
- a combination of more than one marker was undertaken to achieve the desired sensitivity and specificity for cancer detection
- Binary regression methods predicting disease as a function of diagnostic tests estimate the optimal combination of the tests for classifying a subject as diseased or not. McIntosh and Pepe, Biometrics 58: 657-664 (2002 ).
- a logistic regression model can assess the relationship between a binary dependent response variable such as presence or absence of disease and one or more independent predictor variables.
- the independent predictors may be qualitative (e.g. , binary) or quantitative ( e.g. , a continuous endpoint).
- the independent predictors can include such biological markers as K-ras, BMP3 and DNA concentration, and others.
- the model incorporates the demographic variables of gender and age, as we have observed that both age and gender influence molecular marker levels in stool. As average stool marker levels increase with age and male gender, failure to adjust for these variables would yield suboptimal specificity in men and elderly persons tested. Coefficients are estimated from the sample data for each term in the model. The result of the model is a risk score for each subject. Cutoffs for predicting disease state from this risk score can be determined in order to maximize sensitivity and specificity of the marker combinations for predicting disease as desired. The inclusion of demographic variables allows these cutoffs to be determined as a function of age and gender
- K-ras mutation score, methylation of BMP3 gene, and concentration of human DNA (245 bp length) were respectively quantified by a digital melt curve assay, real-time methylation-specific PCR, and real-time Alu PCR, respectively. Assays were performed blinded A logistic model, which incorporates three markers and gender, was constructed to analyze discrimination by combined markers.
- Detection rates of colorectal neoplasms were determined by individual quantitative markers at specificity cut-offs of 96 percent and by combined markers (Table 1) Discrimination by combined markers was calculated using a qualitative binomial method (each marker considered as positive or negative based on individual 96 percent specificity) and by the Q-LEAD model (sensitivity data shown at overall specificity of 96 percent) Table 1. Specificity and sensitivity of cancer markers.
- stool DNA testing can achieve high sensitivity while preserving high specificity for detection of colorectal neoplasia.
- the particular three-marker combination of mutant K-ras, BMP3 methylation, and human DNA concentration represents a complementary, high-yield panel.
- Age medians were 61 for patients with colorectal cancer, 67 for those with adenomas, and 59 for normal controls; and, male/female ratios were 52/22, 15/12, and 37/63, respectively.
- Table 2 Data in this table represent a training set and have not been adjusted for age and gender. Yet, it is clear that the full panel of Alu, K-ras, APC, and BMP3 detected more neoplasms than any individual marker, p ⁇ 0 05.
- the full panel detects more adenomas >3 cm (90%, 9/10) than ⁇ 3 cm (47%, 8/17), p ⁇ 0 05, and more colorectal cancers at stages III-IV (89%, 40/45) than at stages I-II (69%, 20/29) p ⁇ 0.05.
- Neoplasm detection rates were not affected by tumor location.
- a quantitative stool DNA assay system that incorporates a stabilization buffer with specimen collection, high analytical sensitivity, and a panel of broadly informative markers can achieve high detection rates of both colorectal cancers and advanced adenoma.
- a statistical model can be used to predict tumor site (e.g., anatomical location or tissue of origin) based on inputs from sequencing data (such as by specific nucleic acid or combination of nucleic acids mutated, specific mutational location on a nucleic acid, and nature of mutation (e g insertion, deletion, transition, or transversion) or by any combination thereof) and/or data from polypeptide or other types of markers.
- sequencing data such as by specific nucleic acid or combination of nucleic acids mutated, specific mutational location on a nucleic acid, and nature of mutation (e g insertion, deletion, transition, or transversion) or by any combination thereof) and/or data from polypeptide or other types of markers.
- a matrix marker panel was developed to include eight cancer-related genes: K-ras, p53, APC, p16, EGFR, CTNNB1, BRAF, and SMAD4.
- the mutation frequencies of these genes were tabulated against the six major aero-digestive cancers based on literature or public database reviews and on actual sequencing observations (Table 3) Literature frequencies were derived from the COSMIC somatic mutation database, review articles, and texts. Table 3.
- frequencies include other genetic alterations than simply single base changes and small insertions/deletions such as methylation events, large homozygous deletions, and copy number changes. Such alterations would not be reflected in the actual frequency table.
- Actual frequencies were derived by sequencing coding and flanking gene regions from 245 patient tissue samples reflecting the spectrum of aero-digestive cancers. Only non-synonymous and splice site alterations were tabulated. When specific mutational hot-spot sites were able to be identified for particular genes, only those sites were analyzed
- the matrix panel includes markers that are present to variable extent across these tumors so that their aggregate use achieves high overall sensitivity and allows prediction of tumor site using the SITE Model 70% of tumors harbored one or more mutations from the eight gene panel. Some gene mutations, like those associated with p16, are common in tumors above the colon but rare for those in the colon. Mutant K-ras is frequent with colorectal and pancreatic cancers but infrequent in the other cancers.
- Mutations in EGFR clustered with lung and colorectal tumors and mutations in SMAD4 clustered with stomach and colorectal tumors are commonly mutated across many different types of cancers, but specific mutational locations or types of mutations within p53 and other genes differ between tumor site ( e.g ., Greenman et al., Nature, 446(7132):153-8 (2007 ); Soussi and Lozano, Biochem, Biophys. Res.
- Table 4 Specific Base Change Fractions in AD Tumors C>T T>C G>C A>T G>T T>G TUMOR (G>A) (A>G) (C>G) (T>A) (C>A) (A>C) Head and Neck 0.38 0.12 0.38 0.12 Esophageal 0.8 0.07 0.13 Lung 0.3 0.11 0.02 0.13 0.34 0.09 Stomach 0.5 0.25 0.17 0.08 Pancreas 0.41 0.15 0.04 0.07 0.33 Bile Duct 0.5 0.12 0.25 0.12 CRA 0.34 0.05 0.11 0.11 0.34 0.03 CRC 0.4 0.05 0.02 0.24 0.26 0.03
- Polypeptide markers found in stool can also be used to detect aero-digestive neoplasms and predict tumor site.
- Polypeptides were separated by 1-D electrophoresis, excised from gels, and digested for mass spectrometric analysis using an LTQ-Orbitrap. Data outputs were searched using Mascot, Sequest, and X! Tandem programs against an updated Swissprot database that included all cataloged species.
- pancreatic cancer cases were 67, for colorectal cancer controls 63, and for healthy controls 62; and male/female distributions were 9/7, 6/4, and 9/15, respectively.
- pancreatic enzymes B and A2 were conspicuous, as unique spectral counts of the former were commonly elevated with pancreatic cancer and of the latter commonly decreased Considered together as the ratio of carboxypeptidase B/carboxypeptidase A2, pancreatic cancer cases were almost completely separated from colorectal cancer and healthy control groups.
- Median ratios were 0.9, 0.2, and 0.3, respectively.
- polypeptide markers unique to colorectal neoplasms were identified (Table 5). For example, serotransferrin was found in stools from patients with colorectal cancer but not in those with pancreatic cancer. These markers when considered as part of a matrix panel contribute both to overall sensitivity for tumor detection and help discriminate colorectal from pancreatic cancer Table 5. Positive Stool Findings. Carboxypeptidase B/A2* Serotransferrin Colorectal Cancer 0 60% Pancreatic Cancer 86% 0 Normal controls 0 0 *ratio > 0.75 considered positive
- Samples were collected in phosphate buffered saline and either dropped off in clinic or mailed in collection tub. Samples were homogenized and frozen within 72 hours after receipt. Frozen stools were diluted 1:3 w:v in PBS (Roche, Cat# 1666789). Diluted stools were stomached in a filter bag (Brinkman, BA6041/STR 177 x 305 mm) for 60 seconds on control setting and spun at 10,000 rpms for 30 minutes. Following an additional 10 minute spin at 14,000 rpm, the supernatant was filtered through a 0.45- ⁇ m syringe filter and analyzed. Total protein present in stool was quantitated using a Bradford Protein Assay kit (Pierce).
- Stool supernatants were diluted 1:1 in Leammli-BME buffer and run on a 10.5-14 % gradient gel. Vertical slices were cut from 250 kDa to 15 kDa and in-gel digested using methods described elsewhere ( e.g ., Wilm et al., Nature, 379:466-469 (1996 )). Bands were destained, dehydrated, digested in trypsin, extracted, and lyophilized for MS analysis.
- Lyophilized samples were reconstituted and injected with a flow of 500 nL/min and a 75 minute gradient from 5-90% 98% acetonitrile.
- MS was performed in data dependent mode to switch automatically between MS and MS 2 acquisition on the three most abundant ions.
- An isolation width of 2.5 m/z was applied.
- Exclusion mass width was 0.6 m/z on low end and 1.5 m/x on high end. All acquisition and method development was performed using Xcaliber version 2.0.
- Ratios of elastase 3A were determined using spectral counts for each polypeptide. Ratios were determined by dividing the number of unique peptides of elastase 3A (determined using a composite ID from database search modules Mascot, XTandem, and Seaquest and compiled in Scaffold) by the number of unique peptides from another polypeptide such as pancreatic alpha-amylase.
- the concentration of a specific pancreatic enzyme, elastase 3A was consistently found to be elevated in the fecal supernatant of patients with pancreatic cancer as compared to normal controls or patients with non-pancreatic cancer ( Figure 3 ). These finding indicate that fecal concentration of elastase 3A is an accurate marker for pancreatic cancer.
- the ratio of elastase 3A against other pancreatic enzymes (or other stable fecal polypeptides) was found to be especially discriminant for pancreatic cancer and obviates the need to determine absolute elastase 3A concentrations ( Figure 4 ). While mass spectrometry was used to make these observations, elastase 3A levels and ratios including elastase 3A can be measured using other methods as well.
- a melt curve assay is a post-PCR technique that can be used to scan for mutations in PCR amplicons. Mutations in PCR products can be detected by changes in the shape of the melting curve (heterozygote from mutant sample) compared to a reference sample (homozygote from wild-type sample) ( Figure 5 ). Melt curve assay can scan all mutations in a DNA fragment ⁇ 400 bp in less than 10 minutes, rather than individually targeting single mutations. Regular melt curve assays can detect mutations down to a limit of 5% mutant:wild-type and, thus, are not sensitive enough to detect mutations in many biological samples. For instance, in stool, an analytical sensitivity of 1% or less is required in order to detect precancerous polyps or small early stage cancers. Importantly, a quantitative score can be given to density of target mutations ( Figure 6 ).
- Digital PCR can augment the sensitivity of PCR to detect low abundance mutations.
- Gene copies can be diluted and distributed into 96 wells of a plate to increase the percentage of mutant copy to wild-type copies in certain wells. For example, if a stool DNA sample contains only 1% of mutant BRAF copies compared to wild-type copies, distributing 300 copies of BRAF gene into a 96-well plate can lead to three wells with an average mutant ratio of 33 percent (1:3). After PCR amplification, these three wells with mutant copies can be detected by sequencing or other approaches. Since digital PCR requires PCR on a whole 96- well plate and 96 sequencings (or other approaches) for each target, it can be slow and costly.
- gene target fragments e.g ., BRAF, K-ras, APC, p16, etc.
- APC a sequence-specific capture method
- PCR amplification was performed using specific primers on the plate (e.g., one target per plate).
- emulsion PCR can be used in place of digital PCR. In such cases, each lipid drop can become a tiny PCR reactor of one single molecule of gene.
- Table 6 Sequence Specific Capture Probes and DNA Primers Gene Target Region Capture probe/ primer Oligo Sequence (5' ⁇ 3') SEQ ID No.
- a digital melt curve assay was designed by combining digital PCR to a modified melt curve assay
- Target genes in low concentration were PCR amplified with a saturated DNA dye, LcCrreen+, in a 96-well plate
- LcCrreen+ a saturated DNA dye
- Each well contained a small number of gene copies, which allowed high mutation/wild-type ratios in some wells that were then detected by melt curve scanning using a LightScanner. Mutations were scored based on the number of wells containing mutant copies in a 96-well plate.
- mutant genes were spiked into a wild-type pool at 0 1, 0 5, 1, 5, and 10% dilutions, and analyzed using digital melt curve assay with 250-1000 gene copies per 96-well plate This method was then applied in the stool detection of APC, p53, K-ras, and BRAF mutations from 48 patients known to have mutations in one of these genes in matched tumor tissue. Subjects included 9 patients with pancreatic cancer, 31 with colorectal cancer, and 8 with colorectal adenoma >1 cm. All mutations detected by digital melt curve were further confirmed by Sanger sequencing.
- the digital melt curve assay detected as few as 0.1% mutant copies for amplicons ⁇ 350 bp using one 96-well plate ( Figure 7 ), compared to the detection limit for regular melt curve of ⁇ 5 percent
- Each mutation scanning took 8-10 minutes with this manual approach.
- Mutations of APC, p53, K-ras, and BRAF genes were all successfully scanned with digital melt curve in quantitative fashion.
- Tissue-confirmed mutations were detected from matched stools in 88 percent (42/48) of patients with gastrointestinal neoplasms, including 89 percent with pancreatic cancer, 90 percent with colorectal cancer, and 75 percent with colorectal adenoma > 1 cm.
- Archived stools were used to evaluate a digital melt curve assay of DNA markers for detection of advanced adenomas and to compare the accuracy of the digital melt curve assay with that of occult blood testing and a commercial DNA marker assay method (EXACT Sciences). Average risk subjects collected stools without a preservative buffer and mailed them to central processing laboratories for banking and blinded stool testing by Hemoccult, HemoccultSENSA, and DNA marker assay. All subjects underwent a colonoscopy, and tissue from advanced adenomas was archived. Archival stools were selected from the 27 patients with a colorectal adenoma >1 cm found to harbor mutant K-ras on tissue analyses and from the first 25 age and gender matched subjects with normal colonoscopy.
- K-ras gene was enriched by sequence capture. Mutations in the K-ras gene were quantified by a digital melt curve assay based on the number of wells containing mutant gene copies in a 96-well plate and confirmed by sequencing.
- Median age with adenomas was 67 and controls 71; and males/females were 12/15 and 13/14, respectively.
- Median adenoma size was 1.5 cm (range 1-3 cm).
- Free human DNA is present in all human stools and arises from cells shed (exfoliated) from the normal surface (mucosa) of the aero-digestive tract (mouth/throat, lungs, and all digestive organs) and from tumors or other lesions that may be present. It has been generally accepted that "long DNA" in stool reflects that presence of colorectal and other aero-digestive tumors, in that cells exfoliated from cancers do not undergo typical cell death (apoptosis) which would shorten DNA. Specifically, because DNA from apoptotic cells would be broken down to fragment lengths shorter than 100 bp, long DNA was defined as being longer than 100 bp.
- Short DNA (i e , ⁇ 100 bp in length), however, was found to be as or more discriminant than long DNA as a tumor marker in stool for detection of both colorectal ( Figure 9 ) and pancreatic ( Figure 10 ) neoplasia.
- the conserved regions are the 25-bp span between nucleotide positions 23 and 47 and the 16-bp span between nucleotide positions 245 and 260
- primers can be designed in any part of the Alu sequences, for more effectively amplifying Alu sequences, the PCR primers are preferably completely or partially (at least the 3'-regions of the primers) located in the conserved regions. Primers specific for the human Alu sequences were used to amplify fragments of differing lengths inside Alu repeats.
- sequences were as follows: Amplicon size Primer Sequences 245 bp Forward Primer: 5'-ACGCCTGTAATCCCAGCACTT-3' (SEQ ID No:44) Reverse Primer: 5'-TCGCCCAGGCTGGAGTGCA-3' (SEQ ID No.45) 130 bp Forward Primer.
- Tris-EDTA buffer-diluted stool DNA (1 ⁇ L) was amplified in a total volume of 25 ⁇ L containing 1x iQ SYBR Green Supermix (Bio-Rad, Hercules, CA), 200 nmol/L each primer under the following conditions. 95°C for 3 minutes followed by 40 cycles of 95°C, 60°C, and 72°C for 30 seconds each A standard curve was created for each plate by amplifying 10-fold serially diluted human genomic DNA samples (Novagen, Madison, WI). Melting curve analysis was made after each PCR to guarantee that only one product was amplified for all samples.
- Amplification was carried out in 96-well plates in an iCycler (Bio-Rad). Each plate consisted of stool DNA samples and multiple positive and negative controls. Each assay was done in duplicate.
- Age medians were 60, 66, 69, and 62 for colorectal cancer, colorectal adenoma, pancreatic cancer, and control groups, respectively; and male/female distributions were 22/11, 9/11, 9/4, 11/21, respectively.
- amplification products were quantitatively greater for short DNA versus long DNA.
- mutant gene markers in stool can be detected to a greater extent if amplicon size is less than 70 bp, consistent with luminal degradation.
- short DNA can serve as a marker per se and as the target size for mutation detection.
- GI neoplasms Genes commonly mutated in GI neoplasms (TP53, KRAS, APC, CDH1, CTNNB1, BRAF, SMAD4, and P16) were sequenced from DNA extracted from tumor tissue, to identify a target mutation for each case.
- Target genes were isolated by hybrid capture (Table 7) and the tissue-confirmed somatic mutations were assayed in stool by the digital melt curve method, as described in Example 1. Mutations detected in stool were confirmed by sequencing. Assays were performed blinded.
- Table 7 Sequence Specific Capture Probes and Primers for AD Cancer Mutation Detection MUTATION IN TISSUE CAPTURE PROBE SEQ ID No. SENSE PRIMER 1 (5' TO 3') SEQ ID No.
- ANTISENSE PRIMER 2 (5' TO 3') SEQ ID No. 12487C>CT:167Q>Q/X ATGGCCATCTACAAGCAGTCATAGCACATGACGGAGGTTGT 49 AGTACTCCCCTGCCCTCAAC 128 CTCACAACCTCCGTCATGTG 169 102447_102450het_delTGGT AGAGTGAACCATGCAGTGGAAAAGTGGCATTATAAGCCC 50 TTTGAGAGTCGTTCGATTGC 129 CATGGTTTGTCCAGGGCTAT 27 12410G>GA,141C>C/Y TTTGCCAACTGGCCAAGACCTACCCTGTGCAGCTGTG 51 AGTACTCCCCTGCCCTCAAC 128 CTCCGTCATGTGCTGTGACT 170 102678het_delA CAGATGCTGATACTTTATTACTTTTGCCACGGAAAGTACT 52 TCCAGGTTCTTCCAGATGCT 130 CACTCAGGCTGGATGAACAA 22 102594_102598het_delA
- Target mutations were not detected in control stools.
- Target mutations were detected in stools from 68% (47/69) of patients with a GI neoplasm Specifically, target mutations were detected in stools from 71% (36/51) of patients with cancer [40% (2/5) with oropharyngeal, 65% (11/17) with esophageal, 100% (4/4) with gastric, 55% (6/11) with pancreatic, 75% (3/4) with biliary or gallbladder, and 100% (10/10) with colorectal] and from 61%(11/18) with precancers [100% (2/2) with pancreatic intraductular papillary mucinous neoplasia and 56% (9/16) with colorectal advanced adenoma].
- K-ras mutations were detected in stools for 3/10 or 4/10 bile duct cancers (depending on mutation score of 5 or 3, respectively) (Table 9). As K-ras is mutant in 30-40% of bile duct cancers, these results indicate that the detection assay is picking up the appropriate proportion of cancer samples. Table 9. K-ras mutation scores for patients with bile duct cancer.
- the allele specific-PCR assay was a modified version of a previously published method (e.g ., Cha et all, Mismatch Amplification Mutation Assay (MAMA): Application to the c-H-ras Gene PCR Methods and Applications, 2:14-20 (1992) Cold Spring Harbor Laboratory ).
- MAMA Mismatch Amplification Mutation Assay
- TP53 gene fragments were captured from stool DNA samples with probes specific to mutations identified in the matched tissue (Table 7). Copy numbers were assessed by qPCR Samples were adjusted to 10,000 fragments each and amplified with allele specific primer sets.
- the forward primer in each case is specific for each TP53 mutation.
- the threshold cycle (Ct) designates the PCR cycle at which the product enters the exponential phase of amplification.
- Example 9 Candidate Stool Polypeptide Markers Identified for Colorectal Cancer and Precancerous Adenomas
- polypeptides were identified by a statistical analysis model using all data generated from mass spectral of fecal protein extracts: ⁇ 2-macroglobulin, compliment C3 protein, serotransferrin, haptoglobin, carbonic anhydrase 1, xaa-pro dipeptidase, leukocyte elastase inhibitor, hemoglobin, glucose-6-phosphate, and catalase
- This list of polypeptides is in order of difference from normal.
- the mean spectral abundance for ⁇ 2-macroglobulin is most different from normal for cancer and adenoma.
- the listed polypeptides can be used individually or in any combination to detect colorectal cancer or precancerous adenomas.
- CBPB1_HUMAN carboxypeptidase B
- CBPA1_HUMAN Carboxypeptidase A1
Abstract
Description
- This document relates to methods and materials involved in detecting premalignant and malignant neoplasms (e.g., colorectal and pancreatic cancer).
- About half of all cancer deaths in the United States result from aero-digestive cancer. For example, of the estimated annual cancer deaths, about 2.5 percent result from lung cancer; about 10 percent result from colorectal cancer; about 6 percent result from pancreas cancer; about 3 percent result from stomach cancer; and about 3 percent result from esophagus cancer. In addition, over 7 percent of the annual cancer deaths result from other aero-digestive cancers such as naso-ono-pharyngeal, bile duct, gall bladder, and small bowel cancers.
- This document relates to methods and materials for detecting premalignant and malignant neoplasms (e.g., colorectal and pancreatic cancer). For example, this document provides methods and materials that can be used to determine whether a sample (e.g., a stool sample) from a mammal contains a marker for a premalignant and malignant neoplasm such as a marker from a colonic or supracolonic aero-digestive neoplasm located in the mammal. The detection of such a marker in a sample from a mammal can allow a clinician to diagnose cancer at an early stage. In addition, the analysis of a sample such as a stool sample can be much less invasive than other types of diagnostic techniques such as endoscopy.
- This document is based, in part, on the discovery of particular nucleic acid markers, polypeptide markers, and combinations of markers present in a biological sample (e.g., a stool sample) that can be used to detect a neoplasm located, for example, in a mammal's small intestine, gall bladder, bile duct, pancreas, liver, stomach, esophagus, lung, or naso-oropharyngeal airways. For example, as described herein, stool can be analyzed to identify mammals having cancer. Once a particular mammal is determined to have stool containing a neoplasm-specific marker or collection of markers, additional cancer screening techniques can be used to identify the location and nature of the neoplasm. For example, a stool sample can be analyzed to determine that the patient has a neoplasm, while magnetic resonance imaging (MRI), endoscopic analysis, and tissue biopsy techniques can be used to identify the location and nature of the neoplasm. In some cases, a combination of markers can be used to identify the location and nature of the neoplasm without additional cancer screening techniques such as MRI, endoscopic analysis, and tissue biopsy techniques.
- In general, one aspect of this document features a method of detecting pancreatic cancer in a mammal. The method comprises, or consists essentially of determining the ratio of an
elastase 3A polypeptide to a pancreatic alpha-amylase polypeptide present within a stool sample. The presence of a ratio greater than about 0.5 indicates that the mammal has pancreatic cancer. The presence of a ratio less than about 0.5 indicates that the mammal does not have pancreatic cancer. - In another aspect, this document features a method of detecting pancreatic cancer in a mammal. The method comprises or consists essentially of determining the level of an
elastase 3A polypeptide in a stool sample from the mammal. The presence of an increased level of anelastase 3A polypeptide, when compared to a normal control level, is indicative of pancreatic cancer in the mammal. - In another aspect, this document features a method of detecting pancreatic cancer in a mammal. The method comprises, or consists essentially of, determining the level of a carboxypeptidase B polypeptide in a stool sample from the mammal. An increase in the level of a carboxypeptidase B polypeptide, when compared to a normal control level, is indicative of pancreatic cancer in the mammal.
- In another aspect, this document features a method of detecting pancreatic cancer in a mammal. The method comprises, or consists essentially of, determining whether or not a stool sample from the mammal comprises a ratio of a carboxypeptidase B polypeptide to a carboxypeptidase A2 polypeptide that is greater than about 05. The presence of the ratio greater than about 0.5 indicates that the mammal has pancreatic cancer.
- In another aspect, this document features a method of detecting cancer or pre-cancer in a mammal. The method comprises, or consists essentially of, determining whether or not a stool sample from the mammal has an increase in the number of DNA fragments less than 200 base pairs in length, as compared to a normal control. The presence of the increase in the number of DNA fragments less than 200 base pairs in length indicates that the mammal has cancer or pre-cancer. The DNA fragments can be less than 70 base pairs in length.
- In another aspect, this document features a method of detecting colorectal cancer or pre-cancer in a mammal. The method comprises, or consists essentially of, determining whether or not a stool sample from the mammal has an elevated K-ras (Kirsten rat sarcoma-2 viral (v-Ki-ras2) oncogene homolog (GenBank accession no. NM_033360; gi|34485724|)) mutation score, an elevated BMP3 (bone morphogenetic protein 3 (GenBank accession no. M22491; gi|179505)) methylation status, and an elevated level of human DNA as compared to a normal control. The presence of the elevated K-ras mutation score, elevated BMP3 methylation status, and elevated level of human DNA level indicates that the mammal has colorectal cancer or pre-cancer. The K-ras mutation score can be measured by digital melt curve analysis The K-ras mutation score can be measured by quantitative allele specific PCR.
- In another aspect, this document features a method of detecting aero-digestive cancer or pre-cancer in a mammal. The method comprises, or consists essentially of, determining whether or not a stool sample from the mammal has an elevated K-ras mutation score, an elevated BMP.3 methylation status, and an elevated level of human DNA as compared to a normal control. The presence of the elevated K-ras mutation score, elevated BMP3 methylation status, and elevated level of human DNA level indicates that the mammal has aero-digestive cancer or pre-cancer. The K-ras mutation score can be measured by digital melt curve analysis. The K-ras mutation score can be measured by quantitative allele-specific PCR. The method can further comprise determining whether or not a stool sample from the mammal has an elevated APC mutation score. The APC mutation score can be measured by digital melt curve analysis.
- In another aspect, this document features a method of detecting aero-digestive cancer or pre-cancer in a mammal. The method comprises, or consists essentially of, determining whether or not the mammal has at least one mutation in six nucleic acids selected from the group consisting of p16, p53, k-ras, APC (adenomatosis polyposis coli tumor suppressor (GenBank accession no NM_000038; gi|189011564)), SMAD4 (SMAD family member 4 (GenBank accession no. NM_005.359; gi|195963400)), EGFR (epidermal growth factor receptor (GenBank accession no. NM_005228; gi|41327737|)), CTNNB1 (catenin (cadherin-associated protein), beta 1 (88kD) (GenBank accession no. X87838; gi|1154853|)), and BRAF (B-Raf proto-oncogene serine/threonine-protein kinase (p94) (GenBaxLk accession no. NM_004333; gi|87608632|)) nucleic acids. The presence of at least one mutation in each of the six nucleic acids indicates that the mammal has aero-digestive cancer or pre-cancer. The method can further comprise determining whether or not a stool sample from the mammal has an elevated level of a carboxypeptidase B polypeptide as compared to a normal control. The presence of the elevated level of a caboxypeptidase B polypeptide indicates that the mammal has aero-digestive cancer or pre-cancer in the mammal. The method can further comprise determining whether or not a stool sample from the mammal has an elevated amount of DNA fragments less than 70 base pairs in length as compared to a normal control. The presence of the elevated amount of DNA fragments less than 70 base pairs in length indicates that the mammal has aero-digestive cancer or pre-cancer. The method can further comprise determining whether or not a stool sample from the mammal has an elevated amount of DNA fragments greater than 100 base pairs in length as compared to normal controls. The presence of the elevated amount of DNA fragments greater than 100 base pairs in length indicates that the mammal has aero-digestive cancer or pre-cancer. The method can further comprise determining whether or not a stool sample from the mammal has an elevated BMP3 methylation status. The elevated BMP3 methylation status level indicates that the mammal has aero-digestive cancer or pre-cancer. The determining step can comprise using digital melt curve analysis.
- In another aspect, this document features a method of detecting aero-digestive cancer or pre-cancer in a mammal. The method comprises, or consists essentially of, measuring mutations in a matrix marker panel in a stool sample. The marker panel can comprise measuring DNA mutations in p16, p53, k-ras, APC, SMAD4, EGFR, CTNNB1, and BRAF nucleic acids. The presence of a mutation in each of the nucleic acids is indicative of the presence of aero-digestive cancer or pre-cancer in a mammal.
- In another aspect, this document features a method of detecting aero-digestive cancer in a mammal The method comprises, or consists essentially of, determining whether or not the methylation status of an ALX4 (aristaless-like homeobox 4 (GenBank accession no. AF294629; gi|10863748|)) nucleic acid in a stool sample from the mammal is elevated, as compared to a normal control. The presence of an elevated ALX4 methylation status indicates the presence of aero-digestive cancer in the mammal.
- In another aspect, this document features a method of diagnosing pancreatic cancer in a mammal. The method comprises, or consists essentially of, obtaining a stool sample from the mammal, determining the ratio of an
elastase 3A polypeptide to a pancreatic alpha-amylase polypeptide present within a stool sample, and communicating a diagnosis of pancreatic cancer if the ratio is greater than about 0.5, thereby diagnosing the mammal with pancreatic cancer. - In another aspect, this document features a method of diagnosing a mammal with pancreatic cancer. The method comprises, or consists essentially of, obtaining a stool sample from the mammal, measuring mutations in a matrix marker panel of nucleic acids present in the sample, determining the ratio of a carboxypeptidase B polypeptide to a carboxypeptidase A2 polypeptide present within the sample, and communicating a diagnosis of pancreatic cancer or pre-cancer if a mutation is detected in each of the marker panel nucleic acids and the ratio is greater than 0.5, thereby diagnosing the mammal. The matrix marker panel comprises or consists essentially of p16, p53, k-ras, APC, SMAD4, EGFR, CTNNB1, and BRAF nucleic acids.
- In another aspect, this document features method of diagnosing a mammal with colorectal cancer. The method comprises, or consists essentially of, obtaining a stool sample from the mammal, detecting mutations in a matrix marker panel comprising of p16, p53, k-ras, APC, SMAD4, EGFR, CTNNB1, and BRAF nucleic acids in DNA present within the sample, measuring the level of a serotransferrin polypeptide present within the sample, and communicating a diagnosis of colorectal cancer or pre-cancer if a mutation is detected in each of the nucleic acids and the level of a serotransferrin polypeptide is elevated as compared to a reference level, thereby diagnosing the mammal.
- Unless otherwise defined, all technical and scientific terms used herein have the same meaning as commonly understood by one of ordinary skill in the art to which this invention pertains. Although methods and materials similar or equivalent to those described herein can be used in the practice or testing of the present invention, suitable methods and materials are described below. All publications, patent applications, patents, and other references mentioned herein are incorporated by reference in their entirety. In case of conflict, the present specification, including definitions, will control. In addition, the materials, methods, and examples are illustrative only and not intended to be limiting.
- The details of one or more embodiments of the invention are set forth in the accompanying drawings and the description below. Other features, objects, and advantages of the invention will be apparent from the description and from the claims.
-
-
Figure 1 : Adjusted Cut-off Levels with Quantitative Stool Markers to Achieve 95% Specificity across Age and Gender using the Q-LEAD Model. Solid line for women, dotted line for men. -
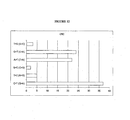
Figure 2 : Sensitive and specific detection of pancreatic cancer by fecal ratio of carboxypeptidase B:carboxypeptidase A2. Note that ratio in stools from patients with colorectal cancer is no different from ratios with healthy controls. -
Figure 3 : Elastase levels quantified in stools from patients with pancreatic cancer, patients with colorectal cancer, and healthy controls. -
Figure 4 : Ratio of elastase3A:pancreatic alpha amylase differentiates patients with pancreatic cancer from patients with colorectal cancer and from healthy controls. -
Figure 5 : Digital Melt Curve to detect mutations by targeted gene scanning (temperature (x-axis) v. temperature-normalized fluorescence (y-axis)). Eight pairs of primers, which amplify 100-350 bp gene fragments, were used to scan K-ras and APC genes and detect mutations (substitution and deletion mutations, respectively) at 1% mutant/wild-type ratio. -
Figure 6 : Quantitative detection of low abundance mutations by Digital Melt Curve Assay. Varying Mutant:Wild-type ratios of K-nas and APC gene mixtures were prepared and assayed blindly by Digital Melt Curve. -
Figure 7 : High analytical sensitivity by Digital Melt Curve (temperature (x-axis) v. temperature-normalized fluorescence (y-axis)). To test the detection limit of digital melt curve (DMC) assay, mutant copies were spiked in wild-type copies at 0.1, 0.5, 1, 5, and 10% dilutions. DMC could detect up to 0.1% mutant/wild-type level when 1000 copies were dispersed to one 96-well plate. The numbers of positive wells increased proportionally when spiked mutant copies were increased. A pair of primers that amplify 248 bp K-ras gene fragment were used as an example here. Primers that amplify 119 bp K-ras gene, 162 bp APC gene, and 346 bp APC genes were also used to test the detection limit and quantitative property of DMC. -
Figure 8 : Superior screen detection of colorectal precancerous polyps by Digital Melt Curve (DMC). Histogram compares sensitivity by DMC with that by common fecal occult blood tests (Hemoccult and HemoccultSENSA) and by the commercial stool DNA test (PreGenPlus, Exact Sciences). Detection by DMC was significantly better than by any other test (p<0.05). -
Figure 9 : Distributions of short fragment human DNA (short DNA) and long fragment human DNA (long DNA) in stools from patients with normal colonoscopy, large precancerous adenomas, and colorectal cancer. Human DNA quantified by an assay of Alu repeats Short DNA represents 45 bp fragment amplification products, and long DNA represents 245 bp amplification products. -
Figure 10 : Stool distributions of short and long DNA in patients with pancreatic cancer and in healthy controls. Short DNA represents 45 bp fragment amplification products, and long DNA represents 245 bp amplification products. -
Figure 11 : Methylated BMP3 gene in stool for detection of colorectal neoplasia. Methylated BMP3 was blindly quantified in stools from patients with colorectal cancers, precancerous adenomas, and normal individuals with real-time methylation-specific PCR. Each circle represents a stool sample -
Figure 12 : Frequency of Specific Base Changes in Colorectal Tumors. - This document provides methods and materials related to detecting a neoplasm in a mammal (e.g., a human). For example, this document provides methods and materials for using nucleic acid markers, polypeptide markers, and combinations of markers present in a biological sample (e.g., a stool sample) to detect a neoplasm in a mammal. Such a neoplasm can be a cancer or precancer in the head and neck, lungs and airways, esophagus, stomach, pancreas, bile ducts, small bowel, or colorectum. It will be appreciated that the methods and materials provided herein can be used to detect neoplasm markers in a mammal having a combination of different neoplasms. For example, the methods and materials provided herein can be used to detect nucleic acid and polypeptide markers in a human having lung and stomach neoplasms.
- In some cases, the methods and materials provided herein can be used to quantify multiple markers in biological samples (e.g., stool) to yield high sensitivity for detection of lesions (e.g., neoplasms), while preserving high specificity. Such methods can include, for example, a logistic model that adjusts specificity cut-offs based on age, gender, or other variables in a target population to be tested or screened.
- In some cases, the methods and materials provided herein can be used to determine whether a mammal (e.g., a human) has colorectal cancer or pancreatic cancer. For example, serotransferin, methylated BMP3, and mutant BRAF markers in stool can be used to identify a mammal as likely having colorectal cancer, while mutant p16, carboxypeptidase B/A, and elastase 2A markers can be used to identify a mammal as likely having pancreatic cancer.
- Any suitable method can be used to detect a nucleic acid marker in a mammalian stool sample. For example, such methods can involve isolating DNA from a stool sample, separating out one or more particular DNAs from the total DNA, subjecting the DNAs to bisulfite treatment, and determining whether the separated DNAs are abnormally methylated (e.g., hypermethylated or hypomethylated). In some cases, such methods can involve isolating DNA from a stool sample and determining the presence or absence of DNA having a particular size (e.g., short DNA). It is noted that a single stool sample can be analyzed for one nucleic acid marker or for multiple nucleic acid markers. For example, a stool sample can be analyzed using assays that detect a panel of different nucleic acid markers. In addition, multiple stool samples can be collected from a single mammal and analyzed as described herein.
- Nucleic acid can be isolated from a stool sample using, for example, a kit such as the QIAamp DNA Stool Mini Kit (Qiagen Inc., Valencia, CA). In addition, nucleic acid can be isolated from a stool sample using the following procedure: (1) homogenizing samples in an excess volume (>1:7 w:v) of a stool stability buffer (0.5M Tris pH 9.0, 1.50mM EDTA, 10mum NaCl) by shaking or mechanical mixing; (2) centrifuging a 10 gram stool equivalent of each sample to remove all particulate matter; (3) adding 1 µL of 100 µg/µL RNase A to the supernatant and incubating at 37°C for 1 hour; (4) precipitating total nucleic acid with 1/10 volume 3M NaAc and an equal volume isopropanol; and (5) centrifuging and then resuspending the DNA pellet in TE (0.01 M Tris pH 7.4, 0.001 M EDTA).
U.S. Patents 5,670,325 ;5,741,650 ;5,928,870 ;5,952,178 , and6,020;137 also describe various methods that can be used to prepare and analyze stool samples. - One or more specific nucleic acid fragments can be purified from a nucleic acid preparation using, for example, a modified sequence-specific hybrid capture technique (see, e.g., Ahlquist et al. (2000) Gastroenterology, 119:1219-1227). Such a protocol can involve:
- (1) adding 300 µL of sample preparation to an equal volume of a 6 M guanidine isothiocyanate solution containing 20 pmol biotinylated oligonucleotides (obtained from, for example, Midland Certified Reagent Co., Midland, TX) with sequences specific for the DNA fragments to be analyzed; (2) incubating for two hours at 25°C; (3) adding streptavidin coated magnetic beads to the solution and incubating for an additional hour at room temperature; (4) washing the bead/hybrid capture complexes four times with 1X B+W buffer (1 M NaCl, 0.01 M Tris-HCl pH 7.2, 0.001 M EDTA, 0.1% Tween 20); and (5) eluting the sequence specific captured DNA into 35 µL L-TE (1 mM Tris pH 7.4, 0.1 M EDTA) by heat denaturation of the bead/hybrid capture complexes. Any other suitable technique also can be used to isolate specific nucleic acid fragments.
- Nucleic acid can be subjected to bisulfite treatment to convert unmethylated cytosine residues to uracil residues, while leaving any 5-methylcytosine residues unchanged. A bisulfite reaction can be performed using, for example, standard techniques: (1) denaturing approximately 1 µg of genomic DNA (the amount of DNA can be less when using microdissected DNA specimens) for 15 minutes at 45°C with 2 N NaOH; (2) incubating with 0.1 M hydroquinone and 3.6 M sodium bisulfite (pH 5.0) at 55°C for 4-12 hours; (3) purifying the DNA from the reaction mixture using standard (e.g., commercially-available) DNA miniprep columns or other standard techniques for DNA purification; (4) resuspending the purified DNA sample in 55 µL water and adding 5 µl 3 N NaOH for a desulfonation reaction that typically is performed at 40°C for 5-10 minutes; (5) precipitating the DNA sample with ethanol, washing the DNA, and resuspending the DNA in an appropriate volume of water. Bisulfite conversion of cytosine residues to uracil also can be achieved using other methods (e.g., the CpGenome™ DNA Modification Kit from Serologicals Corp., Norcross, GA).
- Any appropriate method can be used to determine whether a particular DNA is hypermethylated or hypomethylated. Standard PCR techniques, for example, can be used to determine which residues are methylated, since unmethylated cytosines converted to uracil are replaced by thymidine residues during PCR. PCR reactions can contain, for example, 10 µL of captured DNA that either has or has not been treated with sodium bisulfite, 1X PCR buffer, 02 mM dNTPs, 0.5 µM sequence specific primers (e.g., primers flanking a CpG island within the captured DNA), and 5 units DNA polymerase (e.g., Amplitaq DNA polymerase from PE Applied Biosystems, Norwalk, CT) in a total volume of 50 µl. A typical PCR protocol can include, for example, an initial denaturation step at 94°C for 5 min, 40 amplification cycles consisting of 1 minute at 94°C, 1 minute at 60°C, and 1 minute at 72°C, and a final extension step at 72°C for 5 minutes.
- To analyze which residues within a captured DNA are methylated, the sequences of PCR products corresponding to samples treated with and without sodium bisulfite can be compared. The sequence from the untreated DNA will reveal the positions of all cytosine residues within the PCR product Cytosines that were methylated will be converted to thymidine residues in the sequence of the bisulfite-treated DNA, while residues that were not methylated will be unaffected by bisulfite treatment.
- Purified nucleic acid fragments from a stool sample or samples can be analyzed to determine the presence or absence of one or more somatic mutations. Mutations can be single base changes, short insertion/deletions, or combinations thereof. Methods of analysis can include conventional Sanger based sequencing, pyrosequencing, next generation sequencing, single molecule sequencing, and sequencing by synthesis. In some cases, mutational status can be determined by digital PCR followed by high resolution melting curve analysis. In other cases, allele specific primers or probes in conjunction with amplification methods can be used to detect specific mutations in stool DNA. The mutational signature can comprise not only the event of a base or sequence change in a specific gene, but also the location of the change within the gene, whether it is coding, non-coding, synonymous or non-synonymous, a transversion or transition, and the dinucleotide sequence upstream and downstream from the alteration.
- In some cases, a sample can be assessed for the presence or absence of a polypeptide marker. For example, any appropriate method can be used to assess a stool sample for a polypeptide marker indicative of a neoplasm. For example, a stool sample can be used in assays designed to detect one or more polypeptide markers. Appropriate methods such as those described elsewhere (Aebersold and Mann, Nature, 422:198-207 (2003) and McDonald and Yates, Dis. Markers, 18:99-105 (2002)) can be adapted or designed to detect polypeptides in a stool. For example, single-reaction monitoring using a TSQ mass spectrometer can specifically target polypeptides in a stool sample. High resolution instruments like the LTQ-FT or LTQ orbitrap can be used to detect polypeptides present in a stool sample.
- The term "increased level" as used herein with respect to the level of an
elastase 3A polypeptide is any level that is above amedian elastase 3A polypeptide level in a stool sample from a random population of mammals (e.g., a random population of 10, 20, 30, 40, 50, 100, or 500 mammals) that do not have an aero-digestive cancer. Elevated polypeptide levels of anelastase 3A polypeptide can be any level provided that the level is greater than a corresponding reference level. For example, an elevated level of anelastase 3A polypeptide can be 0.5, 1, 2, 3, 4, 5, 6, 7, 8, 9, 10, or more fold greater than the reference level ofelastase 3A polypeptide in a normal sample. It is noted that a reference level can be any amount. For example, a reference level for anelastase 3A polypeptide can be zero. In some cases, an increased level of anelastase 3A polypeptide can be any detectable level of anelastase 3A polypeptide in a stool sample. - The term "increased level" as used herein with respect to the level of an carboxypeptidase B polypeptide level is any level that is above a median carboxypeptidase B polypeptide level in a stool sample from a random population of mammals (e.g., a random population of 10, 20, 30, 40, 50, 100, or 500 mammals) that do not have an aero-digestive cancer. Elevated polypeptide levels of carboxypeptidase B polypeptide can be any level provided that the level is greater than a corresponding reference level. For example, an elevated level of carboxypeptidase B polypeptide can be 0.5, 1, 2, 3, 4, 5, 6, 7, 8, 9, 10, or more fold greater than the reference level carboxypeptidase B polypeptide observed in a normal stool sample. It is noted that a reference level can be any amount. For example, a reference level for a carboxypeptidase B polypeptide can be zero. In some cases, an increased level of a carboxypeptidase B polypeptide can be any detectable level of a carboxypeptidase B polypeptide in a stool sample.
- The term "increased level" as used herein with respect to the level of DNA fragments less than about 200 or less than about 70 base pairs in length is any level that is above a median level of DNA fragments less than about 200 or less than about 70 base pairs in length in a stool sample from a random population of mammals (e.g., a random population of 10, 20, 30, 40, 50, 100, or 500 mammals) that do not have an aero-digestive cancer. In some cases, an increased level of DNA fragments less than about 200 or less than about 70 base pairs in length can be any detectable level of DNA fragments less than about 200 or less than about 70 base pairs in length in a stool sample.
- The term "elevated methylation" as used herein with respect to the methylation status of a BMP3 or ALX nucleic acid is any methylation level that is above a median methylation level in a stool sample from a random population of mammals (e.g., a random population of 10, 20, 30, 40, 50, 100, or 500 mammals) that do not have an aero-digestive cancer. Elevated levels of BMP3 or ALX methylation can be any level provided that the level is greater than a corresponding reference level. For example, an elevated level of BMP3 or ALX methylation can be 0.5, 1, 2, 3, 4, 5, 6, 7, 8, 9, 10, or more fold greater than the reference level methylation observed in a normal stool sample. It is noted that a reference level can be any amount.
- The term "elevated mutation score" as used herein with respect to detected mutations in a matrix panel of particular nucleic acid markers is any mutation score that is above a median mutation score in a stool sample from a random population of mammals (e.g., a random population of 10, 20, 30, 40, 50, 100, or 500 mammals) that do not have an aero-digestive cancer. An elevated mutation score in a matrix panel of particular nucleic acid markers can be any score provided that the score is greater than a corresponding reference score. For example, an elevated score of K-ras or APC mutations can be 0.5, 1, 2, 3, 4, 5, 6, 7, 8, 9, 10, or more fold greater than the reference score of K-ras or APC mutations observed in a normal stool sample. It is noted that a reference score can be any amount.
- In some cases, a ratio of particular polypeptide markers can be determined and used to identify a mammal having an aero-digestive cancer (e.g., a colorectal cancer or a pancreatic cancer) For example, a ratio provided herein (e.g., the ratio of carboxypeptidase B polypeptide levels to carboxypeptidase A2 polypeptide levels) to can be used as described herein to identify a mammal having a particular neoplasm (e.g., pancreatic cancer).
- In some cases, a matrix marker panel can be used to identify mammals having an aero-digestive cancer (e.g., a colorectal cancer or a pancreatic cancer). In some cases, such panel also can identify the location of the aero-digestive cancer. Such a panel can include nucleic acid markers, polypeptide markers, and combinations thereof and can provide information about a mutated marker gene, the mutated region of the marker gene, and/on type of mutation. For example, data can be analyzed using a statistical model to predict tumor site (e.g., anatomical location or tissue of origin) based on inputs from sequencing data (such as by specific nucleic acid or combination of nucleic acids mutated, specific mutational location on a nucleic acid, and nature of mutation (e.g. insertion, deletion, transition, or transversion) or by any combination thereof) and/or data from polypeptide or other types of markers. For example, a Site of Tumor Estimate (SITE) model can be used to predict tumor site using a matrix panel of markers that are present to variable extent across tumors,
- In some cases, data can be analyzed using quantified markers to create a logistic model, which can have both high sensitivity and high specificity. For example, a logistic model can also incorporate population variables like gender and age to adjust cut-off levels for test positivity and thereby optimize assay performance in a screening setting" In some cases, a Quantitative Logistic to Enhance Accurate Detection (Q-LEAD) Model can be used with any marker class or combination of markers as long as they can be quantified.
- This document also provides methods and materials to assist medical or research professionals in determining whether or not a mammal has an aero-digestive cancer. Medical professionals can be, for example, doctors, nurses, medical laboratory technologists, and pharmacist. Research professionals can be, for example, principle investigators, research technicians, postdoctoral trainees, and graduate students. A professional can be assisted by (1) determining the ratio of particular polypeptide markers in a stool sample, and (2) communicating information about the ratio to that professional, for example. In some cases, a professional can be assisted by (1) determining the level of human DNA, the methylation status of genes such as BMP3, and the mutation score of genes such as APC and K-ras, and (2) communicating information about the level of DNA, the methylation status of particular genes, and the mutation score of particular genes to the professional. In some cases, a professional can be assisted by (1) detecting mutations in cancer-related genes such as K-ras, p53, APC, p16, EGFR, CTNNB1, BRAF, and SMAD4, as a matrix marker panel, and (2) communicating information regarding the mutations to the professional,
- After the ratio of particular polypeptide markers, or presence of particular nucleic acid markers in a stool sample is reported, a medical professional can take one or more actions that can affect patient care. For example, a medical professional can record the results in a patient's medical record. In some cases, a medical professional can record a diagnosis of an aero-digestive cancer, or otherwise transform the patient's medical record, to reflect the patient's medical condition. In some cases, a medical professional can review and evaluate a patient's entire medical record, and assess multiple treatment strategies, for clinical intervention of a patient's condition. In some cases, a medical professional can record a tumor site prediction with the reported mutations. In some cases, a medical professional can request a determination of the ratio of particular polypeptide markers to predict tumor site. In some cases, a medical professional can review and evaluate a patient's entire medical record and assess multiple treatment strategies, for clinical intervention of a patient's condition.
- A medical professional can initiate or modify treatment of an aero-digestive cancer after receiving information regarding a ratio of particular polypeptide markers or the presence of nucleic acid markers in a patient's stool sample. In some cases, a medical professional can compare previous reports and the recently communicated ratio of particular polypeptide markers, or presence of nucleic acid markers, and recommend a change in therapy. In some cases, a medical professional can enroll a patient in a clinical trial for novel therapeutic intervention of an aero-digestive cancer In some cases, a medical professional can elect waiting to begin therapy until the patient's symptoms require clinical intervention.
- A medical professional can communicate the ratio of particular polypeptide markers to a patient or a patient's family. In some cases, a medical professional can provide a patient and/or a patient's family with information regarding aero-digestive cancers, including treatment options, prognosis, and referrals to specialists, e.g., oncologists and/or radiologists. In some cases, a medical professional can provide a copy of a patient's medical records to communicate the ratio of particular polypeptide markers to a specialist.
- A research professional can apply information regarding a subject's ratio of particular polypeptide markers to advance aero-digestive cancer research For example, a researcher can compile data on the ratio of particular polypeptide markers, and/or presence of particular nucleic acid markers, with information regarding the efficacy of a drug for treatment of aero-digestive cancer to identify an effective treatment. In some cases, a research professional can obtain a subject's ratio of particular polypeptide markers, and/or determine the presence of particular nucleic acid markers to evaluate a subject's enrollment, or continued participation in a research study or clinical trial. In some cases, a research professional can classify the severity of a subject's condition, based on the ratio of particular polypeptide markers and/or the levels of particular nucleic acid markers. In some cases, a research professional can communicate a subject's ratio of particular polypeptide markers, and/or the presence of particular nucleic acid markers to a medical professional. In some cases, a research professional can refer a subject to a medical professional for clinical assessment of an aero-digestive cancer, and treatment of an aero-digestive cancer.
- Any appropriate method can be used to communicate information to another person (e.g., a professional). For example, information can be given directly or indirectly to a professional. For example, a laboratory technician can input the ratio of particular polypeptide markers and/or particular nucleic acid markers into a computer-based record In some cases, information is communicated by making a physical alteration to medical or research records. For example, a medical professional can make a permanent notation or flag a medical record for communicating a diagnosis to other medical professionals reviewing the record In addition, any type of communication can be used to communicate the information For example, mail, e-mail, telephone, and face-to-face interactions can be used. The information also can be communicated to a professional by making that information electronically available to the professional. For example, the information can be communicated to a professional by placing the information on a computer database such that the professional can access the information. In addition, the information can be communicated to a hospital, clinic, or research facility serving as an agent for the professional.
- The invention will be further described in the following examples, which do not limit the scope of the invention described in the claims.
- Most approaches at marker detection in stool have been qualitative. When such qualitative approaches are applied to assay of multiple markers (targeting multiple markers is required with neoplasm detection due molecular heterogeneity), sensitivity is achieved at the expense of compounded non-specificity. Non-specificity can lead to prohibitive programmatic cost with population screening due to the expensive and unnecessary evaluations of false-positive tests. However, if markers are quantified, then a logistic model can be created to achieve both high sensitivity and high specificity Such a logistic model can also incorporate population variables like gender and age to adjust cut-off levels for test positivity and thereby optimize assay performance in a screening setting (
Figure 1 ). This Quantitative Logistic to Enhance Accurate Detection (Q-LEAD) Model can be used with any marker class or combination of markers as long as they can be quantified. - A combination of more than one marker was undertaken to achieve the desired sensitivity and specificity for cancer detection Binary regression methods predicting disease as a function of diagnostic tests estimate the optimal combination of the tests for classifying a subject as diseased or not. McIntosh and Pepe, Biometrics 58: 657-664 (2002). A logistic regression model can assess the relationship between a binary dependent response variable such as presence or absence of disease and one or more independent predictor variables. The independent predictors may be qualitative (e.g., binary) or quantitative (e.g., a continuous endpoint). In the Q-LEAD model, the independent predictors can include such biological markers as K-ras, BMP3 and DNA concentration, and others. Importantly, the model incorporates the demographic variables of gender and age, as we have observed that both age and gender influence molecular marker levels in stool. As average stool marker levels increase with age and male gender, failure to adjust for these variables would yield suboptimal specificity in men and elderly persons tested. Coefficients are estimated from the sample data for each term in the model. The result of the model is a risk score for each subject. Cutoffs for predicting disease state from this risk score can be determined in order to maximize sensitivity and specificity of the marker combinations for predicting disease as desired. The inclusion of demographic variables allows these cutoffs to be determined as a function of age and gender
- As an application of the Q-LEAD Model, the following was performed to evaluate a quantitative stool DNA assay approach targeting three informative markers for the detection of colorectal neoplasia. Subjects included 34 with colorectal cancer, 20 with adenomas >1 cm, and 26 with normal colonoscopy. Subjects added a DNA stabilization buffer with stool collection, and stools were frozen at -80°C within 72 hours. From thawed stool aliquots, crude DNA was extracted by standard methods, and target genes were enriched by sequence capture. K-ras mutation score, methylation of BMP3 gene, and concentration of human DNA (245 bp length) were respectively quantified by a digital melt curve assay, real-time methylation-specific PCR, and real-time Alu PCR, respectively. Assays were performed blinded A logistic model, which incorporates three markers and gender, was constructed to analyze discrimination by combined markers.
- Age medians were 60 for patients with colorectal cancer, 66 for those with adenomas, and 61 for normal controls; and male/female distributions were 2.3/11, 9/11, and 10/16, respectively. Detection rates of colorectal neoplasms were determined by individual quantitative markers at specificity cut-offs of 96 percent and by combined markers (Table 1) Discrimination by combined markers was calculated using a qualitative binomial method (each marker considered as positive or negative based on individual 96 percent specificity) and by the Q-LEAD model (sensitivity data shown at overall specificity of 96 percent)
Table 1. Specificity and sensitivity of cancer markers. Specificity Sensitivity Cancers Adenomas Both Individual Markers k-ras mutation 96% 42% 32% 38% BMP3 methylation 96% 45% 32% 40% DNA concentration 96% 65% 40% 56% Combined Markers Qualitative method 88% 90% 58% 78% Q-LEAD Model 96% 90% 47% 76% - By quantitative assay and multivariable analysis of an informative marker panel, stool DNA testing can achieve high sensitivity while preserving high specificity for detection of colorectal neoplasia. The particular three-marker combination of mutant K-ras, BMP3 methylation, and human DNA concentration represents a complementary, high-yield panel.
- The above data set and additional data were analyzed as follows. A quantitative stool DNA assay approach targeting four informative markers for use in the detection of colorectal cancer and advanced adenoma was evaluated. Subjects comprised 74 patients with colorectal cancer, 27 with an adenoma >1 cm, and 100 with normal colonoscopy. Stools were collected with a stabilization buffer before or >1 week after colonoscopy and were frozen at -80°C within 24 hours of collection. From thawed stool aliquots, crude DNA was extracted as described above, and target genes were enriched by sequence-specific capture. Human DNA concentration, K-ras and APC mutation scores, and BMP3 methylation were sensitively quantified by real-time Alu PCR, a digital melt curve assay (Zou et al., Gastroenterology, "High Detection Rates of Colorectal Neoplasia by Stool DNA Testing With a Novel Digital Melt Curve Assay," (2008)), and real-time methylation-specific PCR, respectively. Assays were performed blindly. Sensitivities and specificities of single makers and their combinations were analyzed.
- Age medians were 61 for patients with colorectal cancer, 67 for those with adenomas, and 59 for normal controls; and, male/female ratios were 52/22, 15/12, and 37/63, respectively The table displays detection rates of colorectal neoplasms by individual quantitative markers at specificities of 90% and by combined markers at two specificities. (Table 2) Data in this table represent a training set and have not been adjusted for age and gender. Yet, it is clear that the full panel of Alu, K-ras, APC, and BMP3 detected more neoplasms than any individual marker, p<0 05. At 90% specificity, the full panel detects more adenomas >3 cm (90%, 9/10) than ≤3 cm (47%, 8/17), p<0 05, and more colorectal cancers at stages III-IV (89%, 40/45) than at stages I-II (69%, 20/29) p<0.05. Neoplasm detection rates were not affected by tumor location.
Table 2 Specificity and sensitivity of a four marker panel Specificity Sensitivity Colorectal cancers Adenomas I-I III-IV ≤ 3 cm > 3 cm Individual Markers APC mutation 90% 38% 40% 47% 50% k-ras mutation 90% 46% 42% 24% 50% BMP3 methylation 90% 36% 38% 12% 30% DNA concentration 90% 52% 76% 41% 50% Combined Markers 90% 69% 89% 47% 90%, - In conclusion, a quantitative stool DNA assay system that incorporates a stabilization buffer with specimen collection, high analytical sensitivity, and a panel of broadly informative markers can achieve high detection rates of both colorectal cancers and advanced adenoma.
- A statistical model (Site of Tumor Estimate (SITE)) can be used to predict tumor site (e.g., anatomical location or tissue of origin) based on inputs from sequencing data (such as by specific nucleic acid or combination of nucleic acids mutated, specific mutational location on a nucleic acid, and nature of mutation (e g insertion, deletion, transition, or transversion) or by any combination thereof) and/or data from polypeptide or other types of markers.
- A matrix marker panel was developed to include eight cancer-related genes: K-ras, p53, APC, p16, EGFR, CTNNB1, BRAF, and SMAD4. The mutation frequencies of these genes were tabulated against the six major aero-digestive cancers based on literature or public database reviews and on actual sequencing observations (Table 3) Literature frequencies were derived from the COSMIC somatic mutation database, review articles, and texts.
Table 3. Matrix Panel of Markers by Tumor Site AD Cancer Site p16 p53 K-ras APC SMAD4 ECFR CTNNB1 BRAF Literature Colorectal <5% 50-75% 40% 85% 14% NA 13% 20% Pancreatic 85-100% 50-60% 80-90% 10-40% 30% NA 3-8% <5% Lung 15-25% 25-75% 20-40% 5% 7% 30% 6% <5% Bile Duct 15-60% 30-60% 40% 30-40% 17% NA 1% 14% Gastric 5-30% 20-50% 10% 20-60% NA <1% 30-50% <5% Esophageal 5-90% 40-90% 5-12% 5-60% NA NA 1% <5% Actual (non-dbSNP) N Total Unique Colorectal 57 5% 47% 26% 75% 25% 12% 2% 30% 98% Pancreatic 24 29% 17% 62% 54% 8% 8% 4% 8% 83% Lung 56 9% 57% 9% 16% 14% 14% 2% 4% 77% Bile Duct 15 13% 27% 13% 20% 13% 0% 0% 7% 67% Gastric 23 17% 22% 4% 35% 17% 4% 4% 0 65% Esophageal 24 4% 46% 4% 33% 17% 4% 0 4% 79% - Some of the frequencies include other genetic alterations than simply single base changes and small insertions/deletions such as methylation events, large homozygous deletions, and copy number changes. Such alterations would not be reflected in the actual frequency table. Actual frequencies were derived by sequencing coding and flanking gene regions from 245 patient tissue samples reflecting the spectrum of aero-digestive cancers. Only non-synonymous and splice site alterations were tabulated. When specific mutational hot-spot sites were able to be identified for particular genes, only those sites were analyzed
- The matrix panel includes markers that are present to variable extent across these tumors so that their aggregate use achieves high overall sensitivity and allows prediction of tumor site using the
SITE Model 70% of tumors harbored one or more mutations from the eight gene panel. Some gene mutations, like those associated with p16, are common in tumors above the colon but rare for those in the colon. Mutant K-ras is frequent with colorectal and pancreatic cancers but infrequent in the other cancers. Mutations in EGFR clustered with lung and colorectal tumors and mutations in SMAD4 clustered with stomach and colorectal tumors Genes such as p53, are commonly mutated across many different types of cancers, but specific mutational locations or types of mutations within p53 and other genes differ between tumor site (e.g., Greenman et al., Nature, 446(7132):153-8 (2007); Soussi and Lozano, Biochem, Biophys. Res. Commun., 331(3):834-42 (2005); Stephens et al., Nat Genet., 37(6):590-2 (2005); Sjoblom et al, Science, 314(5797):268-74 (2006); Wood et al., Science, 318(5853).1108-13 (2007); and Davies, Cancer Res., 65(17):7591-5 (2005)) and can be factored in to the SITE Model to predict tumor site. Single base substitutions were the most common type of mutation throughout the panel and those that predicted colorectal tumors included C-G and A-T transversions (Figure 12 ) Other tumor sites had similarly unique base change profiles (Table 4) Insertion/deletions mutations were most common with colorectal tumors, particularly adenomas.Table 4: Specific Base Change Fractions in AD Tumors C>T T>C G>C A>T G>T T>G TUMOR (G>A) (A>G) (C>G) (T>A) (C>A) (A>C) Head and Neck 0.38 0.12 0.38 0.12 Esophageal 0.8 0.07 0.13 Lung 0.3 0.11 0.02 0.13 0.34 0.09 Stomach 0.5 0.25 0.17 0.08 Pancreas 0.41 0.15 0.04 0.07 0.33 Bile Duct 0.5 0.12 0.25 0.12 CRA 0.34 0.05 0.11 0.11 0.34 0.03 CRC 0.4 0.05 0.02 0.24 0.26 0.03 - Polypeptide markers found in stool, such as by proteomic approaches, can also be used to detect aero-digestive neoplasms and predict tumor site. The following was performed to identify and explore candidate polypeptide markers in stool for the discriminate detection of pancreatic cancer. Subjects included 16 cases with pancreatic cancer, 10 disease controls (colorectal cancer), and 24 healthy controls. Whole stools were collected and frozen promptly in aliquots at -80°C. Thawed aliquots were centrifuged, and the aqueous supernatant from each was analyzed. Polypeptides were separated by 1-D electrophoresis, excised from gels, and digested for mass spectrometric analysis using an LTQ-Orbitrap. Data outputs were searched using Mascot, Sequest, and X! Tandem programs against an updated Swissprot database that included all cataloged species. Unique peptide counts and ratio calculations were performed using Scaffold software.
- Median age for pancreatic cancer cases was 67, for colorectal cancer controls 63, and for
healthy controls 62; and male/female distributions were 9/7, 6/4, and 9/15, respectively. Using shotgun-proteomic techniques on stools, two pancreatic enzymes (carboxypeptidases B and A2) were conspicuous, as unique spectral counts of the former were commonly elevated with pancreatic cancer and of the latter commonly decreased Considered together as the ratio of carboxypeptidase B/carboxypeptidase A2, pancreatic cancer cases were almost completely separated from colorectal cancer and healthy control groups. Median ratios were 0.9, 0.2, and 0.3, respectively. At a specificity cut-off for the carboxypeptidase B/A2 ratio at 100% (i.e., ratios from normal control and colorectal cancer stools all below cut-off), sensitivity for pancreatic cancer was 86 percent (Figure 2 ) Only two pancreatic cancers were misclassified. - These results demonstrate that a stool assay of polypeptide markers can be a feasible non-invasive approach to the detection pancreatic cancer. These results also demonstrate that multivariable analysis of specific polypeptide ratios can be used
- In addition, polypeptide markers unique to colorectal neoplasms were identified (Table 5). For example, serotransferrin was found in stools from patients with colorectal cancer but not in those with pancreatic cancer. These markers when considered as part of a matrix panel contribute both to overall sensitivity for tumor detection and help discriminate colorectal from pancreatic cancer
Table 5. Positive Stool Findings. Carboxypeptidase B/A2* Serotransferrin Colorectal Cancer 0 60% Pancreatic Cancer 86% 0 Normal controls 0 0 *ratio > 0.75 considered positive - Another polypeptide in stool that is pancreatic cancer specific is elastase 3A Methods and Results demonstrating this are as follows:
- Samples were collected in phosphate buffered saline and either dropped off in clinic or mailed in collection tub. Samples were homogenized and frozen within 72 hours after receipt. Frozen stools were diluted 1:3 w:v in PBS (Roche, Cat# 1666789). Diluted stools were stomached in a filter bag (Brinkman, BA6041/STR 177 x 305 mm) for 60 seconds on control setting and spun at 10,000 rpms for 30 minutes. Following an additional 10 minute spin at 14,000 rpm, the supernatant was filtered through a 0.45-µm syringe filter and analyzed. Total protein present in stool was quantitated using a Bradford Protein Assay kit (Pierce).
- Stool supernatants were diluted 1:1 in Leammli-BME buffer and run on a 10.5-14 % gradient gel. Vertical slices were cut from 250 kDa to 15 kDa and in-gel digested using methods described elsewhere (e.g., Wilm et al., Nature, 379:466-469 (1996)). Bands were destained, dehydrated, digested in trypsin, extracted, and lyophilized for MS analysis.
- Lyophilized samples were reconstituted and injected with a flow of 500 nL/min and a 75 minute gradient from 5-90% 98% acetonitrile. MS was performed in data dependent mode to switch automatically between MS and MS2 acquisition on the three most abundant ions. Survey scans were acquired with resolution r = 60,000 at 40 m/z using FWHM with a target accumulation of 106 counts. An isolation width of 2.5 m/z was applied. Exclusion mass width was 0.6 m/z on low end and 1.5 m/x on high end. All acquisition and method development was performed using Xcaliber version 2.0.
- Samples were analyzed using Mascot (Matrix Science, London, UK; version 2.1.03), Sequest (ThermoFinnigan, San Jose, CA; version 27, rev. 12) and X! Tandem (World Wide Web at "thegpm.org"; version 2006.09.15.3). Mascot and X! Tandem were searched with a fragment ion mass tolerance of 0.80 Da and a parent ion tolerance of 10.0 PPM. Sequest was searched with a fragment ion mass tolerance of 1.00 Da. Nitration of tyrosine was specified in Mascot as a variable modification.
- Scaffold (version Scaffold-01_06_06, Proteome Software Inc., Portland, OR) was used to validate MS/MS based polypeptide identifications. Peptide identifications were accepted if they could be established at greater than 95.0% probability as specified by the Peptide Prophet algorithm (Keller et al., Anal. Chem., 74(20):5383-92 (2002)). Polypeptide identifications were accepted if they could be established at greater than 99.0 percent probability and contained at least two identified peptides. Polypeptide probabilities were assigned by the Protein Prophet algorithm (Nesvizhskii, Anal. Chem.; 75(17):4646-58 (2003)). Polypeptides that contained similar peptides and could not be differentiated based on MS/MS analysis alone were grouped to satisfy the principles of parsimony.
- Ratios of
elastase 3A were determined using spectral counts for each polypeptide. Ratios were determined by dividing the number of unique peptides ofelastase 3A (determined using a composite ID from database search modules Mascot, XTandem, and Seaquest and compiled in Scaffold) by the number of unique peptides from another polypeptide such as pancreatic alpha-amylase. - The concentration of a specific pancreatic enzyme,
elastase 3A, was consistently found to be elevated in the fecal supernatant of patients with pancreatic cancer as compared to normal controls or patients with non-pancreatic cancer (Figure 3 ). These finding indicate that fecal concentration ofelastase 3A is an accurate marker for pancreatic cancer. In addition, the ratio ofelastase 3A against other pancreatic enzymes (or other stable fecal polypeptides) was found to be especially discriminant for pancreatic cancer and obviates the need to determineabsolute elastase 3A concentrations (Figure 4 ). While mass spectrometry was used to make these observations,elastase 3A levels andratios including elastase 3A can be measured using other methods as well. - A sensitive, rapid, and affordable method for scanning mutations in bodily fluids at high-throughput was developed. A melt curve assay is a post-PCR technique that can be used to scan for mutations in PCR amplicons. Mutations in PCR products can be detected by changes in the shape of the melting curve (heterozygote from mutant sample) compared to a reference sample (homozygote from wild-type sample) (
Figure 5 ). Melt curve assay can scan all mutations in a DNA fragment <400 bp in less than 10 minutes, rather than individually targeting single mutations. Regular melt curve assays can detect mutations down to a limit of 5% mutant:wild-type and, thus, are not sensitive enough to detect mutations in many biological samples. For instance, in stool, an analytical sensitivity of 1% or less is required in order to detect precancerous polyps or small early stage cancers. Importantly, a quantitative score can be given to density of target mutations (Figure 6 ). - Digital PCR can augment the sensitivity of PCR to detect low abundance mutations. Gene copies can be diluted and distributed into 96 wells of a plate to increase the percentage of mutant copy to wild-type copies in certain wells. For example, if a stool DNA sample contains only 1% of mutant BRAF copies compared to wild-type copies, distributing 300 copies of BRAF gene into a 96-well plate can lead to three wells with an average mutant ratio of 33 percent (1:3). After PCR amplification, these three wells with mutant copies can be detected by sequencing or other approaches. Since digital PCR requires PCR on a whole 96- well plate and 96 sequencings (or other approaches) for each target, it can be slow and costly.
- The concept of digital melt curve assay is to combine the scanning ability and speed of high resolution melt curve assay with the sensitivity of digital PCR. Miniaturizing and automating this technology dramatically lowers per assay cost and achieves high-throughput necessary for population screening.
- The following procedure was used to perform a digital melt curve assay. To prepare a DNA sample, gene target fragments (e.g., BRAF, K-ras, APC, p16, etc.) were captured from stool DNA using a sequence-specific capture method and were quantified with real-time PCR. About 200 to 2000 gene copies were mixed in tube with all PCR reagents. An average of 2 to 20 copies (variable) were distributed to each well of a 96-well plate. PCR amplification was performed using specific primers on the plate (e.g., one target per plate). Final concentrations of PCR mastermix for Digital Melt Curve assays in a 96-well plate (500 µL dispersed to 96 wells with each well containing 5 µL) were as follows: 2X pfx amplification buffer (Invitrogen), 0.3 mM each dNTP, 200 nM forward primer, 200 nM reverse primer, 1 mM MgSO4, 0.02 unit/µL Platinum® pfx polymerase (Invitrogen), and 0.1 unit/µL LcGreen+ dye (Idaho Tech). A high resolution melt curve assay was used to identify the wells with mutant copies. Sequencing was optionally performed to confirm 1 to 2 representative wells.
- In some cases, emulsion PCR can be used in place of digital PCR. In such cases, each lipid drop can become a tiny PCR reactor of one single molecule of gene.
Table 6: Sequence Specific Capture Probes and DNA Primers Gene Target Region Capture probe/ primer Oligo Sequence (5'→3') SEQ ID No. KRAS Codons 12/13 Probe GTGGACGAATATGATCCAACAATAGAGGTAAATCTTG 1 Codons 12/13 Primer 1AGGCCTGCTGAAAATGACTG 2 TTGTTGGATCATATTCGTCCAC 3 Codons 12/13 Primer 2TAAGGCCTGCTGAAAATGAC 4 ATCAAAGAATGGTCCTGCAC 5 Codons 12/13 Primer 3CGTCTGCAGTCAACTGGAATTT 6 TGTATCGTCAAGGCACTCTTGC 7 Codons 12/13 Primer 4CTTAAGCGTCGATGGAGGAG 8 TTGTTGGATCATATTCGTCCAC 3 BRAF V600E Probe CCAGACAACTGTTCAAACTGATGGGACCCACTCCATC 9 V600E Primer CCACAAAATGGATCCAGACA 10 TGCTTGCTCTGATAGGAAAATG 11 APC MCR Probe 1 CAGATAGCCCTGGACAAACCATGCCACCAAGCAGAAG 12 MCR Probe 2 TTCCAGCAGTGTCACAGCACCCTAGAACCAAATCCAG 13 MCR Probe 3 ATGACAATGGGAATGAAACAGAATCAGAGCAGCCTAAAG 14 Codons 1286-1346 Primer 1TTCATTATCATCTTTGTCATCAGC 15 CGCTCCTGAAGAAAATTCAA 16 Codons 1346-1367 Primer 2TGCAGGGTTCTAGTTTATCTTCA 17 CTGGCAATCGAACGACTCTC 18 Codons 1394-1480 Primer 3CAGGAGACCCCACTCATGTT 19 TGGCAAAATGTAATAAAGTATCAGC 20 Codons 1450-1489 Primer 4CATGCCACCAAGCAGAAGTA 21 CACTCAGGCTGGATGAACAA 22 Codon 1554 Primer 5GAGCCTCGATGAGCCATTTA 23 TCAATATCATCATCATCTGAATCATC 24 102457delC Primer 6 GTGAACCATGCAGTGGAATG 25 ACTTCTCGCTTGGTTTGAGC 26 102457delC Primer 7 CAGGAGACCCCACTCATGTT 19 CATGGTTTGTCCAGGGCTAT 27 102457delC Primer 8 GTGAACCATGCAGTGGAATG 25 AGCATCTGGAAGAACCTGGA 28 TP53 Exon 4 Probe AAGACCCAGGTGCAGATGAAGCTCCCAGAATGCCAGA 29 Exon 4Primer CCCTTCCCAGAAAACCTACC 30 GCCAGGCATTGAAGTCTCAT 31 Exon 5Probe CATGGCCATCTACAAGCAGTCACAGCACATGACGGAG 32 Exon 5Primer CACTTGTGCCCTGACTTTCA 33 AACCAGCCCTGTCGTCTCT 34 Exon 6 Probe AGTGGAAGGAAATTTGCGTGTGGAGTATTTGGATGAC 35 Exon 6 Primer CAGGCCTCTGATTCCTCACT 36 CTTAACCCCTCCTCCCAGAG 37 Exon 7Probe ATGTGTAACAGTTCCTGCATGGGCGGCATGAACCGGA 38 Exon 7Primer CTTGGGCCTGTGTTATCTCC 39 GGGTCAGAGGCAAGCAGA 40 Exon 8Probe CGCACAGAGGAAGAGAATCTCCGCAAGAAAGGGGAGC 41 Exon 8Primer GGGAGTAGATGGAGCCTGGT 42 GCTTCTTGTCCTGCTTGCTT 43 - The following was performed to develop a quantitative method for scanning gene mutations and to evaluate the sensitivity of the quantitative method for detecting target mutations in stool. A digital melt curve assay was designed by combining digital PCR to a modified melt curve assay Target genes in low concentration were PCR amplified with a saturated DNA dye, LcCrreen+, in a 96-well plate Each well contained a small number of gene copies, which allowed high mutation/wild-type ratios in some wells that were then detected by melt curve scanning using a LightScanner. Mutations were scored based on the number of wells containing mutant copies in a 96-well plate. To test sensitivity, mutant genes were spiked into a wild-type pool at 0 1, 0 5, 1, 5, and 10% dilutions, and analyzed using digital melt curve assay with 250-1000 gene copies per 96-well plate This method was then applied in the stool detection of APC, p53, K-ras, and BRAF mutations from 48 patients known to have mutations in one of these genes in matched tumor tissue. Subjects included 9 patients with pancreatic cancer, 31 with colorectal cancer, and 8 with colorectal adenoma >1 cm. All mutations detected by digital melt curve were further confirmed by Sanger sequencing.
- The digital melt curve assay detected as few as 0.1% mutant copies for amplicons <350 bp using one 96-well plate (
Figure 7 ), compared to the detection limit for regular melt curve of ≥5 percent Each mutation scanning took 8-10 minutes with this manual approach. Mutations of APC, p53, K-ras, and BRAF genes were all successfully scanned with digital melt curve in quantitative fashion. Tissue-confirmed mutations were detected from matched stools in 88 percent (42/48) of patients with gastrointestinal neoplasms, including 89 percent with pancreatic cancer, 90 percent with colorectal cancer, and 75 percent with colorectal adenoma > 1 cm. - These results demonstrate that a digital melt curve assay can be a highly sensitive approach for detecting mutations in stool, and that it has potential for diagnostic application with both upper and lower gastrointestinal neoplasms.
- Archived stools were used to evaluate a digital melt curve assay of DNA markers for detection of advanced adenomas and to compare the accuracy of the digital melt curve assay with that of occult blood testing and a commercial DNA marker assay method (EXACT Sciences). Average risk subjects collected stools without a preservative buffer and mailed them to central processing laboratories for banking and blinded stool testing by Hemoccult, HemoccultSENSA, and DNA marker assay. All subjects underwent a colonoscopy, and tissue from advanced adenomas was archived. Archival stools were selected from the 27 patients with a colorectal adenoma >1 cm found to harbor mutant K-ras on tissue analyses and from the first 25 age and gender matched subjects with normal colonoscopy. Standard methods were used to extract crude DNA from fecal aliquots, and K-ras gene was enriched by sequence capture. Mutations in the K-ras gene were quantified by a digital melt curve assay based on the number of wells containing mutant gene copies in a 96-well plate and confirmed by sequencing.
- Median age with adenomas was 67 and controls 71; and males/females were 12/15 and 13/14, respectively. Median adenoma size was 1.5 cm (range 1-3 cm). Based on a cut-off of >3 wells with mutant K-ras, the digital melt curve assay yielded an overall sensitivity of 59 percent for adenomas with a specificity of 92 percent; sensitivity for adenomas >2 cm was 80 percent (8/10) and for those <2 cm was 47 percent (8/17), p=0.1. In these same stools, overall adenoma detection rates were 7 percent by Hemoccult, 15 percent by HemoccultSENSA, and 26 percent by the EXACT Sciences K-ras assay (p<0.05 for each vs. digital melt curve) (
Figure 8 ). Respective specificities were 92 percent, 92 percent, and 100 percent. - These results demonstrate that an analytically-sensitive digital melt curve assay method can be used to detect a majority of advanced colorectal adenomas and improve yield over current stool test approaches.
- Free human DNA is present in all human stools and arises from cells shed (exfoliated) from the normal surface (mucosa) of the aero-digestive tract (mouth/throat, lungs, and all digestive organs) and from tumors or other lesions that may be present. It has been generally accepted that "long DNA" in stool reflects that presence of colorectal and other aero-digestive tumors, in that cells exfoliated from cancers do not undergo typical cell death (apoptosis) which would shorten DNA. Specifically, because DNA from apoptotic cells would be broken down to fragment lengths shorter than 100 bp, long DNA was defined as being longer than 100 bp. Indeed, levels of long DNA were elevated in stools from patients with colorectal and other cancers as compared to those from healthy controls (Zou et al., Cancer Epidemiol. Biomarkers Prev., 15:115 (2006); Ahlquist et al., Gastroenterology, 119:1219 (2000); and Boynton et al., Clin Chem., 49:1058 (2003)). As such, long DNA in stool can serve as a marker for colorectal and other tumors.
- "Short DNA" (i e , <100 bp in length), however, was found to be as or more discriminant than long DNA as a tumor marker in stool for detection of both colorectal (
Figure 9 ) and pancreatic (Figure 10 ) neoplasia. - Briefly, methods and materials similar to those described elsewhere were used to detect short DNA present in stool samples (Zou et al., Cancer Epidemiol. Biomarkers Prev., 15(6):1115 (2006)). Total DNA was extracted by isopropanol precipitation from 19 blinded stool samples: 9 pancreatic adenocarcinoma, and 10 age/gender matched normals. The DNA pellets were taken up in 8 mL of 10-fold diluted TE,
pH 8. The Alu sequence consists of conserved regions and variable regions. In the putative consensus Alu sequence, the conserved regions are the 25-bp span between nucleotide positions 23 and 47 and the 16-bp span betweennucleotide positions 245 and 260 Although primers can be designed in any part of the Alu sequences, for more effectively amplifying Alu sequences, the PCR primers are preferably completely or partially (at least the 3'-regions of the primers) located in the conserved regions. Primers specific for the human Alu sequences were used to amplify fragments of differing lengths inside Alu repeats. The sequences were as follows:Amplicon size Primer Sequences 245 bp Forward Primer: 5'-ACGCCTGTAATCCCAGCACTT-3' (SEQ ID No:44) Reverse Primer: 5'-TCGCCCAGGCTGGAGTGCA-3' (SEQ ID No.45) 130 bp Forward Primer. 5'-TGGTGAAACCCCGTCTCTAC-3' (SEQ ID No.46) Reverse Primer: 5'-CTCACTGCAACCTCCACCTC-3' (SEQ ID No.47) 45 bp Forward Primer: 5'-TGGTGAAACCCCGTCTCTAC-3' (SEQ ID No:46) Reverse Primer: 5'-CGCCCGGCTAATTTTTGTAT-3'(SEQ ID No:48) - Stool DNA was diluted 1:5 with 1x Tris-EDTA buffer (pH 7.5) for PCR amplification. Tris-EDTA buffer-diluted stool DNA (1 µL) was amplified in a total volume of 25 µL containing 1x iQ SYBR Green Supermix (Bio-Rad, Hercules, CA), 200 nmol/L each primer under the following conditions. 95°C for 3 minutes followed by 40 cycles of 95°C, 60°C, and 72°C for 30 seconds each A standard curve was created for each plate by amplifying 10-fold serially diluted human genomic DNA samples (Novagen, Madison, WI). Melting curve analysis was made after each PCR to guarantee that only one product was amplified for all samples.
- Amplification was carried out in 96-well plates in an iCycler (Bio-Rad). Each plate consisted of stool DNA samples and multiple positive and negative controls. Each assay was done in duplicate.
- The following was performed to compare long DNA (245 bp) and short (45 bp) human DNA in stool for detection of upper and lower GI neoplasms, and to assess the effect of GI tumor site on human DNA levels in stool. Subjects included 33 patients with colorectal cancer, 20 with colorectal adenomas >1 cm, 13 with pancreatic cancer, and 33 colonoscopically-normal controls. Subjects added a preservative buffer to stools at time of collection to prevent post-defecation bacterial metabolism of DNA, and stools were frozen within 8 hours at -80°C. Using a validated quantitative assay for human DNA (Zou et al., Epidemiol. Biomarkers Prev., 15:1115 (2006)), 245 bp and 45 bp Alu sequences were amplified from all stools in blinded fashion. Sensitivities for long and short DNA were based on 97 percent specificity cut-offs.
- Age medians were 60, 66, 69, and 62 for colorectal cancer, colorectal adenoma, pancreatic cancer, and control groups, respectively; and male/female distributions were 22/11, 9/11, 9/4, 11/21, respectively. In stools from neoplasm and control groups, amplification products were quantitatively greater for short DNA versus long DNA. Respective sensitivities by long and short DNA were 66 percent and 62 percent with the 29 distal colorectal neoplasms, 46 percent and 46 percent with the 24 proximal colorectal neoplasms, and 15 percent and 31 percent (p=0.16) with the 13 pancreatic cancers. By Wilcoxan Rank-Sum test, effect of neoplasm site on detection rates was significant for both long DNA (p=0.004) and short DNA (p=0.02). Among colorectal neoplasms, respective sensitivities by long and short DNA were 48 percent and 52 percent with lesions <3 cm, 63 percent and 63 percent with those >3 cm, 64 percent and 61 percent with cancers, and 35 percent and 45 percent with adenomas.
- These results demonstrate that short and long DNA can be comparably sensitive for stool detection of GI neoplasms. However, detection rates vary with tumor site, being greatest with the most distal lesions and lowest with the most proximal ones. These results were consistent with substantial luminal degradation of DNA exfoliated from more proximal GI neoplasms.
- It was also demonstrated that mutant gene markers in stool can be detected to a greater extent if amplicon size is less than 70 bp, consistent with luminal degradation. Thus, short DNA can serve as a marker per se and as the target size for mutation detection.
- Stools from patients with colorectal tumors were found to contain significantly elevated amounts of methylated BMP3 gene copies, but those from normal individuals were found to contain none or only trace amounts. When fecal methylated BMP3 was assayed with an appropriate amplification method, colorectal cancers and premalignant adenomas were specifically detected (
Figure 11 ). Fecal methylated BMP3 detected a higher percentage of proximal colon tumors than distal tumors, so it can be combined with markers for distal colorectal tumors to create complementary marker panels. Fecal methylated BMP3 was very specific with few false-positive reactions. - Similar results can be obtained using other genes and methods such as those described elsewhere (Zou et al., Cancer Epidemiol. Biomarkers Prev., 16(12):2686 (2007)).
- Tissue samples from patients with confirmed aero-digestive tumors were extracted and sequenced to assess the presence or absence of somatic gene alterations. Germline DNA from the same patients were used as controls. Once an alteration was confirmed, a matched stool sample was tested for that alteration. Two separate methods were utilized to detect the mutation in stool: Allele specific PCR and digital melt curve analysis. For both methods, we focused on amplifying the shortest fragments possible (>100 bp) that have been shown to contain higher levels of the mutant sequence.
- We studied 138 patients (69 cases with a GI neoplasm and 69 age/sex-matched asymptomatic controls with normal colonoscopy) by first, identifying a mutation in neoplasm tissue, and then determining if that specific mutation could be detected in stool from that individual. Stools were collected with a stability buffer and frozen at -80C until assayed.
- Genes commonly mutated in GI neoplasms (TP53, KRAS, APC, CDH1, CTNNB1, BRAF, SMAD4, and P16) were sequenced from DNA extracted from tumor tissue, to identify a target mutation for each case. Target genes were isolated by hybrid capture (Table 7) and the tissue-confirmed somatic mutations were assayed in stool by the digital melt curve method, as described in Example 1. Mutations detected in stool were confirmed by sequencing. Assays were performed blinded.
Table 7: Sequence Specific Capture Probes and Primers for AD Cancer Mutation Detection MUTATION IN TISSUE CAPTURE PROBE SEQ ID No. SENSE PRIMER 1 (5' TO 3') SEQ ID No. ANTISENSE PRIMER 2 (5' TO 3') SEQ ID No. 12487C>CT:167Q>Q/X ATGGCCATCTACAAGCAGTCATAGCACATGACGGAGGTTGT 49 AGTACTCCCCTGCCCTCAAC 128 CTCACAACCTCCGTCATGTG 169 102447_102450het_delTGGT AGAGTGAACCATGCAGTGGAAAAGTGGCATTATAAGCCC 50 TTTGAGAGTCGTTCGATTGC 129 CATGGTTTGTCCAGGGCTAT 27 12410G>GA,141C>C/Y TTTGCCAACTGGCCAAGACCTACCCTGTGCAGCTGTG 51 AGTACTCCCCTGCCCTCAAC 128 CTCCGTCATGTGCTGTGACT 170 102678het_delA CAGATGCTGATACTTTATTACTTTTGCCACGGAAAGTACT 52 TCCAGGTTCTTCCAGATGCT 130 CACTCAGGCTGGATGAACAA 22 102594_102598het_delAGAGA AAAGCACCTACTGCTGAAA GAGAGTGGACCTAAGCAAG 53 AGCTCAAACCAAGCGAGAAG 131 AGCATCTGGAAGAACCTGGA 28 102644_102645 het_insG ATGCTGCAGTTCAGAGGGGTCCAGGTTCTTCCAGATGC 54 GGACCTAAGCAAGCTGCAGTA 132 CACTCAGGCTGGATGAACAA 22 102594_102595het_delAG TAAAGCACCTACTGCTGAAAAGAGAGAGTGGACCTAAGCAAG 55 AGCTCAAACCAAGCGAGAAG 131 AGCATCTGGAAGAACCTGGA 28 102106het_delT CACAGGAAGCAGATTCTGCAATACCCTGCAAATAGCA 56 CAGACGACACAGGAAGCAGA 133 TGCTGGATTTGGTTCTAGGG 171 102442het_delT TTCAGAGTGAACCATGCAGGGAATGGTAAGTGGCATTAT 57 TTTGAGAGTCGTTCGATTGC 129 CATGGTTTGTCCAGGGCTAT 27 apc 102494C>CT; 1429Q>Q/X TCCAGATAGCCCTGGATAAACCATGCCACCAAG 58 GTGAACCATGCAGTGGAATG 25 AGCTGTTTGAGGAGGTGGTG 172 apc 1025570CT; 1450R>R/X CTCAAACAGCTCAAACCAAGTGAGAAGTACCTAAAAATAAA 59 ACCACCTCCTCAAACAGCTC 134 GCAGCTTGCTTAGGTCCACT 173 apc 102140het_del A AGCAGAAATAAAAGAAAAGTTGGAACTAGGTCAGCTGA 60 CAGACGACACAGGAAGCAGA 133 TGCTGGATTTGGTTCTAGGG 171 apc 102494C>CT; 1429Q>Q/X TCCAGATAGCCCTGGATAAACCATGCCACCAAG 58 GTGAACCATGCAGTGGAATG 25 AGCTGTTTGAGGAGGTGGTG 172 apc 102554het_delA CTCAAACAGCTCAAACCAGCGAGAAGTACCTAAA 61 CATGCCACCAAGCAGAAGTA 21 GCAGCTTGCTTAGGTCCACT 173 tp53 E5 12647A>AG:193H>H/R TCTGGCCCCTCCTCAGCGTCTTATCCGAGTGGAAG 62 CAGGCCTCTGATTCCTCACT 36 ACACGCAAATTTCCTTCCAC 174 tp53 E5 12742G>GA CCTATGAGCCGCCTGAGATCTGGTTTGCAACTGGG 63 CATAGTGTGGTGGTGCCCTA 135 AACCACCCTTAACCCCTCCT 175 tp53 E5 12706C>CT:213R>R/X ATGACAGAAACACTTTTTGACATAGTGTGGTGGTG 64 GTGGAAGGAAATTTGCGTGT 136 CAGTTGCAAACCAGACCTCA 176 tp53 E5 12712A>AG:215S>S/G GAAACACTTTTCGACATGGTGTGGTGGTGCCCTAT 65 GTGGAAGGAAATTTGCGTGT 136 CAGTTGCAAACCAGACCTCA 176 tp53 E4 12388T>TC:134F>F/L CTGCCCTCAACAAGATGCTTTGCCAACTGGCCAAG 66 TGTTCACTTGTGCCCTGACT 137 GCAGGTCTTGGCCAGTTG 177 tp53 E3 11606G>GA:125T>T/T AAGTCTGTGACTTGCACAGTCAGTTGCCCTGAGGG 67 GTCTGGGCTTCTTGCATTCT 138 GCCAGGCATTGAAGTCTCAT 31 tp53 E6 13379C>CT:248R>R/W GCATGGGCGGCATGAACTGGAGGCCCATCCTCACC 68 TGGCTCTGACTGTACCACCA 139 CCAGTGTGATGATGGTGAGG 178 tp53 I2E3 11326A>AC (splice site) TCTTTTCACCCATCTACCGTCCCCCTTGCCGTCCC 69 ACCTGGTCCTCTGACTGCTC 140 GGGGACAGCATCAAATCATC 179 tp53 E6 13412G>GT:259D>D/Y CCATCATCACACTGGAATACTCCAGGTCAGGAGCC 70 CCTCACCATCATCACACTGG 141 GGGTCAGAGGCAAGCAGA 40 tp53 E412449G>GT:154G>GN ACCCCCGCCCGTCACCCGCGTCC 71 GTGCAGCTGTGGGTTGATT 142 CTCCGTCATGTGCTGTGACT 170 tp53 E7 13872G>GT,298E>E/X GGAACAGCTTTGAGGTGTGTGTTTGTGCCTGTCCT 72 GGAAGAGAATCTCCGCAAGA 143 GCTTCTTGTCCTGCTTGCTT 43 APC 102843C>CG:1545S>S/X TCAGAGCAGCCTAAAGAATGAAATGAAAACCAAGAGAAA 73 ATGCCTCCAGTTCAGGAAAA 144 TTTTTCTGCCTCTTTCTCTTGG 180 tp53 E4 12392G>GT,135C>C/F CCTCAACAAGATGTTTTTCCAACTGGCCAAGACCT 74 TGCCCTGACTTTCAACTCTGT 145 CTGCACAGGGCAGGTCTT 181 APC 102557C>CT:1450R>R/X CTCAAACAGCTCAAACCAAGTGAGAAGTACCTAAAAATAAA 59 ACCACCTCCTCAAACAGCTC 134 GCAGCTTGCTTAGGTCCACT 173 tp53 E7 13819G>T:280R>I CCTGTCCTGGGATAGACCGGCGCAC 75 CTACTGGGACGGAACAGCTT 146 GCGGAGATTCTCTTCCTCTG 182 tp53 I3E4 11326A>AC (splice site) TCTTTTCACCCATCTACCGTCCCCCTTGCCGTCCC 69 ACCTGGTCCTCTGACTGCTC 140 GGGGACAGCATCAAATCATC 179 tp53 E7 13412G>GT:259D>D/Y CCATCATCACACTGGAATACTCCAGGTCAGGAGCC 70 CCTCACCATCATCACACTGG 141 GGGTCAGAGGCAAGCAGA 40 tp53 E5 12449G>GT:154G>G/V ACCCCCGCCCGTCACCCGCGTCC 71 GTGCAGCTGTGGGTTGATT 142 CTCCGTCATGTGCTGTGACT 170 tp53 E8 13872G>GT:298E>E/X GGAGCCTCACCACTAGCTGCCCCCAGG 76 GGAAGAGAATCTCCGCAAGA 143 GCTTCTTGTCCTGCTTGCTT 43 tp53 E8 13813C>CG,278P>P/R GTGTTTGTGCCTGTCGTGGGAGAGACCGGCG 77 CTACTGGGACGGAACAGCTT 146 GCGGAGATTCTCTTCCTCTG 182 tp53 E8 13851A>AT,291K>K/X GGAAGAGAATCTCCGCTAGAAAGGGGAGCCTCA 78 GCGCACAGAGGAAGAGAATC 147 TTCTTGTCCTGCTTGCTTACC 183 smad4 E2 19049G>GA,118A>A/A GTTAAATATTGTCAGTATGCATTTGACTTAAAATGTGATAG 79 AGGTGGCCTGATCTTCACAA 148 TGGATTCACACAGACACTATCACA 184 tp53 E8 13777G>GA:266G>GIE TAGTGGTAATCTACTGGAACGGAACAGCTTTGAGGTG 80 TTTCCTTACTGCCTCTTGCTTC 149 CACAAACACGCACCTCAAAG 185 tp53 E612653T>TC:195I>I/T CCTCCTCAGCATCTTACCCGAGTGGAAGGAAAT 81 CAGGCCTCTGATTCCTCACT 36 ACACGCAAATTTCCTTCCAC 174 tp53 E7 13379C>CT:248R>R/W GCATGGGCGGCATGAACTGGAGGCCCATCCTCACC 68 TGGCTCTGACTGTACCACCA 139 CCAGTGTGATGATGGTGAGG 178 tp53 E6 12647A>AG:193H>HIR TCTGGCCCCTCCTCAGCGTCTTATCCGAGTGGAAG 62 CAGGCCTCTGATTCCTCACT 36 ACACGCAAATTTCCTTCCAC 174 tp53 E6 12712A>AG:215S>S/G GAAACACTTTTCGACATGGTGTGGTGGTGCCCTAT 65 GTGGAAGGAAATTTGCGTGT 136 CAGTTGCAAACCAGACCTCA 176 tp53 E8 13872G>GT,298E>E/X GGAGCCTCACCACTAGCTGCCCCCAGG 76 GGAAGAGAATCTCCGCAAGA 143 GCTTCTTGTCCTGCTTGCTT 43 tp53 E7 13370G>GA:245G>G/S AGTTCCTGCATGGGCAGCATGAACCGGAGGC 82 TGGCTCTGACTGTACCACCA 139 CCAGTGTGATGATGGTGAGG 178 tp53 E4 11580het_delG CTGGGCTTCTTGCATTCTGGACAGCCAAGTCTGTGA 83 CCCTTCCCAGAAAACCTACC 30 ACTGACCGTGCAAGTCACAG 186 tp53 E5 12524A>AG,179H>H/R TGCCCCCACCGTGAGCGCTGC 84 TGGCCATCTACAAGCAGTCA 150 CTGCTCACCATCGCTATCTG 187 tp53 E6 12661G>GT,198E>E/X TCAGCATCTTATCCGAGTGTAAGGAAATTTGCGTGTGGA 85 CAGGCCTCTGATTCCTCACT 36 CCAAATACTCCACACGCAAA 188 tp53 E8 13872G>GT,298E>E/X GGAGCCTCACCACTAGCTGCCCCCAGG 76 GGAAGAGAATCTCCGCAAGA 143 GCTTCTTGTCCTGCTTGCTT 43 apc 102494C>CT; 1429Q>Q/X TCCAGATAGCCCTGGATAAACCATGCCACCAAG 58 CAGGAGACCCCACTCATGTT 19 TGGCAAAATGTAATAAAGTATCAGC 20 apc 102557C>CT; 1450R>R/X CTCAAACAGCTCAAACCAAGTGAGAAGTACCTAAAAATAAA 59 CAGGAGACCCCACTCATGTT 19 TGGCAAAATGTAATAAAGTATCAGC 20 apc 102140het_delA AGCAGAAATAAAAGAAAAGTTGGAACTAGGTCAGCTGA 60 TTCATTATCATCTTTGTCATCAGC 15 CGCTCCTGAAGAAAATTCAA 16 apc 102494C>CT; 1429Q>Q/X TCCAGATAGCCCTGGATAAACCATGCCACCAAG 58 CAGGAGACCCCACTCATGTT 19 TGGCAAAATGTAATAAAGTATCAGC 20 apc 102134G>GT; 1309E>E/X TGCAAATAGCAGAAATAAAATAAAAGATTGGAACTAGGTCA 86 TTCATTATCATCTTTGTCATCAGC 15 CGCTCCTGAAGAAAATTCAA 16 apc 102554het_delA CTCAAACAGCTCAAACCAGCGAGAAGTACCTAAA 61 CAGGAGACCCCACTCATGTT 19 TGGCAAAATGTAATAAAGTATCAGC 20 apc 102852het_insA CTAAAGAATCAAATGAAAAACCAAGAGAAAGAGGCAGAA 87 GAGCCTCGATGAGCCATTTA 23 TCAATATCATCATCATCTGAATCATC 24 kras 5571G>GA; 12G>G/D GTGGTAGTTGGAGCTGATGGCGTAGGCAAGAGT 88 AGGCCTGCTGAAAATGACTG 2 TTGTTGGATCATATTCGTCCAC 3 tp53 E4 12392G>GA; 135C>C/Y CCTCAACAAGATGTTTTACCAACTGGCCAAGACCT 89 TGTTCACTTGTGCCCTGACT 137 GCAGGTCTTGGCCAGTTG 177 tp53 E5 12655C>CT; 196R>R/X CCTCCTCAGCATCTTATCTGAGTGGAAGGAAATTTGC 90 CAGGCCTCTGATTCCTCACT 36 ACACGCAAATTTCCTTCCAC 174 tp53 E6 13350G>GA; 238C>C/Y TCCACTACAACTACATGTATAACAGTTCCTGCATGGG 91 TGGCTCTGACTGTACCACCA 139 CCAGTGTGATGATGGTGAGG 178 tp53 E613420G>GA CACTGGAAGACTCCAGATCAGGAGCCACTTGCC 92 CCTCACCATCATCACACTGG 141 GGGTCAGAGGCAAGCAGA 40 tp53 E5 12712A>AG, 215S>S/G GAAACACTTTTCGACATGGTGTGGTGGTGCCCTAT 65 GTGGAAGGAAATTTGCGTGT 136 CAGTTGCAAACCAGACCTCA 176 kras 5571G>GA: 12G>G/D GTGGTAGTTGGAGCTGATGGCGTAGGCAAGAGT 88 AGGCCTGCTGAAAATGACTG 2 TTGTTGGATCATATTCGTCCAC 3 p16 (ink4a) E1 19638A>AT GGAGAGGGGGAGTGCAGGCAGCGGG 93 AGCCAGTCAGCCGAAGG 151 GAGGGGCTGGCTGGTC 189 p16 (ink4a) E2 23353G>GT: 447D>D/Y CCCAACTGCGCCTACCCCGCCACTC 94 CACCCTGGCTCTGACCAT 152 GGGTCGGGTGAGAGTGG 190 p16 (ink4a) E1 19638A>AT GGAGAGGGGGAGTGCAGGCAGCGGG 93 AGCCAGTCAGCCGAAGG 151 GAGGGGCTGGCTGGTC 189 p16 (ink4a) E2 23402het_delT GCCCGGGAGGGCTCCTGGACACGCTG 95 GACCCCGCCACTCTCAC 153 CAGCTCCTCAGCCAGGTC 191 p16 (ink4a) E2 23403C>CA; 484F>F/ GCCCGGGAGGGCTTACTGGACACGCTGGT 96 GACCCCGCCACTCTCAC 153 CAGCTCCTCAGCCAGGTC 191 ctnnb1 25541het_delT CAATGGGTCATATCACAGATTCTTTTTTTTAAATTAAAGTAACA 97 ATATTTCAATGGGTCATATCACAG 154 TCAAATCAGCTATAAATACGAAACA 192 cdh1 E9 76435het_delA TCTTATCTCAAAAGAACAACAAAAAAGAGGAATCCTTTAG 98 GCCATGATCGCTCAAATACA 155 TCTCAGGGGGCTAAAGGATT 193 cdh1 E1 743_744het_insAGCCCTGCGCCC A GCGCCCAGCCCTGCGCCCATTCCTC 99 ACTTGCGAGGGACGCATT 156 GAAGAAGGGAAGCGGTGAC 194 cdh1 E13 86853_86854het_insA AAGTAAGTCCAGCTGGCAAAGTGACTCAGCCTTTGACTT 100 CATTCTGGGGATTCTTGGAG 157 GGAAATAAACCTCCTCCATTTTT 195 cdh1 E14 91472C>CT; 751N>N/N AGGATGACACCCGGGACAATGTTTATTACTATGATGAAG 101 CTGTTTCTTCGGAGGAGAGC 158 CCGCCTCCTTCTTCATCATA 196 cdh1 E15 92868_92896het_delTTGACTTGA GCCAGCTGCACAGGGGCCTG TTTTTTCTCCAAAGGACTGACGCTCGGCCTGAAGTG 102 TTCCTACTCTTCATTGTACTTCAACC 159 TGCAACGTCGTTACGAGTCA 197 cdh1 E4 71669het_delA CAAGCAGAATTGCTCACTTTCCCAACTCCTCTCC 103 CGTTTCTGGAATCCAAGCAG 160 GCAGCTGATGGGAGGAATAA 198 cdh1 E7 74926G>GA; 289A>A/T GGTCACAGCCACAGACACGGACGATGATGTGAA 104 CCAGGAACCTCTGTGATGGA 161 TGAGGATGGTGTAAGCGATG 199 cdh1 E1 736_742het_delTGCGCCC AGCCCTGCGCCCCTTCCTCTCCCG 105 ACTTGCGAGGGACGCATT 156 GAAGAAGGGAAGCGGTGAC 194 p16 (ink4a) E1 19638A>AT GGAGAGGGGGAGTGCAGGCAGCGGG 93 AGCCAGTCAGCCGAAGG 151 GAGGGGCTGGCTGGTC 189 tp53 E4 12365A>AG; 126Y>Y/C TTCCTCTTCCTACAGTGCTCCCCTGCCCTCAAC 106 CACTTGTGCCCTGACTTTCA 33 GCCAGTTGGCAAAACATCT 200 tp53 E412548G>GA TGCTCAGATAGCGATGATGAGCAGCTGGGGCTG 107 CACATGACGGAGGTTGTGAG 162 AACCAGCCCTGTCGTCTCT 34 p16 (ink4a) E1 19810T>TG, 491I>I/S GGTCGGAGGCCGAGCCAGGTGGGTAGA 108 TTCCAATTCCCCTGCAAA 163 CCCAACGCACCGAATAGT 201 tp53 E7 13757G>GA GCTTCTCTTTTCCTATCCTAAGTAGTGGTAATCTACTGG 109 GGGACAGGTAGGACCTGATTT 164 AGCTGTTCCGTCCCAGTAGA 202 tp53 E7 13815G>GC, 279G>G/R TTGTGCCTGTCCTCGGAGAGACCGGCG 110 CTACTGGGACGGAACAGCTT 146 GCGGAGATTCTCTTCCTCTG 182 tp53 E7 13816G>GA; 279G>G/E TGTGCCTGTCCTGAGAGAGACCGGCGC 111 CTACTGGGACGGAACAGCTT 146 GCGGAGATTCTCTTCCTCTG 182 tp53 E5 12365A>AC,126Y>Y/S TTCCTCTTCCTACAGTCCTCCCCTGCCCTCAAC 112 CACTTGTGCCCTGACTTTCA 33 GCCAGTTGGCAAAACATCT 200 tp53 E512491A>AT,168H>HIL TCTACAAGCAGTCACAGCTCATGACGGAGGTTGTGGA 113 TGGCCATCTACAAGCAGTCA 150 CTGCTCACCATCGCTATCTG 187 113 TGGCCATCTACAAGCAGTCA 150 TCACCATCGCTATCTGAGCA 203 113 TGGCCATCTACAAGCAGTCA 150 AACCAGCCCTGTCGTCTCT 34 kras 5570G>GC,12G>G/R GTGGTAGTTGGAGCTGATGGCGTAGGCAAGAGT 88 AGGCCTGCTGAAAATGACTG 2 TTGTTGGATCATATTCGTCCAC 3 tp53 E7 13370G>GA,245G>G/S AGTTCCTGCATGGGCAGCATGAACCGGAGGC 82 TGGCTCTGACTGTACCACCA 139 CCAGTGTGATGATGGTGAGG 178 apc 102864_102865het_delAG AAATGAAAACCAAGAGAAAGGCAGAAAAAACTATTGATTC 114 TGACAATGGGAATGAAACAGA 165 GGTCCTTTTCAGAATCAATAGTTTT 204 tp53 E5 12386T>TC,133M>M/T CCTGCCCTCAACAAGACGTTTTGCCAACTGGCC 115 TGTTCACTTGTGCCCTGACT 137 GCAGGTCTTGGCCAGTTG 177 cdh1 E15 93059G>GA GCTCATCTCTAAGCTCAGGAAGAGTTGTGTCAAAAATGAGA 116 CCAAAGCATGGCTCATCTCTA 205 CTCAGGCAAGCTGAAAACAT 206 tp53 E8 13798G>GA:273R>R/H CGGAACAGCTTTGAGGTGCATGTTTGTGCCTGTCCTGGG 117 CTACTGGGACGGAACAGCTT 146 GCGGAGATTCTCTTCCTCTG 182 p53 E6, 12698_12701het_delAC (1 or 2 AC repeats) TGGAAGGAAATTTGCGTGTGGAGTATTTGGATGACAG 118 GTGGAAGGAAATTTGCGTGT 136 CAGTTGCAAACCAGACCTCA 176 P53 E8, 13824C>CT,282R>R/W TGTCCTGGGAGAGACTGGCGCACAGAGGAAGAGAAT 119 CTACTGGGACGGAACAGCTT 146 GCGGAGATTCTCTTCCTCTG 182 APC 102151G>GA,1314R>R/R AAGAAAAGATTGGAACTAGATCAGCTGAAGATCCTGTG 120 CAGACGACACAGGAAGCAGA 133 GTGACACTGCTGGAACTTCG 207 P53 E512457 G>GIT CGCCCGGCACCCGCTTCCGCGCCATGGCCA 121 GTGCAGCTGTGGGTTGATT 142 CTCCGTCATGTGCTGTGACT 170 p53 E8 13812C>CG,278P>P/A GTGTTTGTGCCTGTGCTGGGAGAGACCGGCG 122 CTACTGGGACGGAACAGCTT 146 GCGGAGATTCTCTTCCTCTG 182 APC 102686het_delA AGGTTCTTCCAGATGCTGATACTTTATTACATTTTGC 123 CTGCAGTTCAGAGGGTCCAG 210 CACTCAGGCTGGATGAACAA 22 APC het_delAG between 102594_102603 (1 of 5 AG repeats) GCGAGAAGTACCTAAAAATAAAGCACCTACTGCTGAA 124 AGCTCAAACCAAGCGAGAAG 131 AGCATCTGGAAGAACCTGGA 28 APC 102240C>CA,1344S>S/X CAGGGTTCTAGTTTATCTTAAGAATCAGCCAGGCACA 125 CCCTAGAACCAAATCCAGCA 166 TGTCTGAGCACCACTTTTGG 208 102676_102680delACATT CCAGATGCTGATACTTTATTTTGCCACGGAAAGTACTC 126 CTGCAGTTCAGAGGGTCCAG 167 CACTCAGGCTGGATGAACAA 22 12487C>CT:167Q>Q/X ATGGCCATCTACAAGCAGTCATAGCACATGACGGAGGTTGT 49 AGTACTCCCCTGCCCTCAAC 128 CTCACAACCTCCGTCATGTG 169 102447_102450het_delTGGT AGAGTGAACCATGCAGTGGAAAAGTGGCATTATAAGCCC 50 TTTGAGAGTCGTTCGATTGC 129 CATGGTTTGTCCAGGGCTAT 27 12410G>GA,141C>C/Y TTTGCCAACTGGCCAAGACCTACCCTGTGCAGCTGTG 51 AGTACTCCCCTGCCCTCAAC 128 CTCCGTCATGTGCTGTGACT 170 102678het_delA CAGATGCTGATACTTTATTACTTTTGCCACGGAAAGTACT 52 TCCAGGTTCTTCCAGATGCT 130 CACTCAGGCTGGATGAACAA 22 102594_102598het_delAGAGA AAAGCACCTACTGCTGAAAGAGAGTGGACCTAAGCAAG 127 AGCTCAAACCAAGCGAGAAG 131 AGCATCTGGAAGAACCTGGA 28 102776A>AT:1523R>R/X ATGACAATGGGAATGAAACAGAATCAGAGCAGCCTAAAG 14 TTTGCCACGGAAAGTACTCC 168 TTTCCTGAACTGGAGGCATT 209 102644_102645 het_insG ATGCTGCAGTTCAGAGGGGTCCAGGTTCTTCCAGATGC 54 GGACCTAAGCAAGCTGCAGTA 132 CACTCAGGCTGGATGAACAA 22 102594_102595het_delAG TAAAGCACCTACTGCTGAAAAGAGAGAGTGGACCTAAGCAAG 55 AGCTCAAACCAAGCGAGAAG 131 AGCATCTGGAAGAACCTGGA 28 102106het_delT CACAGGAAGCAGATTCTGCAATACCCTGCAAATAGCA 56 CAGACGACACAGGAAGCAGA 133 TGCTGGATTTGGTTCTAGGG 171 102442het_delT TTCAGAGTGAACCATGCAGGGAATGGTAAGTGGCATTAT 57 TTTGAGAGTCGTTCGATTGC 129 CATGGTTTGTCCAGGGCTAT 27 apc 102494C>CT;1429Q>Q/X TCCAGATAGCCCTGGATAAACCATGCCACCAAG 58 GTGAACCATGCAGTGGAATG 25 AGCTGTTTGAGGAGGTGGTG 172 apc 102140het_delA AGCAGAAATAAAAGAAAAGTTGGAACTAGGTCAGCTGA 60 CAGACGACACAGGAAGCAGA 133 TGCTGGATTTGGTTCTAGGG 171 apc 102554het_delA CTCAAACAGCTCAAACCAGCGAGAAGTACCTAAA 61 CATGCCACCAAGCAGAAGTA 21 GCAGCTTGCTTAGGTCCACT 173 - Target mutations were not detected in control stools. Target mutations were detected in stools from 68% (47/69) of patients with a GI neoplasm Specifically, target mutations were detected in stools from 71% (36/51) of patients with cancer [40% (2/5) with oropharyngeal, 65% (11/17) with esophageal, 100% (4/4) with gastric, 55% (6/11) with pancreatic, 75% (3/4) with biliary or gallbladder, and 100% (10/10) with colorectal] and from 61%(11/18) with precancers [100% (2/2) with pancreatic intraductular papillary mucinous neoplasia and 56% (9/16) with colorectal advanced adenoma]. Mutant copies in genes recovered from stool averaged 0.4% (range 0.05-13.4%) for supracolonic and 1.4% (0.1-15.6%) for colorectal neoplasms, p=0.004 (Table 8).
Table 8: Digital Melt Curve Detection of Validated Mutations in AD Cancer Patient Stool # ID Site Age Gender Tissue Mutations Stool Detection Mutation Frequency % Normal Control 1 1163 Head/Neck (pharynx) 73 M tp53 YES 0.8 Neg 2 1250 Head/Neck (pharynx) 49 M tp53 NO Neg 3 1295 Head/Neck (pharynx) 47 F to53 NO Neg 4 1391 Head/Neck 65 M tp53 TP53 NO (both) Neg 5 1427 Head/Neck 60 M tp53 tp53 YES (p53-1), No (p53-2) 0.05 Neg 1 745 Esophagus 84 F tp53 YES 0.4 Neg 2 769 Esophagus 56 F tp53 YES 0.4 Neg 3 782 Esophagus 55 M tp53 NO Neg 4 789 Esophagus 61 M tp53 YES 1.6 Neg 5 819 Esophagus 53 M tp53 YES 0.2 Neg 6 873 Esophagus 61 M tp53 YES 0.2 Neg 7 906 Esophagus 55 M APC YES 0.8 Neg 8 1049 Esophagus 57 M tp53 NO Neg 9 1064 Esophagus 72 F tp53 NO Neg 10 1067 Esophagus 72 M tp53 YES 0.7 Neg 11 1103 Esophagus 78 M tp53 NO Neg 12 1199 Esophagus 66 M tp53 YES 0.5 Neg 13 1307 Esophagus 51 M tp53 NO Neg 14 1373 Esophagus 76 M tp53 YES 0.5 Neg 15 1414 Esophagus 66 M tp53 YES 0.1 Neg 16 1448 Esophagus 82 M tp53 NO Neg 17 1072 Esophagus tp53 YES 0.4 Neg 1 798 Stomach 81 M cdh1 YES 13.2 Neg 3 1221 Stomach 55 M cdh1 cdh1 YES (both) 8, 1.3 Neg 4 1224 Stomach 75 F smad4 cdh1 YES (smad4), NO (CDH1) 0.2 Neg 5 1402 Stomach 56 M APC tp53 YES (p53) 0.1 Neg 1 848 Gall Bladder 67 M tp53 YES 0.1 Neg 2 1315 Gall Bladder 57 F tp53 YES 1.4 Neg 1 1043 Bile Duct 51 F APC NO Neg 2 1554 Bile Duct 77 M cdh1 YES 13.4 Neg 1 757 Pancreatic cancer m situ 78 M k-ras YES 0.2 Neg 2 1349 Pancreatic cancer in situ 64 M k-ras YES 0.2 Neg 1 839 Pancreas 69 F tp53 YES 0.2 Neg 2 1204 Pancreas 65 F p16 No Neg 3 1253 Pancreas 63 F K-ras tp53 YES (K-ras), No (p53) 2 Neg 4 Pancreas 71 F tp53 k-ras NO (both) Neg 5 1400 1547 Pancreas 77 F tp53 NO Neg 6 1217 Pancreas K-ras NO Neg 7 1073 Pancreas K-ras NO Neg 8 532 Pancreas K-ras YES 1 Neg 9 1592 Pancreas K-ras P53 YES (both) 0.3 Neg 10 1695 Pancreas K-ras YES 0.2 Neg 11 1058 Pancreas K-ras P53 APC YES (K-ras) 0.2 Neg 1 438 Colorectal Cancer 78 F APC YES 1.2 Neg 2 446 Colorectal Cancer 74 M BRAF YES 0.4 Neg 3 529 Colorectal Cancer 46 M K-RAS YES 1 Neg 4 489 Colorectal Cancer 73 M K-RAS YES 2.6 Neg 5 549 Colorectal Cancer 79 M BRAF YES 1.6 Neg 6 551 Colorectal Cancer 69 M K-RAS YES 5.8 Neg 7 584 Colorectal Cancer 68 M K-RAS YES 1.4 Neg 8 894 Colorectal Cancer 57 M P53 APC YES (p53, APC) 1.6, 5 Neg 9 998 Colorectal Cancer 45 F APC K-RAS YES (K-ras, APC) 0.6, 0.8 Neg 10 1009 Colorectal Cancer 65 F P53 YES 12.9 Neg 1 513 Colorectal Adenoma 65 F APC YES 0.1 Neg 2 546 Colorectal Adenoma 61 M APC NO Neg 3 547 Colorectal Adenoma 52 F APC NO Neg 4 568 Colorectal Adenoma 52 M APC YES 7.8 Neg 5 578 Colorectal Adenoma 71 F APC NO Neg 6 590 Colorectal Adenoma 54 F APC YES 3.2 Neg 7 701 Colorectal Adenoma 72 F APC NO Neg 8 855 Colorectal Adenoma 75 M K-RAS YES 0.4 Neg 9 860 Colorectal Adenoma 53 M APC YES 15.6 Neg 10 900 Colorectal Adenoma 64 F APC K-RAS NO (both) Neg 11 962 Colorectal Adenoma 56 M K-RAS YES 1 Neg 12 965 Colorectal Adenoma 82 M APC K-RAS NO (both) Neg 13 991 Colorectal Adenoma 79 M APC K-RAS YES (K-ras), No (APC) 0.2 Neg 14 1135 Colorectal Adenoma 59 M K-RAS YES 13 Neg 15 1231 Colorectal Adenoma 50 M APC NO Neg 16 1559 Colorectal Adenoma - K-RAS YES 1 Neg - We also performed an initial pilot study with 10 stool samples from patients with confirmed bile duct cancers to determine if DMC technology could detect mutations in k-ras, a well characterized gene known be mutated in this population. K-ras mutations were detected in stools for 3/10 or 4/10 bile duct cancers (depending on mutation score of 5 or 3, respectively) (Table 9). As K-ras is mutant in 30-40% of bile duct cancers, these results indicate that the detection assay is picking up the appropriate proportion of cancer samples.
Table 9. K-ras mutation scores for patients with bile duct cancer. Mutation Detected Sample # Pathology K-ras Mutation Score A B 520 BD Cancer 0 528 BD Cancer 0 559 BD Cancer 0 558 BD Cancer 1 Codon 12 GAT 515 BD Cancer 2 Codon 12 GAT 543 BD Cancer 2 Codon 13 GAC806 BD Cancer 3 Codon 12 TGT 539 BD Cancer 5 Codon 12 GAT Codon 13 GGA 512 BD Cancer 6 Codon 12 GAT Codon 12 GAT Codon 12 GAT; 725 BD Cancer 25 Codon 13 GACCodon 12 GTT - The allele specific-PCR assay was a modified version of a previously published method (e.g., Cha et all, Mismatch Amplification Mutation Assay (MAMA): Application to the c-H-ras Gene PCR Methods and Applications, 2:14-20 (1992) Cold Spring Harbor Laboratory). TP53 gene fragments were captured from stool DNA samples with probes specific to mutations identified in the matched tissue (Table 7). Copy numbers were assessed by qPCR Samples were adjusted to 10,000 fragments each and amplified with allele specific primer sets.
Sample F Primer R Primer A745 GACAGAAACACTTTAT (SEQ ID No:211) CGGCTCATAGGG (SEQ ID No:217) A848 ACACTTTTCGACAAG (SEQ ID No:212) AAACCAGACCTCAG (SEQ ID No:218) A789 CCTCAACAAGATAC (SEQ ID No:213) CAGCTGCACAGG (SEQ ID No:219) A782 GCCGCCTGAAA (SEQ ID No:214) AGACCCCAGTTGC (SEQ ID No:220) A873 GCGGCATGAAAT (SEQ ID No:215) TTCCAGTGTGATGAT (SEQ ID No:221) A769 CCCCTCCTCAGAG (SEQ ID No:216) CTTCCACTCGGATAA (SEQ ID No:222) - Targeting mutations found in esophageal cancers or those from gastroesophageal junction (on p53, APC, or K-ras), the same mutation was detected by allele-specific PCR in matched stools from five of five (100%) cancers but in none of the controls (Table 10). The threshold cycle (Ct), designates the PCR cycle at which the product enters the exponential phase of amplification.
- Targeting a mutation confirmed in a gallbladder cancer, the same mutation was found in the matched stool from that patient using allele-specific PCR (Table 10).
Table 10 Quantitative Mutant Allele Specific-PCR Results for Matched Aero-digestive Cancers Sample Gene # fragments Ct A769 esophageal/gastric cancer p53 10K 71 N normal p53 10K >80 A782 esophageal/gastric cancer p53 10K 38.8 N normal p53 10K 44.1 A745 esophageal/gastric cancer p53 30K 42.5 N normal p53 30K 45.6 A873 esophageal/gastric cancer p53 30K 37.8 N normal p53 30K 40.4 A848 gall bladder cancer p53 10K 22.4 N normal p53 10K 36.3 A789 esophaqeal/gastric cancer p53 10K 25.9 N normal p53 10K 28.7 - The following list of polypeptides were identified by a statistical analysis model using all data generated from mass spectral of fecal protein extracts: β2-macroglobulin, compliment C3 protein, serotransferrin, haptoglobin,
carbonic anhydrase 1, xaa-pro dipeptidase, leukocyte elastase inhibitor, hemoglobin, glucose-6-phosphate, and catalase This list of polypeptides is in order of difference from normal. Thus, the mean spectral abundance for β2-macroglobulin is most different from normal for cancer and adenoma. - The statistical significance of relative polypeptide abundance between normal, adenoma, and colorectal cancer (CRC) was obtained using normalized spectral count data from a zero inflated poisson regression model as an offset term in the protein specific differential expression analysis. The differential expression analysis also incorporated the zero inflated poisson regression model. Polypeptides were then ranked according to their statistical significance and whether the expression profile followed the clinically relevant pattern of Normal < Adenoma < CRC. Using a rule that a positive test required that any three of top six markers be positive, the sensitivity and specificity of this panel were both 100% in a training set.
- The listed polypeptides can be used individually or in any combination to detect colorectal cancer or precancerous adenomas.
- Potential polypeptide markers for pancreatic cancer prediction were identified. Utilizing a Scaffold (Proteome Software) side-by-side comparison of spectral abundances, ratios of the spectral counts of carboxypeptidase B (CBPB1_HUMAN) and Carboxypeptidase A1 (CBPA1_HUMAN) were compared. A value for carboxypeptidase B/A1 of 0.7 or higher was predictive of pancreatic cancer (in normal stools, an average ratio of 2:3 B/A1 was observed). Specificity for training data was 100% with a sensitivity of 88%, while sensitivity from a validation set was 82% at the same specificity.
- Stools from patients with colorectal tumors were found to contain significantly elevated amounts of methylated ALX4 gene copies, but those from normal individuals were found to contain none or only trace amounts. When fecal methylated ALX4 was assayed with an appropriate amplification method, colorectal cancers and premalignant adenomas were specifically detected. At 90% specificity, fecal methylated ALX4 detected 59% colorectal cancer and 54% premalignant adenomas, allowing for the detection of both colorectal cancer and premalignant adenomas.
- It is to be understood that while the invention has been described in conjunction with the detailed description thereof, the foregoing description is intended to illustrate and not limit the scope of the invention, which is defined by the scope of the appended claims. Other aspects, advantages, and modifications are within the scope of the following claims.


Claims (15)
- A method of detecting cancer in a mammal, said method comprising determining whether or not a stool sample from said mammal comprises an elevated K-ras mutation score, an elevated BMP3 methylation status, and an elevated level of human DNA as compared to a normal control, wherein the presence of said elevated K-ras mutation score, said elevated BMP3 methylation status, and said elevated level of human DNA level indicates that said mammal has cancer.
- The method of Claim 1, wherein said cancer is selected from the group consisting of colorectal cancer, precancer, and aero-digestive cancer.
- The method of claim 1, wherein said K-ras mutation score is measured by digital melt curve analysis.
- The method of Claim 1, wherein said K-ras is represented by GenBank accession no. NM_033360.
- The method of Claim 1, wherein said K-ras is represented by gil344857241.
- The method of Claim 1, wherein said K-ras mutation score is measured by quantitative allele-specific PCR.
- The method of Claim 1, wherein said BMP3 is represented by GenBank accession no. M22491.
- The method of Claim 1, wherein said BMP3 is represented by gil179505.
- The method of Claim 1, wherein said elevated BMP3 methylation status is measured by real time methylation specific PCR.
- The method of Claim 1, wherein said human DNA is at least 245 base pairs in length.
- The method of Claim 1, wherein said elevated level of human DNA is measured by real time PCR.
- The method of Claim 1, wherein said human DNA comprises an Alu repeat.
- The method of claim 1, wherein said method further comprises determining whether or not a stool sample from said mammal comprises an elevated APC mutation score.
- The method of claim 12, wherein said APC mutation score can be measured by digital melt curve analysis.
- The method of Claim 1, wherein said cancer is precancer.
Priority Applications (1)
| Application Number | Priority Date | Filing Date | Title |
|---|---|---|---|
| EP14176500.8A EP2816122A1 (en) | 2008-02-15 | 2009-02-11 | Detecting neoplasm from a stool sample |
Applications Claiming Priority (2)
| Application Number | Priority Date | Filing Date | Title |
|---|---|---|---|
| US2922108P | 2008-02-15 | 2008-02-15 | |
| EP09711056A EP2255198A4 (en) | 2008-02-15 | 2009-02-11 | Detecting neoplasm |
Related Parent Applications (2)
| Application Number | Title | Priority Date | Filing Date |
|---|---|---|---|
| EP09711056.3 Division | 2009-02-11 | ||
| EP09711056A Division EP2255198A4 (en) | 2008-02-15 | 2009-02-11 | Detecting neoplasm |
Related Child Applications (2)
| Application Number | Title | Priority Date | Filing Date |
|---|---|---|---|
| EP14176500.8A Division EP2816122A1 (en) | 2008-02-15 | 2009-02-11 | Detecting neoplasm from a stool sample |
| EP14176500.8A Division-Into EP2816122A1 (en) | 2008-02-15 | 2009-02-11 | Detecting neoplasm from a stool sample |
Publications (3)
| Publication Number | Publication Date |
|---|---|
| EP2474626A2 true EP2474626A2 (en) | 2012-07-11 |
| EP2474626A3 EP2474626A3 (en) | 2012-08-01 |
| EP2474626B1 EP2474626B1 (en) | 2014-08-13 |
Family
ID=40957474
Family Applications (3)
| Application Number | Title | Priority Date | Filing Date |
|---|---|---|---|
| EP11189541.3A Active EP2474626B1 (en) | 2008-02-15 | 2009-02-11 | Detecting neoplasm from a stool sample |
| EP14176500.8A Ceased EP2816122A1 (en) | 2008-02-15 | 2009-02-11 | Detecting neoplasm from a stool sample |
| EP09711056A Withdrawn EP2255198A4 (en) | 2008-02-15 | 2009-02-11 | Detecting neoplasm |
Family Applications After (2)
| Application Number | Title | Priority Date | Filing Date |
|---|---|---|---|
| EP14176500.8A Ceased EP2816122A1 (en) | 2008-02-15 | 2009-02-11 | Detecting neoplasm from a stool sample |
| EP09711056A Withdrawn EP2255198A4 (en) | 2008-02-15 | 2009-02-11 | Detecting neoplasm |
Country Status (4)
| Country | Link |
|---|---|
| US (8) | US8673555B2 (en) |
| EP (3) | EP2474626B1 (en) |
| ES (1) | ES2522542T3 (en) |
| WO (1) | WO2009102788A2 (en) |
Cited By (1)
| Publication number | Priority date | Publication date | Assignee | Title |
|---|---|---|---|---|
| US11566284B2 (en) | 2016-08-10 | 2023-01-31 | Grail, Llc | Methods of preparing dual-indexed DNA libraries for bisulfite conversion sequencing |
Families Citing this family (25)
| Publication number | Priority date | Publication date | Assignee | Title |
|---|---|---|---|---|
| EP2474626B1 (en) | 2008-02-15 | 2014-08-13 | Mayo Foundation For Medical Education And Research | Detecting neoplasm from a stool sample |
| EP3928715A1 (en) | 2011-06-19 | 2021-12-29 | DNA Genotek, Inc. | Devices, solutions and methods for sample collection |
| CA2848162C (en) | 2011-09-12 | 2023-03-14 | Creatics Llc | Non-invasive methods of detecting target molecules |
| WO2014025961A1 (en) * | 2012-08-10 | 2014-02-13 | Analiza, Inc. | Methods and devices for analyzing species to determine diseases |
| WO2014160499A2 (en) * | 2013-03-13 | 2014-10-02 | Creatics Llc | Methods and compositions for detecting pancreatic cancer |
| US9994911B2 (en) | 2013-03-14 | 2018-06-12 | Mayo Foundation For Medical Education And Research | Detecting neoplasm |
| KR102392407B1 (en) | 2014-03-07 | 2022-04-29 | 디엔에이 제노텍 인코퍼레이티드 | Composition and method for stabilizing nucleic acids in biological samples |
| WO2015153284A1 (en) | 2014-03-31 | 2015-10-08 | Mayo Foundation For Medical Education And Research | Detecting colorectal neoplasm |
| US10184154B2 (en) * | 2014-09-26 | 2019-01-22 | Mayo Foundation For Medical Education And Research | Detecting cholangiocarcinoma |
| US10030272B2 (en) | 2015-02-27 | 2018-07-24 | Mayo Foundation For Medical Education And Research | Detecting gastrointestinal neoplasms |
| RU2586775C1 (en) * | 2015-04-27 | 2016-06-10 | Федеральное государственное бюджетное учреждение "Петербургский институт ядерной физики им. Б.П. Константинова" (ФГБУ "ПИЯФ") | Method for non-invasive diagnosis of colorectal cancer |
| CN108138235B (en) | 2015-08-31 | 2022-04-15 | 梅约医药教育及研究基金会 | Detection of gastric tumors |
| US11285478B2 (en) | 2016-04-04 | 2022-03-29 | Combinati Incorporated | Microfluidic siphoning array for nucleic acid quantification |
| EP3443089A4 (en) | 2016-04-14 | 2020-04-22 | Mayo Foundation for Medical Education and Research | Detecting pancreatic high-grade dysplasia |
| US10370726B2 (en) | 2016-04-14 | 2019-08-06 | Mayo Foundation For Medical Education And Research | Detecting colorectal neoplasia |
| CN110177621B (en) * | 2016-11-17 | 2022-07-08 | 康比纳提公司 | Methods and systems for nucleic acid analysis and quantification |
| GB201619945D0 (en) * | 2016-11-25 | 2017-01-11 | Imp Innovations Ltd | Methods |
| CN106521007A (en) * | 2016-12-27 | 2017-03-22 | 刘鹏飞 | Reagent system and kit for detecting methylation of BMP3 genes and application of reagent system and kit |
| JP7356349B2 (en) | 2017-02-28 | 2023-10-04 | マヨ ファウンデーション フォア メディカル エデュケーション アンド リサーチ | prostate cancer detection |
| EP3717644A4 (en) | 2017-11-30 | 2021-12-29 | Mayo Foundation for Medical Education and Research | Detecting breast cancer |
| EP3856903A4 (en) | 2018-09-27 | 2022-07-27 | Grail, LLC | Methylation markers and targeted methylation probe panel |
| JP7173815B2 (en) * | 2018-10-03 | 2022-11-16 | クリエイティクス エルエルシー | Non-invasive method to detect target molecules |
| JP7164927B2 (en) * | 2019-03-19 | 2022-11-02 | 株式会社日立製作所 | Digital PCR measuring device |
| WO2022091793A1 (en) * | 2020-10-27 | 2022-05-05 | 国立大学法人富山大学 | Development of pancreatic cancer biomarker using feces-derived protein |
| CN113866424A (en) * | 2021-09-14 | 2021-12-31 | 哈尔滨医科大学 | Application of carbonic anhydrase 1 and acid sphingomyelinase-like phosphodiesterase 3a as molecular markers in colorectal cancer diagnosis |
Citations (5)
| Publication number | Priority date | Publication date | Assignee | Title |
|---|---|---|---|---|
| US5670325A (en) | 1996-08-14 | 1997-09-23 | Exact Laboratories, Inc. | Method for the detection of clonal populations of transformed cells in a genomically heterogeneous cellular sample |
| US5741650A (en) | 1996-01-30 | 1998-04-21 | Exact Laboratories, Inc. | Methods for detecting colon cancer from stool samples |
| US5928870A (en) | 1997-06-16 | 1999-07-27 | Exact Laboratories, Inc. | Methods for the detection of loss of heterozygosity |
| US5952178A (en) | 1996-08-14 | 1999-09-14 | Exact Laboratories | Methods for disease diagnosis from stool samples |
| US6020137A (en) | 1996-08-14 | 2000-02-01 | Exact Laboratories, Inc. | Methods for the detection of loss of heterozygosity |
Family Cites Families (14)
| Publication number | Priority date | Publication date | Assignee | Title |
|---|---|---|---|---|
| US6143529A (en) * | 1996-08-14 | 2000-11-07 | Exact Laboratories, Inc. | Methods for improving sensitivity and specificity of screening assays |
| US6818404B2 (en) * | 1997-10-23 | 2004-11-16 | Exact Sciences Corporation | Methods for detecting hypermethylated nucleic acid in heterogeneous biological samples |
| US6586177B1 (en) * | 1999-09-08 | 2003-07-01 | Exact Sciences Corporation | Methods for disease detection |
| JP2003516138A (en) * | 1999-12-07 | 2003-05-13 | エグザクト サイエンシーズ コーポレイション | Detection of aerobic digestive neoplasms in the colon |
| DE10345021A1 (en) * | 2003-09-23 | 2005-05-04 | Univ Potsdam | Method for the non-invasive early detection of colon cancer and / or colon cancer precursor cells |
| WO2006094149A2 (en) | 2005-03-01 | 2006-09-08 | Exact Sciences Corporation | Methods and compositions for detecting adenoma |
| EP2386654A1 (en) * | 2005-05-02 | 2011-11-16 | University of Southern California | DNA Methylation markers associated with the CpG island methylator phenotype (cimp) in human colorectal cancer |
| US7851154B2 (en) | 2005-07-22 | 2010-12-14 | Simon Daniel Spivack | GC tag-modified bisulfite genomic DNA sequencing for continuous methylation spectra |
| BRPI0711763A2 (en) | 2006-05-19 | 2011-12-06 | Hoffmann La Roche | use of s100a12 protein as a marker for colorectal cancer |
| EP2474626B1 (en) * | 2008-02-15 | 2014-08-13 | Mayo Foundation For Medical Education And Research | Detecting neoplasm from a stool sample |
| US20130012410A1 (en) | 2010-03-29 | 2013-01-10 | Mayo Foundation For Medical Education And Research | Methods and materials for detecting colorectal cancer and adenoma |
| CN107312774A (en) | 2011-05-12 | 2017-11-03 | 精密科学公司 | The separation of nucleic acid |
| AU2013232545A1 (en) | 2012-03-15 | 2014-09-18 | Mayo Foundation For Medical Education And Research | Methods and materials for noninvasive detection of colorectal neoplasia associated with inflammatory bowel disease |
| EP3230476B1 (en) * | 2014-12-12 | 2020-02-05 | Exact Sciences Development Company, LLC | Zdhhc1 for normalizing methylation detection assays |
-
2009
- 2009-02-11 EP EP11189541.3A patent/EP2474626B1/en active Active
- 2009-02-11 ES ES11189541.3T patent/ES2522542T3/en active Active
- 2009-02-11 EP EP14176500.8A patent/EP2816122A1/en not_active Ceased
- 2009-02-11 WO PCT/US2009/033793 patent/WO2009102788A2/en active Application Filing
- 2009-02-11 US US12/866,558 patent/US8673555B2/en active Active
- 2009-02-11 EP EP09711056A patent/EP2255198A4/en not_active Withdrawn
-
2014
- 2014-01-30 US US14/168,552 patent/US9121070B2/en active Active
-
2015
- 2015-08-14 US US14/827,013 patent/US9399800B2/en active Active
-
2016
- 2016-06-29 US US15/197,105 patent/US9632093B2/en active Active
-
2017
- 2017-03-23 US US15/467,739 patent/US9803249B2/en active Active
- 2017-10-04 US US15/724,890 patent/US10590489B2/en active Active
-
2020
- 2020-01-09 US US16/738,706 patent/US11530449B2/en active Active
-
2022
- 2022-12-06 US US18/062,419 patent/US20230272482A1/en active Pending
Patent Citations (5)
| Publication number | Priority date | Publication date | Assignee | Title |
|---|---|---|---|---|
| US5741650A (en) | 1996-01-30 | 1998-04-21 | Exact Laboratories, Inc. | Methods for detecting colon cancer from stool samples |
| US5670325A (en) | 1996-08-14 | 1997-09-23 | Exact Laboratories, Inc. | Method for the detection of clonal populations of transformed cells in a genomically heterogeneous cellular sample |
| US5952178A (en) | 1996-08-14 | 1999-09-14 | Exact Laboratories | Methods for disease diagnosis from stool samples |
| US6020137A (en) | 1996-08-14 | 2000-02-01 | Exact Laboratories, Inc. | Methods for the detection of loss of heterozygosity |
| US5928870A (en) | 1997-06-16 | 1999-07-27 | Exact Laboratories, Inc. | Methods for the detection of loss of heterozygosity |
Non-Patent Citations (21)
| Title |
|---|
| AEBERSOLD; MANN, NATURE, vol. 422, 2003, pages 198 - 207 |
| AHLQUIST ET AL., GASTROENTEROLOGY, vol. 119, 2000, pages 1219 |
| AHLQUIST ET AL., GASTROENTEROLOGY, vol. 119, 2000, pages 1219 - 1227 |
| BOYNTON ET AL., CLIN'' CHEM., vol. 49, 2003, pages 1058 |
| CHA ET AL.: "Gene PCR Methods and Applications", vol. 2, 1992, COLD SPRING HARBOR LABORATORY, article "Mismatch Amplification Mutation Assay (MAMA): Application to the c-H-ras", pages: 14 - 20 |
| DAVIES, CANCER RES., vol. 65, no. 17, 2005, pages 7591 - 5 |
| GREENMAN ET AL., NATURE, vol. 446, no. 7132, 2007, pages 153 - 8 |
| KELLER ET AL., ANAL. CHEM., vol. 74, no. 20, 2002, pages 5383 - 92 |
| MCDONALD; YATES, DIS. MARKERS, vol. 18, 2002, pages 99 - 105 |
| MCINTOSH; PEPE, BIOMETRICS, vol. 58, 2002, pages 657 - 664 |
| NESVIZHSKII, ANAL. CHEM, vol. 75, no. 17, 2003, pages 4646 - 58 |
| SJOBLOM ET AL., SCIENCE, vol. 314, no. 5797, 2006, pages 268 - 74 |
| SOUSSI; LOZANO, BIOCHEM,. BIOPHYS. RES. COMMUN., vol. 331, no. 3, 2005, pages 834 - 42 |
| STEPHENS ET AL., NAT, GENET., vol. 37, no. 6, 2005, pages 590 - 2 |
| WILM ET AL., NATURE, vol. 379, 1996, pages 466 - 469 |
| WOOD ET AL., SCIENCE, vol. 318, no. 5853, 2007, pages 1108 - 13 |
| ZOU ET AL., CANCER EPIDEMIOL. BIOMARKERS PREV., vol. 15, 2006, pages 115 |
| ZOU ET AL., CANCER EPIDEMIOL. BIOMARKERS PREV., vol. 15, no. 6, 2006, pages 1115 |
| ZOU ET AL., CANCER EPIDEMIOL. BIOMARKERS PREV., vol. 16, no. 12, 2007, pages 2686 |
| ZOU ET AL., EPIDEMIOL. BIOMARKERS PREV., vol. 15, 2006, pages 1115 |
| ZOU ET AL.: "High Detection Rates of Colorectal Neoplasia by Stool DNA Testing With a Novel Digital Melt Curve Assay", GASTROENTEROLOGY, 2008 |
Cited By (1)
| Publication number | Priority date | Publication date | Assignee | Title |
|---|---|---|---|---|
| US11566284B2 (en) | 2016-08-10 | 2023-01-31 | Grail, Llc | Methods of preparing dual-indexed DNA libraries for bisulfite conversion sequencing |
Also Published As
| Publication number | Publication date |
|---|---|
| US9121070B2 (en) | 2015-09-01 |
| US20200131587A1 (en) | 2020-04-30 |
| WO2009102788A2 (en) | 2009-08-20 |
| US20170198361A1 (en) | 2017-07-13 |
| US11530449B2 (en) | 2022-12-20 |
| US9399800B2 (en) | 2016-07-26 |
| EP2474626A3 (en) | 2012-08-01 |
| US8673555B2 (en) | 2014-03-18 |
| US10590489B2 (en) | 2020-03-17 |
| ES2522542T3 (en) | 2014-11-17 |
| US9803249B2 (en) | 2017-10-31 |
| WO2009102788A3 (en) | 2009-11-12 |
| US20160305946A1 (en) | 2016-10-20 |
| US20150354013A1 (en) | 2015-12-10 |
| US20110183328A1 (en) | 2011-07-28 |
| US20140221252A1 (en) | 2014-08-07 |
| US9632093B2 (en) | 2017-04-25 |
| EP2816122A1 (en) | 2014-12-24 |
| US20230272482A1 (en) | 2023-08-31 |
| US20180105886A1 (en) | 2018-04-19 |
| EP2255198A4 (en) | 2011-05-25 |
| EP2255198A2 (en) | 2010-12-01 |
| EP2474626B1 (en) | 2014-08-13 |
Similar Documents
| Publication | Publication Date | Title |
|---|---|---|
| US11530449B2 (en) | Detecting neoplasm | |
| US11365451B2 (en) | Detecting colorectal neoplasm | |
| US11111546B2 (en) | 3.4 KB mitochondrial DNA deletion for use in the detection of cancer | |
| US20220307091A1 (en) | Unbiased dna methylation markers define an extensive field defect in histologically normal prostate tissues associated with prostate cancer: new biomarkers for men with prostate cancer | |
| US20120135877A1 (en) | DNA Methylation Markers For Prostate Cancer Field Defect | |
| US20020004206A1 (en) | Methods of screening for disease | |
| US11130998B2 (en) | Unbiased DNA methylation markers define an extensive field defect in histologically normal prostate tissues associated with prostate cancer: new biomarkers for men with prostate cancer | |
| EP2203570B1 (en) | 3.4 kb mitochondrial dna deletion for use in the detection of cancer | |
| EP2978861B1 (en) | Unbiased dna methylation markers define an extensive field defect in histologically normal prostate tissues associated with prostate cancer: new biomarkers for men with prostate cancer |
Legal Events
| Date | Code | Title | Description |
|---|---|---|---|
| PUAL | Search report despatched |
Free format text: ORIGINAL CODE: 0009013 |
|
| PUAI | Public reference made under article 153(3) epc to a published international application that has entered the european phase |
Free format text: ORIGINAL CODE: 0009012 |
|
| AC | Divisional application: reference to earlier application |
Ref document number: 2255198 Country of ref document: EP Kind code of ref document: P |
|
| AK | Designated contracting states |
Kind code of ref document: A2 Designated state(s): AT BE BG CH CY CZ DE DK EE ES FI FR GB GR HR HU IE IS IT LI LT LU LV MC MK MT NL NO PL PT RO SE SI SK TR |
|
| AX | Request for extension of the european patent |
Extension state: AL BA RS |
|
| AK | Designated contracting states |
Kind code of ref document: A3 Designated state(s): AT BE BG CH CY CZ DE DK EE ES FI FR GB GR HR HU IE IS IT LI LT LU LV MC MK MT NL NO PL PT RO SE SI SK TR |
|
| AX | Request for extension of the european patent |
Extension state: AL BA RS |
|
| RIC1 | Information provided on ipc code assigned before grant |
Ipc: G01N 33/68 20060101ALI20120625BHEP Ipc: C12Q 1/68 20060101AFI20120625BHEP Ipc: G01N 33/574 20060101ALI20120625BHEP |
|
| 17P | Request for examination filed |
Effective date: 20130123 |
|
| 17Q | First examination report despatched |
Effective date: 20130307 |
|
| R17C | First examination report despatched (corrected) |
Effective date: 20130307 |
|
| GRAP | Despatch of communication of intention to grant a patent |
Free format text: ORIGINAL CODE: EPIDOSNIGR1 |
|
| INTG | Intention to grant announced |
Effective date: 20140521 |
|
| GRAS | Grant fee paid |
Free format text: ORIGINAL CODE: EPIDOSNIGR3 |
|
| GRAA | (expected) grant |
Free format text: ORIGINAL CODE: 0009210 |
|
| AC | Divisional application: reference to earlier application |
Ref document number: 2255198 Country of ref document: EP Kind code of ref document: P |
|
| AK | Designated contracting states |
Kind code of ref document: B1 Designated state(s): AT BE BG CH CY CZ DE DK EE ES FI FR GB GR HR HU IE IS IT LI LT LU LV MC MK MT NL NO PL PT RO SE SI SK TR |
|
| REG | Reference to a national code |
Ref country code: GB Ref legal event code: FG4D |
|
| REG | Reference to a national code |
Ref country code: CH Ref legal event code: EP Ref country code: AT Ref legal event code: REF Ref document number: 682315 Country of ref document: AT Kind code of ref document: T Effective date: 20140815 |
|
| REG | Reference to a national code |
Ref country code: IE Ref legal event code: FG4D |
|
| REG | Reference to a national code |
Ref country code: DE Ref legal event code: R096 Ref document number: 602009026063 Country of ref document: DE Effective date: 20140925 |
|
| REG | Reference to a national code |
Ref country code: ES Ref legal event code: FG2A Ref document number: 2522542 Country of ref document: ES Kind code of ref document: T3 Effective date: 20141117 |
|
| REG | Reference to a national code |
Ref country code: NL Ref legal event code: VDEP Effective date: 20140813 |
|
| REG | Reference to a national code |
Ref country code: AT Ref legal event code: MK05 Ref document number: 682315 Country of ref document: AT Kind code of ref document: T Effective date: 20140813 |
|
| REG | Reference to a national code |
Ref country code: LT Ref legal event code: MG4D |
|
| PG25 | Lapsed in a contracting state [announced via postgrant information from national office to epo] |
Ref country code: GR Free format text: LAPSE BECAUSE OF FAILURE TO SUBMIT A TRANSLATION OF THE DESCRIPTION OR TO PAY THE FEE WITHIN THE PRESCRIBED TIME-LIMIT Effective date: 20141114 Ref country code: SE Free format text: LAPSE BECAUSE OF FAILURE TO SUBMIT A TRANSLATION OF THE DESCRIPTION OR TO PAY THE FEE WITHIN THE PRESCRIBED TIME-LIMIT Effective date: 20140813 Ref country code: LT Free format text: LAPSE BECAUSE OF FAILURE TO SUBMIT A TRANSLATION OF THE DESCRIPTION OR TO PAY THE FEE WITHIN THE PRESCRIBED TIME-LIMIT Effective date: 20140813 Ref country code: NO Free format text: LAPSE BECAUSE OF FAILURE TO SUBMIT A TRANSLATION OF THE DESCRIPTION OR TO PAY THE FEE WITHIN THE PRESCRIBED TIME-LIMIT Effective date: 20141113 Ref country code: FI Free format text: LAPSE BECAUSE OF FAILURE TO SUBMIT A TRANSLATION OF THE DESCRIPTION OR TO PAY THE FEE WITHIN THE PRESCRIBED TIME-LIMIT Effective date: 20140813 Ref country code: BG Free format text: LAPSE BECAUSE OF FAILURE TO SUBMIT A TRANSLATION OF THE DESCRIPTION OR TO PAY THE FEE WITHIN THE PRESCRIBED TIME-LIMIT Effective date: 20141113 Ref country code: PT Free format text: LAPSE BECAUSE OF FAILURE TO SUBMIT A TRANSLATION OF THE DESCRIPTION OR TO PAY THE FEE WITHIN THE PRESCRIBED TIME-LIMIT Effective date: 20141215 |
|
| PG25 | Lapsed in a contracting state [announced via postgrant information from national office to epo] |
Ref country code: HR Free format text: LAPSE BECAUSE OF FAILURE TO SUBMIT A TRANSLATION OF THE DESCRIPTION OR TO PAY THE FEE WITHIN THE PRESCRIBED TIME-LIMIT Effective date: 20140813 Ref country code: IS Free format text: LAPSE BECAUSE OF FAILURE TO SUBMIT A TRANSLATION OF THE DESCRIPTION OR TO PAY THE FEE WITHIN THE PRESCRIBED TIME-LIMIT Effective date: 20141213 Ref country code: LV Free format text: LAPSE BECAUSE OF FAILURE TO SUBMIT A TRANSLATION OF THE DESCRIPTION OR TO PAY THE FEE WITHIN THE PRESCRIBED TIME-LIMIT Effective date: 20140813 Ref country code: CY Free format text: LAPSE BECAUSE OF FAILURE TO SUBMIT A TRANSLATION OF THE DESCRIPTION OR TO PAY THE FEE WITHIN THE PRESCRIBED TIME-LIMIT Effective date: 20140813 Ref country code: AT Free format text: LAPSE BECAUSE OF FAILURE TO SUBMIT A TRANSLATION OF THE DESCRIPTION OR TO PAY THE FEE WITHIN THE PRESCRIBED TIME-LIMIT Effective date: 20140813 |
|
| PG25 | Lapsed in a contracting state [announced via postgrant information from national office to epo] |
Ref country code: NL Free format text: LAPSE BECAUSE OF FAILURE TO SUBMIT A TRANSLATION OF THE DESCRIPTION OR TO PAY THE FEE WITHIN THE PRESCRIBED TIME-LIMIT Effective date: 20140813 |
|
| PG25 | Lapsed in a contracting state [announced via postgrant information from national office to epo] |
Ref country code: CZ Free format text: LAPSE BECAUSE OF FAILURE TO SUBMIT A TRANSLATION OF THE DESCRIPTION OR TO PAY THE FEE WITHIN THE PRESCRIBED TIME-LIMIT Effective date: 20140813 Ref country code: SK Free format text: LAPSE BECAUSE OF FAILURE TO SUBMIT A TRANSLATION OF THE DESCRIPTION OR TO PAY THE FEE WITHIN THE PRESCRIBED TIME-LIMIT Effective date: 20140813 Ref country code: DK Free format text: LAPSE BECAUSE OF FAILURE TO SUBMIT A TRANSLATION OF THE DESCRIPTION OR TO PAY THE FEE WITHIN THE PRESCRIBED TIME-LIMIT Effective date: 20140813 Ref country code: RO Free format text: LAPSE BECAUSE OF FAILURE TO SUBMIT A TRANSLATION OF THE DESCRIPTION OR TO PAY THE FEE WITHIN THE PRESCRIBED TIME-LIMIT Effective date: 20140813 Ref country code: EE Free format text: LAPSE BECAUSE OF FAILURE TO SUBMIT A TRANSLATION OF THE DESCRIPTION OR TO PAY THE FEE WITHIN THE PRESCRIBED TIME-LIMIT Effective date: 20140813 |
|
| REG | Reference to a national code |
Ref country code: DE Ref legal event code: R097 Ref document number: 602009026063 Country of ref document: DE |
|
| PG25 | Lapsed in a contracting state [announced via postgrant information from national office to epo] |
Ref country code: PL Free format text: LAPSE BECAUSE OF FAILURE TO SUBMIT A TRANSLATION OF THE DESCRIPTION OR TO PAY THE FEE WITHIN THE PRESCRIBED TIME-LIMIT Effective date: 20140813 |
|
| PLBE | No opposition filed within time limit |
Free format text: ORIGINAL CODE: 0009261 |
|
| STAA | Information on the status of an ep patent application or granted ep patent |
Free format text: STATUS: NO OPPOSITION FILED WITHIN TIME LIMIT |
|
| PG25 | Lapsed in a contracting state [announced via postgrant information from national office to epo] |
Ref country code: BE Free format text: LAPSE BECAUSE OF NON-PAYMENT OF DUE FEES Effective date: 20150228 |
|
| 26N | No opposition filed |
Effective date: 20150515 |
|
| PG25 | Lapsed in a contracting state [announced via postgrant information from national office to epo] |
Ref country code: LU Free format text: LAPSE BECAUSE OF FAILURE TO SUBMIT A TRANSLATION OF THE DESCRIPTION OR TO PAY THE FEE WITHIN THE PRESCRIBED TIME-LIMIT Effective date: 20150211 |
|
| REG | Reference to a national code |
Ref country code: CH Ref legal event code: PL |
|
| PG25 | Lapsed in a contracting state [announced via postgrant information from national office to epo] |
Ref country code: MC Free format text: LAPSE BECAUSE OF FAILURE TO SUBMIT A TRANSLATION OF THE DESCRIPTION OR TO PAY THE FEE WITHIN THE PRESCRIBED TIME-LIMIT Effective date: 20140813 Ref country code: CH Free format text: LAPSE BECAUSE OF NON-PAYMENT OF DUE FEES Effective date: 20150228 Ref country code: LI Free format text: LAPSE BECAUSE OF NON-PAYMENT OF DUE FEES Effective date: 20150228 |
|
| PG25 | Lapsed in a contracting state [announced via postgrant information from national office to epo] |
Ref country code: SI Free format text: LAPSE BECAUSE OF FAILURE TO SUBMIT A TRANSLATION OF THE DESCRIPTION OR TO PAY THE FEE WITHIN THE PRESCRIBED TIME-LIMIT Effective date: 20140813 |
|
| REG | Reference to a national code |
Ref country code: FR Ref legal event code: PLFP Year of fee payment: 8 |
|
| PG25 | Lapsed in a contracting state [announced via postgrant information from national office to epo] |
Ref country code: BE Free format text: LAPSE BECAUSE OF FAILURE TO SUBMIT A TRANSLATION OF THE DESCRIPTION OR TO PAY THE FEE WITHIN THE PRESCRIBED TIME-LIMIT Effective date: 20140813 |
|
| PG25 | Lapsed in a contracting state [announced via postgrant information from national office to epo] |
Ref country code: MT Free format text: LAPSE BECAUSE OF FAILURE TO SUBMIT A TRANSLATION OF THE DESCRIPTION OR TO PAY THE FEE WITHIN THE PRESCRIBED TIME-LIMIT Effective date: 20140813 |
|
| REG | Reference to a national code |
Ref country code: FR Ref legal event code: PLFP Year of fee payment: 9 |
|
| PG25 | Lapsed in a contracting state [announced via postgrant information from national office to epo] |
Ref country code: HU Free format text: LAPSE BECAUSE OF FAILURE TO SUBMIT A TRANSLATION OF THE DESCRIPTION OR TO PAY THE FEE WITHIN THE PRESCRIBED TIME-LIMIT; INVALID AB INITIO Effective date: 20090211 |
|
| PG25 | Lapsed in a contracting state [announced via postgrant information from national office to epo] |
Ref country code: TR Free format text: LAPSE BECAUSE OF FAILURE TO SUBMIT A TRANSLATION OF THE DESCRIPTION OR TO PAY THE FEE WITHIN THE PRESCRIBED TIME-LIMIT Effective date: 20140813 |
|
| REG | Reference to a national code |
Ref country code: FR Ref legal event code: PLFP Year of fee payment: 10 |
|
| PG25 | Lapsed in a contracting state [announced via postgrant information from national office to epo] |
Ref country code: MK Free format text: LAPSE BECAUSE OF FAILURE TO SUBMIT A TRANSLATION OF THE DESCRIPTION OR TO PAY THE FEE WITHIN THE PRESCRIBED TIME-LIMIT Effective date: 20140813 |
|
| REG | Reference to a national code |
Ref country code: DE Ref legal event code: R082 Ref document number: 602009026063 Country of ref document: DE Representative=s name: FORRESTERS IP LLP, DE Ref country code: DE Ref legal event code: R082 Ref document number: 602009026063 Country of ref document: DE Representative=s name: KUEHR, VERA, DIPL.-BIOL., DE |
|
| PGFP | Annual fee paid to national office [announced via postgrant information from national office to epo] |
Ref country code: IE Payment date: 20230227 Year of fee payment: 15 Ref country code: FR Payment date: 20230223 Year of fee payment: 15 Ref country code: ES Payment date: 20230301 Year of fee payment: 15 |
|
| PGFP | Annual fee paid to national office [announced via postgrant information from national office to epo] |
Ref country code: IT Payment date: 20230221 Year of fee payment: 15 Ref country code: GB Payment date: 20230227 Year of fee payment: 15 Ref country code: DE Payment date: 20230223 Year of fee payment: 15 |
|
| P01 | Opt-out of the competence of the unified patent court (upc) registered |
Effective date: 20230613 |
|
| REG | Reference to a national code |
Ref country code: DE Ref legal event code: R082 Ref document number: 602009026063 Country of ref document: DE Representative=s name: FORRESTERS IP LLP, DE |