EP1750393A2 - Network communication diagnostic tool using test results of diagnostic tree - Google Patents
Network communication diagnostic tool using test results of diagnostic tree Download PDFInfo
- Publication number
- EP1750393A2 EP1750393A2 EP06114767A EP06114767A EP1750393A2 EP 1750393 A2 EP1750393 A2 EP 1750393A2 EP 06114767 A EP06114767 A EP 06114767A EP 06114767 A EP06114767 A EP 06114767A EP 1750393 A2 EP1750393 A2 EP 1750393A2
- Authority
- EP
- European Patent Office
- Prior art keywords
- node
- test
- diagnostic
- diagnostic tool
- tool according
- Prior art date
- Legal status (The legal status is an assumption and is not a legal conclusion. Google has not performed a legal analysis and makes no representation as to the accuracy of the status listed.)
- Granted
Links
- 238000012360 testing method Methods 0.000 title claims abstract description 162
- 238000004891 communication Methods 0.000 title claims description 14
- 230000006854 communication Effects 0.000 title claims description 14
- 238000004458 analytical method Methods 0.000 claims abstract description 48
- 241000282414 Homo sapiens Species 0.000 claims description 22
- 238000012545 processing Methods 0.000 claims description 16
- 230000009471 action Effects 0.000 claims description 10
- 239000003086 colorant Substances 0.000 claims description 5
- 239000003550 marker Substances 0.000 claims description 5
- 230000001419 dependent effect Effects 0.000 claims description 2
- 230000007423 decrease Effects 0.000 claims 1
- 210000004027 cell Anatomy 0.000 description 23
- 238000010200 validation analysis Methods 0.000 description 13
- 238000009432 framing Methods 0.000 description 10
- CIWBSHSKHKDKBQ-JLAZNSOCSA-N Ascorbic acid Chemical compound OC[C@H](O)[C@H]1OC(=O)C(O)=C1O CIWBSHSKHKDKBQ-JLAZNSOCSA-N 0.000 description 6
- 238000003745 diagnosis Methods 0.000 description 5
- 238000013461 design Methods 0.000 description 4
- 230000000670 limiting effect Effects 0.000 description 4
- 238000012986 modification Methods 0.000 description 4
- 230000004048 modification Effects 0.000 description 4
- 201000003231 brachydactyly type D Diseases 0.000 description 3
- 230000001413 cellular effect Effects 0.000 description 3
- 238000011161 development Methods 0.000 description 3
- 238000011144 upstream manufacturing Methods 0.000 description 3
- 238000000280 densification Methods 0.000 description 2
- 230000006870 function Effects 0.000 description 2
- 230000015654 memory Effects 0.000 description 2
- 238000005457 optimization Methods 0.000 description 2
- 210000003771 C cell Anatomy 0.000 description 1
- 230000005540 biological transmission Effects 0.000 description 1
- 230000001364 causal effect Effects 0.000 description 1
- 239000000470 constituent Substances 0.000 description 1
- 230000008878 coupling Effects 0.000 description 1
- 238000010168 coupling process Methods 0.000 description 1
- 238000005859 coupling reaction Methods 0.000 description 1
- 238000001514 detection method Methods 0.000 description 1
- 230000004069 differentiation Effects 0.000 description 1
- 230000014509 gene expression Effects 0.000 description 1
- 238000005259 measurement Methods 0.000 description 1
- 238000000034 method Methods 0.000 description 1
- 238000013456 study Methods 0.000 description 1
- 238000012546 transfer Methods 0.000 description 1
Images


Classifications
-
- H—ELECTRICITY
- H04—ELECTRIC COMMUNICATION TECHNIQUE
- H04W—WIRELESS COMMUNICATION NETWORKS
- H04W24/00—Supervisory, monitoring or testing arrangements
- H04W24/02—Arrangements for optimising operational condition
-
- H—ELECTRICITY
- H04—ELECTRIC COMMUNICATION TECHNIQUE
- H04L—TRANSMISSION OF DIGITAL INFORMATION, e.g. TELEGRAPHIC COMMUNICATION
- H04L41/00—Arrangements for maintenance, administration or management of data switching networks, e.g. of packet switching networks
- H04L41/06—Management of faults, events, alarms or notifications
- H04L41/069—Management of faults, events, alarms or notifications using logs of notifications; Post-processing of notifications
-
- H—ELECTRICITY
- H04—ELECTRIC COMMUNICATION TECHNIQUE
- H04L—TRANSMISSION OF DIGITAL INFORMATION, e.g. TELEGRAPHIC COMMUNICATION
- H04L41/00—Arrangements for maintenance, administration or management of data switching networks, e.g. of packet switching networks
- H04L41/22—Arrangements for maintenance, administration or management of data switching networks, e.g. of packet switching networks comprising specially adapted graphical user interfaces [GUI]
Abstract
Description
L'invention concerne le domaine des réseaux de communication, et plus particulièrement l'optimisation du fonctionnement et/ou de la configuration de tels réseaux.The invention relates to the field of communication networks, and more particularly to optimizing the operation and / or configuration of such networks.
Du fait des coûts de déploiement et de fonctionnement des réseaux de communication, il est dans l'intérêt des opérateurs de ces réseaux d'optimiser fréquemment leur fonctionnement et/ou leur configuration. Cela peut en effet leur permettre d'utiliser au mieux les ressources de communication de leur réseau, compte tenu, notamment, des accords de niveau de service qu'ils ont passés avec leurs clients utilisateurs, et/ou permettre la densification ou l'extension d'un réseau.Because of the costs of deployment and operation of communication networks, it is in the interest of the operators of these networks to frequently optimize their operation and / or their configuration. This can in fact enable them to make the best use of the communication resources of their network, taking into account, in particular, the service level agreements that they have made with their user customers, and / or to allow densification or extension of a network.
Pour optimiser un réseau et donc gérer l'utilisation de ses ressources, il faut disposer de données de fonctionnement et/ou de configuration du réseau, dites données d'analyse, comme par exemple des données de trafic qui définissent les trafics qui passent par les éléments de réseau, ou des paramètres de réseau, ou encore des indicateurs, par exemple de qualité de service (QoS).To optimize a network and therefore manage the use of its resources, it is necessary to have operating data and / or network configuration, called analysis data, such as traffic data that define the traffic that passes through the data. network elements, or network parameters, or indicators, for example quality of service (QoS).
Comme le sait l'homme de l'art, la gestion des paramètres (ou indicateurs) de réseau est une tâche difficile, complexe et de surcroît permanente en cas d'extension et/ou de densification du réseau. Cette gestion nécessite l'utilisation d'un système (ou outil) d'optimisation de réseau, comme par exemple celui appelé RNO® (pour « Radio Network Optimization »), développé par la société ALCATEL pour les réseaux radio cellulaires. Un tel système permet de suivre l'évolution de la qualité de service (ou QoS) au sein de certains éléments de réseau, comme par exemple des cellules, de diagnostiquer des causes de problèmes, notamment de qualité de service, et de proposer des solutions pour résoudre ces problèmes.As known to those skilled in the art, the management of network parameters (or indicators) is a difficult task, complex and moreover permanent in the event of extension and / or densification of the network. This management requires the use of a network optimization system (or tool), for example the one called RNO® (for "Radio Network Optimization"), developed by ALCATEL for cellular radio networks. Such a system makes it possible to monitor the evolution of the quality of service (or QoS) within certain network elements, for example cells, to diagnose causes of problems, in particular quality of service, and to propose solutions. to solve these problems.
Pour effectuer les diagnostics et donc déterminer les causes à l'origine d'un problème, certains outils de diagnostic, comme par exemple RNO®, utilisent des arbres de diagnostic. Il est rappelé qu'un arbre de diagnostic est une structure constituée de noeuds associés chacun à un(e) ou plusieurs tests (ou analyses) sur un réseau objet d'une étude et reliés entre eux par des branches représentatives de relations logiques entre tests, dites relations de causalité. Les feuilles (ou terminaisons) d'un arbre de diagnostic correspondent à des causes particulières de problème (causes explicatives de l'origine d'un problème), les noeuds pères de ces feuilles correspondent aux causes de ces causes particulières, et ainsi de suite jusqu'à ce que l'on atteigne le noeud racine de l'arbre qui correspond à une cause racine correspondant au problème racine à expliquer.To carry out diagnostics and therefore to identify the causes of a problem, some diagnostic tools, such as RNO®, use diagnostic trees. It is recalled that a diagnostic tree is a structure consisting of nodes each associated with one or more tests (or analyzes) on a network object of a study and interconnected by representative branches of logical relationships between tests , say relations of causality. The leaves (or endings) of a diagnostic tree correspond to particular causes of problems (causes of the origin of a problem), the fathers' knots of these leaves correspond to the causes of these particular causes, and so on until we reach the root node of the tree that corresponds to a root cause corresponding to the root problem to be explained.
Pour déterminer chaque cause particulière à l'origine d'un problème (racine), l'outil de diagnostic parcourt l'arbre de diagnostic, qui correspond à ce problème, en partant de son noeud racine et en allant vers un ou plusieurs de ses noeuds feuilles. Les résultats des tests définis en chaque noeud du parcours sont censés permettre de déterminer précisément chaque cause d'un problème, afin de pouvoir y remédier efficacement.To determine each particular root cause, the diagnostic tool traverses the diagnostic tree, which corresponds to this problem, from its root node to one or more of its root nodes. knots leaves. The results of the tests defined in each node of the course are supposed to make it possible to determine precisely each cause of a problem, in order to be able to remedy it effectively.
Ces arbres de diagnostic sont très puissants. Cependant, du fait de la grande complexité des réseaux, ils sont généralement très complexes à concevoir et à utiliser, et l'exploitation de leurs résultats est souvent difficile.These diagnostic trees are very powerful. However, because of the great complexity of the networks, they are generally very complex to design and use, and the exploitation of their results is often difficult.
Par ailleurs, les arbres de diagnostic sont rarement optimaux dès leur première utilisation dans un réseau, notamment du fait qu'il est difficile, voire impossible, actuellement de les tester lorsqu'ils sont en cours d'élaboration compte tenu du nombre de valeurs d'analyse qui doit être pris en considération. De ce fait, des experts doivent régulièrement procéder à l'optimisation des arbres de diagnostic afin d'en améliorer la précision et donc permettre des actions correctives appropriées. Ces optimisations requérant l'analyse de très nombreux rapports de diagnostic (délivrés par l'outil de diagnostic) et une connaissance poussée du fonctionnement du réseau concerné, elles peuvent être longues et donc retarder la découverte de l'origine d'un problème réseau et la mise en oeuvre de la solution correspondante.In addition, diagnostic trees are rarely optimal when first used in a network, especially since it is difficult, if not impossible, to test them when they are being developed, taking into account the number of d analysis that must be taken into consideration. As a result, experts must regularly optimize the diagnostic shafts in order to improve their accuracy and thus allow appropriate corrective actions. These optimizations require the analysis of many diagnostic reports (delivered by the diagnostic tool) and a thorough knowledge of the operation of the network concerned, they can be long and thus delay the discovery of the origin of a network problem and the implementation of the corresponding solution.
L'invention a donc pour but d'améliorer la situation, notamment dans le cas des réseaux de communication radio.The invention therefore aims to improve the situation, especially in the case of radio communication networks.
Elle propose à cet effet un outil de diagnostic, pour un réseau de communication, chargé d'analyser des données de fonctionnement et/ou de configuration du réseau, dites données d'analyse, au moyen d'arbres de diagnostic, afin de délivrer des rapports de diagnostic décrivant des causes de problème(s) au sein du réseau.It proposes for this purpose a diagnostic tool, for a communication network, responsible for analyzing operating data and / or configuration of the network, called analysis data, by means of diagnostics trees, in order to deliver data. Diagnostic reports describing causes of problem (s) within the network.
Cet outil de diagnostic se caractérise par le fait qu'il comprend :
- des moyens de traitement chargés, lorsqu'une partie au moins d'un arbre de diagnostic est utilisée pour un test, d'associer à certains au moins des noeuds et/ou liens de cette partie utilisée, des données d'information représentatives du résultat du test du noeud ou lien considéré et correspondant à des niveaux d'importance choisis, et
- des moyens d'affichage chargés d'afficher sélectivement (sur un écran) une représentation graphique des noeuds et/ou liens de la partie utilisée représentative d'une partie au moins des résultats du test effectué, fonction d'au moins un niveau d'importance choisi.
- loaded processing means, when at least a portion of a diagnostic tree is used for a test, associating with at least some of the nodes and / or links of this used part, information data representative of the result the test of the node or link considered and corresponding to selected levels of importance, and
- display means for selectively displaying (on a screen) a graphical representation of the nodes and / or links of the part used representative of at least a part of the results of the test carried out, a function of at least one level of chosen importance.
L'outil de diagnostic selon l'invention peut comporter d'autres caractéristiques qui peuvent être prises séparément ou en combinaison, et notamment :
- il peut comprendre des moyens de contrôle chargés d'effectuer des tests (de validation) dans des arbres de diagnostic en cours d'élaboration et de délivrer les résultats de ces tests aux moyens de traitement. Dans ce cas, les moyens d'affichage sont chargés d'afficher sélectivement (sur un écran) une représentation graphique des noeuds et/ou liens d'au moins une partie testée de l'arbre de diagnostic en cours d'élaboration, représentative d'une partie au moins des résultats du test effectué, fonction d'au moins un niveau d'importance choisi ;
- il peut comprendre des moyens d'interfaçage homme/machine chargés de permettre à un utilisateur de sélectionner un noeud affiché et d'afficher en retour un menu contextuel permettant d'accéder au moins à la description de ce noeud sélectionné et à des valeurs de données d'analyse utilisées lors du test pour ce noeud ;
- ➢ ses moyens d'interfaçage homme/machine peuvent être chargés de permettre l'affichage en retour (sur l'écran) d'une représentation graphique d'un noeud affiché et des noeuds qui dépendent de ce dernier, représentative d'une partie au moins des résultats du test sur ce noeud et sur les noeuds dépendant, fonction d'au moins un niveau d'importance choisi ;
- ➢ ses moyens d'interfaçage homme/machine peuvent être chargés de permettre à un utilisateur de positionner un curseur sur un noeud affiché et d'afficher en retour toutes les données d'information représentatives du résultat du test de ce noeud ;
- ➢ ses moyens d'interfaçage homme/machine peuvent être chargés de permettre à un utilisateur de sélectionner un noeud affiché d'un arbre de diagnostic en cours d'élaboration afin de placer un marqueur d'arrêt au niveau de ce noeud, puis de choisir au moins une valeur de donnée d'analyse à imposer au niveau de ce noeud sélectionné et/ou d'au moins un autre noeud de l'arbre de diagnostic auquel il appartient. Dans ce cas, les moyens de contrôle sont chargés d'effectuer un test sur au moins un noeud choisi de l'arbre de diagnostic en cours d'élaboration compte tenu des valeurs de données d'analyse imposées en chacun de ses noeuds, et de délivrer les résultats du test aux moyens de traitement afin qu'une partie au moins des résultats puissent être affichée sous la forme d'une représentation graphique (par les moyens d'affichage) ;
- • ses moyens d'interfaçage homme/machine peuvent être chargés de permettre à un utilisateur de définir certaines au moins des valeurs de données d'analyse à imposer et/ou de choisir certaines au moins des valeurs de donnée d'analyse parmi des valeurs de données d'analyse réelles stockées dans des moyens de mémorisation ;
- • ses moyens de contrôle peuvent être chargés d'effectuer un test en mode pas à pas et de communiquer les résultats de chaque pas du test aux moyens de traitement afin qu'une partie au moins des résultats de chaque pas puisse être affichée sous la forme d'une représentation graphique (par les moyens d'affichage) ;
- le niveau d'importance choisi est par exemple initialement le niveau le plus élevé ;
- ➢ la précision des données d'information peut par exemple croître lorsque le niveau d'importance correspondant décroît ;
- ➢ les données d'information correspondant au niveau d'importance le plus élevé peuvent être choisies parmi des types de noeud, des types de résultat de test au niveau d'un noeud, des types de données d'analyse testées, et des types de relation entre noeuds voisins ;
- • les différents types de noeud peuvent être choisis parmi un premier noeud, un noeud disposant d'une proposition d'action correctrice, un noeud disposant d'une proposition de test externe, un noeud dédié exclusivement au test, et un noeud lié à un autre arbre de diagnostic ;
- • les différents types de noeud peuvent être représentés par des formes géométriques différentes ;
- • les différents types de résultat de test au niveau d'un noeud peuvent être choisis parmi un test localement positif, un test localement négatif, un test localement impossible à effectuer, et un test localement non effectué ;
- • les différents types de résultat de test au niveau d'un noeud peuvent être représentés par des couleurs différentes ;
- • les différents types de données d'analyse testées peuvent être par exemple choisis parmi des données géographiques, une valeur de paramètre, une information de classe, des données de qualité de service ou de trafic, des données de topologie de réseau et des alarmes (cette liste est non exhaustive) ;
- • les différents types de données d'analyse testées peuvent être représentés par des signes (ou symboles) différents ;
- • les différents types de relation entre noeuds voisins peuvent être représentés par des types de trait différents.
- it may include control means for performing (validation) tests in diagnostic trees being developed and delivering the results of these tests to the processing means. In this case, the display means are responsible for selectively displaying (on a screen) a graphical representation of the nodes and / or links of at least one tested part of the diagnostic tree being developed, representative of at least part of the results of the test performed, based on at least one chosen importance level;
- it may comprise man / machine interfacing means for enabling a user to select a displayed node and display back a context menu allowing access to at least the description of that selected node and data values. analysis used during the test for this node;
- Its man / machine interfacing means may be responsible for allowing the display (on the screen) of a graphical representation of a displayed node and the nodes which depend on it, representative of a part of less test results on this node and on the dependent nodes, a function of at least one chosen importance level;
- Its man / machine interfacing means may be responsible for enabling a user to position a cursor on a displayed node and display in return all the information data representative of the test result of that node;
- Its man / machine interfacing means may be responsible for enabling a user to select a displayed node of a diagnostic tree being developed in order to place a stop marker at that node and then to choose at least one analysis data value to be imposed at this selected node and / or at least one other node of the diagnostic tree to which it belongs. In this case, the control means are responsible for performing a test on at least one chosen node of the diagnostic tree being developed taking into account the values of analysis data imposed in each of its nodes, and of delivering the test results to the processing means so that at least some of the results can be displayed as a graphical representation (by the display means);
- Its man / machine interfacing means may be responsible for enabling a user to define at least some of the analysis data values to be imposed and / or to select at least some of the analysis data values from among values of actual analysis data stored in memory means;
- Its control means may be responsible for performing a step-by-step test and for communicating the results of each step of the test to the processing means so that at least part of the results of each step can be displayed in the form of a representation graphic (by the display means);
- for example, the level of importance chosen is initially the highest level;
- ➢ For example, the accuracy of the information data can increase when the corresponding importance level decreases;
- The information data corresponding to the highest significance level can be selected from node types, node-level test result types, test data types tested, and relationship between neighboring nodes;
- The different types of node can be chosen from a first node, a node having a corrective action proposition, a node having an external test proposal, a node dedicated exclusively to the test, and a node linked to a node. other diagnostic tree;
- • the different types of nodes can be represented by different geometric shapes;
- The different types of test result at a node may be selected from a locally positive test, a locally negative test, a locally impossible test, and a locally not performed test;
- The different types of test result at a node can be represented by different colors;
- The different types of analysis data tested can be for example chosen from geographical data, a parameter value, class information, quality of service or traffic data, network topology data and alarms ( This list is not exhaustive) ;
- • the different types of analysis data tested may be represented by different signs (or symbols);
- • Different types of relationship between neighboring nodes can be represented by different line types.
L'invention est particulièrement bien adaptée, bien que de façon non exclusive, aux réseaux de communication radio, notamment de type cellulaire (ou mobile), quel que soit leur standard (par exemple GSM, GPRS, EDGE, UMTS, WiMax ou multi-standards). Elle concerne d'une manière générale tout type de réseau de communication, y compris les réseaux fixes commutés (plus connus sous les acronymes anglais POTS (pour « Plain Old Telephone Service ») et PSTN (pour « Public Switched Telephony Network »)), ainsi que les réseaux locaux filaires (plus connus sous l'acronyme anglais LAN (pour « Local Area Network »)) ou sans fil (plus connus sous l'acronyme anglais WLAN (pour « Wireless LAN »)).The invention is particularly well adapted, although in a non exclusive, radio communication networks, including cell type (or mobile), regardless of their standard (eg GSM, GPRS, EDGE, UMTS, WiMax or multi-standard). It generally relates to any type of communication network, including switched fixed networks (better known as POTS (for "Plain Old Telephone Service") and PSTN (for "Public Switched Telephony Network")), as well as wired local area networks (better known by the acronym LAN (for "Local Area Network")) or wireless (better known by the acronym WLAN (for "Wireless LAN")).
D'autres caractéristiques et avantages de l'invention apparaîtront à l'examen de la description détaillée ci-après, et des dessins annexés, sur lesquels :
- la figure 1 illustre de façon schématique et fonctionnelle une partie d'un réseau de communication équipé d'un outil de diagnostic selon l'invention, implanté dans un système de gestion de réseau,
- la figure 2 illustre de façon schématique une partie d'un exemple de représentation graphique de résultats de premier niveau d'un test effectué sur un réseau avec un arbre de diagnostic, ainsi qu'un exemple de légende définissant les conventions utilisées pour élaborer les représentations graphiques ; la représentation utilise des symboles (et signes) destinés à fournir des informations explicites immédiatement accessibles,
- la figure 3 illustre de façon schématique un exemple de représentation graphique d'un menu contextuel associé au noeud « Drop BSS » de la figure 2, et un exemple de représentation graphique d'un tableau d'information correspondant à l'option « Information noeud » de ce menu contextuel,
- la figure 4 illustre de façon schématique un exemple de représentation graphique des résultats de deuxième niveau du test, relatifs au noeud « Drop BSS » de la figure 2,
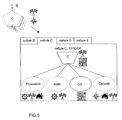
- la figure 5 illustre de façon schématique un exemple de représentation graphique d'un menu contextuel associé à l'un des noeuds, d'un groupe de noeuds dont l'un s'appelle « C » (pour couverture ou « coverage »), de la figure 2 ; la représentation montre le noeud C pour différentes cellules auxquelles le test « noeud C » est appliqué,
- la figure 6 illustre de façon schématique un exemple de représentation graphique de résultats de premier niveau d'un test de validation appliqué à un noeud (« C ») d'une partie d'un arbre de diagnostic en cours d'élaboration,
- la figure 7 illustre de façon schématique deux exemples de représentation graphique des résultats de deuxième niveau d'un test de validation appliqué au noeud « Drop BSS » de la figure 6, pour deux valeurs différentes de l'indicateur « call drop BSS rate » (0,8% et 3%) ; ces deux exemples montrent la modification de la valeur d'un indicateur (ici « call drop BSS rate ») sur un test d'un noeud (ici « Drop BSS »), et l'influence de cette modification,
- la figure 8 illustre de façon schématique un exemple de représentation graphique d'un menu contextuel associé au noeud « Drop BSS » de la figure 6, et
- la figure 9 illustre de façon schématique un exemple de représentation graphique de résultats de premier niveau d'un test de validation, effectué en mode pas à pas, avec la partie d'arbre de diagnostic en cours d'élaboration illustrée sur la figure 6.
- FIG. 1 schematically and functionally illustrates a portion of a communication network equipped with a diagnostic tool according to the invention, installed in a network management system,
- FIG. 2 schematically illustrates a portion of an exemplary graphical representation of first-level results of a test performed on a network with a diagnostic tree, and an example of a legend defining the conventions used to elaborate the representations. graphics; the representation uses symbols (and signs) intended to provide explicit information immediately accessible,
- FIG. 3 schematically illustrates an exemplary graphical representation of a contextual menu associated with the "Drop BSS" node of FIG. 2, and an example of a graphical representation of an information table corresponding to the "Information node" option. From this contextual menu,
- FIG. 4 schematically illustrates an exemplary graphical representation of the second level test results relating to the "Drop BSS" node of FIG. 2,
- FIG. 5 schematically illustrates an example of graphical representation of a contextual menu associated with one of the nodes, of a group of nodes, one of which is called "C" (for coverage or "coverage"), of Figure 2; the representation shows the C node for different cells to which the "C-node" test is applied,
- FIG. 6 schematically illustrates an exemplary graphical representation of first-level results of a validation test applied to a node ("C") of a part of a diagnostic tree being developed,
- FIG. 7 schematically illustrates two examples of graphical representation of the second level results of a validation test applied to the "Drop BSS" node of FIG. 6, for two different values of the "call drop BSS rate" indicator ( 0.8% and 3%); these two examples show the modification of the value of an indicator (here "call drop BSS rate") on a test of a node (here "Drop BSS"), and the influence of this modification,
- FIG. 8 schematically illustrates an exemplary graphical representation of a contextual menu associated with the "Drop BSS" node of FIG. 6, and
- FIG. 9 schematically illustrates an exemplary graphical representation of first-level results of a validation test, performed in step-by-step fashion, with the diagnostic tree part being developed illustrated in FIG. 6.
Les dessins annexés pourront non seulement servir à compléter l'invention, mais aussi contribuer à sa définition, le cas échéant.The attached drawings may not only serve to complete the invention, but also contribute to its definition, if any.
L'invention a pour objet de permettre la simplification de l'utilisation et de l'exploitation des résultats des arbres de diagnostic des outils de diagnostic de réseau de communication, ainsi qu'éventuellement la simplification de la conception de ces arbres de diagnostic.The object of the invention is to simplify the use and the exploitation of the results of the diagnostics trees of the communication network diagnostic tools, as well as possibly the simplification of the design of these diagnostic shafts.
Dans ce qui suit, on considère à titre d'exemple non limitatif que le réseau de communication est un réseau radio cellulaire (ou mobile), comme par exemple un réseau GSM, ou GPRS/EDGE, ou UMTS, ou WiMax, ou encore un réseau multi-standards. Par conséquent, les ressources sont ici des canaux radio. Mais, l'invention est adaptée à tout type de réseau de communication, et notamment aux réseaux fixes commutés (POTS ou PSTN), aux réseaux locaux filaires (LAN) ou sans fil (WLAN).In the following, we consider as a non-limiting example that the communication network is a cellular (or mobile) radio network, such as for example a GSM network, or GPRS / EDGE, or UMTS, or WiMax, or a multi-standard network. Therefore, the resources here are radio channels. However, the invention is suitable for any type of communication network, and in particular for switched fixed networks (POTS or PSTN), wired local area networks (LAN) or wireless LAN (WLAN).
Il est rappelé qu'un réseau radio cellulaire RC peut être schématiquement résumé à un réseau de commutation (ou « Core Network ») couplé à un réseau d'accès radio (appelé UTRAN dans le cas d'un réseau UMTS et BSS dans le cas d'un réseau GSM), lui-même raccordé à un système de gestion de réseau NMS (pour « Network Management System »). Le réseau d'accès radio comporte des stations de base (appelées Node Bs dans le cas d'un réseau UMTS et BTSs dans le cas d'un réseau GSM) et des contrôleurs de réseau radio (appelés RNCs dans le cas d'un réseau UMTS et BSCs dans le cas d'un réseau GSM), raccordés entre eux ainsi qu'à un gestionnaire de réseau d'accès.It is recalled that a cellular radio network RC can be schematically summarized to a switching network (or "Core Network") coupled to a radio access network (called UTRAN in the case of a UMTS and BSS network in the case a GSM network), itself connected to a network management system NMS (for "Network Management System"). The radio access network comprises base stations (called Node Bs in the case of a UMTS network and BTSs in the case of a GSM network) and radio network controllers (called RNCs in the case of a network UMTS and BSCs in the case of a GSM network), connected together and to an access network manager.
On considère également dans ce qui suit, à titre d'exemple non limitatif, que l'outil de diagnostic est dédié à la qualité de service, et que de ce fait il dispose d'arbres de diagnostic associés chacun à un type de problème de qualité de service (ou QoS). Mais, l'invention n'est pas limitée à ce seul type de diagnostic. Elle concerne en effet tous les types de diagnostic pouvant être effectués au sein d'un réseau, et notamment les diagnostics relatifs au service (comme par exemple la qualité de service ou QoS) et les diagnostics relatifs à l'infrastructure du réseau (comme par exemple la connectivité entre cellules d'un réseau GSM (gestion des « handovers » - transferts entre cellules)).The following is also considered as a non-limiting example, that the diagnostic tool is dedicated to the quality of service, and that it therefore has diagnostic shafts each associated with a type of problem. quality of service (or QoS). But, the invention is not limited to this type of diagnosis alone. It concerns all types of diagnostics that can be performed within a network, including service-related diagnostics (such as quality of service or QoS) and network infrastructure diagnostics (such as example the connectivity between cells of a GSM network (management of "handovers" - transfers between cells).
On a schématiquement représenté sur la figure 1 un outil de diagnostic OD. Un tel outil OD comprend généralement une base de données de diagnostic BDD, dans laquelle se trouvent stockées des données définissant des arbres de diagnostic, et un module (ou moteur) de diagnostic MD, chargé d'analyser au moyen des arbres de diagnostic les données de fonctionnement et/ou de configuration du réseau RC, dites données d'analyse, afin de délivrer des rapports de diagnostic qui décrivent des causes de problème(s) survenu(s) dans le réseau RC.FIG. 1 diagrammatically shows an OD diagnostic tool. Such an OD tool generally comprises a diagnostic database BDD, in which are stored data defining diagnostics shafts, and a diagnostic module (or engine) MD, responsible for analyzing by means of the diagnostics trees the data operation and / or configuration of the RC network, called analysis data, in order to deliver diagnostic reports that describe causes of problem (s) occurred in the RC network.
On entend ici par « données d'analyse » des données de trafic, ou des paramètres de réseau, ou encore des indicateurs, par exemple de qualité de service (QoS). Par ailleurs, on entend ici par « données de trafic » des valeurs de paramètre(s) ou d'indicateur(s) pouvant être mesurées ou estimées par le système de gestion de réseau NMS. En outre, on entend ici par « élément de réseau » tout constituant (physique et/ou logique) d'un réseau par lequel passent des trafics définis localement par des valeurs de paramètre(s) ou d'indicateur(s). Il pourra donc s'agir, par exemple, d'une cellule dans laquelle des terminaux mobiles peuvent établir ou poursuivre des communications, ou d'un équipement de réseau, tel qu'un routeur, une station de base (Node B ou BTS), ou un contrôleur de réseau radio (RNC ou BSC).Here, the term "analysis data" means traffic data, or network parameters, or indicators, for example quality of service (QoS). Furthermore, "traffic data" here means parameter (s) or indicator (s) values that can be measured or estimated by the network management system NMS. In addition, here we mean "element of network "any constituent (physical and / or logical) of a network through which pass traffic locally defined by parameter (s) or indicator (s). It may therefore be, for example, a cell in which mobile terminals can establish or continue communications, or network equipment, such as a router, a base station (Node B or BTS) , or a radio network controller (RNC or BSC).
Comme indiqué dans la partie introductive, un arbre de diagnostic comprend des noeuds qui sont chacun associés à un ou plusieurs tests de réseau et qui sont reliés entre eux (selon une relation de dépendance « père-fils ») par des branches qui représentent des relations logiques entre tests (ou relations de causalité). Les tests sont destinés à analyser les données d'analyse. Ces dernières peuvent être agrégées pour un équipement de réseau ou pour un ensemble d'équipements de réseau. Les noeuds feuilles (ou terminaisons) d'un arbre de diagnostic correspondent à différentes causes possibles d'un problème (racine) donné de fonctionnement ou de configuration du réseau RC. Les noeuds pères des noeuds feuilles correspondent aux causes de leurs causes, et ainsi de suite jusqu'à ce que l'on atteigne le noeud racine de l'arbre de diagnostic qui correspond à une cause racine qui est l'expression d'un problème (racine) donné.As mentioned in the introductory part, a diagnostic tree includes nodes that are each associated with one or more network tests and are interconnected (in a "father-son" dependency relationship) by branches that represent relationships. between tests (or causal relationships). The tests are intended to analyze the analysis data. These can be aggregated for network equipment or for a set of network equipment. The leaf nodes (or terminations) of a diagnostic tree correspond to different possible causes of a given (root) problem of RC network operation or configuration. The fathers nodes of the leaf nodes correspond to the causes of their causes, and so on until one reaches the root node of the diagnostic tree which corresponds to a root cause which is the expression of a problem (root) given.
Les données définissant les arbres de diagnostic sont généralement fournies à la base de données de diagnostic BDD par un expert ED. Par ailleurs, les données d'analyse du réseau RC sont généralement stockées dans une base de données d'analyse BDA du NMS.The data defining the diagnostic trees is generally provided to the BDD diagnostic database by an ED expert. Furthermore, the analysis data of the RC network is generally stored in a NMS BDA analysis database.
Les données définissant les résultats des tests effectués par le moteur de diagnostic MD sont généralement stockées dans une base de données de résultat BDR.The data defining the results of the tests performed by the diagnostics engine MD are usually stored in a result database BDR.
Dans l'exemple de réalisation illustré, non limitatif, l'outil de diagnostic OD est intégré dans un système (ou outil) d'optimisation et/ou de gestion et/ou de supervision de réseau OO, comme par exemple le système RNO® présenté dans la partie introductive, lui-même implanté dans le NMS du réseau RC. Mais, cela n'est pas une obligation.In the exemplary embodiment, which is not limiting, the diagnostic tool OD is integrated in a system (or tool) for optimizing and / or managing and / or supervising the OO network, such as for example the RNO® system. introduced in the introductory part, itself implanted in the NMS of the RC network. But, this is not an obligation.
Selon l'invention, l'outil de diagnostic OD comprend également au moins un module de traitement MT couplé à un module d'affichage MA.According to the invention, the diagnostic tool OD also comprises least one MT processing module coupled to a display module MA.
Le module de traitement MT est chargé, chaque fois que le moteur de diagnostic MD a utilisé une partie au moins d'un arbre de diagnostic pour effectuer un test sur des données d'analyse du réseau RC, d'associer à certains au moins des noeuds et/ou liens de cette partie d'arbre utilisée, des données d'information qui représentent le résultat du test de chaque noeud ou lien considéré et qui correspondent à des niveaux d'importance choisis.The processing module MT is loaded, whenever the diagnostic motor MD has used at least a part of a diagnostic tree to test the analysis data of the network RC, to associate with at least some of the nodes and / or links of this part of the tree used, information data which represents the result of the test of each node or link considered and which correspond to selected levels of importance.
Par exemple, la précision des données d'information qui sont associées à un noeud ou un lien croît lorsque le niveau d'importance correspondant décroît. En d'autres termes, les informations du niveau le plus élevé sont celles qui sont les plus générales (et donc les plus représentatives d'un résultat), les autres informations (de niveaux d'importance inférieurs ou plus détaillés et plus rarement utilisés) ne venant que détailler ou préciser celles du niveau d'importance le plus élevé.For example, the accuracy of the information data that is associated with a node or link increases as the corresponding importance level decreases. In other words, the information of the highest level is the most general (and therefore the most representative of a result), the other information (of lower or more detailed levels of importance and more rarely used) just detailing or specifying those of the highest importance level.
A titre d'exemple non limitatif, les données d'information qui correspondent au niveau d'importance le plus élevé peuvent être le type de noeud, le type de résultat de test au niveau d'un noeud, le type de données d'analyse testées, et/ou le type de relation entre noeuds voisins.By way of nonlimiting example, the information data that corresponds to the highest level of importance can be the type of node, the type of test result at a node, the type of analysis data. tested, and / or the type of relationship between neighboring nodes.
Le module de traitement MT associe donc des identifiants de niveau d'importance aux différentes données d'information (ou données de résultat) qui proviennent d'un test effectué. Les données d'information et les identifiants de niveau d'importance associés sont ensuite stockés dans la base de données de résultat BDR en correspondance des identifiants des noeuds correspondants.The processing module MT therefore associates level of importance identifiers with the different information data (or result data) that come from a test performed. The information data and the associated importance level identifiers are then stored in the result database BDR in correspondence of the identifiers of the corresponding nodes.
Comme cela est illustré sur la figure 1, le module de traitement MT est par exemple implanté dans le moteur de diagnostic MD.As illustrated in FIG. 1, the processing module MT is for example implanted in the diagnostic motor MD.
Le module d'affichage MA est chargé d'afficher sélectivement une représentation graphique des noeuds et/ou liens de la partie d'arbre utilisée, laquelle représente une partie au moins des résultats du test effectué, choisie en fonction d'au moins un niveau d'importance. Il comprend à cet effet un écran ou tout autre moyen d'affichage.The display module MA is responsible for selectively displaying a graphical representation of the nodes and / or links of the part of the tree used, which represents at least a part of the results of the test carried out, chosen according to at least one level. important. It includes for this purpose a screen or any other means of display.
L'utilisateur peut choisir le (ou les) niveau(x) d'importance des données d'information qu'il souhaite utiliser pour chacune des représentations graphiques qu'il souhaite visualiser sur son écran. Mais, on peut également envisager que la première représentation graphique soit automatiquement constituée à partir des données d'information correspondant au niveau le plus élevé, puis que l'utilisateur décide du niveau d'importance des données d'information qu'il souhaite utiliser dynamiquement pour les représentations graphiques suivantes.The user can choose the level (s) of data importance information he wishes to use for each of the graphic representations he wishes to display on his screen. However, it is also conceivable that the first graphic representation is automatically constituted from the information data corresponding to the highest level, and that the user decides on the level of importance of the information data that he wishes to use dynamically. for the following graphical representations.
Préférentiellement et comme illustré sur la figure 1, l'outil de diagnostic OD comporte une interface homme/machine IHM couplant le moteur de diagnostic MD (et donc le module de traitement MT) au module d'affichage MA. Cette interface homme/machine IHM comporte par exemple un clavier de saisie et une souris et/ou un écran tactile. Elle est notamment destinée à permettre à l'utilisateur de choisir un ou plusieurs niveaux d'importance, et, comme on le verra plus loin, de sélectionner des noeuds et/ou liens et des options au sein de menus contextuels.Preferably and as illustrated in FIG. 1, the diagnostic tool OD comprises a human / machine interface HMI coupling the diagnostic motor MD (and therefore the processing module MT) to the display module MA. This human / machine interface HMI comprises for example an input keyboard and a mouse and / or a touch screen. It is intended in particular to allow the user to choose one or more levels of importance, and, as will be seen later, to select nodes and / or links and options within context menus.
On a schématiquement représenté sur la figure 2 un exemple de représentation graphique de résultats de premier niveau (le plus élevé) d'un test effectué sur un réseau RC avec un arbre de diagnostic. Ici, seule une petite partie de l'arbre est représentée. La légende qui est placée en-dessous de l'arbre définit un exemple de convention utilisée pour élaborer la représentation graphique de la figure 2, ainsi que toutes celles illustrées sur les figures 3 à 9.FIG. 2 schematically shows an exemplary graphical representation of first level (highest) results of a test performed on an RC network with a diagnostic tree. Here, only a small part of the tree is represented. The legend that is placed below the tree defines an example convention used to develop the graphical representation of Figure 2, as well as all those illustrated in Figures 3 to 9.
Selon cet exemple de convention :
- les noeuds sont matérialisés par des formes géométriques qui différent selon leurs types respectifs. Par exemple, le premier noeud d'une représentation graphique est représenté par un trapèze « inversé », un noeud pour lequel a été déterminée une proposition d'action correctrice est représenté par une ellipse, un noeud pour lequel existe une proposition de test externe est représenté par un hexagone, un noeud dédié exclusivement au test est représenté par un losange, et un noeud lié à un autre arbre de diagnostic que celui affiché est représenté par un pentagone. On entend ici par « test externe » un test qui est externe au diagnostic, comme par exemple une mesure radio sur le terrain ;
- en plus de leur forme fonction de leur type, et bien entendu de leur nom, les noeuds peuvent être différenciés par le type de résultat du test qui a été effectué avec chacun d'entre eux. Par exemple, les différents types de résultat de test peuvent correspondre à des couleurs différentes, ou bien comme illustré par des types différents de ligne d'encadrement de forme géométrique. Ainsi dans l'exemple illustré un test localement positif (réussi) au niveau d'un noeud est signalé par une ligne d'encadrement fine, un test localement négatif est signalé par une ligne d'encadrement en pointillés, un test qu'il a été impossible d'effectuer localement au niveau d'un noeud (par manque de données) est signalé par une ligne d'encadrement double, et un test qui n'a pas été effectué localement au niveau d'un noeud est signalé par une ligne d'encadrement épaisse. Au lieu de lignes de types différents on peut utiliser des couleurs différentes ;
- les données d'analyse qui sont testées par un noeud sont matérialisées par des signes (ou symboles) différents qui différent selon leurs types respectifs. Par exemple, des données géographiques sont signalées par un symbole de type « boussole » (voir figure 2), une valeur de paramètre est signalée par un symbole de type « barre de bateau » (voir figure 2), une information de classe est signalée par un symbole de type « toit de maison » (voir figure 2), une alarme de qualité de service est signalée par un symbole de type « boulet allumé» (voir figure 2), et des données de qualité de service (QoS) sont signalées par un symbole de type « drapeaux croisés » (voir figure 2). Un ou plusieurs signes (ou symboles) différents peuvent être associés à un même noeud ;
- les relations entre noeuds voisins sont matérialisées par des traits qui différent selon leurs types respectifs. Par exemple, la liaison entre deux noeuds voisins portant sur un même objet peut être matérialisée par un trait continu simple, la liaison entre deux noeuds voisins portant sur des objets différents ou sur un même type d'objet peut être matérialisée par un trait en pointillés, et la liaison entre deux noeuds voisins portant sur des objets de types différents peut être matérialisée par un trait discontinu. On entend ici par « objet » tout élément de réseau ou de topologie de réseau (par exemple un Node B, une BTS, une cellule ou une adjacence). Une mauvaise qualité sur un élément de réseau peut être provoquée par un problème survenu au niveau d'un autre élément de ce réseau, du même type ou d'un type différent (par exemple, de fortes interférences au sein d'une cellule objet d'un fort trafic va reporter une partie du trafic vers des cellules voisines et peut provoquer la congestion de ces cellules voisines, ou bien un problème de codage/décodage au niveau d'un BSC peut amplifier un problème d'interférence au niveau des cellules contrôlées par ce BSC).
- the nodes are materialized by geometric shapes that differ according to their respective types. For example, the first node of a graphical representation is represented by an "inverted" trapezoid, a node for which a corrective action proposition has been determined is represented by an ellipse, a node for which there exists an external test proposition is represented by a hexagon, a node dedicated exclusively to the test is represented by a rhombus, and a node linked to another diagnostic tree than that displayed is represented by a pentagon. By "external test" is meant here a test that is external to the diagnosis, such as for example a radio measurement in the field;
- in addition to their form depending on their type, and of course their name, the nodes can be differentiated by the type of test result that has been performed with each of them. For example, the different types of test result may correspond to different colors, or as illustrated by different types of geometrically shaped framing lines. Thus in the illustrated example a locally positive (successful) test at a node is signaled by a fine framing line, a locally negative test is signaled by a dashed framing line, a test that it has was not possible to perform locally at a node (due to lack of data) is indicated by a double framing line, and a test that was not performed locally at a node is indicated by a line thick framing. Instead of lines of different types we can use different colors;
- the analysis data that is tested by one node is materialized by different signs (or symbols) which differ according to their respective types. For example, geographical data is indicated by a "compass" type symbol (see Figure 2), a parameter value is indicated by a "boat bar" type symbol (see figure 2), class information is signaled by a house-roof symbol (see Figure 2), a service quality alarm is indicated by a ball-type symbol (see Figure 2), and quality of service (QoS) data are marked with a cross-flags symbol (see Figure 2). One or more different signs (or symbols) can be associated with the same node;
- the relations between neighboring nodes are materialized by features that differ according to their respective types. For example, the link between two neighboring nodes on the same object can be materialized by a single continuous line, the connection between two neighboring nodes on different objects or on the same type of object can be materialized by a dashed line , and the connection between two neighboring nodes on objects of different types can be materialized by a broken line. By "object" is meant here any network element or network topology (for example a Node B, a BTS, a cell or an adjacency). Poor quality on one network element may be caused by a problem with another element of that network, of the same type or of a different type (for example, strong interference within an object cell). high traffic will carry some of the traffic back to neighboring cells and may cause congestion of these neighboring cells, or a coding / decoding problem at a BSC may magnify an interference problem at the controlled cell level by this BSC).
Bien entendu, il ne s'agit ici que d'exemples non limitatifs de formes, traits, couleurs et symboles (ou signes) parmi de très nombreux autres exemples. D'une manière générale tout type de codification de nature à permettre la différenciation des types de données d'information résultant des tests peut être envisagé.Of course, these are only non-limiting examples of shapes, lines, colors and symbols (or signs) among many other examples. In general any type of codification likely to allow the differentiation of the types of information data resulting from the tests can be envisaged.
Il est important de noter que sur les différentes figures les symboles ont été placés à côté des noeuds, mais ils peuvent être également placés à l'intérieur desdits noeuds.It is important to note that in the different figures the symbols have been placed next to the nodes, but they can also be placed inside said nodes.
La portion d'arbre de diagnostic illustrée sur la figure 2 est destinée à déterminer l'origine d'interruptions d'appels survenues au niveau d'une cellule A, le 12/10/04. Il s'agit d'un exemple d'analyse de problèmes avec un exemple de causes possibles testées. Selon les conventions précitées, la portion d'arbre de diagnostic illustrée sur la figure 2 comprend :
- un premier noeud appelé « Call drop », dédié aux interruptions d'appels, pour lequel le test a été positif, et pour lequel on dispose de données d'information de type données de qualité de service (QoS), alarmes, données géographiques et paramètres,
- un noeud appelé « Drop BSS », correspondant à des interruptions d'appels dues au réseau d'accès radio BSS, pour lequel le test a été positif, et pour lequel on dispose de données d'information de type données de qualité de service (QoS), alarmes, données géographiques et paramètres. Ce noeud est lié au premier noeud « Call drop » par un trait continu simple indiquant que ces deux noeuds portent sur un même objet,
- un noeud appelé « Link fail », correspondant à des échecs de liaison, pour lequel le test a été négatif, et pour lequel on dispose de données d'information de type alarmes et données géographiques. Ce noeud est lié au noeud « Drop BSS » par un trait continu simple indiquant que ces deux noeuds portent sur un même objet,
- un noeud appelé « MSC pb », correspondant à des problèmes au niveau d'un centre de gestion d'appels (ou MSC), et qu'il n'a pas été possible d'appliquer. Ce noeud est lié au noeud « Drop BSS » par un trait continu simple indiquant que ces deux noeuds portent sur un même objet,
- un noeud appelé « Drop TC », correspondant à des interruption liées au transcodage mis en oeuvre dans les contrôleurs de réseau radio (RNC ou BSC), pour lequel le test a été positif, et pour lequel on dispose de données d'information de type alarmes. Ce noeud est lié au noeud « Drop BSS » par un trait en pointillés indiquant que ces deux noeuds portent sur des objets différents ou des objets de même type,
- un noeud appelé « Drop HO », correspondant à des interruptions d'appels dues à des procédures de transfert entre cellules (ou « handover »), pour lequel le test a été négatif, et pour lequel on dispose de données d'information de type alarmes. Ce noeud est lié au premier noeud « Call drop » par un trait continu simple indiquant que ces deux noeuds portent sur un même objet,
- un groupe de noeuds « C » (pour couverture ou « coverage »), correspondant à des problèmes de continuité radio liés à la couverture des cellules, pour trois desquels le test a été négatif et pour un quatrième positif, et pour lequel on dispose de données d'information de type alarmes. Ce groupe de noeuds est lié au noeud « Drop HO » par un trait discontinu indiquant qu'ils portent sur des objets de types différents.
- a first node called "call drop", dedicated to call interruptions, for which the test was positive, and for which we have information data type data quality of service (QoS), alarms, geographic data and settings,
- a node called "Drop BSS", corresponding to call interruptions due to the BSS radio access network, for which the test was positive, and for which information data of the quality of service data type are available ( QoS), alarms, geographic data and settings. This node is linked to the first node "Call drop" by a simple solid line indicating that these two nodes relate to the same object,
- a node called "Link fail", corresponding to link failures, for which the test was negative, and for which information data of the type alarms and geographical data are available. This node is linked to the node "Drop BSS" by a simple solid line indicating that these two nodes relate to the same object,
- a node called "MSC pb", corresponding to problems at a call management center (or MSC), and it was not possible to apply. This node is linked to the node "Drop BSS" by a simple solid line indicating that these two nodes relate to the same object,
- a node called "Drop TC", corresponding to transcoding-related interrupts implemented in the radio network controllers (RNC or BSC), for which the test was positive, and for which information data of type alarms. This node is linked to the node "Drop BSS" by a dashed line indicating that these two nodes relate to different objects or objects of the same type,
- a node called "Drop HO", corresponding to call interruptions due to inter-cell transfer procedures (or "handover"), for which the test was negative, and for which there is available information data of type alarms. This node is linked to the first node "Call drop" by a simple solid line indicating that these two nodes relate to the same object,
- a group of "C" nodes (for coverage or "coverage"), corresponding to radio continuity problems related to the coverage of the cells, for which three of them the test was negative and for a fourth positive, and for which one has alarm type information data. This group of nodes is linked to the node "Drop HO" by a broken line indicating that they relate to objects of different types.
Grâce à l'interface homme/machine IHM l'utilisateur peut accéder à toutes les données d'information de l'un au moins des noeuds affichés sur l'écran, ainsi qu'aux données qui le(s) décrivent complètement. Cette accession peut par exemple se faire en sélectionnant un noeud affiché sur l'écran en positionnant le curseur de la souris sur lui, et éventuellement en « cliquant » avec l'un des deux actionneurs (ou « clics ») de cette souris.Thanks to the HMI man / machine interface the user can access all the information data of at least one of the nodes displayed on the screen, as well as the data which describe it (s) completely. This accession can for example be done by selecting a node displayed on the screen by positioning the mouse cursor on it, and optionally by "clicking" with one of the two actuators (or "clicks") of this mouse.
Comme cela est illustré sur la figure 3, la sélection d'un noeud (ici « Drop BSS »), en cliquant à son niveau au moyen de la souris, peut entraîner l'affichage sur l'écran de ce seul noeud et par exemple l'apparition à côté de ce noeud d'un menu contextuel offrant une ou plusieurs options. Par exemple en sélectionnant l'option « noeud information » du menu on provoque l'affichage sur l'écran d'une page comportant des champs (rectangles gris) décrivant complètement le noeud.As illustrated in FIG. 3, the selection of a node (here "Drop BSS"), by clicking at its level by means of the mouse, can cause the display of this single node on the screen and, for example, the appearance next to this node of a contextual menu offering one or more options. For example by selecting the option "information node" of the menu it causes the display on the screen of a page with fields (gray rectangles) describing the node completely.
Les données qui sont ici affichées ne sont pas obligatoirement des données d'information associées au noeud concerné par le module de traitement MT consécutivement à l'application du (ou des) test(s) de ce noeud, et donc représentatives du résultat du (des) test(s). Il peut s'agir d'informations complémentaires.The data that are displayed here are not necessarily information data associated with the node concerned by the processing module MT following application of the test (s) of this node, and therefore representative of the result of the tests). This may be additional information.
Pour permettre cet affichage, l'interface homme/machine IHM accède à la base de données de résultat BDR ou bien à la base de données de diagnostic BDD afin d'extraire les données requises (sélectionnées) qui sont stockées en correspondance de l'identifiant du noeud sélectionné.To enable this display, the HMI man / machine interface accesses the BDR result database or the BDD diagnostic database in order to extract the required (selected) data that is stored in correspondence with the identifier. of the selected node.
Comme cela est illustré sur la figure 4, la sélection d'un noeud (ici « Drop BSS »), en positionnant dessus le curseur de la souris, peut entraîner l'affichage sur l'écran à côté de ce noeud de fenêtres contenant les données d'information de (second) niveau d'importance inférieur au niveau le plus élevé. L'utilisateur dispose alors sur son écran de toutes les données d'information obtenues consécutivement à l'application d'un test sur un noeud sélectionné.As shown in Figure 4, the selection of a node (here "Drop BSS"), by positioning over the mouse cursor, can cause the display on the screen next to this node windows containing the information data of (second) level of importance lower than the highest level. The user then has on his screen all the information data obtained following the application of a test on a selected node.
Dans l'exemple illustré sur la figure 4, la fenêtre mentionne i) le nom du noeud sélectionné (« Drop BSS »), ii) la cellule dans laquelle sont survenues les interruptions d'appel (ici la cellule A) et la date à laquelle sont survenues ces interruptions d'appel (ici le 12/10/04), iii) l'indicateur (ou paramètre) analysé (donnée d'analyse), ici le taux d'interruption d'appel dû au BSS - ou « call drop BSS rate ») et la valeur de cet indicateur (ici égale à 6%), iv) la conclusion sur l'origine du problème (ici le BSS est considéré comme responsable du problème), et v) une proposition d'action pour résoudre le problème (ici on propose de contrôler la disponibilité des contrôleurs de réseau radio BSC).In the example illustrated in FIG. 4, the window mentions i) the name of the selected node ("Drop BSS"), ii) the cell in which the call interrupts occurred (here cell A) and the date on which which occurred these call interrupts (here 12/10/04), iii) the indicator (or parameter) analyzed (analysis data), here the rate of call interruption due to the BSS - or " call drop BSS rate ") and the value of this indicator (here equal to 6%), iv) the conclusion on the origin of the problem (here the BSS is considered to be responsible for the problem), and v) a proposal for action to solve the problem (here we propose to control the availability of BSC radio network controllers).
Pour permettre cet affichage, l'interface homme/machine IHM accède à la base de données de résultat BDR afin d'extraire les données d'information de (seconds) niveaux d'importance inférieurs au niveau le plus élevé et qui sont stockées en correspondance de l'identifiant du noeud sélectionné.To enable this display, the HMI man / machine interface accesses the result database BDR for extracting the information data from (second) importance levels below the highest level and stored in correspondence of the identifier of the selected node.
Comme cela est illustré sur la figure 5, il est également possible d'effectuer une double sélection au moyen de la souris, afin de sélectionner un noeud parmi un groupe de noeuds. Ici, on a tout d'abord sélectionné le groupe de quatre noeuds de couverture « C » de l'arbre de la figure 6, dédié respectivement aux couvertures des cellules B, C, D et E, par exemple en cliquant dessus avec l'un des clics de la souris. Cette première sélection a provoqué l'affichage sur l'écran d'un menu contextuel proposant d'accéder à la représentation graphique du noeud de couverture « C » de l'une des quatre cellules B, C, D et E, ainsi qu'aux noeuds qui en dépendent. Puis, en sélectionnant l'une des quatre cellules B, C, D et E, ici la cellule C, par exemple en cliquant dessus avec l'un des clics de la souris, on provoque l'affichage sur l'écran, à côté du groupe de noeuds « C », de la représentation graphique du noeud de couverture dédié à la cellule C (le jour pour lequel on réalise l'analyse-diagnostic, ici le 12/10/04) et des noeuds qui en dépendent.As illustrated in FIG. 5, it is also possible to perform a double selection by means of the mouse, in order to select a node from a group of nodes. Here, we first selected the group of four covering nodes "C" of the tree of FIG. 6, respectively dedicated to the covers of the cells B, C, D and E, for example by clicking on them with the one of the clicks of the mouse. This first selection has led to the display on the screen of a contextual menu providing access to the graphical representation of the cover node "C" of one of the four cells B, C, D and E, as well as to the nodes that depend on it. Then, by selecting one of the four cells B, C, D and E, here the cell C, for example by clicking on it with one of the clicks of the mouse, it causes the display on the screen, next of the group of nodes "C", of the graphic representation of the node of cover dedicated to the cell C (the day for which one carries out the analysis-diagnosis, here 12/10/04) and nodes which depend on it.
Cette dernière représentation graphique est de préférence effectuée selon les mêmes conditions que celles utilisées pour le tout premier affichage (voir figure 2). Ainsi, dans l'exemple illustré, on affiche sur l'écran le nom de la cellule (ici la cellule C), la date à laquelle le test a été effectué (ici le 12/10/04), le premier noeud sélectionné (« coverage ») et les noeuds qui sont couplés à ce dernier, ici appelés « puissance », « AMR », « CG » et « densité ».This last graphical representation is preferably carried out according to the same conditions as those used for the very first display (see FIG. 2). Thus, in the example illustrated, the screen shows the name of the cell (here cell C), the date on which the test was performed (here 12/10/04), the first selected node ( "Coverage") and the nodes that are coupled to it, here called "power", "AMR", "CG" and "density".
Le noeud de couverture sélectionné est de type premier noeud, ce qui se traduit par une forme en trapèze inversé, et le résultat du (des) test(s) qui a (ont) été effectué(s) à son niveau est positif (ligne d'encadrement continue simple).The selected cover node is of the first node type, which results in an inverted trapezoidal shape, and the result of the test (s) that was (are) performed at its level is positive (line simple continuous framing).
Le noeud « puissance » est dédié aux problèmes de puissance d'émission de la station de base (BTS ou Node B) de la cellule C. Le résultat du (des) test(s) qui a (ont) été effectué(s) est négatif (ligne d'encadrement en pointillés), et sa représentation sous forme elliptique indique qu'il est associé à une proposition d'action correctrice.The "power" node is dedicated to the transmission power problems of the base station (BTS or Node B) of the C cell. The result of the test (s) that have been carried out is negative (dotted line), and its representation in elliptical form indicates that it is associated with a corrective action proposition.
Le noeud « AMR » est dédié aux problèmes de codage radio de type AMR au niveau de la cellule C. Le résultat du (des) test(s) qui a (ont) été effectué(s) est négatif (ligne d'encadrement en pointillés), et sa représentation sous forme elliptique indique qu'il est associé à une proposition d'action correctrice.The "AMR" node is dedicated to AMR type radio coding problems at cell C. The result of the test (s) that was (are) performed is negative (control line in dotted line), and its representation in elliptical form indicates that it is associated with a corrective action proposition.
Le noeud « CG » est dédié aux problèmes de trou de couverture au niveau de la cellule C. Le résultat du (des) test(s) qui a (ont) été effectué(s) est positif (ligne d'encadrement en trait continu simple), et sa représentation sous forme elliptique indique qu'il est associé à une proposition d'action correctrice.The node "CG" is dedicated to the problems of coverage hole at the level of the cell C. The result of the test (s) that was (are) performed (s) is positive (line of framing in continuous line) simple), and its representation in elliptical form indicates that it is associated with a corrective action proposition.
Le noeud « densité » est dédié aux problèmes de congestion de trafic au niveau de la cellule C. Le résultat du (des) test(s) qui a (ont) été effectué(s) est négatif (ligne d'encadrement en pointillés), et sa représentation sous forme elliptique indique qu'il est associé à une proposition d'action correctrice.The node "density" is dedicated to the problems of traffic congestion at the level of the cell C. The result (s) of the test (s) which has (have) been made (s) is negative (line dashed) , and its representation in elliptical form indicates that it is associated with a proposition of corrective action.
Il est également possible d'accéder aux autres données d'information relatives à chacun des noeuds affichés sur la figure 5, ainsi qu'à leurs données complémentaires (par exemple les données de description), en procédant comme indiqué précédemment en référence aux figures 3 et 4.It is also possible to access the other information data relating to each of the nodes displayed in FIG. 5, as well as to their additional data (for example the description data), by proceeding as indicated above with reference to FIGS. and 4.
Comme cela est illustré sur la figure 1, l'outil de diagnostic OD, selon l'invention, peut également comprendre un module de contrôle MC chargé d'effectuer des tests (de validation) sur des arbres de diagnostic en cours d'élaboration et de délivrer les résultats de ces tests au module de traitement MT afin qu'il les associe à certains au moins des noeuds et/ou liens de l'arbre concerné, sous la forme de données d'information, et à des identifiants de niveau d'importance.As illustrated in FIG. 1, the diagnostic tool OD, according to the invention, may also comprise a control module MC responsible for performing (validation) tests on diagnostic trees being developed and delivering the results of these tests to the processing module MT so that it associates them with at least some of the nodes and / or links of the concerned tree, in the form of information data, and with level identifiers. 'importance.
Les données d'information et les identifiants de niveau d'importance associés peuvent être ensuite, éventuellement, stockés dans une base de données, par exemple une partie de la base de données de résultat BDR dédiée à la validation, en correspondance des identifiants des noeuds correspondants. En variante on pourrait utiliser une mémoire dédiée pour stocker les résultats de validation de façon séparée des résultats réels.The information data and the associated importance level identifiers may then be optionally stored in a database, for example a part of the BDR result database dedicated to the validation, in correspondence of the identifiers of the nodes. correspondents. Alternatively a dedicated memory could be used to store the validation results separately from the actual results.
Le module de contrôle MC est par exemple implanté dans le moteur de diagnostic MD.The control module MC is for example implanted in the diagnostic motor MD.
Grâce au module d'affichage MA et à l'interface homme/machine IHM on peut afficher sélectivement sur l'écran la représentation graphique des noeuds et/ou liens d'au moins une partie testée d'un arbre de diagnostic en cours d'élaboration. Comme dans le cas des résultats réels, cette représentation graphique représente tout ou partie des résultats du test effectué en fonction d'au moins un niveau d'importance choisi.Thanks to the display module MA and the human / machine interface HMI, it is possible to display selectively on the screen the graphical representation of the nodes and / or links of at least one tested part of a diagnostic tree in progress. development. As in the case of the actual results, this graphical representation represents all or part of the results of the test performed according to at least one chosen importance level.
Tout ce qui a été dit précédemment pour l'affichage des représentations graphiques des résultats réels s'applique de la même façon aux résultats de validation. Par exemple, l'interface homme/machine IHM peut permettre à un utilisateur de positionner le curseur de sa souris (ou de tout moyen de sélection équivalent) sur un noeud affiché afin de provoquer l'affichage de toutes les données d'information qui représentent le résultat du test de ce noeud.All that has been said previously for the display of the graphical representations of the real results applies in the same way to the results of validation. For example, the human-machine interface HMI may allow a user to position the cursor of his mouse (or any equivalent selection means) on a displayed node to cause the display of all the information data which represents the result of the test of this node.
Cependant, l'interface homme/machine IHM offre des possibilités supplémentaires dans le cas de la validation.However, the HMI man / machine interface offers additional possibilities in the case of validation.
Par exemple, l'interface homme/machine IHM peut permettre à un utilisateur de sélectionner un noeud d'un arbre de diagnostic en cours d'élaboration (affiché sur l'écran) afin de placer un marqueur d'arrêt au niveau de ce noeud, puis de choisir au moins une valeur de donnée d'analyse à imposer au niveau de ce noeud sélectionné et/ou d'au moins un autre noeud de l'arbre de diagnostic auquel il appartient. Une telle situation est illustrée sur les figures 6 à 8.For example, the HMI man / machine interface may allow a user to select a node from a diagnostic tree being developed (displayed on the screen) to place a stop marker at that node. and then choosing at least one analysis data value to be imposed at this selected node and / or at least one other node of the diagnostic tree to which it belongs. Such a situation is illustrated in Figures 6 to 8.
Dans l'exemple illustré sur la figure 6, la portion d'arbre de sélection en cours d'élaboration est identique à celle présentée ci-avant en référence à la figure 2. Ici, les lignes d'encadrement des formes géométriques matérialisant les noeuds (sauf « C ») sont des traits continus épais du fait que ces noeuds n'ont pas encore été testés.In the example illustrated in FIG. 6, the selection tree portion being developed is identical to that presented above with reference to FIG. 2. Here, the framing lines of the geometric shapes materializing the nodes (except "C") are thick continuous lines because these nodes have not yet been tested.
Ici, l'utilisateur décide de sélectionner le noeud « Drop BSS » afin de lui associer un marqueur d'arrêt, ici matérialisé par le panneau « Stop ». Ce panneau sert à montrer à quel endroit on veut arrêter le déroulement de l'analyse afin d'éventuellement forcer l'analyse d'une branche qui, sinon, n'aurait pas été analysée. Cela peut se faire, par exemple, en cliquant sur le noeud puis en sélectionnant dans un menu contextuel qui s'affiche en retour l'option d'association de marqueur d'arrêt.Here, the user decides to select the node "Drop BSS" in order to associate a stop marker, here materialized by the "Stop" sign. This panel is used to show where you want to stop the progress of the analysis to possibly force the analysis of a branch that otherwise would not have been analyzed. This can be done, for example, by clicking on the node and then selecting in a pop-up menu that returns the stop marker association option.
L'utilisateur peut ensuite forcer l'analyse d'une partie (branche) de l'arbre de diagnostic bien qu'il y ait des résultats négatifs. Cela permet de poursuivre le raisonnement au niveau de cette branche (de la cause correspondante et donc de l'enchaînement) alors que ladite branche aurait dû être éliminée. Pour ce faire, et donc pour vérifier que le diagnostic peut trouver un problème, l'utilisateur arrête le déroulement au niveau d'un noeud. Si les données terrain lues ne correspondent pas au problème recherché, on modifie ces données (en créant un pseudo problème terrain) et on relance l'exécution du diagnostic. Dans l'exemple illustré sur la figure 6, on a arrêté le déroulement au niveau du noeud « C » (couverture de cellule) qui est associé à une valeur d'analyse dont on sait pertinemment qu'elle entraîne un résultat de test(s) négatif. C'est la raison pour laquelle la forme géométrique qui matérialise le noeud « C » est ici un trait en pointillés.The user can then force the analysis of a part (branch) of the diagnostic tree although there are negative results. This makes it possible to continue the reasoning at the level of this branch (of the corresponding cause and thus of the sequence) whereas this branch should have been eliminated. To do this, and therefore to verify that the diagnosis can find a problem, the user stops the flow at a node. If the field data read does not correspond to the problem sought, we modify these data (by creating a pseudo field problem) and restart the execution of the diagnosis. In the example illustrated in FIG. 6, the flow has been stopped at the node "C" (cell cover) which is associated with an analysis value of which it is well known that it results in a test result (s). ) negative. This is the reason why the geometric shape that materializes the node "C" is here a dashed line.
Ce forçage est destiné à tester des valeurs de paramètre ou d'indicateur (données d'analyse) spécifiques au niveau de l'un au moins des autres noeuds de l'arbre de diagnostic en cours d'élaboration.This forcing is intended to test specific parameter or indicator values (analysis data) at at least one of the other nodes of the diagnostic tree being developed.
Par exemple, l'utilisateur peut imposer que le module de contrôle MC teste le noeud « Drop BSS » avec une valeur d'indicateur de taux d'interruption d'appel dû au BSS (ou « call drop BSS rate ») égale à 0,8%. L'utilisateur peut alors demander à l'interface homme/machine IHM d'afficher la représentation graphique du résultat du test du noeud « Drop BSS » sur l'écran. Cette représentation est illustrée dans la fenêtre de gauche de la figure 7. Ici, on constate que le résultat du test est négatif du fait que la ligne d'encadrement de la forme géométrique qui représente le noeud de test(s) est en pointillés.For example, the user may require that the control module MC test the node "Drop BSS" with a value of call interruption rate indicator due to the BSS (or "call drop BSS rate") equal to 0 , 8%. The user can then ask the HMI man / machine interface to display the graphical representation of the test result of the "Drop BSS" node on the screen. This representation is illustrated in the left-hand window of FIG. 7. Here, it can be seen that the result of the test is negative because the framing line of the geometrical shape which represents the test node (s) is in dotted lines.
L'utilisateur peut alors imposer une nouvelle valeur d'indicateur de taux d'interruption d'appel dû au BSS (ici égale à 3%) au moyen de l'interface homme/machine IHM, puis ordonner au module de contrôle MC d'effectuer de nouveau le(s) test(s) du noeud « Drop BSS » avec la nouvelle valeur d'indicateur. L'utilisateur peut ensuite demander à l'interface homme/machine IHM d'afficher la représentation graphique du résultat de ce nouveau test du noeud « Drop BSS » sur l'écran. Cette représentation est illustrée dans la fenêtre de droite de la figure 7. Ici, on constate que le résultat du (des) test(s) est positif du fait que la ligne d'encadrement de la forme géométrique qui représente le noeud de test(s) est en trait continu simple.The user can then impose a new call interruption rate indicator value due to the BSS (here equal to 3%) by means of the HMI man / machine interface, and then instruct the control module MC to perform the "Drop BSS" node test (s) again with the new flag value. The user can then ask the HMI man / machine interface to display the graphical representation of the result of this new test. "Drop BSS" node on the screen. This representation is illustrated in the right window of FIG. 7. Here, it can be seen that the result of the test (s) is positive because the framing line of the geometrical shape which represents the test node ( s) is in single continuous line.
Les valeurs des données d'analyse, qui sont imposées au niveau de certains au moins des noeuds d'un arbre de diagnostic en cours d'élaboration, peuvent être soit définies par l'utilisateur via l'interface homme/machine IHM, soit sélectionnées (ou choisies) par l'utilisateur parmi des données d'analyse réelles stockées dans la base de données d'analyse BDA. Cela permet en effet de confronter un scénario (ou arbre) à la réalité pendant sa phase de conception.The values of the analysis data, which are imposed on at least some of the nodes of a diagnostic tree under development, can be either defined by the user via the HMI man / machine interface, or selected (or chosen) by the user from actual analysis data stored in the BDA analysis database. This makes it possible to confront a scenario (or tree) with reality during its design phase.
Un exemple de sélection est illustré sur la figure 8, dans le cas d'une portion d'arbre de diagnostic en cours d'élaboration identique à celui présenté ci-avant en référence à la figure 6. Ici, l'utilisateur décide de sélectionner le noeud « Drop BSS » afin de lui associer une donnée d'analyse réelle. Cela peut se faire, par exemple, en cliquant sur le noeud puis en sélectionnant dans un menu contextuel qui s'affiche en retour l'option d'association de données d'analyse réelles. L'interface homme/machine IHM provoque alors l'affichage sur l'écran d'une fenêtre du type de celle illustrée dans la partie supérieure gauche de la figure 8. L'utilisateur peut alors sélectionner avec son curseur les données d'analyse qu'il veut imposer au niveau du noeud « Drop BSS », lesquelles sont stockées dans la base de données d'analyse BDA. Ici, l'utilisateur décide de sélectionner les données d'analyse obtenues pour la date 13/02/05 pour la cellule « Paris 1029 » en sélectionnant (cliquant sur) la cellule correspondante dans la liste de cellules proposée et en choisissant une date (en variante l'utilisateur aurait pu sélectionner une heure, un jour, une semaine ou un mois), puis il lance le(s) test(s) avec la valeur correspondante en cliquant avec sa souris sur l'icône « lancer ».An example of selection is illustrated in FIG. 8, in the case of a diagnostic tree portion being developed identical to that presented above with reference to FIG. 6. Here, the user decides to select the "Drop BSS" node to associate it with real analysis data. This can be done, for example, by clicking on the node and then selecting in a context menu that returns the option of association of real analysis data. The human / machine interface GUI then causes the display on the screen of a window of the type of that illustrated in the upper left of Figure 8. The user can then select with his cursor the analysis data that 'he wants to impose at the node' Drop BSS ', which are stored in the database BDA analysis. Here, the user decides to select the analysis data obtained for the date 13/02/05 for the cell "
Le lancement du (des) test(s) peut se faire soit au niveau du noeud de l'arbre de diagnostic en cours d'élaboration pour lequel il vient d'imposer des valeurs de données d'analyse, soit au niveau d'un noeud placé en amont de ce dernier.The launch of the test (s) can be done either at the node of the diagnostic tree under development for which it has just imposed values of analysis data, or at a level of node placed upstream of the latter.
Par ailleurs, le(s) test(s) peu(ven)t être lancé(s) en mode pas à pas, comme illustré sur la figure 9. Plus précisément, dans le mode pas à pas les noeuds qui sont couplés à un noeud amont peuvent être utilisés les uns à la suite des autres, puis, on peut remonter d'un niveau vers l'amont afin de relancer l'ensemble des tests. Dans l'exemple illustré sur la figure 9, on utilise tout d'abord le noeud « Link fail » (1a), puis le noeud « MSC pb » (1 b), puis le noeud « Drop TC » (1c), compte tenu des valeurs de données d'analyse imposées, puis on recommence l'ensemble des tests au niveau du premier noeud « Call drop » (2).Moreover, the test (s) can be launched in step mode, as illustrated in FIG. 9. More precisely, in the step-by-step mode, the nodes that are coupled to a Upstream node can be used one after the other, then, we can go up one level upstream to restart all tests. In the example illustrated in FIG. 9, the node "Link fail" (1a) is used first, then the node "MSC pb" (1b), then the node "Drop TC" (1c), counts Given the values of analysis data imposed, then all the tests are repeated at the level of the first node "Call drop" (2).
Cela permet de tester les unes après les autres les branches d'un arbre de diagnostic en cours d'élaboration, et donc d'optimiser sa conception et son utilisation future.This makes it possible to test, one after the other, the branches of a diagnostic tree that is being developed, and thus to optimize its design and future use.
Bien que cela ne soit pas représenté sur la figure 1, l'outil de diagnostic OD comporte de préférence toutes les fonctions de détection et de résolution d'erreurs (« debugger ») habituelles.Although not shown in FIG. 1, the diagnostic tool OD preferably comprises all the usual debugger detection and resolution functions.
Le module de traitement MT, une partie du module d'affichage MA, une partie de l'interface homme/machine IHM, et l'éventuel module de contrôle MC, de l'outil de diagnostic OD, peuvent être réalisés sous la forme de circuits électroniques, de modules logiciels (ou informatiques), ou d'une combinaison de circuits et de logiciels.The processing module MT, a part of the display module MA, a part of the man-machine interface HMI, and the possible control module MC, of the diagnostic tool OD, can be realized in the form of electronic circuits, software (or computer) modules, or a combination of circuits and software.
L'invention ne se limite pas aux modes de réalisation d'outil de diagnostic décrits ci-avant, seulement à titre d'exemple, mais elle englobe toutes les variantes que pourra envisager l'homme de l'art dans le cadre des revendications ci-après.The invention is not limited to the diagnostic tool embodiments described above, only by way of example, but it encompasses all the variants that may be considered by those skilled in the art within the scope of the present claims. -after.
Claims (18)
Applications Claiming Priority (1)
| Application Number | Priority Date | Filing Date | Title |
|---|---|---|---|
| FR0551520A FR2886792B1 (en) | 2005-06-07 | 2005-06-07 | COMMUNICATION NETWORK DIAGNOSTIC TOOL, OPERATING RESULTS OF REAL TESTS AND / OR VALIDATION BY CONTROL DISPLAY MODE |
Publications (3)
| Publication Number | Publication Date |
|---|---|
| EP1750393A2 true EP1750393A2 (en) | 2007-02-07 |
| EP1750393A3 EP1750393A3 (en) | 2007-07-11 |
| EP1750393B1 EP1750393B1 (en) | 2011-04-06 |
Family
ID=35583489
Family Applications (1)
| Application Number | Title | Priority Date | Filing Date |
|---|---|---|---|
| EP06114767A Not-in-force EP1750393B1 (en) | 2005-06-07 | 2006-05-31 | Network communication diagnostic tool using test results of diagnostic tree |
Country Status (6)
| Country | Link |
|---|---|
| US (1) | US7568126B2 (en) |
| EP (1) | EP1750393B1 (en) |
| CN (1) | CN1878100B (en) |
| AT (1) | ATE505045T1 (en) |
| DE (1) | DE602006021106D1 (en) |
| FR (1) | FR2886792B1 (en) |
Families Citing this family (16)
| Publication number | Priority date | Publication date | Assignee | Title |
|---|---|---|---|---|
| FR2883086B1 (en) * | 2005-03-11 | 2007-05-04 | Alcatel Sa | DEVICE FOR OPTIMIZING DIAGNOSTIC TREES OF A DIAGNOSTIC TOOL OF A COMMUNICATION NETWORK |
| US20070208582A1 (en) * | 2006-03-02 | 2007-09-06 | International Business Machines Corporation | Method, system, and program product for providing an aggregated view |
| US8139503B2 (en) * | 2007-03-30 | 2012-03-20 | Tektronix, Inc. | System and method for automatic detection of UTRAN topology |
| JP5446894B2 (en) * | 2010-01-12 | 2014-03-19 | 富士通株式会社 | Network management support system, network management support device, network management support method and program |
| US9223857B2 (en) * | 2011-10-24 | 2015-12-29 | Lexisnexis, A Division Of Reed Elsevier Inc. | Systems and methods for generating a two-dimensional graphical grid representation of the treatment of a document |
| US9904697B2 (en) * | 2012-03-28 | 2018-02-27 | Halliburton Energy Services | Managing versions of cases |
| GB201418003D0 (en) * | 2014-10-10 | 2014-11-26 | Truphone Ltd | System architecture parachute box system HLD |
| US10956003B2 (en) | 2014-11-03 | 2021-03-23 | Snap-On Incorporated | Methods and systems for displaying vehicle data parameters with pinch-and-expand inputs |
| US9632656B2 (en) * | 2014-11-03 | 2017-04-25 | Snap-On Incorporated | Methods and systems for displaying vehicle data parameters with a uniform cursor movement |
| US9729386B2 (en) * | 2014-12-17 | 2017-08-08 | Alcatel Lucent | System and method of visualizing most unhealthy network elements within a network or data center |
| US20180096312A1 (en) * | 2016-09-30 | 2018-04-05 | Honeywell International Inc. | System and method for generating and representing a cost optimized diagnostic work plan |
| WO2018187094A1 (en) | 2017-04-06 | 2018-10-11 | Common Networks, Inc. | Systems and methods for networking and wirelessly routing communications |
| JP1601053S (en) * | 2017-05-18 | 2018-04-02 | ||
| WO2019140460A1 (en) * | 2018-01-15 | 2019-07-18 | Common Networks, Inc. | Systems and methods for automatically configuring frequencies of radio communication devices |
| CN109614519B (en) * | 2018-12-07 | 2021-06-15 | 万兴科技股份有限公司 | Data import method and data import device |
| CN110643957B (en) * | 2019-09-25 | 2022-04-22 | 河南省功能金刚石研究院有限公司 | Boron-doped diamond composite electrode material, preparation method thereof and boron-doped diamond composite electrode |
Citations (5)
| Publication number | Priority date | Publication date | Assignee | Title |
|---|---|---|---|---|
| EP0413512A2 (en) * | 1989-08-18 | 1991-02-20 | General Electric Company | Method and apparatus for generation of multi-branched diagnostic trees |
| US5428619A (en) * | 1990-02-15 | 1995-06-27 | Digital Equipment Corporation | Model based reasoning system for network fault diagnosis |
| US5539869A (en) * | 1992-09-28 | 1996-07-23 | Ford Motor Company | Method and system for processing and presenting on-line, multimedia information in a tree structure |
| EP1146689A2 (en) * | 2000-04-12 | 2001-10-17 | Mitel Knowledge Corporation | Tree hierarchy and description for generated logs |
| US6499117B1 (en) * | 1999-01-14 | 2002-12-24 | Nec Corporation | Network fault information management system in which fault nodes are displayed in tree form |
Family Cites Families (4)
| Publication number | Priority date | Publication date | Assignee | Title |
|---|---|---|---|---|
| US6654914B1 (en) * | 1999-05-28 | 2003-11-25 | Teradyne, Inc. | Network fault isolation |
| US6396810B1 (en) * | 1999-09-08 | 2002-05-28 | Metasolv Software, Inc. | System and method for analyzing communication paths in a telecommunications network |
| US7310774B1 (en) * | 2000-08-28 | 2007-12-18 | Sanavigator, Inc. | Method for displaying switch port information in a network topology display |
| US7016972B2 (en) * | 2001-04-23 | 2006-03-21 | International Business Machines Corporation | Method and system for providing and viewing performance analysis of resource groups |
-
2005
- 2005-06-07 FR FR0551520A patent/FR2886792B1/en not_active Expired - Fee Related
-
2006
- 2006-05-31 EP EP06114767A patent/EP1750393B1/en not_active Not-in-force
- 2006-05-31 DE DE602006021106T patent/DE602006021106D1/en active Active
- 2006-05-31 AT AT06114767T patent/ATE505045T1/en not_active IP Right Cessation
- 2006-06-06 US US11/447,267 patent/US7568126B2/en active Active
- 2006-06-07 CN CN200610099607.5A patent/CN1878100B/en not_active Expired - Fee Related
Patent Citations (5)
| Publication number | Priority date | Publication date | Assignee | Title |
|---|---|---|---|---|
| EP0413512A2 (en) * | 1989-08-18 | 1991-02-20 | General Electric Company | Method and apparatus for generation of multi-branched diagnostic trees |
| US5428619A (en) * | 1990-02-15 | 1995-06-27 | Digital Equipment Corporation | Model based reasoning system for network fault diagnosis |
| US5539869A (en) * | 1992-09-28 | 1996-07-23 | Ford Motor Company | Method and system for processing and presenting on-line, multimedia information in a tree structure |
| US6499117B1 (en) * | 1999-01-14 | 2002-12-24 | Nec Corporation | Network fault information management system in which fault nodes are displayed in tree form |
| EP1146689A2 (en) * | 2000-04-12 | 2001-10-17 | Mitel Knowledge Corporation | Tree hierarchy and description for generated logs |
Also Published As
| Publication number | Publication date |
|---|---|
| US20060274663A1 (en) | 2006-12-07 |
| DE602006021106D1 (en) | 2011-05-19 |
| FR2886792B1 (en) | 2007-08-10 |
| CN1878100A (en) | 2006-12-13 |
| ATE505045T1 (en) | 2011-04-15 |
| EP1750393B1 (en) | 2011-04-06 |
| EP1750393A3 (en) | 2007-07-11 |
| CN1878100B (en) | 2014-07-09 |
| FR2886792A1 (en) | 2006-12-08 |
| US7568126B2 (en) | 2009-07-28 |
Similar Documents
| Publication | Publication Date | Title |
|---|---|---|
| EP1750393B1 (en) | Network communication diagnostic tool using test results of diagnostic tree | |
| CN111988199B (en) | IMS (IP multimedia subsystem) signaling analysis system and method for power switching network | |
| US20200195517A1 (en) | SYSTEM FOR IDENTIFYING AND ASSISTING IN THE CREATION AND IMPLEMENTATION OF A NETWORK SERVICE CONFIGURATION USING HIDDEN MARKOV MODELS (HMMs) | |
| CN109660405A (en) | Disaster recovery method, device, equipment and the storage medium of call center | |
| WO2003092245A2 (en) | Method of generating a performance model from a functional model | |
| Voronkov et al. | System administrators prefer command line interfaces, don't they? an exploratory study of firewall interfaces | |
| EP1633081A1 (en) | Modular diagnostic device with evolutive knowledge base for communication network | |
| EP1724975A1 (en) | Apparatus for analysis of modified analysis data for communications network optimization | |
| Gadre et al. | A COS study of OSI interoperability | |
| EP1703753B1 (en) | Method of analysing the operation of a cellular mobile telecommunications network | |
| EP1635507B1 (en) | Diagnosis device with adaptive diagnosis models for a communication network | |
| EP1357724A1 (en) | Data filtering management device | |
| EP1650995A1 (en) | Device for controlling corrective actions in a communication network | |
| EP1701473B1 (en) | Diagnostic tool having a diagnostic tree optimisation device for a communication network | |
| EP3416453B1 (en) | Method of troubleshooting using customizable troubleshooting indicators over buckets of variable time | |
| FR2868177A1 (en) | Mobile terminal's e.g. smart phone, use supervising, measuring and analyzing device, has program with automaton directing messages towards filtering procedure for filtering events in messages and sending activity trial to server | |
| EP1825608B1 (en) | Architecture for subscriber simulation on an atn | |
| US20110153788A1 (en) | Method and System for Automated Network Operations | |
| EP1624709A1 (en) | Method and system for managing a cellular mobile communication network | |
| EP1965543B1 (en) | Device for optimising the operation of a communication network by automatically applying characteristic parameters of stable objects to unstable objects | |
| FR2888453A1 (en) | Data e.g. traffic data, analysis device for e.g. GSM network, has collection unit to observe data, upon request, to collect data which satisfies chosen triggering criteria to store data corresponding to each other for analyzing data | |
| EP1624617A1 (en) | Method and system for operating a mobile communication cellular network | |
| CN115412458A (en) | Network equipment testing method and device and electronic equipment | |
| FR2826746A1 (en) | Starting of automatic software programs via screen displayed function graphs, uses interlinked LD and FBD languages | |
| CN111898012A (en) | Automatic packet grabbing method for WEB application |
Legal Events
| Date | Code | Title | Description |
|---|---|---|---|
| PUAI | Public reference made under article 153(3) epc to a published international application that has entered the european phase |
Free format text: ORIGINAL CODE: 0009012 |
|
| AK | Designated contracting states |
Kind code of ref document: A2 Designated state(s): AT BE BG CH CY CZ DE DK EE ES FI FR GB GR HU IE IS IT LI LT LU LV MC NL PL PT RO SE SI SK TR |
|
| AX | Request for extension of the european patent |
Extension state: AL BA HR MK YU |
|
| PUAL | Search report despatched |
Free format text: ORIGINAL CODE: 0009013 |
|
| AK | Designated contracting states |
Kind code of ref document: A3 Designated state(s): AT BE BG CH CY CZ DE DK EE ES FI FR GB GR HU IE IS IT LI LT LU LV MC NL PL PT RO SE SI SK TR |
|
| AX | Request for extension of the european patent |
Extension state: AL BA HR MK YU |
|
| 17P | Request for examination filed |
Effective date: 20080111 |
|
| 17Q | First examination report despatched |
Effective date: 20080214 |
|
| AKX | Designation fees paid |
Designated state(s): AT BE BG CH CY CZ DE DK EE ES FI FR GB GR HU IE IS IT LI LT LU LV MC NL PL PT RO SE SI SK TR |
|
| RIC1 | Information provided on ipc code assigned before grant |
Ipc: H04W 24/02 20090101AFI20100226BHEP |
|
| GRAP | Despatch of communication of intention to grant a patent |
Free format text: ORIGINAL CODE: EPIDOSNIGR1 |
|
| GRAS | Grant fee paid |
Free format text: ORIGINAL CODE: EPIDOSNIGR3 |
|
| GRAA | (expected) grant |
Free format text: ORIGINAL CODE: 0009210 |
|
| RAP1 | Party data changed (applicant data changed or rights of an application transferred) |
Owner name: ALCATEL LUCENT |
|
| AK | Designated contracting states |
Kind code of ref document: B1 Designated state(s): AT BE BG CH CY CZ DE DK EE ES FI FR GB GR HU IE IS IT LI LT LU LV MC NL PL PT RO SE SI SK TR |
|
| REG | Reference to a national code |
Ref country code: GB Ref legal event code: FG4D Free format text: NOT ENGLISH |
|
| REG | Reference to a national code |
Ref country code: CH Ref legal event code: EP |
|
| REG | Reference to a national code |
Ref country code: IE Ref legal event code: FG4D |
|
| REF | Corresponds to: |
Ref document number: 602006021106 Country of ref document: DE Date of ref document: 20110519 Kind code of ref document: P |
|
| REG | Reference to a national code |
Ref country code: DE Ref legal event code: R096 Ref document number: 602006021106 Country of ref document: DE Effective date: 20110519 |
|
| REG | Reference to a national code |
Ref country code: NL Ref legal event code: VDEP Effective date: 20110406 |
|
| PG25 | Lapsed in a contracting state [announced via postgrant information from national office to epo] |
Ref country code: SI Free format text: LAPSE BECAUSE OF FAILURE TO SUBMIT A TRANSLATION OF THE DESCRIPTION OR TO PAY THE FEE WITHIN THE PRESCRIBED TIME-LIMIT Effective date: 20110406 |
|
| LTIE | Lt: invalidation of european patent or patent extension |
Effective date: 20110406 |
|
| REG | Reference to a national code |
Ref country code: DE Ref legal event code: R082 Ref document number: 602006021106 Country of ref document: DE Representative=s name: MENZIETTI WETZEL, DE Ref country code: DE Ref legal event code: R082 Ref document number: 602006021106 Country of ref document: DE Representative=s name: KNECHT SCHMIDT MENZIETTI URLICHS WETZEL, DE Ref country code: DE Ref legal event code: R082 Ref document number: 602006021106 Country of ref document: DE Representative=s name: KNECHT MENZIETTI WETZEL, DE |
|
| REG | Reference to a national code |
Ref country code: IE Ref legal event code: FD4D |
|
| PG25 | Lapsed in a contracting state [announced via postgrant information from national office to epo] |
Ref country code: SE Free format text: LAPSE BECAUSE OF FAILURE TO SUBMIT A TRANSLATION OF THE DESCRIPTION OR TO PAY THE FEE WITHIN THE PRESCRIBED TIME-LIMIT Effective date: 20110406 Ref country code: PT Free format text: LAPSE BECAUSE OF FAILURE TO SUBMIT A TRANSLATION OF THE DESCRIPTION OR TO PAY THE FEE WITHIN THE PRESCRIBED TIME-LIMIT Effective date: 20110808 Ref country code: LT Free format text: LAPSE BECAUSE OF FAILURE TO SUBMIT A TRANSLATION OF THE DESCRIPTION OR TO PAY THE FEE WITHIN THE PRESCRIBED TIME-LIMIT Effective date: 20110406 |
|
| BERE | Be: lapsed |
Owner name: ALCATEL LUCENT Effective date: 20110531 |
|
| PG25 | Lapsed in a contracting state [announced via postgrant information from national office to epo] |
Ref country code: ES Free format text: LAPSE BECAUSE OF FAILURE TO SUBMIT A TRANSLATION OF THE DESCRIPTION OR TO PAY THE FEE WITHIN THE PRESCRIBED TIME-LIMIT Effective date: 20110717 Ref country code: AT Free format text: LAPSE BECAUSE OF FAILURE TO SUBMIT A TRANSLATION OF THE DESCRIPTION OR TO PAY THE FEE WITHIN THE PRESCRIBED TIME-LIMIT Effective date: 20110406 Ref country code: FI Free format text: LAPSE BECAUSE OF FAILURE TO SUBMIT A TRANSLATION OF THE DESCRIPTION OR TO PAY THE FEE WITHIN THE PRESCRIBED TIME-LIMIT Effective date: 20110406 Ref country code: IS Free format text: LAPSE BECAUSE OF FAILURE TO SUBMIT A TRANSLATION OF THE DESCRIPTION OR TO PAY THE FEE WITHIN THE PRESCRIBED TIME-LIMIT Effective date: 20110806 Ref country code: LV Free format text: LAPSE BECAUSE OF FAILURE TO SUBMIT A TRANSLATION OF THE DESCRIPTION OR TO PAY THE FEE WITHIN THE PRESCRIBED TIME-LIMIT Effective date: 20110406 Ref country code: GR Free format text: LAPSE BECAUSE OF FAILURE TO SUBMIT A TRANSLATION OF THE DESCRIPTION OR TO PAY THE FEE WITHIN THE PRESCRIBED TIME-LIMIT Effective date: 20110707 Ref country code: CY Free format text: LAPSE BECAUSE OF FAILURE TO SUBMIT A TRANSLATION OF THE DESCRIPTION OR TO PAY THE FEE WITHIN THE PRESCRIBED TIME-LIMIT Effective date: 20110406 |
|
| PG25 | Lapsed in a contracting state [announced via postgrant information from national office to epo] |
Ref country code: NL Free format text: LAPSE BECAUSE OF FAILURE TO SUBMIT A TRANSLATION OF THE DESCRIPTION OR TO PAY THE FEE WITHIN THE PRESCRIBED TIME-LIMIT Effective date: 20110406 Ref country code: MC Free format text: LAPSE BECAUSE OF NON-PAYMENT OF DUE FEES Effective date: 20110531 |
|
| REG | Reference to a national code |
Ref country code: CH Ref legal event code: PL |
|
| PG25 | Lapsed in a contracting state [announced via postgrant information from national office to epo] |
Ref country code: EE Free format text: LAPSE BECAUSE OF FAILURE TO SUBMIT A TRANSLATION OF THE DESCRIPTION OR TO PAY THE FEE WITHIN THE PRESCRIBED TIME-LIMIT Effective date: 20110406 Ref country code: IE Free format text: LAPSE BECAUSE OF FAILURE TO SUBMIT A TRANSLATION OF THE DESCRIPTION OR TO PAY THE FEE WITHIN THE PRESCRIBED TIME-LIMIT Effective date: 20110406 Ref country code: CH Free format text: LAPSE BECAUSE OF NON-PAYMENT OF DUE FEES Effective date: 20110531 Ref country code: CZ Free format text: LAPSE BECAUSE OF FAILURE TO SUBMIT A TRANSLATION OF THE DESCRIPTION OR TO PAY THE FEE WITHIN THE PRESCRIBED TIME-LIMIT Effective date: 20110406 Ref country code: LI Free format text: LAPSE BECAUSE OF NON-PAYMENT OF DUE FEES Effective date: 20110531 |
|
| PLBE | No opposition filed within time limit |
Free format text: ORIGINAL CODE: 0009261 |
|
| STAA | Information on the status of an ep patent application or granted ep patent |
Free format text: STATUS: NO OPPOSITION FILED WITHIN TIME LIMIT |
|
| RAP2 | Party data changed (patent owner data changed or rights of a patent transferred) |
Owner name: ALCATEL LUCENT |
|
| PG25 | Lapsed in a contracting state [announced via postgrant information from national office to epo] |
Ref country code: PL Free format text: LAPSE BECAUSE OF FAILURE TO SUBMIT A TRANSLATION OF THE DESCRIPTION OR TO PAY THE FEE WITHIN THE PRESCRIBED TIME-LIMIT Effective date: 20110406 Ref country code: RO Free format text: LAPSE BECAUSE OF FAILURE TO SUBMIT A TRANSLATION OF THE DESCRIPTION OR TO PAY THE FEE WITHIN THE PRESCRIBED TIME-LIMIT Effective date: 20110406 Ref country code: DK Free format text: LAPSE BECAUSE OF FAILURE TO SUBMIT A TRANSLATION OF THE DESCRIPTION OR TO PAY THE FEE WITHIN THE PRESCRIBED TIME-LIMIT Effective date: 20110406 Ref country code: SK Free format text: LAPSE BECAUSE OF FAILURE TO SUBMIT A TRANSLATION OF THE DESCRIPTION OR TO PAY THE FEE WITHIN THE PRESCRIBED TIME-LIMIT Effective date: 20110406 |
|
| 26N | No opposition filed |
Effective date: 20120110 |
|
| PG25 | Lapsed in a contracting state [announced via postgrant information from national office to epo] |
Ref country code: BE Free format text: LAPSE BECAUSE OF NON-PAYMENT OF DUE FEES Effective date: 20110531 |
|
| REG | Reference to a national code |
Ref country code: DE Ref legal event code: R097 Ref document number: 602006021106 Country of ref document: DE Effective date: 20120110 |
|
| PG25 | Lapsed in a contracting state [announced via postgrant information from national office to epo] |
Ref country code: LU Free format text: LAPSE BECAUSE OF NON-PAYMENT OF DUE FEES Effective date: 20110531 |
|
| PG25 | Lapsed in a contracting state [announced via postgrant information from national office to epo] |
Ref country code: BG Free format text: LAPSE BECAUSE OF FAILURE TO SUBMIT A TRANSLATION OF THE DESCRIPTION OR TO PAY THE FEE WITHIN THE PRESCRIBED TIME-LIMIT Effective date: 20110706 |
|
| PG25 | Lapsed in a contracting state [announced via postgrant information from national office to epo] |
Ref country code: TR Free format text: LAPSE BECAUSE OF FAILURE TO SUBMIT A TRANSLATION OF THE DESCRIPTION OR TO PAY THE FEE WITHIN THE PRESCRIBED TIME-LIMIT Effective date: 20110406 |
|
| PG25 | Lapsed in a contracting state [announced via postgrant information from national office to epo] |
Ref country code: HU Free format text: LAPSE BECAUSE OF FAILURE TO SUBMIT A TRANSLATION OF THE DESCRIPTION OR TO PAY THE FEE WITHIN THE PRESCRIBED TIME-LIMIT Effective date: 20110406 |
|
| REG | Reference to a national code |
Ref country code: FR Ref legal event code: GC Effective date: 20131018 |
|
| PG25 | Lapsed in a contracting state [announced via postgrant information from national office to epo] |
Ref country code: IT Free format text: LAPSE BECAUSE OF FAILURE TO SUBMIT A TRANSLATION OF THE DESCRIPTION OR TO PAY THE FEE WITHIN THE PRESCRIBED TIME-LIMIT Effective date: 20110406 |
|
| REG | Reference to a national code |
Ref country code: FR Ref legal event code: RG Effective date: 20141016 |
|
| REG | Reference to a national code |
Ref country code: FR Ref legal event code: PLFP Year of fee payment: 10 |
|
| REG | Reference to a national code |
Ref country code: FR Ref legal event code: PLFP Year of fee payment: 11 |
|
| PGFP | Annual fee paid to national office [announced via postgrant information from national office to epo] |
Ref country code: DE Payment date: 20160520 Year of fee payment: 11 Ref country code: GB Payment date: 20160520 Year of fee payment: 11 |
|
| PGFP | Annual fee paid to national office [announced via postgrant information from national office to epo] |
Ref country code: FR Payment date: 20160520 Year of fee payment: 11 |
|
| REG | Reference to a national code |
Ref country code: DE Ref legal event code: R119 Ref document number: 602006021106 Country of ref document: DE |
|
| GBPC | Gb: european patent ceased through non-payment of renewal fee |
Effective date: 20170531 |
|
| REG | Reference to a national code |
Ref country code: FR Ref legal event code: ST Effective date: 20180131 |
|
| PG25 | Lapsed in a contracting state [announced via postgrant information from national office to epo] |
Ref country code: DE Free format text: LAPSE BECAUSE OF NON-PAYMENT OF DUE FEES Effective date: 20171201 Ref country code: GB Free format text: LAPSE BECAUSE OF NON-PAYMENT OF DUE FEES Effective date: 20170531 |
|
| PG25 | Lapsed in a contracting state [announced via postgrant information from national office to epo] |
Ref country code: FR Free format text: LAPSE BECAUSE OF NON-PAYMENT OF DUE FEES Effective date: 20170531 |