EP1583016A2 - Data processing and display method for gene expression analysis system and gene expression analysing system - Google Patents
Data processing and display method for gene expression analysis system and gene expression analysing system Download PDFInfo
- Publication number
- EP1583016A2 EP1583016A2 EP05004041A EP05004041A EP1583016A2 EP 1583016 A2 EP1583016 A2 EP 1583016A2 EP 05004041 A EP05004041 A EP 05004041A EP 05004041 A EP05004041 A EP 05004041A EP 1583016 A2 EP1583016 A2 EP 1583016A2
- Authority
- EP
- European Patent Office
- Prior art keywords
- sequence
- gene expression
- probe
- analysis system
- displaying
- Prior art date
- Legal status (The legal status is an assumption and is not a legal conclusion. Google has not performed a legal analysis and makes no representation as to the accuracy of the status listed.)
- Withdrawn
Links
Images


Classifications
-
- G—PHYSICS
- G16—INFORMATION AND COMMUNICATION TECHNOLOGY [ICT] SPECIALLY ADAPTED FOR SPECIFIC APPLICATION FIELDS
- G16B—BIOINFORMATICS, i.e. INFORMATION AND COMMUNICATION TECHNOLOGY [ICT] SPECIALLY ADAPTED FOR GENETIC OR PROTEIN-RELATED DATA PROCESSING IN COMPUTATIONAL MOLECULAR BIOLOGY
- G16B45/00—ICT specially adapted for bioinformatics-related data visualisation, e.g. displaying of maps or networks
-
- G—PHYSICS
- G16—INFORMATION AND COMMUNICATION TECHNOLOGY [ICT] SPECIALLY ADAPTED FOR SPECIFIC APPLICATION FIELDS
- G16B—BIOINFORMATICS, i.e. INFORMATION AND COMMUNICATION TECHNOLOGY [ICT] SPECIALLY ADAPTED FOR GENETIC OR PROTEIN-RELATED DATA PROCESSING IN COMPUTATIONAL MOLECULAR BIOLOGY
- G16B25/00—ICT specially adapted for hybridisation; ICT specially adapted for gene or protein expression
- G16B25/10—Gene or protein expression profiling; Expression-ratio estimation or normalisation
-
- G—PHYSICS
- G16—INFORMATION AND COMMUNICATION TECHNOLOGY [ICT] SPECIALLY ADAPTED FOR SPECIFIC APPLICATION FIELDS
- G16B—BIOINFORMATICS, i.e. INFORMATION AND COMMUNICATION TECHNOLOGY [ICT] SPECIALLY ADAPTED FOR GENETIC OR PROTEIN-RELATED DATA PROCESSING IN COMPUTATIONAL MOLECULAR BIOLOGY
- G16B30/00—ICT specially adapted for sequence analysis involving nucleotides or amino acids
- G16B30/10—Sequence alignment; Homology search
-
- G—PHYSICS
- G16—INFORMATION AND COMMUNICATION TECHNOLOGY [ICT] SPECIALLY ADAPTED FOR SPECIFIC APPLICATION FIELDS
- G16B—BIOINFORMATICS, i.e. INFORMATION AND COMMUNICATION TECHNOLOGY [ICT] SPECIALLY ADAPTED FOR GENETIC OR PROTEIN-RELATED DATA PROCESSING IN COMPUTATIONAL MOLECULAR BIOLOGY
- G16B50/00—ICT programming tools or database systems specially adapted for bioinformatics
- G16B50/10—Ontologies; Annotations
-
- G—PHYSICS
- G16—INFORMATION AND COMMUNICATION TECHNOLOGY [ICT] SPECIALLY ADAPTED FOR SPECIFIC APPLICATION FIELDS
- G16B—BIOINFORMATICS, i.e. INFORMATION AND COMMUNICATION TECHNOLOGY [ICT] SPECIALLY ADAPTED FOR GENETIC OR PROTEIN-RELATED DATA PROCESSING IN COMPUTATIONAL MOLECULAR BIOLOGY
- G16B50/00—ICT programming tools or database systems specially adapted for bioinformatics
- G16B50/30—Data warehousing; Computing architectures
-
- G—PHYSICS
- G16—INFORMATION AND COMMUNICATION TECHNOLOGY [ICT] SPECIALLY ADAPTED FOR SPECIFIC APPLICATION FIELDS
- G16B—BIOINFORMATICS, i.e. INFORMATION AND COMMUNICATION TECHNOLOGY [ICT] SPECIALLY ADAPTED FOR GENETIC OR PROTEIN-RELATED DATA PROCESSING IN COMPUTATIONAL MOLECULAR BIOLOGY
- G16B25/00—ICT specially adapted for hybridisation; ICT specially adapted for gene or protein expression
-
- G—PHYSICS
- G16—INFORMATION AND COMMUNICATION TECHNOLOGY [ICT] SPECIALLY ADAPTED FOR SPECIFIC APPLICATION FIELDS
- G16B—BIOINFORMATICS, i.e. INFORMATION AND COMMUNICATION TECHNOLOGY [ICT] SPECIALLY ADAPTED FOR GENETIC OR PROTEIN-RELATED DATA PROCESSING IN COMPUTATIONAL MOLECULAR BIOLOGY
- G16B30/00—ICT specially adapted for sequence analysis involving nucleotides or amino acids
-
- G—PHYSICS
- G16—INFORMATION AND COMMUNICATION TECHNOLOGY [ICT] SPECIALLY ADAPTED FOR SPECIFIC APPLICATION FIELDS
- G16B—BIOINFORMATICS, i.e. INFORMATION AND COMMUNICATION TECHNOLOGY [ICT] SPECIALLY ADAPTED FOR GENETIC OR PROTEIN-RELATED DATA PROCESSING IN COMPUTATIONAL MOLECULAR BIOLOGY
- G16B50/00—ICT programming tools or database systems specially adapted for bioinformatics
Definitions
- the present invention relates to a gene expression analysis system using a DNA chip, and particularly to a system and a display method to display the position of a probe sequence on a genome sequence, candidates for splice variants, and translation products thereof.
- DNA chip system a DNA array or a DNA chip system (hereinafter, collectively referred to as DNA chip system) that allows expression levels of a number of genes to be determined at a time is used. Sequences of probes are designed from many gene coding regions of an organism, and these are mounted on the DNA chip system. To these probe sequences, mRNAs (target) isolated from the organism are hybridized. Gene expression levels can be determined by measuring the amounts of mRNAs that hybridize.
- mRNAs that hybridize to a probe contain not only mRNA that is translated into an objective gene product, but also mRNAs called splice variant and EST.
- the splice variants are formed by selective splicing, that is, specific exons are selected from among exon and intron sequences of a genome.
- the splice variants are formed from a single gene region on a genome, these represent mutually different mRNAs. Accordingly, the splice variants are converted in vivo into proteins having mutually different sequences and perform mutually different functions. It is inferred that the total number of genes in human is about 35,000 and at least 35% of the genes undergo selective splicing (Non-patent Document 1).
- Patent Document 1 An example of a DNA chip system that allows splice variants to be monitored exhaustively is disclosed in Patent Document 1.
- sequence specific expression levels are detected by measuring signal values on designed probes.
- Patent Document 2 a method to display exon and intron for splice variants is disclosed.
- the length of intron sequences is generally longer compared to the length of exons, and these sometimes differ by an order of magnitude or more. Therefore in the invention disclosed in Patent Document 2, the portions of intron sequences are displayed with compression in order to make the exon-intron sequences easily understandable, and mutually different portions in splice variants are displayed so as to be emphasized.
- Patent Document 1 Although a reading device to measure hybridization intensities and software for their quantification are described in Patent Document 1, software to perform data mining is not disclosed. Even when the DNA chip designed in consideration of splice variants is used, a system that mutually recognizes information of the designed probes and the expression data is necessary during a process of the data mining.
- Patent Document 2 and the information sites of public databases aim at displaying splice variants, and many splice variants for a specific gene are neither displayed at a time nor displayed in relation to their expression levels.
- the purpose of the present invention is to provide a gene expression analysis system using DNA chips and display method thereof in which a probe position on a genome sequence is displayed; candidates for splice variants (mRNA and EST sequences) hybridizing to the probe and their translation products are displayed; and expression data are displayed in relation to the probe.
- the purpose of the present invention is to provide the gene expression analysis system loaded with a function in which numerical data representing expression values obtained from hybridization experiments and gene and sequence information concerning probes placed on DNA chips are input, and the numerical data are wholly corrected and preprocessed; a function in which the position of a probe on a genome sequence and candidates for splice variants (mRNA or EST sequences) that hybridize to the probe sequence are displayed; and a function in which a statistical analysis of the input numerical data is performed for classification and judgment according to statistical algorism.
- the gene expression analysis system of the present invention is accessible to the information in the external database that manages sequence information and annotation information of various species of organisms in order to realize displaying the position of a probe on a genome sequence and the candidates for splice variants that hybridize to the probe sequence.
- Data exchange is performed via a network and an external server.
- the external database stores detailed information such as accession number of each organism and gene name, and sequence data, and manages genome sequences in positional information of chromosomes.
- the first step information on chromosomes of an organism to be analyzed is extracted from the external database. That is, the number of chromosomes and lengths of long arm and short arm of each chromosome are retrieved and stored in a local DNA chip database.
- positional information of a probe sequence is extracted from gene information (mRNA, EST) by searching the external database using as a search key a probe annotation to obtain the positional information of the probe on the genome sequence based on the input numerical data, gene information concerning the probe, and the sequence information.
- the positions of probes on the genome sequence are determined by executing multiple alignments using all sequences of the probes on the DNA chip as query sequences and the genome sequence in the same position as the positional information of the probe as a subject sequence.
- candidates for splice variants that hybridize to the probe are extracted by searching the external database with the BLAST search program.
- the BLAST search program is executed by using the gene (mRNA) on the search key as a query sequence and all mRNA and EST sequences of the organism to be analyzed in the external database as subject sequences. Then, the BLAST search program is executed again by using each mRNA or EST obtained by the first BLAST search as a query sequence and the genome sequence of the organism to be analyzed in the external database as a subject sequence.
- the BLAST search program is executed by the external server connected to the external database.
- the BLAST search program between base sequences is executed according to conditions of predetermined parameters using the entire sequence data of the databases to be searched as subject sequences. In this way, the position of a query sequence with respect to a subject sequence, and the position of the subject sequence with respect to the query sequence are determined.
- the BLAST search results are selected dependent on a condition and stored in the DNA chip database.
- a chromosome map is graphically depicted based on specified display data.
- a list of the initially specified display data is displayed in a tabular form (hybridization ID and DNA chip name).
- the selected data are displayed.
- expression levels to display for each position on the genome are determined, and when plural data are selected, an average is calculated.
- an average value of ratios (intensity) for plural probe IDs is calculated and employed as an expression value for the position.
- a chromosomal map is graphically depicted based on the total number of chromosomes and the lengths of short arm and long arm of each chromosome, and the expression values are displayed on each position on the chromosomes in a way that a maximal value is in red, a median value in black, and a minimal value in green.
- the probe sequence and the splice variants are displayed such that their positional relations relative to the genome sequence are clearly understood.
- a user selects a chromosome on the map with the input device, the selected chromosome number, the organism, and the display range of the genome sequence in an appropriate position are displayed.
- the sequence numbers of the range of the genome, the start number and the end number of the probe sequence are displayed.
- expression data are displayed as numerical values and in colors.
- Candidates for splice variants are displayed at positions corresponding to the genome sequence based on the results from the BLAST search of each probe.
- a candidate for splice variant (mRNA and EST) is selected with the input device, detailed information on the selected sequence is displayed on a different window.
- the probe ID is selected
- the probe sequence the annotation information on the gene that is input information
- the information on expression values are displayed.
- the splice variant is selected, BLAST search result, the annotation information on the gene, and the sequence information are displayed.
- the present invention it becomes easy to obtain information on translation products of splice variants, since not only the position to relate expression data obtained by a probe sequence, that have been designed for a DNA chip system, to a genome sequence but also the candidates for splice variants (mRNA and EST) that hybridize to the designed probe sequence can be wholly observed.
- An expression analysis using a DNA chip system to measure translation levels can be performed with higher accuracy by displaying information on proteins derived from splice variants and their expression values at the same time.
- Fig. 1 illustrates a structure of a gene expression analysis system of the present invention.
- the gene expression analysis system of the present embodiment is provided with a DNA chip database 100, a display device 101, a mouse 102, a keyboard 103, a central processing unit 104, and a program memory 105.
- the gene expression analysis system is connected to a server 110, an external database 112, and further public (commercial) databases 113 and 114 via the Internet 115.
- the display device 101 serves as an interface for data input and displays a chromosome map and splice variants both of which are objectives of the present invention.
- the mouse 102 and the keyboard 103 are used for selecting or inputting information by the user.
- the central processing unit 104 executes various programs and processing.
- the program memory 105 is provided with a preprocessing and normalization program 106 to convert input expression data into values of significance or correct them in advance, a splice variant display program 107 to display genomic sequences, probe sequences, and mapping of splice variants, a statistical analysis program 108 to perform a statistical analysis necessary for a gene expression analysis, and a chromosome map display program 109 to display chromosomes together with expression levels.
- a preprocessing and normalization program 106 to convert input expression data into values of significance or correct them in advance
- a splice variant display program 107 to display genomic sequences, probe sequences, and mapping of splice variants
- a statistical analysis program 108 to perform a statistical analysis necessary for a gene expression analysis
- a chromosome map display program 109 to display chromosomes together with expression levels.
- a preprocessing and normalization unit may be provided in place of the preprocessing and normalization program 106, the splice variant display program 107, the statistical analysis program 108, and the chromosome map display program 109.
- the server 110 to process the external database 112 and the external database information is connected to a plurality of the public (commercial) databases 113 and 114 via the Internet 115. Accordingly, the external database 112 and the server 110 download data periodically from the public (commercial) databases 113 and 114 and prepare indexes from its character string, thereby keeping databases in each index.
- the server 110 is provided with the BLAST search program 111.
- the BLAST search program 111 can be used in the gene expression analysis system of the present invention. When a specific base sequence or amino acid sequence is input as a query sequence using the input devices 102 and 103, sequences similar to the input sequence are searched in the external database 112.
- Fig. 2 illustrates an example of an experiment carried out using a DNA chip.
- a DNA chip A carrying DNA probes of an organism to be studied is prepared. mRNAs obtained from a study sample are converted into cDNAs, labeled with a fluorophore, and hybridized to the DNA probes on the DNA chip A. The fluorescence intensity of the DNA probes after the hybridization reaction is measured.
- a piece of experimental data 200-1 is obtained.
- N pieces of experimental data, 200-1 to 200-N are obtained.
- the experimental data 200-1 to 200-N thus obtained are used for analysis using the gene expression analysis system of the present invention.
- the experimental data 200-1 obtained from hybridization includes probe identification numbers 201, fluorescence intensities on each probe 202, gene names of genes hybridized to each probe 203, accession numbers to the public databases 204, descriptions 205, and probe sequences 206 as illustrated. Information related to the probes or the genes other than those described may also be included.
- the fluorescence intensity 202 is of one kind or of two kinds. When the number of target DNA samples to be subjected to hybridization is two in kinds, two kinds of fluorescent dyes are sometimes used.
- Fig. 3 illustrates an example of a main screen 300 to be displayed on the display device of the gene expression analysis system of the present invention. It is assumed that the N pieces of experimental data, 200-1 to 200-N, shown in Fig. 2 are input as input data.
- the input data may be input from a storage medium such as hard disk or CD-ROM via a program of the gene expression analysis system.
- the input method includes input from a menu, input by drag and drop, and the like.
- the input data is displayed in a tree structure 301, and the kinds of DNA chips A, B, and C are shown in the first column.
- the number of experiments i.e. the number of hybridization is displayed.
- the number of hybridization is displayed in N as shown by reference numerals 302 and 303.
- the experimental data of the hybridization 1 is displayed on the right view.
- an experiment name 304 to represent hybridization uniquely such as the name of sample subjected to each hybridization, a total probe number 305 on the DNA chip, a total block number 306 on the DNA chip, a spot number 307 in one block, and other detailed description 308 are displayed.
- a tool button 309 to implement wizard for data input a tool button 310 to execute the preprocessing and normalization program 106, a tool button 311 to execute the splice variant display program 107, a tool button 312 to execute the statistical analysis program 108, and a tool button 313 to execute the chromosome map display program 109 are provided.
- the user can perform desired processes by clicking on these buttons.
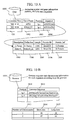
- Fig. 4 illustrates a data structure inside the DNA chip database 100.
- data is managed for every species of organisms.
- a category 400 representing species of organisms such as human, mouse, and rat is included. Although three kinds of species of organisms are shown in the example, the category should be provided for all species of organisms.
- the data stored in the DNA chip database 100 includes experimental data 401 input by users and data 412 to 417 extracted from the external database 112. The method to extract data from the external database 112 is explained later with reference to Fig.7.
- the experimental data 401 obtained with the DNA chip A is stored under the category of human.
- the experimental data 401 includes a hybridization ID 402 to represent each hybridization uniquely, a probe ID 403 in each hybridization, expression data (fluorescence intensities) 404 and 405, and an expression ratio 406.
- the expression ratio 406 is indicated.
- the expression ratio 406 is determined by Intensity (1)/Intensity (2) or Intensity (2)/Intensity (1).
- the experimental data 401 includes further a gene name 408 of the gene that hybridizes to a DNA sequence serving as a probe, an accession number 409, a definition of the gene 410, and the probe sequence 411.
- the data 412 to 417 extracted from the external database 112 includes positions 412 of the probes representing chromosomal positions on the genome sequence, starting positions 413 and ending positions 414 of the probe sequences on the genome sequence, the number of chromosomes 415 in the organism, and the lengths of short arm 416 and long arm 417 of the chromosomes.
- Fig. 5 illustrates candidates for splice variants (mRNA and EST sequences) that hybridize to the probe.
- the candidates for splice variants are retrieved from the external database 112 with the BLAST search program 111 provided in the server 110. It should be noted that the search of the candidates for splice variants is carried out when the splice variant display program 107 is executed. The detailed search process of the candidates for splice variants is shown in the flow charts of Figs. 11 and 12.
- the user searches for gene sequences (mRNA sequences) using the gene name 408 or the accession number 409 as a search key among the input experimental data 401.
- sequence information is found, BLAST search is performed in mRNA and EST sequence databases using the found sequence as a query sequence.
- BLAST search is performed in mRNA and EST sequence databases using the found sequence as a query sequence.
- genes similar to the gene on the search key are found.
- an accession ID 501 to protein database, a definition 502, a probe position 503 on the genome sequence, a gene name 504, a base sequence 505, a length of the base sequence 506, a protein ID 507, and a protein definition 508 are obtained and stored.
- each gene is located on the genome is determined by BLAST search using the base sequence 505 as a query sequence.
- BLAST search IDs 509 and 510 are obtained as the result of the BLAST search, these are stored.
- a gene sequence is derived from an exon-intron structure on the genome, and the exon sequences are scattered. For this reason, a start position 511 and an end position 512 of each fragment of the gene sequence, and a start position 513 and an end position 514 corresponding to these respective positions on the genome sequence are stored. Further, a length of sequence in the exon portion 515, an orientation of genome sequence (strand) 516, identities to the genome sequence 517, a score of BLAST search 518, and an E-value 519 are stored.
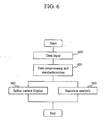
- Fig. 6 illustrates a flow of operations of programs stored in the program memory 105 of the gene expression analysis system of the present invention.
- step 600 the user inputs data from hybridization experiments with DNA chips.
- the data input wizard is set in motion.
- the user inputs the experimental data according to the data input wizard.
- preprocessing and normalization are carried out by the preprocessing and normalization program 106.
- the preprocessing represents execution of judging whether the input expression data is right or wrong, correcting them if necessary, and narrowing down data to be used for analysis based on criteria of judgment for each spot on the DNA chip.
- experiments such as reproducibility experiments using a plurality of the same DNA chips, experiments to exchange two different fluorescent dyes, and experiments to confirm reliability of data are carried out, it is possible to extract highly reliable data from these experimental data.
- the normalization represents converting data having a linear or non-linear distribution into data having a normal distribution for the whole analysis data on each DNA chip. By performing the normalization, all of the extracted data are made possible to be compared.
- the user selects either the splice variant display program 107 or the statistical analysis program 108. Clicking on the tool button 311 on the main screen 300 allows to proceed to step 602, and the splice variant display program 107 is executed, while clicking on the tool button 312 allows to proceed to step 603, and the statistical analysis program 108 is executed.
- the details of the splice variant display program 107 and the statistical analysis program 108 are explained below.
- the splice variant display program 107 is executed by clicking on the tool button 311 on the main screen 300 shown in Fig. 3.
- a setting dialog is displayed on the screen of the display device 101.
- An example of the setting dialog is explained later with reference to Figs. 8 and 9.
- the splice variant display program 107 is executed according to the setting displayed on this setting dialog.
- step 701 the user judges whether or not data on the probe positions of the DNA chip A to be displayed on the genome sequence and data on candidates for splice variants are stored in the DNA chip database 100. In other words, the user judges whether or not the information 412 to 414 and 501 to 519 concerning the DNA chip A has already been extracted from the external database 112. When there are the data on the positions of the probes of the DNA chip A on the genome sequence and the data on candidates for splice variants, these are supposed to be displayed in appropriate boxes in the setting dialog shown in Figs. 8 and 9. When the information 412 to 414 and 501 to 519 concerning the DNA chip A has already been extracted from the external database 112, the external database 112 is not repeatedly searched. Accordingly, the splice variant display program 107 proceeds to step 704 and carries out only image creation process.
- the splice variant display program 107 proceeds to step 702.
- step 702 information such as the number of chromosomes 415 of the organism, the lengths of short arms 416, and the lengths of long arms 417 is obtained from information 1013 to 1015 of the external database 112.
- step 703 the probe positions 412 on the genome sequence and the starting positions 413 and ending positions 414 of the probes on the genome sequence are obtained using the search key. The details of the step 703 are explained with reference to Fig. 11.
- step 704 candidates for splice variants are searched by the BLAST search program, and the positions 513 and 514 of splice variants on the genome sequence are obtained.
- the results of the BLAST search are stored in the DNA chip database 100.
- an image of chromosome map is created in step 705.
- step 706 the candidates for the splice variants are displayed so as to be arranged on the specified genome sequence on the basis of the BLAST search results.
- Fig. 8 illustrates an example of a setting dialog 800 of a display chip displayed on the screen of the display device 101 when the splice variant display program 107 is executed.
- This setting dialog 800 includes a display DNA chip 801, display data 802, a hybridization ID 803, an experiment name 804, a delete key 805, an add key 806, display of candidates for splice variants 807, and the like.
- the display DNA chip 801 is displayed in a pull-down menu, and the kinds of the DNA chips 301 in Fig. 3 are displayed in the pull-down menu.
- display DNA chip 801 When the display DNA chip 801 is designated, respective items 803 and 804 of the display data 802 are displayed. Since the DNA chip A is designated in the illustrated example, the hybridization IDs 803 of hybridization experiments carried out using the DNA chip A and the experiment names 804 are displayed. When it is necessary to delete the displayed hybridization IDs 803, the delete key 805 is used, and when it is necessary to add, the add key 806 is used. What can be added is a hybridization ID registered in relation to the DNA chip A.
- the display of candidates for splice variants 807 is either one of "display only mRNA" or "display all (short fragments such as EST included)".
- Fig. 9 illustrates an example of a search key setting dialog 900 that is displayed on the screen of the display device 101 when connected to the external database 112.
- the setting dialog 900 includes a search key 901, and an address of server, a port number, an access ID, and a password 902 that are needed to connect to the external database 112 and the server 110.
- setting 903 is taken into consideration. Only when the proxy server is utilized, the check box is checked on so that the address of server, the port number, a user name, and a password can be set.
- the search key 901 is displayed in a pull-down menu, and the gene name 408 or the accession number 409 in Fig. 4 is displayed in the pull-down menu. That is, the user selects the gene name 408 or the accession number 409 for the search key.
- Fig. 10 illustrates an example of an internal structure of the external database 112.
- the external database 112 downloads periodically data from a plurality of the public databases 113 and 114 storing biological information that are connected via a network.
- Representative public databases include an example below.
- the external database 112 is provided with, for example, a first data table 1000 that stores accession numbers and gene data for each species of organisms. An index search of this data table 1000 is possible by the use of an accession number.
- This data table 1000 includes accession numbers 1001, gene names 1002, positions of probes on the genome sequence 1003, gene sequences 1004, descriptions 1005, definitions 1006, lengths of gene sequences 1007, link IDs (protein IDs) 1008 to databases of proteins that are gene products, and descriptions 1009 of proteins.
- the external database 112 is provided with, for example, a second data table 1010 that stores probe positions on genome sequences and genome sequence data for each species of organisms.
- An index search of this data table 1010 is possible by the use of a probe position on a genome sequence.
- positions on chromosomes of genome sequence 1011, genome sequence 1012, numbers of chromosomes 1013, lengths of short arms 1014, and lengths of long arms 1015 of the chromosomes are stored.
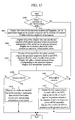
- step 703 in Fig. 7 The details of the step 703 in Fig. 7 are explained with reference to Fig. 11. As described above, whether or not the information 412 to 414 and 501 to 519 concerning the DNA chip A is stored in the DNA chip database 100 is judged before executing the splice variant display program. When the information has not been stored, it is extracted from the external database 112. Accordingly, when the information 412 to 414 and 501 to 519 concerning the DNA chip A has already been stored in the DNA chip database 100, the process of the steps 702 to 704 in Fig. 7 is not performed.
- Step 1100, step 1101, and step 1106 indicate conditions under which a search process is performed for all probes from the first to the Nth probe sequences.
- the search process from steps 1102 to 1105 is performed for each probe. The contents of the steps from 1102 to 1105 are explained below.
- the first data table 1000 in the external database 112 is searched using the search key 408 or 409 and the probe sequence 411.
- the probe position 1003 on the genome sequence is obtained, it is stored in the probe position 412 on the genome sequence in Fig. 4.
- the accession number 409 is chosen as a search key.
- the probe position 1003 in the same row is stored in the probe position 412 on the genome sequence in Fig. 4.
- step 1103 the genome sequence in the same position as the probe position 412 is searched from the second data table 1010 of the external data base 112 by using the probe sequence 411 as a query sequence.
- multiple alignments are performed with the found sequence as a subject sequence.
- the probe position on the genome sequence (S(i), E(i)) (1 ⁇ i ⁇ N) is determined in step 1104.
- S(i) is stored in the start position 413 of the probe sequence on the genome sequence in Fig. 4
- E(i) is stored in the end position 414 in Fig. 4.
- splice variant search is carried out in step 1105. The details are explained with reference to Fig. 12.
- step 1200 a search key and a search subject sequence are set.
- the accession number 409 is set for the search key
- the column of the accession numbers 1001 of the first data table 1000 in the external database 112 shown in Fig. 10 is searched, and the gene sequence 1004 in the row corresponding to the appropriate accession number is set as a query sequence.
- the gene name 408 is set for the search key
- the column of the gene names 1002 of the first data table 1000 in the external database 112 shown in Fig. 10 is searched, and the gene sequence 1004 in the row corresponding to the appropriate gene name is set as a query sequence. All of the gene sequences 1004 registered in the first data table 1000 of the external data base 112 become subject sequences.
- step 1201 BLAST search is performed for all of the gene sequences that become subject sequences, and the candidates for splice variants that hybridize to the probe are searched.
- Steps 1202, 1203, and 1206 indicates conditions under which M pieces of acceptable base sequences that meet the conditions are extracted from the BLAST search results and all of the extracted base sequences from the first to the M-th pieces are subjected to search process without exception.
- the search process from the step 1204 to 1205 is performed for each base sequence. The process contents of the steps 1204 and 1205 are described below.
- the detailed information on the M pieces of the base sequences are first obtained from the items 1001 to 1009 of the first data table 1000 in the external database 112 shown in Fig. 10, and these are stored in the items 501 to 508 in Fig. 5.
- the M pieces of the base sequences to be processed are used as query sequences.
- All genome sequences of the second data table 1010 in the external database 112 are used as subject sequences.
- BLAST search is performed.
- the process of the BLAST search program in the steps 1201 and 1205 is explained with reference to Fig. 13.
- conditions for the program are set.
- the program to be executed is BLASTN, the word size is 11, and the matrix is BLOSUM 62. However, these conditions are allowed to be varied.
- the step 1208 shows the condition under which the results of the BLAST search are registered in the DNA chip database 100. In this instance, when subject sequences registered in the DNA chip database 100 are M pieces and when effective results are obtained by examining the results from L pieces of the subject sequences, the subject sequences are registered in the DNA chip database 100.
- step 1209 the BLAST search program is executed, and the positions of a query sequence relative to the subject sequence (S(i), E(i)) (1 ⁇ i ⁇ N) are determined.
- step 1210 the positions of the subject sequence relative to the query sequence (s(i), e(i)) (1 ⁇ i ⁇ N) are determined.
- step 1211 E-Value and Score are calculated, and Length, Strand, and Identities are obtained. Only when the calculated E-Value is not larger than one, the information is stored in the DNA chip database 100 in step 1212.
- step 1213 a BLAST search ID 509 is given to the BLAST search results, and the search results are stored in the items 511 to 519 in Fig. 5.
- S(i) is stored in the start position 511 of the gene sequence, E(i) in the end position 512 of the gene sequence, s(i) in the start position 513 of the genome sequence, and e(i) in the end position 514 of the genome sequence. Then, the next subject sequence is examined.
- Fig. 14 represents a process flow of the step 705 in Fig. 7.
- the step 705 is executed by the chromosome map display program 109.
- the name of the data (hybridization ID and experiment name) designated as display data is displayed in a tabular form in step 1300. That is, a list 1500 of the display data in Fig. 16 is displayed.
- the selected data 1501 and 1502 are displayed. It is possible to select a plurality of data.
- step 1301 whether or not a different probe ID for the same probe position on the genome sequence exists is judged.
- the process is advanced to step 1302, and an average value of ratios (intensity) of plural probe IDs is determined as an expression value of the probe position.
- the process is advanced to step 1303, and the expression level corresponding to the probe position is determined on the basis of expression data values of the selected data.
- the expression level is determined on the basis of expression data values of the selected data.
- a chromosomal map is displayed based on the total number of chromosomes 415, the lengths of short arm of chromosomes 416, and the lengths of long arm of chromosomes 417.
- expression levels are displayed in the probe positions on each chromosome in step 1305. Expression levels are expressed in three colored levels; red for maximal expression value, black for median expression value, and green for minimal expression value. In this way, a chromosomal map 1501 in Fig. 16 can be depicted graphically.
- Fig. 15 represents a process flow of the step 706 in Fig. 7.
- the step 705 is executed by the splice variant display program 107.
- the screen shown in Fig. 16 has been displayed on the display device 101 as a premise of executing the splice variant display program 107. Accordingly, Fig. 16 is referred to when needed.
- step 1400 the user clicks on a chromosome 1504 in the chromosome map 1501 with the input devices 102 and 103, and makes it selected.
- an operation of the splice variant display program 107 is started.
- step 1401 the chromosome number and organism 1506 are displayed, and the genome sequence 1511 in a certain length of the genome is displayed in a strip shape. Further, sequence numbers 1507 and 1510 of the genome sequence are displayed to specify clearly the display range of the genome.
- step 1402 the probe position on the genome sequence is displayed.
- the start position 1508 and the end position 1509 on the sequence corresponding to the probe position are displayed.
- a probe ID 1513 is displayed at the probe position, and expression data 1514 is displayed as numerical values and in colors.
- step 1403 the candidates for splice variants that hybridize to the probe are displayed. Based on BLAST search results of the probe, only the specified sequences (mRNA and EST) 1515 are displayed. Exon portions 1517 and intron portions 1516 of each sequence are displayed such that the positions of the splice variants corresponding to the genome sequence can be seen. In addition, when there is information on protein that is the translation product of the gene in protein databases, link information 1519 is displayed.
- step 1404 When the user selects the probe position 1512 or the probe ID 1513 on the screen shown in Fig. 16 in step 1404, the detailed information 1600 on the probe shown in Fig. 17 is displayed on a different window in step 1406.
- step 1405 when the user selects the sequence (mRNA or EST) 1515 in the splice variant display 1520 on the screen shown in Fig. 16, the detailed information 1700 on the splice variant shown in Fig. 18 is displayed on a different window in step 1407.
- Fig. 16 represents a list of the display data 1500, a chromosome map 1510 and the splice variant display 1520 which were obtained by the process in the steps 704 and 705 in Fig. 7.
- the list of the display data 1500 and the chromosome map 1510 are displayed when the process in Fig. 14 is performed.
- the list of the display data 1500 displays the hybridization ID 1501 and the experiment name 1502 that have been predetermined by the user on the display chip 801 and the display data 802 in the setting dialog 800 shown in Fig 8. In the example illustrated, three hybridization IDs 1503 are selected and displayed.
- the chromosomes 1504 and chromosome numbers 1505 are displayed. Since the number of chromosomes and the lengths of short arm and long arm differ depending on species of organisms, the chromosomes 1504 are depicted graphically based on the information 415 to 417 of an organism. Expression levels in each position on the genome are calculated from the process in Fig 14 using the DNA chip data selected on the list of display data 1500. The expression levels are graphically displayed in colors; red for maximum values, black for median values, and green for minimum values.
- the splice variant display 1520 displays the chromosome selected from the chromosome map 1510.
- the chromosome number and organism 1506, and the genome sequence 1511 in a certain genome length are displayed in a strip shape.
- the sequence numbers (100) 1507 and (3280) 1510 of the genome sequence to indicate the display range of the genome are displayed.
- the probe position 1512 on the genome sequence is displayed, and the start number 1508 and the end number 1509 on the sequence are displayed.
- the probe ID 1513 and the expression data 1514 are displayed.
- the expression data 1514 consists of expression ratios and color display to represent their magnitudes.
- the color display is shown in red for a maximum value, in black for a median value, and in green for a minimum value.
- three data have been selected on the list of display data 1500, and therefore three kinds of expression data are displayed.
- Each value represents an expression ratio and displayed in color according to the magnitude of the expression ratios, where the maximum expression value is in red, the median value in black, and the minimum value in green.
- the splice variant display 1520 includes the specified sequences (mRNA and EST) 1515 obtained from BLAST search results of each probe.
- the exon portions 1517 and the intron portions 1516 for the sequences of each splice variant are displayed so as to correspond to the genome sequence 1511.
- the link information 1519 is displayed.
- the length of the genome sequence displayed on one screen can be adjusted. Further, the display portion of the screen can be shifted toward the right direction or the left direction by clicking on the go button 1520.
- a screen 1600 is displayed by clicking on the probe position 1512 or the probe ID 1513 on the splice variant display 1502 in Fig. 16.
- This screen 1600 includes a probe ID 1601, a probe sequence 1602, an accession number 1603, a gene name 1604, and a description 1605. These pieces of information can be obtained from the input data stored in the items 407 to 411 shown in Fig. 4.
- expression data 1606 of the selected data is displayed in a tabular form.
- the expression data 1606 includes an experiment name 1607 of the selected data, expression values 1608 and 1609, and an expression ratio 1610.
- the expression data 1606 is obtained from the input data stored in the items 404 to 406 shown in Fig. 4.
- FIG. 18 An example of a screen to display the results of BLAST search for candidates for splice variants (mRNA or EST sequence) is explained with reference to Fig. 18.
- a screen 1700 is displayed by clicking on the sequence (mRNA or EST sequence) 1515 on the splice variant display 1502 in Fig. 16.
- Basic information such as an accession number 1701, a definition of mRNA 1702, a protein ID 1703, and a protein definition 1704 is displayed. These pieces of information are obtained from the data stored in the items 501, 502, 507, and 508 of the DNA chip database 100 shown in Fig. 5.
- a BLAST search result is displayed. That is, a sequence length 1705 of the query sequence (mRNA in this case), a score 1706, identities 1707 which represent how much the subject sequence has matched the query sequence, and strand 1708 that is the direction of the subject sequence with respect to the query sequence are displayed. These data are obtained from the data stored in the items 515 to 518 of the DNA chip database 100 shown in Fig. 5.
- results 1709 and 1710 that represent how much the mRNA sequence and the genome sequence match each other are displayed. These results 1709 and 1710 are obtained from the data stored in the items 511 to 514 of the DNA chip database 100 shown in Fig. 5. By aligning two sequences with each other in this way, the degree of matching can be visually viewed.
- This display method is similar to that of BLAST search result of NCBI.
- an exon sequence (mRNA fragment) 1712 in a genome sequence 1711 is displayed. The exon portion is displayed by half-tone dot meshing of a portion of the genome sequence. Furthermore, sequence numbers 1713 of the genome sequence are displayed.
Abstract
Description


Claims (29)
- A data processing and display method for gene expression analysis system, comprising the steps of:inputting data of hybridization experiments carried out using a DNA chip provided with predetermined probe sequences; displaying graphically a specified length of a genome sequence including display of the position of any one of the probe sequences; anddisplaying candidates for splice variants hybridizing to the probe sequence so as to correspond to the genome sequence.
- The data processing and display method for gene expression analysis system according to claim 1, wherein the step of displaying the genome sequence includes displaying the specified length of the genome sequence in a strip shape and the position of the probe sequence on the genome sequence.
- The data processing and display method for gene expression analysis system according to any of the preceding claims, wherein the step of displaying the genome sequence further includes displaying a chromosome number, an organism, position numbers of the start position and the end position of the genome sequence, position numbers corresponding to the start position and the end position of the probe sequence on the genome sequence, and an identification number of the probe sequence.
- The data processing and display method for gene expression analysis system according to any of the preceding claims, wherein the step of displaying the genome sequence includes displaying expression values resulting from hybridization as numerals and in colors.
- The data processing and display method for gene expression analysis system according to claim 4, wherein the step of displaying the genome sequence includes the step of determining an average expression value when there are a plurality of expression values resulting from hybridization and an average expression value for expression values of a plurality of different probes when said probes are located in the same position on the genome sequence.
- The data processing and display method for gene expression analysis system according to any of the preceding claims, wherein the step of displaying candidates for splice variants includes displaying mRNA sequences and EST sequences of the candidates for splice variants and displaying intron sequences and exon sequences of the candidates for the splice variants.
- The data processing and display method for gene expression analysis system according to any of the preceding claims, wherein the step of displaying candidates for splice variants includes compressing lengths of intron sequences for display such that the lengths of the intron sequences become relatively shorter than the lengths of exon sequences.
- The data processing and display method for gene expression analysis system according to any of the preceding claims, wherein the step of displaying candidates for splice variants includes displaying link information that serves as information source concerning translation products of mRNA sequences and EST sequences of the candidates for the splice variants.
- The data processing and display method for gene expression analysis system according to any of the preceding claims, further comprising the step of displaying a chromosome map including chromosomes with respective numbers of which lengths of long and short arms are graphically depicted so as to correspond to the genome sequence.
- The data processing and display method for gene expression analysis system according to claim 9, wherein the step of displaying the chromosome map includes displaying expression values resulting from hybridization on the chromosomes in colors.
- The data processing and display method for gene expression analysis system according to any of the preceding claims, further comprising the step of displaying experiment information that displays hybridization identification information to identify hybridization and experiment identification information to identify the hybridization experiments so as to correspond to the genome sequence.
- The data processing and display method for gene expression analysis system according to claim 11, wherein the step of displaying the genome sequence includes displaying the genome sequence corresponding to the selected hybridization-identification information or experiment-identification information when a command to select one piece of the hybridization-identification information or one piece of the experiment-identification information displayed in the step of displaying experiment information; and the step of displaying candidates for splice variants includes displaying the candidates for the splice variants corresponding to the selected hybridization-identification information or experiment-identification information.
- The data processing and display method for gene expression analysis system according to any of the preceding claims, wherein when a command to select an identification number of the probe sequence displayed in the step of displaying genome sequence is input, the identification number of the probe sequence, the probe sequence, an accession number, a gene name, and a description of the probe are displayed on a different window.
- The data processing and display method for gene expression analysis system according to any of the preceding claims, wherein when a command to select mRNA sequence or EST sequence displayed in the step of displaying candidates for splice variants is input, basic information including an accession number, a definition of the mRNA or EST, a protein identification number, and a protein definition is displayed on a different window.
- The data processing and display method for gene expression analysis system according to claim 14, wherein results of homology search performed based on the basic information are displayed.
- The data processing and display method for gene expression analysis system according to any of the preceding claims, wherein when a command to select mRNA sequence or EST sequence displayed in the step of displaying experiment information is input, information on the DNA chip and hybridization is displayed so as to correspond to the genome sequence.
- The data processing and display method for gene expression analysis system according to any of the preceding claims, wherein the step of displaying the genome sequence includes the step of searching for the position of the probe sequence to search an external database for information on the position of the probe sequence on the genome sequence.
- The data processing and display method for gene expression analysis system according to claim 17, wherein the step of searching for the position of the probe sequence includes searching a local DNA chip database for information on the position of the probe sequence on the genome sequence and further the external database when the information is not stored in the DNA chip database.
- The data processing and display method for gene expression analysis system according to claim 17, wherein the step of searching for the position of the probe sequence includes storing the information on the position of the probe sequence on the genome sequence extracted from searching the external database in the local DNA chip database.
- The data processing and display method for gene expression analysis system according to claim 17, wherein the step of searching for the position of the probe sequence includes the step of extracting information on the position of the probe sequence from gene information (mRNA, EST) by searching the external database using annotation information of the probe as a search key and determining, using all sequences of probes on a DNA chip as query sequences and the genome sequence in the same position as that of the probe as a subject sequence, the positions of the probes on the genome sequence by performing multiple alignments.
- The data processing and display method for gene expression analysis system according to claim 17, wherein the step of searching for the position of the probe sequence includes the step of performing a search by homology search program using a gene (mRNA) on a search key as a query sequence and all mRNA and EST sequences of an organism to be analyzed in the external database as subject sequences; and the step of performing a search by the homology search program using an obtained mRNA or EST as a query sequence and the genome sequence of the organism to be analyzed in the external database as a subject sequence.
- The data processing and display method for gene expression analysis system according to any of the preceding claims, wherein the step of displaying candidates for splice variants includes the step of searching for splice variants to search an external database for the candidates for the splice variants.
- The data processing and display method for gene expression analysis system according to claim 22, wherein the step of searching for splice variants includes storing information on the candidates for the splice variants extracted from searching the external database in a local DNA chip database.
- The data processing and display method for gene expression analysis system according to claim 22, wherein the step of searching for splice variants includes searching for the candidates for the splice variants using homology search program.
- The data processing and display method for gene expression analysis system according to claim 22, wherein the step of searching for splice variants includes the step of executing a program with homology search program between base sequences according to conditions of predetermined parameters using the entire database sequences to be searched as subject sequences; and the step of storing, in a DNA chip database, results obtained from determining the position of a query sequence with respect to a subject sequence, determining the position of the subject sequence with respect to the query sequence, and selecting calculated homology search outcomes.
- The data processing and display method for gene expression analysis system according to claim 9, wherein the step of displaying a chromosome map includes the step of searching for chromosomes to search an external database for information on the chromosomes.
- The data processing and display method for gene expression analysis system according to claim 26, wherein the step of searching for chromosomes includes storing the information on the chromosomes extracted from searching the external database in a local DNA chip database.
- The data processing and display method for gene expression analysis system according to any of the preceding claims, further comprising the step of preprocessing and normalization to perform preprocessing and normalization of the data; and the step of statistical analysis to analyze the data statistically.
- A gene expression analysis system comprising:wherein the step of statistical analysis to analyze the data statistically is provided.a data input unit that inputs data concerning hybridization experiments carried out using DNA chips with predetermined probe sequences;a preprocessing and normalization unit that performs preprocessing and normalization of the data;a genome sequence display processing unit that generates data for displaying graphically a specified length of a genome sequence that includes displaying the position of any one of the probe sequences; anda display unit for candidates for splice variants that generates data to display the candidates for splice variants hybridizing to any one of the probe sequences so as to correspond to the genome sequence;
Applications Claiming Priority (2)
| Application Number | Priority Date | Filing Date | Title |
|---|---|---|---|
| JP2004100783A JP2005284964A (en) | 2004-03-30 | 2004-03-30 | Method for displaying data and process in system for analyzing gene manifestation as well as system for analyzing gene expression |
| JP2004100783 | 2004-03-30 |
Publications (2)
| Publication Number | Publication Date |
|---|---|
| EP1583016A2 true EP1583016A2 (en) | 2005-10-05 |
| EP1583016A3 EP1583016A3 (en) | 2006-05-10 |
Family
ID=34879997
Family Applications (1)
| Application Number | Title | Priority Date | Filing Date |
|---|---|---|---|
| EP05004041A Withdrawn EP1583016A3 (en) | 2004-03-30 | 2005-02-24 | Data processing and display method for gene expression analysis system and gene expression analysing system |
Country Status (3)
| Country | Link |
|---|---|
| US (1) | US20050221353A1 (en) |
| EP (1) | EP1583016A3 (en) |
| JP (1) | JP2005284964A (en) |
Cited By (3)
| Publication number | Priority date | Publication date | Assignee | Title |
|---|---|---|---|---|
| CN102867134A (en) * | 2012-08-16 | 2013-01-09 | 盛司潼 | System and method for splicing gene sequence fragments |
| CN105389481A (en) * | 2015-12-22 | 2016-03-09 | 武汉菲沙基因信息有限公司 | Method for detecting variable spliceosome in third generation full-length transcriptome |
| CN116705175A (en) * | 2023-06-08 | 2023-09-05 | 南京农业大学 | Cross-species comparative genomics database and construction and analysis method thereof |
Families Citing this family (4)
| Publication number | Priority date | Publication date | Assignee | Title |
|---|---|---|---|---|
| JP2008027244A (en) * | 2006-07-21 | 2008-02-07 | Univ Of Tokyo | Disease-specific selective splicing identification method based on exon array expression profile |
| WO2012033961A2 (en) * | 2010-09-09 | 2012-03-15 | Abbott Laboratories | Systems and methods for displaying molecular probes and chromosomes |
| CN102521529A (en) * | 2011-12-09 | 2012-06-27 | 北京市计算中心 | Distributed gene sequence alignment method based on Basic Local Alignment Search Tool (BLAST) |
| CN103186716B (en) * | 2011-12-29 | 2017-02-08 | 上海生物信息技术研究中心 | Metagenomics-based unknown pathogeny rapid identification system and analysis method |
Citations (2)
| Publication number | Priority date | Publication date | Assignee | Title |
|---|---|---|---|---|
| US20030100995A1 (en) * | 2001-07-16 | 2003-05-29 | Affymetrix, Inc. | Method, system and computer software for variant information via a web portal |
| JP2003256434A (en) * | 2002-02-28 | 2003-09-12 | Hitachi Ltd | Splice variant comparison and display method |
-
2004
- 2004-03-30 JP JP2004100783A patent/JP2005284964A/en not_active Withdrawn
-
2005
- 2005-02-16 US US11/059,468 patent/US20050221353A1/en not_active Abandoned
- 2005-02-24 EP EP05004041A patent/EP1583016A3/en not_active Withdrawn
Patent Citations (2)
| Publication number | Priority date | Publication date | Assignee | Title |
|---|---|---|---|---|
| US20030100995A1 (en) * | 2001-07-16 | 2003-05-29 | Affymetrix, Inc. | Method, system and computer software for variant information via a web portal |
| JP2003256434A (en) * | 2002-02-28 | 2003-09-12 | Hitachi Ltd | Splice variant comparison and display method |
Non-Patent Citations (3)
| Title |
|---|
| KIM HEENAM ET AL: "Gene expression analyses of Arabidopsis chromosome 2 using a genomic DNA amplicon microarray." GENOME RESEARCH. MAR 2003, [Online] vol. 13, no. 3, March 2003 (2003-03), pages 327-340, XP002372332 ISSN: 1088-9051 Retrieved from the Internet: URL:http://www.genome.org/cgi/reprint/13/3 /327> [retrieved on 2006-03-15] * |
| PATENT ABSTRACTS OF JAPAN vol. 2003, no. 12, 5 December 2003 (2003-12-05) & JP 2003 256434 A (HITACHI LTD), 12 September 2003 (2003-09-12) * |
| ROBERTS GAVIN C ET AL: "Alternative splicing: combinatorial output from the genome." CURRENT OPINION IN CHEMICAL BIOLOGY. JUN 2002, vol. 6, no. 3, June 2002 (2002-06), pages 375-383, XP002372157 ISSN: 1367-5931 * |
Cited By (6)
| Publication number | Priority date | Publication date | Assignee | Title |
|---|---|---|---|---|
| CN102867134A (en) * | 2012-08-16 | 2013-01-09 | 盛司潼 | System and method for splicing gene sequence fragments |
| CN102867134B (en) * | 2012-08-16 | 2016-05-18 | 盛司潼 | A kind of system and method that gene order fragment is spliced |
| CN105389481A (en) * | 2015-12-22 | 2016-03-09 | 武汉菲沙基因信息有限公司 | Method for detecting variable spliceosome in third generation full-length transcriptome |
| CN105389481B (en) * | 2015-12-22 | 2018-06-29 | 武汉菲沙基因信息有限公司 | The detection method of variable sheer body in a kind of three generations's overall length transcript profile |
| CN116705175A (en) * | 2023-06-08 | 2023-09-05 | 南京农业大学 | Cross-species comparative genomics database and construction and analysis method thereof |
| CN116705175B (en) * | 2023-06-08 | 2023-12-29 | 南京农业大学 | Cross-species comparative genomics database and construction and analysis method thereof |
Also Published As
| Publication number | Publication date |
|---|---|
| JP2005284964A (en) | 2005-10-13 |
| EP1583016A3 (en) | 2006-05-10 |
| US20050221353A1 (en) | 2005-10-06 |
Similar Documents
| Publication | Publication Date | Title |
|---|---|---|
| AU784645B2 (en) | Method for providing clinical diagnostic services | |
| Hamadeh et al. | An overview of toxicogenomics | |
| JP5464503B2 (en) | Medical analysis system | |
| KR101542529B1 (en) | Examination methods of the bio-marker of allele | |
| EP1583016A2 (en) | Data processing and display method for gene expression analysis system and gene expression analysing system | |
| KR101460520B1 (en) | Detecting method for disease markers of NGS data | |
| KR20150024232A (en) | Examination methods of the origin marker of resistance from drug resistance gene about disease | |
| US20090319450A1 (en) | Protein search method and device | |
| US20060122791A1 (en) | Method and apparatus for displaying gene information | |
| US6927779B2 (en) | Web-based well plate information retrieval and display system | |
| US6203990B1 (en) | Method and system for pattern analysis, such as for analyzing oligonucleotide primer extension assay products | |
| CA2974182A1 (en) | Pathology determination assistance device, method, program and storage medium | |
| US9672271B2 (en) | Method for identifying and employing high risk genomic markers for the prediction of specific diseases | |
| EP1798651B1 (en) | Gene information display method and apparatus | |
| EP1722309A1 (en) | Method of normalizing gene expression data | |
| US7031843B1 (en) | Computer methods and systems for displaying information relating to gene expression data | |
| JP4579525B2 (en) | Gene expression data management display method | |
| JP5213009B2 (en) | Gene expression variation analysis method and system, and program | |
| Jabalia | Bioinformatics resources | |
| US7698069B2 (en) | Method for designing primer for realtime PCR | |
| JP2001178463A (en) | Method for extracting similar expression pattern and method for extracting related biopolymer | |
| WO2018088635A1 (en) | Detection of cancer-specific diagnostic markers in genome | |
| Ju et al. | Understanding kidney disease: toward the integration of regulatory networks across species | |
| WO2017205385A1 (en) | Rapid genome identification and surveillance systems | |
| US20030077643A1 (en) | Method for analyzing trait map |
Legal Events
| Date | Code | Title | Description |
|---|---|---|---|
| PUAI | Public reference made under article 153(3) epc to a published international application that has entered the european phase |
Free format text: ORIGINAL CODE: 0009012 |
|
| 17P | Request for examination filed |
Effective date: 20050224 |
|
| AK | Designated contracting states |
Kind code of ref document: A2 Designated state(s): AT BE BG CH CY CZ DE DK EE ES FI FR GB GR HU IE IS IT LI LT LU MC NL PL PT RO SE SI SK TR |
|
| AX | Request for extension of the european patent |
Extension state: AL BA HR LV MK YU |
|
| PUAL | Search report despatched |
Free format text: ORIGINAL CODE: 0009013 |
|
| AK | Designated contracting states |
Kind code of ref document: A3 Designated state(s): AT BE BG CH CY CZ DE DK EE ES FI FR GB GR HU IE IS IT LI LT LU MC NL PL PT RO SE SI SK TR |
|
| AX | Request for extension of the european patent |
Extension state: AL BA HR LV MK YU |
|
| 17Q | First examination report despatched |
Effective date: 20060928 |
|
| AKX | Designation fees paid |
Designated state(s): DE FR GB |
|
| STAA | Information on the status of an ep patent application or granted ep patent |
Free format text: STATUS: THE APPLICATION IS DEEMED TO BE WITHDRAWN |
|
| 18D | Application deemed to be withdrawn |
Effective date: 20070208 |