EP1536729B1 - Monitoring blood glucose including convenient display of measurement values and averages - Google Patents
Monitoring blood glucose including convenient display of measurement values and averages Download PDFInfo
- Publication number
- EP1536729B1 EP1536729B1 EP03749508A EP03749508A EP1536729B1 EP 1536729 B1 EP1536729 B1 EP 1536729B1 EP 03749508 A EP03749508 A EP 03749508A EP 03749508 A EP03749508 A EP 03749508A EP 1536729 B1 EP1536729 B1 EP 1536729B1
- Authority
- EP
- European Patent Office
- Prior art keywords
- blood glucose
- glucose level
- average
- day
- user input
- Prior art date
- Legal status (The legal status is an assumption and is not a legal conclusion. Google has not performed a legal analysis and makes no representation as to the accuracy of the status listed.)
- Expired - Lifetime
Links
Images


Classifications
-
- A—HUMAN NECESSITIES
- A61—MEDICAL OR VETERINARY SCIENCE; HYGIENE
- A61B—DIAGNOSIS; SURGERY; IDENTIFICATION
- A61B5/00—Measuring for diagnostic purposes; Identification of persons
- A61B5/74—Details of notification to user or communication with user or patient ; user input means
- A61B5/742—Details of notification to user or communication with user or patient ; user input means using visual displays
-
- A—HUMAN NECESSITIES
- A61—MEDICAL OR VETERINARY SCIENCE; HYGIENE
- A61B—DIAGNOSIS; SURGERY; IDENTIFICATION
- A61B5/00—Measuring for diagnostic purposes; Identification of persons
- A61B5/145—Measuring characteristics of blood in vivo, e.g. gas concentration, pH value; Measuring characteristics of body fluids or tissues, e.g. interstitial fluid, cerebral tissue
- A61B5/14532—Measuring characteristics of blood in vivo, e.g. gas concentration, pH value; Measuring characteristics of body fluids or tissues, e.g. interstitial fluid, cerebral tissue for measuring glucose, e.g. by tissue impedance measurement
-
- A—HUMAN NECESSITIES
- A61—MEDICAL OR VETERINARY SCIENCE; HYGIENE
- A61B—DIAGNOSIS; SURGERY; IDENTIFICATION
- A61B5/00—Measuring for diagnostic purposes; Identification of persons
- A61B5/68—Arrangements of detecting, measuring or recording means, e.g. sensors, in relation to patient
- A61B5/6801—Arrangements of detecting, measuring or recording means, e.g. sensors, in relation to patient specially adapted to be attached to or worn on the body surface
-
- A—HUMAN NECESSITIES
- A61—MEDICAL OR VETERINARY SCIENCE; HYGIENE
- A61B—DIAGNOSIS; SURGERY; IDENTIFICATION
- A61B5/00—Measuring for diagnostic purposes; Identification of persons
- A61B5/72—Signal processing specially adapted for physiological signals or for diagnostic purposes
- A61B5/7271—Specific aspects of physiological measurement analysis
-
- A—HUMAN NECESSITIES
- A61—MEDICAL OR VETERINARY SCIENCE; HYGIENE
- A61B—DIAGNOSIS; SURGERY; IDENTIFICATION
- A61B5/00—Measuring for diagnostic purposes; Identification of persons
- A61B5/74—Details of notification to user or communication with user or patient ; user input means
- A61B5/7405—Details of notification to user or communication with user or patient ; user input means using sound
-
- A—HUMAN NECESSITIES
- A61—MEDICAL OR VETERINARY SCIENCE; HYGIENE
- A61B—DIAGNOSIS; SURGERY; IDENTIFICATION
- A61B5/00—Measuring for diagnostic purposes; Identification of persons
- A61B5/74—Details of notification to user or communication with user or patient ; user input means
- A61B5/742—Details of notification to user or communication with user or patient ; user input means using visual displays
- A61B5/7445—Display arrangements, e.g. multiple display units
-
- A—HUMAN NECESSITIES
- A61—MEDICAL OR VETERINARY SCIENCE; HYGIENE
- A61B—DIAGNOSIS; SURGERY; IDENTIFICATION
- A61B5/00—Measuring for diagnostic purposes; Identification of persons
- A61B5/74—Details of notification to user or communication with user or patient ; user input means
- A61B5/746—Alarms related to a physiological condition, e.g. details of setting alarm thresholds or avoiding false alarms
-
- A—HUMAN NECESSITIES
- A61—MEDICAL OR VETERINARY SCIENCE; HYGIENE
- A61B—DIAGNOSIS; SURGERY; IDENTIFICATION
- A61B5/00—Measuring for diagnostic purposes; Identification of persons
- A61B5/74—Details of notification to user or communication with user or patient ; user input means
- A61B5/7475—User input or interface means, e.g. keyboard, pointing device, joystick
-
- G—PHYSICS
- G16—INFORMATION AND COMMUNICATION TECHNOLOGY [ICT] SPECIALLY ADAPTED FOR SPECIFIC APPLICATION FIELDS
- G16H—HEALTHCARE INFORMATICS, i.e. INFORMATION AND COMMUNICATION TECHNOLOGY [ICT] SPECIALLY ADAPTED FOR THE HANDLING OR PROCESSING OF MEDICAL OR HEALTHCARE DATA
- G16H10/00—ICT specially adapted for the handling or processing of patient-related medical or healthcare data
- G16H10/60—ICT specially adapted for the handling or processing of patient-related medical or healthcare data for patient-specific data, e.g. for electronic patient records
-
- G—PHYSICS
- G16—INFORMATION AND COMMUNICATION TECHNOLOGY [ICT] SPECIALLY ADAPTED FOR SPECIFIC APPLICATION FIELDS
- G16H—HEALTHCARE INFORMATICS, i.e. INFORMATION AND COMMUNICATION TECHNOLOGY [ICT] SPECIALLY ADAPTED FOR THE HANDLING OR PROCESSING OF MEDICAL OR HEALTHCARE DATA
- G16H40/00—ICT specially adapted for the management or administration of healthcare resources or facilities; ICT specially adapted for the management or operation of medical equipment or devices
- G16H40/60—ICT specially adapted for the management or administration of healthcare resources or facilities; ICT specially adapted for the management or operation of medical equipment or devices for the operation of medical equipment or devices
- G16H40/63—ICT specially adapted for the management or administration of healthcare resources or facilities; ICT specially adapted for the management or operation of medical equipment or devices for the operation of medical equipment or devices for local operation
-
- A—HUMAN NECESSITIES
- A61—MEDICAL OR VETERINARY SCIENCE; HYGIENE
- A61B—DIAGNOSIS; SURGERY; IDENTIFICATION
- A61B2560/00—Constructional details of operational features of apparatus; Accessories for medical measuring apparatus
- A61B2560/04—Constructional details of apparatus
- A61B2560/0475—Special features of memory means, e.g. removable memory cards
-
- A—HUMAN NECESSITIES
- A61—MEDICAL OR VETERINARY SCIENCE; HYGIENE
- A61B—DIAGNOSIS; SURGERY; IDENTIFICATION
- A61B2562/00—Details of sensors; Constructional details of sensor housings or probes; Accessories for sensors
- A61B2562/02—Details of sensors specially adapted for in-vivo measurements
- A61B2562/0295—Strip shaped analyte sensors for apparatus classified in A61B5/145 or A61B5/157
Definitions
- the invention relates generally to blood glucose meters and glucose monitoring for managing diabetes and, more particularly, to presentation of glucose data to a user in a convenient format, including an effective meal average and its constituent values and/or a measure of variability among the constituent values.
- a number of blood glucose monitoring systems are available which generally include a blood glucose meter.
- the blood glucose meter can be configured to receive and read a test strip inserted therein on which a drop of a patient's blood has been deposited, or can be adapted for subcutaneous readings, for example.
- Blood glucose meters generally comprise a memory for storing measured blood glucose values, along with other data such as the corresponding dates and times of day the values were measured. Blood glucose meters are generally also provided with a display screen, and user input buttons with which a user can specify which of the stored values to display.
- Some blood glucose meters also provide statistical data relating to the stored measured blood glucose values such as 7-day, 14-day and 30-day averaging of glucose levels at one or more selected times of day (e.g., breakfast, lunch, dinner and nighttime). Examples of such blood glucose meters are Accu-check meters available from Roche Diagnostics USA and One Touch meters available from LifeScan. These blood glucose meters, however, are disadvantageous because the length of the period of time over which the averages are calculated is too long when a patient is using the averaging to adjust his insulin dosage, and particularly when the current average blood glucose values are too low.
- the Ascensia Dex2 glucose meter available from Bayer Healthcare provides four daily averages, that is, averages of measured blood glucose values taken during a particular period of time such as a two hour window around a selected mealtime.
- No existing blood glucose meter provides an average blood glucose value over a selected bin or period of time, as well as convenient access to the constituent values used to derive the average value and optionally an indication of variability among the constituent values.
- an indication of variability or at least knowledge of constituent values used to derive a mealtime average is important information to have when adjusting insulin dosage.
- Blood glucose monitoring can be combined with a diabetes management system comprising software (e.g., for installation on a personal computer (PC) or personal data assistant (PDA)) for collecting and analyzing meter readings and generating summaries and graphical results (e.g., pie charts, histograms and the like) to assist the patient in understanding trends in their blood glucose levels and insulin regimen.
- PC personal computer
- PDA personal data assistant
- These systems also do not provide a patient with immediate and convenient access to averages of blood glucose levels at a mealtime or during another specified time period and to the constituent levels used to generate these averages.
- the One Touch diabetes management software available from LifeScan can provide mealtime averages in a computer generated logbook table; however, the measured levels from which the averages were calculated are merely provided by a separate glucose tracking time table on a different screen. Accordingly, it is not always clear to a patient as to which values are the constituent values of a particular average. This is disadvantageous when a patient is determining whether an adjustment is needed in his insulin dosage. This problem is illustrated by the following hypothetical situations.
- a lunchtime average was calculated at 180 mg/dl, and the constituent values of the lunchtime average were 162 mg/dl, 204 mg/dl and 174 mg/dl
- a patient could safely increase the breakfast dose of a short acting insulin by a small amount since the constituent values had little variation. If, however, the constituent values varied significantly (e.g., were 75 mg/dl, 297 mg/dl and 168 mg/dl), the patient could not safely increase the breakfast dose of a short acting insulin, not even by a small amount.
- a patient would need to instead decide why there was so much variation, whether it be changes in diet, exercise or stress level.
- US 4,731,726 A discloses a monitor system, which includes means for measuring blood glucose values and for generating glucose data signals. Monitor means are coupled to the measuring means. Patient data can be input and a glucose data signal can be computed in connection with administration treatment for diabetes mellitus.
- US 6,124,134 A discloses a method and apparatus for determining stable and labile glycated compound levels in blood. Electromagnetic energy covering a multiplicity of wavelength bands is directed into a sample volume containing blood.
- US 5,899,855 discloses a modular self-care health monitoring system comprising a microprocessor-based unit such as a video game system of the type that includes switches for controlling device operation and a program cartridge.
- the program cartridge adapts the microprocessor-based unit for operation with a glucose monitor.
- the microprocessor-based unit processes data supplied by the glucose monitor to supply signals for displaying relevant information on a display unit that may be included in the microprocessor-based unit or may be a separate unit such as a television or video display monitor.
- DE 43 15 532 A1 discloses a blood glucose monitor having a data processing unit for visualizing changes in the blood glucose level.
- EP 1 369 688 A2 which is comprised in the state of the art according to Art. 54 (3) EPC, discloses a testing device for testing analyte levels in bodily fluids such as blood glucose.
- a memory is provided for storing data, in particular analyte data related to analyte measurements carried out by the meter and lifestyle data.
- Initiation means are provided for initiating immediate entry of data related to a specific category of lifestyle data.
- Navigation means are provided for entry and navigation of said data and transfer means are provided for transferring said data to said memory.
- a method for annunciating a patient's medical data levels using a medical data level monitoring device comprises the steps of: (1) storing medical data levels with the corresponding dates and times of day the respective medical data levels were taken; (2) calculating an average medical data level from at least a first medical data level and a second medical data level selected from the stored medical data levels; (3) annunciating the average medical data level; (4) receiving a first user input to annunciate the first medical data level; (5) annunciating the first medical data level; (6) receiving a second user input to annunciate the second medical data level; and (7) annunciating the second medical data level.
- the annunciating steps for annunciating the average medical data level, the first medical data level and the second medical data level, respectively, can be performed by displaying them on a display device, or by generating an audible sound via a speaker.
- the medical data levels are blood glucose levels
- the medical data level monitoring device is a blood glucose meter. More than two medical data levels can be used, that is, n medical data levels wherein n is greater than 2.
- a variability indicator indicates the variability between the n medical data levels used to generate the average medical data level.
- the variability indicator is at least one of a scalar value, and a statistical parameter selected from the group consisting of a standard deviation and a coefficient of variance.
- the average medical data level and the constituent values are displayed on a display screen.
- the display screen comprises a first area for displaying one of the average medical data level and the constituent values, and a second area configured to have n indicators corresponding to respective ones of the n medical data levels.
- Each of the n indicators is displayed as a nonflashing item when the first area is displaying the average medical data level.
- the corresponding one of the n indicators is flashed when its corresponding n medical data level is being displayed as one of the constituent values.
- the display screen comprises a third area for displaying a time of day and a date for a corresponding one of the n medical data levels when it is being displayed as a constituent value in the first area.
- calculating the average comprises selecting the stored medical data levels used to determine the average medical data level based on the date and time of day the stored medical data levels were taken.
- a user can define a time period during a day when the average medical data level is desired for that time period on each of a selected number of days (e.g., preferably three days).
- Calculating the average further comprises the steps of: (1) receiving a user input requesting an average medical data level of the time period for a selected number of days beginning with the current day; (2) determining if the time period has been entered or passed on the current day; (3) using a reading of an medical data level taken during the time period for the current day when determining the average medical data level if the time period has been entered or has passed for the current day; and (4) selecting a stored medical data level taken on the previous day when determining the average medical data level if the time period has yet not been entered or passed for the current day.
- the using step (3) further comprises the step of selecting one of the earliest and the most recent of a plurality of readings taken on the current day during the time period based on their respective times of day.
- the selecting step (4) further comprises the step of selecting one of the earliest and the most recent of a plurality of readings taken on the previous day during the time period based on their respective times of day.
- the using step (3) further comprises the step of using a stored medical data level from the previous day if no valid medical data levels are available from the time period for the current day.
- the selecting step (4) further comprises the step of using a stored medical data level from the day before the previous day if no valid medical data levels are available from the time period for the previous day.
- an apparatus for blood glucose monitoring comprises: (1) a reader for measuring a selected blood glucose level for the patient; (2) a memory device for storing a plurality of the blood glucose levels along with their respective dates and time of day they were taken; (3) an annunciator; (4) a user input device; and (5) a processing device connected to the reader, the memory device, the annunciator and the user input device and programmed to calculate an average blood glucose level from at least a first blood glucose level and a second blood glucose level selected from the stored blood glucose levels in the memory device, to annunciate the average blood glucose level via the annunciator, to receive a first user input from the user input device to annunciate the first blood glucose level, to annunciate the first blood glucose level in response to the first user input, to receive a second user input from the user input device to annunciate the second blood glucose level, and to annunciate the second blood glucose level in response to the second user input.
- the programming device is further programmed to select the stored blood glucose levels used to determine the average blood glucose level based on the date and time of day the stored blood glucose levels were taken, and it is operable to allow a user to define a time period during a day when the average blood glucose level is desired for that time period on each of a selected number of days, and the processing device is programmed to receive a user input requesting an average blood glucose level of said time period for a selected number of days beginning with the current day, to use a reading of a blood glucose level taken during the time period for said current day when determining the average blood glucose level if said time period has been entered or has passed for the current day, and to select a stored blood glucose level taken on the previous day when determining the average blood glucose level if said time period has yet not been entered or passed for the current day.
- Fig. 1 is a perspective view of an exemplary blood glucose meter in accordance with an embodiment of the present invention
- Fig. 2 is a block diagram of the blood glucose meter of Fig. 1 ;
- Fig. 3 depicts a display configuration for a blood glucose meter in accordance with an embodiment of the present invention
- Fig. 4 is a flow chart depicting a sequence of operations for selection of effective meal average constituent values in accordance with an embodiment of the present invention
- Fig. 5 is a flow chart depicting a sequence of operations for generating displays to communicate an effective meal average and its constituent values in accordance with an embodiment of the present invention.
- Figs. 6 and 7 illustrate a series of exemplary screens generated by a blood glucose meter in accordance with an embodiment of the present invention.
- a blood glucose meter 100 is provided with advantageous operations, including the determination and display of an effective mealtime average (EMA) or similar average over another user-defined period, the convenient and immediate display of the constituent values used to determine the average, and optional determination and display of variability among the constituent values (e.g., a standard deviation value).
- EMA effective mealtime average
- the blood glucose meter 100 is exemplified by the LogicTM blood glucose monitor and the LatitudeTM diabetes management system available from Becton Dickinson and Company.
- the blood glucose meter 100 of the present invention has a blood glucose sensing area 150 for the monitoring of glucose within a patient.
- Blood glucose sensing area 150 may utilize a variety of well known means for the monitoring of glucose within a patient.
- One method may be the use of a disposable strip with reagents applied thereto for the sensing of glucose within a bodily fluid.
- sensing area 150 could utilize well known non-invasive sensing methods for the determination of glucose within a patient's body. Sensing of glucose by sensing area 150 can be intermittent or continuous.
- Blood glucose meter 100 also can be configured to be wearable by the patient.
- blood glucose meter 100 also has a liquid crystal display (LCD) or other type of display device 160 which communicates data within the blood glucose meter 100 to the patient through a variety of menus programmed within the software/program instructions contained within the microprocessor 170 ( Fig. 2 ) of blood glucose meter 100 or stored in the memory device 190 for execution by the microprocessor 170.
- the meter 100 can annunciate blood glucose values and other information audibly via a speech processing device and speaker.
- the memory device 190 can store the blood glucose values measured by the reader or other sensing device 150, along with the dates and times of day they were measured, the stored blood glucose values that are selected to be constituent values of an average, and calculated values such as the averages and indicators of variability, among other information. It is to be understood that other memory configurations can be used without departing from the scope of the present invention.
- Blood glucose meter 100 also has a variety of input buttons 110, 120, 130 which allow the patient to move through various screens displayed on LCD 160 to view various data within blood glucose meter 100.
- Forward button 110 and backward button 120 allow patients to move forward and backward through the menu screens shown on LCD 160.
- Also shown on blood glucose meter 100 is a memory button 130 which allows the user to enter the various menus generated by the software/program instructions of blood glucose meter 100.
- At least one input button is required; however, alternate embodiments which contain one or more input buttons with different functions are still within the scope of the present invention. Accordingly, a user input device is indicated generally at 180 in Fig. 2 .
- the present invention provides an advantageous presentation of glucose data to a person with diabetes from a glucose meter, monitor or continuous glucose sensor 100 in which an effective meal average (EMA) value is presented, followed by two or more of the individual values (i.e., hereinafter referred to as the constituent values) that make up the effective meal average.
- EMA effective meal average
- the effective meal average is comprised of an average value and its constituent values and/or a measure of the variability of the range.
- the effective meal average encompasses those values that occur at specified times (i.e., herein after referred to as the effective meal average timeframe or EMAT).
- the EMAT can be, for example, one hour before and one hour after a specified meal time, although the length of time before and after the meal could be different (e.g., 30 minutes or up to three hours), or during a specified interval such as from 10 AM to 2 PM.
- the average can also be for a post-meal timeframe.
- the effective meal average is calculated over a limited number of days that occurred previous to the calculation and is preferably calculated over three days, although the calculation can include as many as 13 days.
- the EMA has a minimum number of values that must be obtained within the time and date ranges, which is preferably three values, although the EMA can be based on as few as two values or as many values as were measured during the date range.
- the microprocessor 170 also employs an algorithm for excluding any given reading from the average. For example, patients may not want to include values taken after meals (i.e., post-prandial values) or control solution readings done during the specified time range. Patients can use from one to eight effective meal averages on any given date range, but preferably use four EMAs determined, for example, for the breakfast, lunch, supper and bedtime snack time periods. The additional four averages can be used for post-meal averages and an average in the middle of the night. The effective meal average provides improved feedback data for clinical decisions by patients with diabetes who use insulin and need to alter their dose of insulin.
- a Lunchtime EMA is calculated at 180 mg/dl and displayed on the LCD 160.
- the constituent values of the EMA are 162 mg/dl, 204 mg/dl and 174 mg/dl, which are displayed to the patient on the LCD 160 of the blood glucose meter 100.
- the EMA and the constituent values are preferably displayed via a series screens, each with a respective one of the values, as will be described below in connection with Figs. 6 and 7 . It is to be understood that displays can be generated with different groupings of the EMA and its constituent values and remain within the scope of the present invention. Since the EMA is 180 and the individual values have little variation, at 162, 204 and 174, a patient could safely increase the breakfast dose of a short acting insulin by a small amount, for example, 1 unit.
- a Lunchtime EMA is calculated at 180 mg/dl.
- the constituent values of the EMA are 75 mg/dl, 297 mg/dl and 168 mg/dl which are displayed to the patient on the LCD 160 of the blood glucose meter 100 preferably via a series of screens. Since the EMA is 180 and the individual values have significant variation, at 75, 297 and 168, a patient could not safely increase the breakfast dose of a short acting insulin, even by a small amount such as 1 unit. A patient could then decide why there is so much variation, whether it be changes in diet, exercise or stress level.
- a Lunchtime EMA is calculated at 180 mg/dl.
- the constituent values of the EMA are 162 mg/dl, 204 mg/dl and 174 mg/dl which are displayed to the patient on the LCD 160 of the blood glucose meter 100, along with an EMA indicator (e.g., a standard deviation). Since the EMA is 180 and the individual values have little variation, at 162, 204 and 174, as indicated by the EMA indicator, a patient could safely increase the breakfast dose of a short acting insulin by a small amount, for example, 1 unit.
- a Lunchtime EMA is calculated at 180 mg/dl.
- the constituent values of the EMA are 75 mg/dl, 297 mg/dl and 168 mg/dl which are displayed to the patient on the LCD 160 of the blood glucose meter 100, along with an EMA indicator (e.g., a standard deviation). Since the EMA is 180 and the individual values have great variation, at 75, 297 and 168, as indicated by the EMA indicator, a patient could not safely increase the breakfast dose of a short acting insulin, even by a small amount such as 1 unit. A patient could then decide why there is so much variation, whether it be changes in diet, exercise or stress level.
- the EMA is an array which consists of the average of a series of specific (i.e., with respect to time and other criteria) blood glucose measurements , along with the values which constitute the average.
- the EMA is an average of a series of specific (i.e., with respect to time and other criteria) blood glucose measurements, along with an indicator of the variability of the specific measurements.
- Prior art devices such as the Glucometer DEX2 mentioned in the background section above create averages for specific user settable times, but do not give the patient any indication of the inherent variability of the readings within the specific times.
- the patent is then unable to make clinical decisions based on the data.
- the patient only has an average of the readings of the last 14 days and may make a mistake in judgement with respect to the amount of change of insulin dosage.
- the present invention advantageously communicates the variability dimension of the data.
- the present invention provides an apparatus and a method to present the data in such a format such that the patient has an average of the glucose readings, the constituent values used to generate the average, and optionally an indication of the variability in readings over the period in question (e.g., the effective meal average timeframe).
- the period of data for review is much shorter than existing blood glucose monitoring devices, allowing for a clinical judgement which is based on more recent and relevant data, rather than a running average provided by the existing devices.
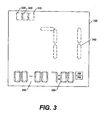
- Fig. 3 depicts an illustrative display configuration for LCD or other display device 160 to display an EMA, or a constituent value or other blood glucose measurement data point, as indicated at 340. Also shown on LCD 160 are first indicator block 310, second indicator block 320, and third indicator block 330. Time value 350 displays the time of the glucose measurement represented by data value 340. A date value can optionally be provided, as indicated at 360. As stated above, it is to be understood that displays can be generated with different groupings of the EMA and its constituent values and remain within the scope of the present invention.
- indicator blocks 310, 320, 330 are all displayed and non-flashing.
- first constituent value of the EMA is displayed as data value 340, as denoted by box 510 in Fig 5
- first constituent value's measured time is displayed as time value 350
- first indicator block 310 is flashing.
- second constituent value of the EMA is displayed as data value 340, as denoted by box 520 in Fig 5
- second constituent value's measured time is displayed as time value 350
- second indicator block 320 is flashing.
- the third constituent value of the EMA is displayed as data value 340, as denoted by box 530 in Fig 5
- the third constituent value's measured time is displayed as time value 350
- third indicator block 330 is flashing.
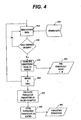
- Fig. 4 is a flowchart depicting a sequence of operations for the selection of EMA constituent values by the microprocessor 170.
- the software/program instructions for the meter 100 enters an EMA calculation mode.
- a single data point is read (step 410) from stored data (step 420) such as data stored in the memory device 190.
- the stored data is preferably an array of values representing blood glucose measurements, and associated time code information for each measurement, and various other flags.
- Each data point is compared to criteria (step 430) for checking the data point for its suitability for use in a specific EMA calculation.
- These criteria can include values and flags corresponding to specific time frames corresponding to the desired EMAT, date information, calibration check information, post-prandial measurement, and specifically user-flagged values, among other criterion.
- the data point is within the EMAT, a pre-prandial measurement, not a calibration check, and not specifically flagged by the user.
- n EMA constituent values are stored to the constituent value buffer 450, where n can be from 2 to 14, for example, and more preferably n is 3.
- the microprocessor 170 executing the software/program instructions calculates population parameters (step 470) of the constituent values within the constituent values buffer 450, and stores the population parameters (step 480) to a population parameters buffer indicated at 490.
- the population parameters buffer 490 contains the average of the constituent values 450.
- Population parameters buffer 490 can additionally contain a standard deviation of the constituent values 450 or another statistical parameter (e.g., scalar value, coefficient of variance, and the like) which represents the variation of the constituent values 450.
- a series of menu screens are preferably displayed by LCD 160 of the blood glucose meter 100.
- the effective mealtime average is communicated to the patient via LCD 160.
- the patient navigates the menus displayed on the LCD 160 by depressing the input buttons 110,120,130.
- the effective meal average screen in Fig 5 is represented by box 500.
- the user can then look at the data values which comprise the effective meal average by depressing backward button 120 to reach effective the meal average first constituent value screen denoted by box 510. If the user depresses the forward button 110, the LCD 160 displays the effective meal average screen 500 again.
- the constituent values can also be displayed substantially simultaneously with the average blood glucose level (e.g., on the same screen), or substantially immediately before and after the average blood glucose level using sequential display screens for respective ones of the average blood glucose level and the constituent values that can be generated in a round robin manner.
- effective meal average calculation and display are enabled when a Setup.Average function is set to 'ON' within the software/program instructions of the meter 100.
- Four effective meal averages corresponding to four effective meal average timeframes are preferably viewed in sequence.
- the time span covered in an effective meal average is defined as the center time of that average, plus or minus one hour.
- a mealtime average whose 'center time' is 7:15AM covers blood glucose readings from 6:15AM to 8:15 AM.
- the center time of the effective meal average timeframes is settable by the user.
- each average is calculated preferably using three readings.
- One reading is selected per day and begins with the current day if the current time has already entered or passed the time span for that time block. If the current time has not yet entered the time span covered in the specified time block (e.g., the EMAT), then the software/program instructions begin with that same time span on the previous day. If there is more than one reading within the time span on a given day, the software/program instructions select the most recent unmarked reading. In an alternative embodiment, the earliest reading is selected. Marked readings are excluded from averages such as control solution readings, which are marked with a "C" at 350 ( Fig. 3 ) of the LCD 160, as shown in Fig. 6 .
- Other marked readings to be excluded are marked with an "*". If, on a given day, no readings are found within the time span, the software/program instructions for the meter 100 searches the readings from the previous day. The software/program instructions go back a maximum of five days from the first and most recent time span searched. If fewer than three valid readings are found, the software/program instructions control the display device 160 to appear as "---" for that meal time average, indicating that there were not enough readings available to calculate an average from that time block. If there are three valid readings, the meal time average is calculated.
- the meter 100 can display a standard deviation or other statistical parameter of the EMA data to the patient to indicate the variability of the average for the effective meal average timeframe in question.
- This indicator of variability is preferably referred to as an EMA indicator.
- Such statistical parameters can be either a standard parameter (e.g., a standard deviation, coefficient of variance, and the like), or a scalar value (e.g., a scaled value from 1 to 10 etc.), which represents the variability inherent in the data.
- Screen 0.0 depicts the different possible screen areas that are selectively populated with information, as illustrated throughout Figs. 6 and 7 , depending on the mode selected by the user.
- the series of display screens indicated generally at 602 in Fig. 6 are for viewing individual blood glucose readings and are accessed by depressing the memory button 130.
- screen 3.1 is the most recent glucose reading.
- the forward and backward keys 110 and 120 can be used to navigate among the most recent readings (e.g., 30 readings) in the memory device 190.
- Screens 3.2 and 3.3 illustrate marked readings that are not used for averaging, as indicated by the "*" and the "C" in their respective screens.
- the series of display screens indicated generally at 604 in Fig. 6 are for viewing insulin injections and are preferably only visible when insulin is set to be "ON" during set-up of the meter 100. They can be accessed, for example, by depressing the memory button 130 when the current glucose reading is displayed.
- the large numerals are indicated along with a syringe icon, and alternate between displaying the pen number and the insulin dose, which is also indicated along with a "U”.
- the date and time of day of the injection are also indicated.
- the memory button 130 can be depressed again to obtain a 7-day average reading, and depressed again to obtain a 14-day average reading.
- Screen 3.14 provides a 7-day average, and includes the reading in units mg/dl and the indication of "7 day”.
- Screen 3.15 provides a 14-day average, and includes the reading in units mg/dl and the indication of "14 day”.
- the memory button 130 can be depressed again to obtain a time block average (e.g., an EMA).
- a first screen 3.16 provides a breakfast EMA.
- the forward and backward keys 110 and 120 allow the user to view the constituent values on the screens 3.17 through 3.19, which represent valid data taken over the most recent three days (e.g., Feb. 10, 11 and 12) and during the breakfast EMAT for each day.
- Another depression of the memory button 130 provides a lunchtime EMA screen 3.20.
- the forward and backward keys 110 and 120 allow the user to view the constituent values on the screens 3.21 through 3.23, which represent valid data taken over the most recent three days (e.g., Feb. 9, 10 and 11) and during the lunchtime EMAT for each day.
- Another depression of the memory button 130 provides a dinnertime EMA screen 3.24.
- the forward and backward keys 110 and 120 allow the user to view the constituent values on the screens 3.25 through 3.27, which represent valid data taken over the most recent three days (e.g., Feb. 9, 11 and 12) and during the dinnertime EMAT for each day.
- the microprocessor 170 is programmed to use data from the previous day, Feb. 9.
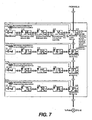
- another depression of the memory button 130 provides a nighttime EMA screen 3.28.
- the forward and backward keys 110 and 120 allow the user to view the constituent values on the screens 3.29 through 3.31, which represent valid data taken over the most recent three days (e.g., Feb. 8, 10 and 12) and during the nighttime EMAT for each day.
- the toggling between viewing modes e.g., individual blood glucose readings, insulin injection readings, 7-day average reading, 14-day average reading, and time block averages (e.g., EMAs) by depressing the memory button can be ordered differently than shown in Figs. 6 and 7 , or include more or fewer information viewing modes.
- the meter 100 can be provided with different user buttons or other input devices that allow direct access to any of the information viewing modes (e.g., selection from a menu of information display options provided on the LCD 160).
- This function displays meal bar annunciators.
- This function displays the Time Block's center time and average. If the average cannot be calculated, the meter displays '---'.
- This function displays an older glucose record used for averaging or the time block average. If the average cannot be calculated, the meter displays '---'. Action Current Display Next Display Left arrow Button press '---' (Can't calculate average) No change Time Block Average Glucose Record No. 1 Glucose Record No. 1 Glucose Record No. 2 • Glucose Record No. 2 Glucose Record No. 3 Glucose Record No. 3 'End' 'End' Time Block Average
- This function displays a newer glucose record used for averaging or the time block average. If the average cannot be calculated, the meter displays '---'. Action Current Display Next Display Right arrow Button press '---' (Can't calculate average) No change Time Block Average No change Glucose Record No. 1 Time Block Average Glucose Record No. 2 Glucose Record No. 1 Glucose Record No. 3 Glucose Record No. 2 'End' Glucose Record No. 3
- the meter enters this state when Setup.Average is ON, the meter is in the 14-day Average state and the user held the Mode button less than 1.5 seconds.
- This function displays an older glucose record used for averaging or the time block average. If the average cannot be calculated, the meter displays '---'. Call L UiMealTimeAverage(0), to display older averaging glucose record
- This function displays a newer glucose record used for averaging or the time block average. If the average cannot be calculated, the meter displays '---' .
- the meter enters this state when the meter is in the A1 Time Block Average state and the user held the Mode button less than 1.5 seconds.
- This function displays the time block average. If the average cannot be calculated, the meter displays '---'.
- This function displays an older glucose record used for averaging or the time block average. If the average cannot be calculated, the meter displays '---'.
- This function displays a newer glucose record used for averaging or the time block average. If the average cannot be calculated, the meter displays '---'.
- the meter enters this state when the meter is in the A2 Time Block Average state and the user held the Mode button less than 1.5 seconds.
- This function displays the time block average. If the average cannot be calculated, the meter displays '---'.
- This function displays an older glucose record used for averaging or the time block average. If the average cannot be calculated, the meter displays '---'.
- This function displays a newer glucose record used for averaging or the time block average. If the average cannot be calculated, the meter displays '---'.
- the meter enters this state when the meter is in the A3 Time Block Average state and the user held the Mode button less than 1.5 seconds. In this state, if the Mode button is held less than 1.5 seconds, the state machine resets to the Individual Blood Glucose Results Review state.
- This function displays the time block average. If the average cannot be calculated, the meter displays '---'.
- This function displays an older glucose record used for averaging or the time block average. If the average cannot be calculated, the meter displays '---'.
- This function displays a newer glucose record used for averaging or the time block average. If the average cannot be calculated, the meter displays '---'.
Abstract
Description
- The invention relates generally to blood glucose meters and glucose monitoring for managing diabetes and, more particularly, to presentation of glucose data to a user in a convenient format, including an effective meal average and its constituent values and/or a measure of variability among the constituent values.
- A number of blood glucose monitoring systems are available which generally include a blood glucose meter. The blood glucose meter can be configured to receive and read a test strip inserted therein on which a drop of a patient's blood has been deposited, or can be adapted for subcutaneous readings, for example.
- Blood glucose meters generally comprise a memory for storing measured blood glucose values, along with other data such as the corresponding dates and times of day the values were measured. Blood glucose meters are generally also provided with a display screen, and user input buttons with which a user can specify which of the stored values to display.
- Some blood glucose meters also provide statistical data relating to the stored measured blood glucose values such as 7-day, 14-day and 30-day averaging of glucose levels at one or more selected times of day (e.g., breakfast, lunch, dinner and nighttime). Examples of such blood glucose meters are Accu-check meters available from Roche Diagnostics USA and One Touch meters available from LifeScan. These blood glucose meters, however, are disadvantageous because the length of the period of time over which the averages are calculated is too long when a patient is using the averaging to adjust his insulin dosage, and particularly when the current average blood glucose values are too low.
- The Ascensia Dex2 glucose meter available from Bayer Healthcare provides four daily averages, that is, averages of measured blood glucose values taken during a particular period of time such as a two hour window around a selected mealtime. No existing blood glucose meter, however, provides an average blood glucose value over a selected bin or period of time, as well as convenient access to the constituent values used to derive the average value and optionally an indication of variability among the constituent values. As will be described in more detail below, an indication of variability or at least knowledge of constituent values used to derive a mealtime average, is important information to have when adjusting insulin dosage.
- Blood glucose monitoring can be combined with a diabetes management system comprising software (e.g., for installation on a personal computer (PC) or personal data assistant (PDA)) for collecting and analyzing meter readings and generating summaries and graphical results (e.g., pie charts, histograms and the like) to assist the patient in understanding trends in their blood glucose levels and insulin regimen. These systems, however, also do not provide a patient with immediate and convenient access to averages of blood glucose levels at a mealtime or during another specified time period and to the constituent levels used to generate these averages. For example, the One Touch diabetes management software available from LifeScan can provide mealtime averages in a computer generated logbook table; however, the measured levels from which the averages were calculated are merely provided by a separate glucose tracking time table on a different screen. Accordingly, it is not always clear to a patient as to which values are the constituent values of a particular average. This is disadvantageous when a patient is determining whether an adjustment is needed in his insulin dosage. This problem is illustrated by the following hypothetical situations.
- By way of an example, if a lunchtime average was calculated at 180 mg/dl, and the constituent values of the lunchtime average were 162 mg/dl, 204 mg/dl and 174 mg/dl, a patient could safely increase the breakfast dose of a short acting insulin by a small amount since the constituent values had little variation. If, however, the constituent values varied significantly (e.g., were 75 mg/dl, 297 mg/dl and 168 mg/dl), the patient could not safely increase the breakfast dose of a short acting insulin, not even by a small amount. A patient would need to instead decide why there was so much variation, whether it be changes in diet, exercise or stress level. Thus, a need exists for a glucose monitoring device that provides a patient with convenient and immediate access to glucose level averages over relatively short periods of time and to the constituent values that generated the averages in order to make meaningful and timely decisions regarding his insulin regimen and other diabetes management techniques.
US 4,731,726 A discloses a monitor system, which includes means for measuring blood glucose values and for generating glucose data signals. Monitor means are coupled to the measuring means. Patient data can be input and a glucose data signal can be computed in connection with administration treatment for diabetes mellitus.
US 6,124,134 A discloses a method and apparatus for determining stable and labile glycated compound levels in blood. Electromagnetic energy covering a multiplicity of wavelength bands is directed into a sample volume containing blood. Portions of the energy representative of both resource energy and energy after interacting with material within the sample volume are collected. Selected groups of data signals are processed in accordance with chemometric models developed from analysis of such data signals together with known values of the analytes. The analyte signals may be stored and displayed in a form suitable for medical use.
US 5,899,855 discloses a modular self-care health monitoring system comprising a microprocessor-based unit such as a video game system of the type that includes switches for controlling device operation and a program cartridge. The program cartridge adapts the microprocessor-based unit for operation with a glucose monitor. The microprocessor-based unit processes data supplied by the glucose monitor to supply signals for displaying relevant information on a display unit that may be included in the microprocessor-based unit or may be a separate unit such as a television or video display monitor.
DE 43 15 532 A1 discloses a blood glucose monitor having a data processing unit for visualizing changes in the blood glucose level.
EP 1 369 688 A2 - The subject matter of the invention is defined by each of
independent claims 1 and 24. - In accordance with the invention, a method for annunciating a patient's medical data levels using a medical data level monitoring device comprises the steps of: (1) storing medical data levels with the corresponding dates and times of day the respective medical data levels were taken; (2) calculating an average medical data level from at least a first medical data level and a second medical data level selected from the stored medical data levels; (3) annunciating the average medical data level; (4) receiving a first user input to annunciate the first medical data level; (5) annunciating the first medical data level; (6) receiving a second user input to annunciate the second medical data level; and (7) annunciating the second medical data level. The annunciating steps for annunciating the average medical data level, the first medical data level and the second medical data level, respectively, can be performed by displaying them on a display device, or by generating an audible sound via a speaker. The medical data levels are blood glucose levels, and the medical data level monitoring device is a blood glucose meter. More than two medical data levels can be used, that is, n medical data levels wherein n is greater than 2.
- In accordance with another aspect of the present invention, a variability indicator is provided that indicates the variability between the n medical data levels used to generate the average medical data level. The variability indicator is at least one of a scalar value, and a statistical parameter selected from the group consisting of a standard deviation and a coefficient of variance.
- In accordance with yet another aspect of the present invention, the average medical data level and the constituent values are displayed on a display screen. The display screen comprises a first area for displaying one of the average medical data level and the constituent values, and a second area configured to have n indicators corresponding to respective ones of the n medical data levels. Each of the n indicators is displayed as a nonflashing item when the first area is displaying the average medical data level. The corresponding one of the n indicators is flashed when its corresponding n medical data level is being displayed as one of the constituent values. The display screen comprises a third area for displaying a time of day and a date for a corresponding one of the n medical data levels when it is being displayed as a constituent value in the first area.
- In accordance with still yet another aspect of the present invention, calculating the average comprises selecting the stored medical data levels used to determine the average medical data level based on the date and time of day the stored medical data levels were taken. A user can define a time period during a day when the average medical data level is desired for that time period on each of a selected number of days (e.g., preferably three days). Calculating the average further comprises the steps of: (1) receiving a user input requesting an average medical data level of the time period for a selected number of days beginning with the current day; (2) determining if the time period has been entered or passed on the current day; (3) using a reading of an medical data level taken during the time period for the current day when determining the average medical data level if the time period has been entered or has passed for the current day; and (4) selecting a stored medical data level taken on the previous day when determining the average medical data level if the time period has yet not been entered or passed for the current day. The using step (3) further comprises the step of selecting one of the earliest and the most recent of a plurality of readings taken on the current day during the time period based on their respective times of day. The selecting step (4) further comprises the step of selecting one of the earliest and the most recent of a plurality of readings taken on the previous day during the time period based on their respective times of day. The using step (3) further comprises the step of using a stored medical data level from the previous day if no valid medical data levels are available from the time period for the current day. The selecting step (4) further comprises the step of using a stored medical data level from the day before the previous day if no valid medical data levels are available from the time period for the previous day.
- In accordance with an embodiment of the present invention, an apparatus for blood glucose monitoring comprises: (1) a reader for measuring a selected blood glucose level for the patient; (2) a memory device for storing a plurality of the blood glucose levels along with their respective dates and time of day they were taken; (3) an annunciator; (4) a user input device; and (5) a processing device connected to the reader, the memory device, the annunciator and the user input device and programmed to calculate an average blood glucose level from at least a first blood glucose level and a second blood glucose level selected from the stored blood glucose levels in the memory device, to annunciate the average blood glucose level via the annunciator, to receive a first user input from the user input device to annunciate the first blood glucose level, to annunciate the first blood glucose level in response to the first user input, to receive a second user input from the user input device to annunciate the second blood glucose level, and to annunciate the second blood glucose level in response to the second user input.
The programming device is further programmed to select the stored blood glucose levels used to determine the average blood glucose level based on the date and time of day the stored blood glucose levels were taken, and it is operable to allow a user to define a time period during a day when the average blood glucose level is desired for that time period on each of a selected number of days, and the processing device is programmed to receive a user input requesting an average blood glucose level of said time period for a selected number of days beginning with the current day, to use a reading of a blood glucose level taken during the time period for said current day when determining the average blood glucose level if said time period has been entered or has passed for the current day, and to select a stored blood glucose level taken on the previous day when determining the average blood glucose level if said time period has yet not been entered or passed for the current day. - These and other objects, advantages and novel features of the present invention will be readily appreciated from the following detailed description when read in conjunction with the accompanying drawings, in which:
-
Fig. 1 is a perspective view of an exemplary blood glucose meter in accordance with an embodiment of the present invention; -
Fig. 2 is a block diagram of the blood glucose meter ofFig. 1 ; -
Fig. 3 depicts a display configuration for a blood glucose meter in accordance with an embodiment of the present invention; -
Fig. 4 is a flow chart depicting a sequence of operations for selection of effective meal average constituent values in accordance with an embodiment of the present invention; -
Fig. 5 is a flow chart depicting a sequence of operations for generating displays to communicate an effective meal average and its constituent values in accordance with an embodiment of the present invention; and -
Figs. 6 and7 illustrate a series of exemplary screens generated by a blood glucose meter in accordance with an embodiment of the present invention. - Throughout the drawing figures, like reference numerals will be understood to refer to like parts and components.
- In accordance with the present invention, a
blood glucose meter 100 is provided with advantageous operations, including the determination and display of an effective mealtime average (EMA) or similar average over another user-defined period, the convenient and immediate display of the constituent values used to determine the average, and optional determination and display of variability among the constituent values (e.g., a standard deviation value). Theblood glucose meter 100 is exemplified by the Logic™ blood glucose monitor and the Latitude™ diabetes management system available from Becton Dickinson and Company. - With reference to
Fig. 1 , theblood glucose meter 100 of the present invention has a bloodglucose sensing area 150 for the monitoring of glucose within a patient. Bloodglucose sensing area 150 may utilize a variety of well known means for the monitoring of glucose within a patient. One method may be the use of a disposable strip with reagents applied thereto for the sensing of glucose within a bodily fluid. In an alternate embodiment of the present invention,sensing area 150 could utilize well known non-invasive sensing methods for the determination of glucose within a patient's body. Sensing of glucose by sensingarea 150 can be intermittent or continuous.Blood glucose meter 100 also can be configured to be wearable by the patient. - With reference to
Figs. 1 and2 ,blood glucose meter 100 also has a liquid crystal display (LCD) or other type ofdisplay device 160 which communicates data within theblood glucose meter 100 to the patient through a variety of menus programmed within the software/program instructions contained within the microprocessor 170 (Fig. 2 ) ofblood glucose meter 100 or stored in thememory device 190 for execution by themicroprocessor 170. Alternatively, themeter 100 can annunciate blood glucose values and other information audibly via a speech processing device and speaker. Thememory device 190 can store the blood glucose values measured by the reader orother sensing device 150, along with the dates and times of day they were measured, the stored blood glucose values that are selected to be constituent values of an average, and calculated values such as the averages and indicators of variability, among other information. It is to be understood that other memory configurations can be used without departing from the scope of the present invention. -
Blood glucose meter 100 also has a variety ofinput buttons LCD 160 to view various data withinblood glucose meter 100.Forward button 110 andbackward button 120 allow patients to move forward and backward through the menu screens shown onLCD 160. Also shown onblood glucose meter 100 is amemory button 130 which allows the user to enter the various menus generated by the software/program instructions ofblood glucose meter 100. At least one input button is required; however, alternate embodiments which contain one or more input buttons with different functions are still within the scope of the present invention. Accordingly, a user input device is indicated generally at 180 inFig. 2 . - The present invention provides an advantageous presentation of glucose data to a person with diabetes from a glucose meter, monitor or
continuous glucose sensor 100 in which an effective meal average (EMA) value is presented, followed by two or more of the individual values (i.e., hereinafter referred to as the constituent values) that make up the effective meal average. The effective meal average is comprised of an average value and its constituent values and/or a measure of the variability of the range. The effective meal average encompasses those values that occur at specified times (i.e., herein after referred to as the effective meal average timeframe or EMAT). The EMAT can be, for example, one hour before and one hour after a specified meal time, although the length of time before and after the meal could be different (e.g., 30 minutes or up to three hours), or during a specified interval such as from 10 AM to 2 PM. The average can also be for a post-meal timeframe. The effective meal average is calculated over a limited number of days that occurred previous to the calculation and is preferably calculated over three days, although the calculation can include as many as 13 days. The EMA has a minimum number of values that must be obtained within the time and date ranges, which is preferably three values, although the EMA can be based on as few as two values or as many values as were measured during the date range. Themicroprocessor 170 also employs an algorithm for excluding any given reading from the average. For example, patients may not want to include values taken after meals (i.e., post-prandial values) or control solution readings done during the specified time range. Patients can use from one to eight effective meal averages on any given date range, but preferably use four EMAs determined, for example, for the breakfast, lunch, supper and bedtime snack time periods. The additional four averages can be used for post-meal averages and an average in the middle of the night. The effective meal average provides improved feedback data for clinical decisions by patients with diabetes who use insulin and need to alter their dose of insulin. - The advantages of the present invention are illustrated by the following examples:
- A Lunchtime EMA is calculated at 180 mg/dl and displayed on the
LCD 160. The constituent values of the EMA are 162 mg/dl, 204 mg/dl and 174 mg/dl, which are displayed to the patient on theLCD 160 of theblood glucose meter 100. The EMA and the constituent values are preferably displayed via a series screens, each with a respective one of the values, as will be described below in connection withFigs. 6 and7 . It is to be understood that displays can be generated with different groupings of the EMA and its constituent values and remain within the scope of the present invention. Since the EMA is 180 and the individual values have little variation, at 162, 204 and 174, a patient could safely increase the breakfast dose of a short acting insulin by a small amount, for example, 1 unit. - A Lunchtime EMA is calculated at 180 mg/dl. The constituent values of the EMA are 75 mg/dl, 297 mg/dl and 168 mg/dl which are displayed to the patient on the
LCD 160 of theblood glucose meter 100 preferably via a series of screens. Since the EMA is 180 and the individual values have significant variation, at 75, 297 and 168, a patient could not safely increase the breakfast dose of a short acting insulin, even by a small amount such as 1 unit. A patient could then decide why there is so much variation, whether it be changes in diet, exercise or stress level. - A Lunchtime EMA is calculated at 180 mg/dl. The constituent values of the EMA are 162 mg/dl, 204 mg/dl and 174 mg/dl which are displayed to the patient on the
LCD 160 of theblood glucose meter 100, along with an EMA indicator (e.g., a standard deviation). Since the EMA is 180 and the individual values have little variation, at 162, 204 and 174, as indicated by the EMA indicator, a patient could safely increase the breakfast dose of a short acting insulin by a small amount, for example, 1 unit. - A Lunchtime EMA is calculated at 180 mg/dl. The constituent values of the EMA are 75 mg/dl, 297 mg/dl and 168 mg/dl which are displayed to the patient on the
LCD 160 of theblood glucose meter 100, along with an EMA indicator (e.g., a standard deviation). Since the EMA is 180 and the individual values have great variation, at 75, 297 and 168, as indicated by the EMA indicator, a patient could not safely increase the breakfast dose of a short acting insulin, even by a small amount such as 1 unit. A patient could then decide why there is so much variation, whether it be changes in diet, exercise or stress level. - As indicated by the foregoing examples, in accordance with one aspect of the present invention, the EMA is an array which consists of the average of a series of specific (i.e., with respect to time and other criteria) blood glucose measurements , along with the values which constitute the average. In accordance with another embodiment of the present invention, the EMA is an average of a series of specific (i.e., with respect to time and other criteria) blood glucose measurements, along with an indicator of the variability of the specific measurements.
- Prior art devices such as the Glucometer DEX2 mentioned in the background section above create averages for specific user settable times, but do not give the patient any indication of the inherent variability of the readings within the specific times. The patent is then unable to make clinical decisions based on the data. The patient only has an average of the readings of the last 14 days and may make a mistake in judgement with respect to the amount of change of insulin dosage. By contrast, the present invention advantageously communicates the variability dimension of the data. The present invention provides an apparatus and a method to present the data in such a format such that the patient has an average of the glucose readings, the constituent values used to generate the average, and optionally an indication of the variability in readings over the period in question (e.g., the effective meal average timeframe). Also, in accordance with another advantageous aspect of the present invention, the period of data for review is much shorter than existing blood glucose monitoring devices, allowing for a clinical judgement which is based on more recent and relevant data, rather than a running average provided by the existing devices.
- Reference is now made to
Fig. 3 , which depicts an illustrative display configuration for LCD orother display device 160 to display an EMA, or a constituent value or other blood glucose measurement data point, as indicated at 340. Also shown onLCD 160 are first indicator block 310, second indicator block 320, and third indicator block 330.Time value 350 displays the time of the glucose measurement represented bydata value 340. A date value can optionally be provided, as indicated at 360. As stated above, it is to be understood that displays can be generated with different groupings of the EMA and its constituent values and remain within the scope of the present invention. - With reference to
Figs. 3 and5 , in order to indicate the EMA, indicator blocks 310, 320, 330 are all displayed and non-flashing. When the first constituent value of the EMA is displayed asdata value 340, as denoted bybox 510 inFig 5 , the first constituent value's measured time is displayed astime value 350, and first indicator block 310 is flashing. When the second constituent value of the EMA is displayed asdata value 340, as denoted bybox 520 inFig 5 , the second constituent value's measured time is displayed astime value 350, and second indicator block 320 is flashing. When the third constituent value of the EMA is displayed asdata value 340, as denoted bybox 530 inFig 5 , the third constituent value's measured time is displayed astime value 350, and third indicator block 330 is flashing. -
Fig. 4 is a flowchart depicting a sequence of operations for the selection of EMA constituent values by themicroprocessor 170. The software/program instructions for themeter 100 enters an EMA calculation mode. A single data point is read (step 410) from stored data (step 420) such as data stored in thememory device 190. The stored data is preferably an array of values representing blood glucose measurements, and associated time code information for each measurement, and various other flags. Each data point is compared to criteria (step 430) for checking the data point for its suitability for use in a specific EMA calculation. These criteria can include values and flags corresponding to specific time frames corresponding to the desired EMAT, date information, calibration check information, post-prandial measurement, and specifically user-flagged values, among other criterion. Preferably, in order for the data point to be used as a constituent value for the EMA, the data point is within the EMAT, a pre-prandial measurement, not a calibration check, and not specifically flagged by the user. Once a data point is found that meets the criteria instep 430, the software/program instructions provide for storing the data point (step 440) to a corresponding buffer indicated at 450. The process is repeated (step 460) n times until n EMA constituent values are stored to theconstituent value buffer 450, where n can be from 2 to 14, for example, and more preferably n is 3. When n values have been selected, themicroprocessor 170 executing the software/program instructions calculates population parameters (step 470) of the constituent values within theconstituent values buffer 450, and stores the population parameters (step 480) to a population parameters buffer indicated at 490. At a minimum, the population parameters buffer 490 contains the average of the constituent values 450. Population parameters buffer 490 can additionally contain a standard deviation of theconstituent values 450 or another statistical parameter (e.g., scalar value, coefficient of variance, and the like) which represents the variation of the constituent values 450. - As shown in
Fig. 5 , a series of menu screens are preferably displayed byLCD 160 of theblood glucose meter 100. The effective mealtime average is communicated to the patient viaLCD 160. The patient navigates the menus displayed on theLCD 160 by depressing the input buttons 110,120,130. The effective meal average screen inFig 5 is represented bybox 500. Once at the effective mealaverage screen 500, which displays an average of the readings for the effective meal average timeframe, the user can then look at the data values which comprise the effective meal average by depressingbackward button 120 to reach effective the meal average first constituent value screen denoted bybox 510. If the user depresses theforward button 110, theLCD 160 displays the effective mealaverage screen 500 again. While on effective meal averagefirst value screen 510, if the user depressesbackward button 120, theLCD 160 displays a effective meal average secondconstituent value screen 520. With another press ofbackward button 120, theLCD 160 displays an effective meal average thirdconstituent value screen 530. With another press ofbackward button 120, anend marker screen 540 is displayed, which indicates to the patient that the last value seen was the last value of the EMA. While onend marker screen 540, if the user depressesbackward button 120,LCD 160 reverts to the effective mealaverage screen 500 at which point the patient has seen all constituent values from which the effective meal average was derived. Alternatively, this process can be repeated as needed to display any number of constituent values. The constituent values can also be displayed substantially simultaneously with the average blood glucose level (e.g., on the same screen), or substantially immediately before and after the average blood glucose level using sequential display screens for respective ones of the average blood glucose level and the constituent values that can be generated in a round robin manner. - In accordance with an embodiment of the present invention, effective meal average calculation and display are enabled when a Setup.Average function is set to 'ON' within the software/program instructions of the
meter 100. Four effective meal averages corresponding to four effective meal average timeframes are preferably viewed in sequence. Preferably, the time span covered in an effective meal average is defined as the center time of that average, plus or minus one hour. For example, a mealtime average whose 'center time' is 7:15AM covers blood glucose readings from 6:15AM to 8:15 AM. In an alternate embodiment of the invention, the center time of the effective meal average timeframes is settable by the user. - In accordance with an embodiment of the present invention, each average is calculated preferably using three readings. One reading is selected per day and begins with the current day if the current time has already entered or passed the time span for that time block. If the current time has not yet entered the time span covered in the specified time block (e.g., the EMAT), then the software/program instructions begin with that same time span on the previous day. If there is more than one reading within the time span on a given day, the software/program instructions select the most recent unmarked reading. In an alternative embodiment, the earliest reading is selected. Marked readings are excluded from averages such as control solution readings, which are marked with a "C" at 350 (
Fig. 3 ) of theLCD 160, as shown inFig. 6 . Other marked readings to be excluded (e.g., by choice of the patient) are marked with an "*". If, on a given day, no readings are found within the time span, the software/program instructions for themeter 100 searches the readings from the previous day. The software/program instructions go back a maximum of five days from the first and most recent time span searched. If fewer than three valid readings are found, the software/program instructions control thedisplay device 160 to appear as "---" for that meal time average, indicating that there were not enough readings available to calculate an average from that time block. If there are three valid readings, the meal time average is calculated. - In an alternate embodiment of the invention, the
meter 100 can display a standard deviation or other statistical parameter of the EMA data to the patient to indicate the variability of the average for the effective meal average timeframe in question. This indicator of variability is preferably referred to as an EMA indicator. Such statistical parameters can be either a standard parameter (e.g., a standard deviation, coefficient of variance, and the like), or a scalar value (e.g., a scaled value from 1 to 10 etc.), which represents the variability inherent in the data. - Reference is now made to the exemplary series of display screens on a
display device 160 depicted inFigs. 6 and7 . Screen 0.0 depicts the different possible screen areas that are selectively populated with information, as illustrated throughoutFigs. 6 and7 , depending on the mode selected by the user. The series of display screens indicated generally at 602 inFig. 6 are for viewing individual blood glucose readings and are accessed by depressing thememory button 130. For example, screen 3.1 is the most recent glucose reading. The forward andbackward keys memory device 190. These screens comprise "MEM" to indicate that a stored value is being viewed, the glucose level in units mg/dl, and the date and time of the reading. Screens 3.2 and 3.3 illustrate marked readings that are not used for averaging, as indicated by the "*" and the "C" in their respective screens. - The series of display screens indicated generally at 604 in
Fig. 6 are for viewing insulin injections and are preferably only visible when insulin is set to be "ON" during set-up of themeter 100. They can be accessed, for example, by depressing thememory button 130 when the current glucose reading is displayed. The large numerals are indicated along with a syringe icon, and alternate between displaying the pen number and the insulin dose, which is also indicated along with a "U". The date and time of day of the injection are also indicated. - The
memory button 130 can be depressed again to obtain a 7-day average reading, and depressed again to obtain a 14-day average reading. Screen 3.14 provides a 7-day average, and includes the reading in units mg/dl and the indication of "7 day". Screen 3.15 provides a 14-day average, and includes the reading in units mg/dl and the indication of "14 day". - With reference to
Fig. 7 , thememory button 130 can be depressed again to obtain a time block average (e.g., an EMA). A first screen 3.16 provides a breakfast EMA. The forward andbackward keys memory button 130 provides a lunchtime EMA screen 3.20. The forward andbackward keys memory button 130 provides a dinnertime EMA screen 3.24. The forward andbackward keys microprocessor 170 is programmed to use data from the previous day, Feb. 9. Finally, another depression of thememory button 130 provides a nighttime EMA screen 3.28. The forward andbackward keys - It is to be understood that the toggling between viewing modes (e.g., individual blood glucose readings, insulin injection readings, 7-day average reading, 14-day average reading, and time block averages (e.g., EMAs) by depressing the memory button can be ordered differently than shown in
Figs. 6 and7 , or include more or fewer information viewing modes. Further, themeter 100 can be provided with different user buttons or other input devices that allow direct access to any of the information viewing modes (e.g., selection from a menu of information display options provided on the LCD 160). - The following represents exemplary code for implementing an embodiment of the present invention.
- This function displays meal bar annunciators.
Turn1, 2 and 3 annunciators If record counter = 1 Enable flashing for ON meal bar meal bar 1 annunciator Disable flashing for meal bar 2 annunciator Disable flashing formeal bar 3 annunciator Else if record counter = 2 Disable flashing formeal bar 1 annunciator Enable flashing for meal bar 2 annunciator Disable flashing formeal bar 3 annunciator Else if record counter = 3 Disable flashing formeal bar 1 annunciator Disable flashing for meal bar 2 annunciator Enable flashing formeal bar 3 annunciator
    Input: TBNum, time block number

    Display Setup.CTime[TBNum] .Hours
    Display Setup.CTime[TBNum] .Minutes
    Call IntervalAverage routine, to calculate time block average
    If IntervalAverage result < 0 Display'---'
    Else
        Display IntervalAverage result
        Clear record counter
        Call DisplayMealBars, to display meal bar annunciators
| Action | Current Display | Next Display |
| Left arrow Button press | '---' (Can't calculate average) | No change |
| Time Block Average | Glucose Record No. 1 | |
| Glucose Record No. 1 | Glucose Record No. 2 | |
| • | Glucose Record No. 2 | Glucose Record No. 3 |
| Glucose Record No. 3 | 'End' | |
| 'End' | Time Block Average |
    Input: TBNum, time block number
    If IntervalAverage result > 0
        Increment record counter
        Clear display
        If record counter> 4
               Clear record counter
               Display Setup.CTime[TBNum] .Hours
               Display Setup.CTime[TBNum] .Minutes
               Display IntervalAverage result
               Call DisplayMealBars, to display meal bar annunciators
        Else if record counter = 4
               Display 'End'
        Else
               Display glucose record indexed by the record counter
               Call DisplayMealBars, to display meal bar annunciators
| Action | Current Display | Next Display |
| Right arrow Button press | '---' (Can't calculate average) | No change |
| Time Block Average | No change | |
| Glucose Record No. 1 | Time Block Average | |
| Glucose Record No. 2 | Glucose Record No. 1 | |
| Glucose Record No. 3 | Glucose Record No. 2 | |
| 'End' | Glucose Record No. 3 |
        Input: TBNum, time block number

    If IntervalAverage result> 0
        Decrement record counter
        If record counter < 1
            Clear record counter
           Display Setup.CTime[TBNum].Hours
           Display Setup.CTime[TBNum].Minutes
           Display IntervalAverage result
        Else
           Display glucose record indexed by the record counter
           Call DisplayMealBars, to display meal bar annunciators
Global Parameters used:
        Setup . Average

    If Setup.Average is ON
        Call M_UiMealTimeAverage(0), to calculate and display block average
    Else
        UiState = kStatel
        Call M UiRecallResults, back to Individual Blood Glucose Readings
Call L UiMealTimeAverage(0), to display older averaging glucose record
Claims (41)
- A method of annunciating a patient's blood glucose levels using a blood glucose meter configured to perform the steps of:storing blood glucose levels with the corresponding dates and times of day the respective blood glucose levels were taken;calculating an average blood glucose level from at least a first blood glucose level and a second blood glucose level selected from the stored blood glucose levels by:selecting the stored blood glucose levels used to determine said average blood glucose level based on the date and time of day the stored blood glucose levels were taken,defining a time period during a day when the average blood glucose level is desired for that time period on each of a selected number of days,receiving a user input requesting an average blood glucose level of said time period for a selected number of days beginning with the current day;determining if said time period has been entered or passed on said current day;using a reading of a blood glucose level taken during the time period for said current day when determining said average blood glucose level if said time period has been entered or has passed for the current day; and selecting a stored blood glucose level taken on the previous day when determining said average blood glucose level if said time period has yet not been entered or passed for the current day;annunciating said average blood glucose level;receiving a first user input to annunciate said first blood glucose level;annunciating said first blood glucose level;receiving a second user input to annunciate said second blood glucose level; andannunciating said second blood glucose level.
- A method as claimed in claim 1, wherein each of the three said annunciating steps for annunciating said average blood glucose level, said first blood glucose level and said second blood glucose level, respectively, can be performed by one of displaying on a display device (160), and generating an audible sound via a speaker.
- A method as claimed in claim 1, further comprising the steps of:receiving a third user input to annunciate a value; andannunciating said average blood glucose level.
- A method as claimed in claim 1, wherein the average blood glucose level calculation uses n of said stored blood glucose levels, where n is an integer greater than 2 and said n stored blood glucose levels comprise said first blood glucose level and said second blood glucose level.
- A method as claimed in claim 4, further comprising the step of annunciating a variability indicator that indicates the variability between said n stored blood glucose levels.
- A method as claimed in claim 4, wherein said n stored blood glucose levels are considered constituent values (450) of the average blood glucose level, and further comprising the steps of:receiving another user input to annunciate the next blood glucose level among said n stored blood glucose levels after said first blood glucose level and said second blood glucose level;annunciating the next blood glucose level; andrepeating the receiving step for receiving another user input to annunciate the next blood glucose level among the n blood glucose levels, and annunciating the next blood glucose level until each of said constituent values (450) have been annunciated.
- A method as claimed in claim 6, wherein said repeating step comprises the step of annunciating the average blood glucose level after the last blood glucose level among said constituent values (450) has been annunciated.
- A method as claimed in claim 4, wherein said average blood glucose level and said constituent values (450) are displayed on a display screen, the display screen comprising a first area for displaying one of the average blood glucose level and said constituent values (450), and a second area configured to have n indicators corresponding to respective ones of said n stored blood glucose levels.
- A method as claimed in claim 8, further comprising the step of displaying each of said n indicators as nonflashing items when said first area is displaying said average blood glucose level, and flashing the corresponding one of said n indicators when its corresponding n blood glucose level is being displayed as one of the constituent values (450).
- A method as claimed in claim 8, wherein said display screen comprises a third area for displaying a time of day and a date, and further comprising the step of displaying the time of day and date stored with a corresponding one of said n stored blood glucose levels in said third area when it is being displayed as a constituent value in said first area.
- The method as claimed in claim 1, wherein
said average blood glucose level is calculated from at least three of the stored blood glucose levels as the constituent values (450); and
said annunciating is performed by displaying said average, first and second blood glucose levels on a display device (160) of said blood glucose meter (100). - A method as claimed in claim 11, further comprising the steps of:receiving a third user input to display the third one of the constituent values (450);displaying the third one of the constituent values (450) in response to the third user input;receiving another user input to display a value; anddisplaying the average blood glucose level again.
- A method as claimed in claim 12, wherein said blood glucose meter (100) comprises forward and backward arrow keys (110,120) for navigation forward and backward, respectively, among the different displayed constituent values (450).
- A method as claimed in claim 11, wherein the display screen comprises a first area for displaying one of the average blood glucose level and the constituent values (450), and a second area configured to have three indicators corresponding to respective ones of the three constituent values (450).
- A method as claimed in claim 14, further comprising the step of displaying each of said three indicators as nonflashing items when said first area is displaying the average blood glucose level, and flashing the corresponding one of said three indicators when its corresponding constituent value is being displayed.
- A method as claimed in claim 1 or 11, wherein said calculating step further comprises the step of using stored blood glucose levels from as many as a selected maximum number of previous days if no valid blood glucose levels are available for said current day.
- A method as claimed in claim 16, wherein said selected maximum number of days is five.
- A method as claimed in claim 11, further comprising the step of displaying a variability indicator that indicates the variability between said constituent blood glucose levels.
- A method as claimed in claim 5 or 18, wherein the variability indicator is at least one of a scalar value, and a statistical parameter selected from the group consisting of a standard deviation and a coefficient of variance.
- A method as claimed in claim 1, wherein said selected number of days is three.
- A method as claimed in claim 1 or 11, wherein said using step further comprises the step of selecting one of the earliest and the most recent of a plurality of readings taken on said current day during said time period based on their respective times of day.
- A method as claimed in claim 1 or 11, wherein said selecting step further comprises the step of selecting one of the earliest and the most recent of a plurality of readings taken on said previous day during said time period based on their respective times of day.
- A method as claimed in claim 1 or 11, wherein said using step further comprises the step of using a stored blood glucose level from the previous day if no valid blood glucose levels are available from said time period for the current day, and said selecting step further comprises the step of using a stored blood glucose level from the day before said previous day if no valid blood glucose levels are available from said time period for the previous day.
- A blood glucose meter (100) for patient condition monitoring comprising:a reader for measuring a selected blood glucose level for said patient;a memory device (190) for storing a plurality of the blood glucose levels along with their respective dates and time of day they were taken;an annunciator;a user input device; anda processing device connected to said reader, said memory device (190),said annunciator and said user input device and programmed to calculate an average blood glucose level from at least a first blood glucose level anda second blood glucose level selected from the stored blood glucose levels in said memory device (190), to annunciate the average blood glucose level via said annunciator, to receive a first user input from said user input device to annunciate the first blood glucose level, to annunciate the first blood glucose level in response to said first user input, to receive a seconduser input from said user input device to annunciate the second blood glucose level, and to annunciate the second blood glucose level in response to said second user input,
wherein said processing device is
programmed to select the stored blood glucose levels used to determine said average blood glucose level based on the date and time of day the stored blood glucose levels were taken, and
operable to allow a user to define a time period during a day when the average blood glucose level is desired for that time period on each of a selected number of days,characterized in thatsaid processing device is programmed to receive a user input requesting an average blood glucose level of said time period for a selected number of days beginning with the current day, to determine if said time period has been entered or passed on said current day, to use a reading of a blood glucose level taken during the time period for said current day when determining the average blood glucose level if said time period has been entered or has passed for the current day, and to select a stored blood glucose level taken on the previous day when determining the average blood glucose level if said time period has yet not been entered or passed for the current day. - A blood glucose meter (100) as claimed in claim 24, wherein said annunciator is at least one of a display device (160) and a speaker, and said processing device is operable to annunciate by one of displaying on said display device (160), and generating an audible sound via said speaker.
- A blood glucose meter (100) as claimed in claim 24, wherein said processing device is further programmable to receive a third user input via said user input device to annunciate a value, and to annunciate the average blood glucose level.
- A blood glucose meter (100) as claimed in claim 24, wherein said processing device is programmable to use n of the stored blood glucose levels to calculate the average blood glucose level, where n is an integer greater than 2 and the n stored blood glucose levels comprise said first blood glucose level and said second blood glucose level.
- A blood glucose meter (100) as claimed in claim 27, wherein said processing device is programmable to determine and annunciate a variability indicator via said annunciator that indicates the variability between the n stored blood glucose levels.
- A blood glucose meter (100) as claimed in claim 28, wherein the variability indicator is at least one of a scalar value, and a statistical parameter selected from the group consisting of a standard deviation and a coefficient of variance.
- A blood glucose meter (100) as claimed in claim 27, wherein the n stored blood glucose levels are considered constituent values (450) of the average blood glucose level, and said processing device is further programmable to receive another user input via said user input device to annunciate the next blood glucose level among the n blood glucose levels after said first blood glucose level and said second blood glucose level, to annunciate the next blood glucose level in response to said another user input, to repeat the operations of receiving another user input to annunciate the next blood glucose level among the n blood glucose levels and annunciating the next blood glucose level until each of the constituent values (450) has been annunciated via the annunciator.
- A blood glucose meter (100) as claimed in claim 30, wherein said processing device is further programmable to annunciate the average blood glucose level after the last blood glucose level among the constituent values (450) has been annunciated.
- A blood glucose meter (100) as claimed in claim 27, wherein said annunciator is a display screen and the average blood glucose level and the constituent values (450) are displayed on said display screen, said display screen comprising a first area for displaying one of the average blood glucose level and the constituent values (450), and a second area configured to have n indicators corresponding to respective ones of the n blood glucose levels.
- A blood glucose meter (100) as claimed in claim 32, wherein, said processing device is programmable to display each of said n indicators as nonflashing items when said first area is displaying the average blood glucose level, and flash the corresponding one of said n indicators when its corresponding n blood glucose level is being displayed as one of the constituent values (450).
- A blood glucose meter (100) as claimed in claim 32, wherein said display screen comprises a third area for displaying a time of day and a date, said processing device being further programmable to display the time of day and date stored with a corresponding one of the n stored blood glucose levels in said third area when it is being displayed as a constituent value in said first area.
- A blood glucose meter (100) as claimed in claim 24, wherein said selected number of days is three.
- A blood glucose meter (100) as claimed in claim 24, wherein said processing device is programmable to select one of the earliest and the most recent of a plurality of readings taken on said current day during said time period based on their respective times of day.
- A blood glucose meter (100) as claimed in claim 24, wherein said processing device is programmable to select one of the earliest and the most recent of a plurality of readings taken on said previous day during said time period based on their respective times of day.
- A blood glucose meter (100) as claimed in claim 24, wherein said processing device is programmable to use a stored blood glucose level from the previous day if no valid blood glucose levels are available from said time period for the current day, and, when selecting a stored blood glucose level taken on the previous day, to use a stored blood glucose level from the day before said previous day if no valid blood glucose levels are available from said time period for the previous day.
- A blood glucose meter (100) as claimed in claim 24, wherein said processing device is programmable to use stored blood glucose levels from as many as a selected maximum number of previous ago if no valid blood glucose levels are available for said current day.
- A blood glucose meter (100) as claimed in claim 39, wherein said selected maximum number of days is five.
- A blood glucose meter (100) as claimed in claim 24, wherein said user input device comprises forward and backward arrow keys (110,120) for navigation forward and backward, respectively, among the annunciated said constituent values (450).
Applications Claiming Priority (3)
| Application Number | Priority Date | Filing Date | Title |
|---|---|---|---|
| US40996502P | 2002-09-11 | 2002-09-11 | |
| US409965P | 2002-09-11 | ||
| PCT/US2003/028075 WO2004023972A2 (en) | 2002-09-11 | 2003-09-10 | Monitoring blood glucose including convenient display of measurement values ________________________________________________________ |
Publications (3)
| Publication Number | Publication Date |
|---|---|
| EP1536729A2 EP1536729A2 (en) | 2005-06-08 |
| EP1536729A4 EP1536729A4 (en) | 2009-03-18 |
| EP1536729B1 true EP1536729B1 (en) | 2012-03-21 |
Family
ID=31994038
Family Applications (1)
| Application Number | Title | Priority Date | Filing Date |
|---|---|---|---|
| EP03749508A Expired - Lifetime EP1536729B1 (en) | 2002-09-11 | 2003-09-10 | Monitoring blood glucose including convenient display of measurement values and averages |
Country Status (8)
| Country | Link |
|---|---|
| US (4) | US7570980B2 (en) |
| EP (1) | EP1536729B1 (en) |
| JP (1) | JP4594731B2 (en) |
| AT (1) | ATE550723T1 (en) |
| AU (1) | AU2003268538A1 (en) |
| CA (1) | CA2466772C (en) |
| ES (1) | ES2384558T3 (en) |
| WO (1) | WO2004023972A2 (en) |
Families Citing this family (126)
| Publication number | Priority date | Publication date | Assignee | Title |
|---|---|---|---|---|
| US6175752B1 (en) | 1998-04-30 | 2001-01-16 | Therasense, Inc. | Analyte monitoring device and methods of use |
| US8480580B2 (en) | 1998-04-30 | 2013-07-09 | Abbott Diabetes Care Inc. | Analyte monitoring device and methods of use |
| US8974386B2 (en) | 1998-04-30 | 2015-03-10 | Abbott Diabetes Care Inc. | Analyte monitoring device and methods of use |
| US8465425B2 (en) | 1998-04-30 | 2013-06-18 | Abbott Diabetes Care Inc. | Analyte monitoring device and methods of use |
| US9066695B2 (en) | 1998-04-30 | 2015-06-30 | Abbott Diabetes Care Inc. | Analyte monitoring device and methods of use |
| US8688188B2 (en) | 1998-04-30 | 2014-04-01 | Abbott Diabetes Care Inc. | Analyte monitoring device and methods of use |
| US6949816B2 (en) | 2003-04-21 | 2005-09-27 | Motorola, Inc. | Semiconductor component having first surface area for electrically coupling to a semiconductor chip and second surface area for electrically coupling to a substrate, and method of manufacturing same |
| US8346337B2 (en) | 1998-04-30 | 2013-01-01 | Abbott Diabetes Care Inc. | Analyte monitoring device and methods of use |
| US6560471B1 (en) | 2001-01-02 | 2003-05-06 | Therasense, Inc. | Analyte monitoring device and methods of use |
| EP1397068A2 (en) | 2001-04-02 | 2004-03-17 | Therasense, Inc. | Blood glucose tracking apparatus and methods |
| JP4498636B2 (en) | 2001-04-27 | 2010-07-07 | 日本サーモスタット株式会社 | Thermostat device |
| WO2003015629A1 (en) * | 2001-08-20 | 2003-02-27 | Inverness Medical Limited | Wireless diabetes management devices and methods for using the same |
| CA2466772C (en) * | 2002-09-11 | 2012-08-28 | Becton, Dickinson And Company | Apparatus and method for monitoring blood glucose levels including convenient display of blood glucose value average and constituent values |
| AU2003279237A1 (en) | 2002-10-09 | 2004-05-04 | Therasense, Inc. | Fluid delivery device, system and method |
| US7727181B2 (en) | 2002-10-09 | 2010-06-01 | Abbott Diabetes Care Inc. | Fluid delivery device with autocalibration |
| US7993108B2 (en) | 2002-10-09 | 2011-08-09 | Abbott Diabetes Care Inc. | Variable volume, shape memory actuated insulin dispensing pump |
| US8771183B2 (en) | 2004-02-17 | 2014-07-08 | Abbott Diabetes Care Inc. | Method and system for providing data communication in continuous glucose monitoring and management system |
| AU2003303597A1 (en) | 2002-12-31 | 2004-07-29 | Therasense, Inc. | Continuous glucose monitoring system and methods of use |
| US7679407B2 (en) | 2003-04-28 | 2010-03-16 | Abbott Diabetes Care Inc. | Method and apparatus for providing peak detection circuitry for data communication systems |
| US8066639B2 (en) | 2003-06-10 | 2011-11-29 | Abbott Diabetes Care Inc. | Glucose measuring device for use in personal area network |
| US7722536B2 (en) * | 2003-07-15 | 2010-05-25 | Abbott Diabetes Care Inc. | Glucose measuring device integrated into a holster for a personal area network device |
| WO2005119524A2 (en) | 2004-06-04 | 2005-12-15 | Therasense, Inc. | Diabetes care host-client architecture and data management system |
| EP1810203A2 (en) | 2004-10-07 | 2007-07-25 | Novo Nordisk A/S | Method and system for self- management of a disease |
| US20060095296A1 (en) * | 2004-11-02 | 2006-05-04 | Lawrence Erdman | System and method for improved data retrieval in a clinical reporting environment |
| CN101137320B (en) | 2004-12-29 | 2012-10-03 | 生命扫描苏格兰有限公司 | Method of inputting data into an analyte testing device |
| US9351669B2 (en) | 2009-09-30 | 2016-05-31 | Abbott Diabetes Care Inc. | Interconnect for on-body analyte monitoring device |
| ITBO20050002A1 (en) * | 2005-01-04 | 2006-07-05 | Giacomo Vespasiani | METHOD AND SYSTEM FOR INTERACTIVE MANAGEMENT OF DATA CONCERNING AN INSULIN THERAPY IN SELF-CONTROL FOR A DIABETIC PATIENT |
| WO2006102412A2 (en) | 2005-03-21 | 2006-09-28 | Abbott Diabetes Care, Inc. | Method and system for providing integrated medication infusion and analyte monitoring system |
| US8112240B2 (en) | 2005-04-29 | 2012-02-07 | Abbott Diabetes Care Inc. | Method and apparatus for providing leak detection in data monitoring and management systems |
| US7768408B2 (en) | 2005-05-17 | 2010-08-03 | Abbott Diabetes Care Inc. | Method and system for providing data management in data monitoring system |
| US7620437B2 (en) | 2005-06-03 | 2009-11-17 | Abbott Diabetes Care Inc. | Method and apparatus for providing rechargeable power in data monitoring and management systems |
| EP1728468A1 (en) | 2005-06-04 | 2006-12-06 | Roche Diagnostics GmbH | Evaluation of blood glucose concentration values for adaptation of insulin dosage |
| US8251904B2 (en) | 2005-06-09 | 2012-08-28 | Roche Diagnostics Operations, Inc. | Device and method for insulin dosing |
| UY29721A1 (en) | 2005-08-05 | 2007-03-30 | Bayer Healthcare Llc | METER WITH POSTPRANDIAL TIME ALARM TO PERFORM DETERMINATIONS |
| JP2009506852A (en) * | 2005-09-09 | 2009-02-19 | エフ.ホフマン−ラ ロシュ アーゲー | System, tool, apparatus and program for diabetes treatment |
| US7756561B2 (en) | 2005-09-30 | 2010-07-13 | Abbott Diabetes Care Inc. | Method and apparatus for providing rechargeable power in data monitoring and management systems |
| US7583190B2 (en) | 2005-10-31 | 2009-09-01 | Abbott Diabetes Care Inc. | Method and apparatus for providing data communication in data monitoring and management systems |
| US7766829B2 (en) | 2005-11-04 | 2010-08-03 | Abbott Diabetes Care Inc. | Method and system for providing basal profile modification in analyte monitoring and management systems |
| ES2761180T3 (en) | 2005-12-23 | 2020-05-19 | Ariad Pharma Inc | Bicyclic heteroaryl compounds |
| US8344966B2 (en) | 2006-01-31 | 2013-01-01 | Abbott Diabetes Care Inc. | Method and system for providing a fault tolerant display unit in an electronic device |
| US7824333B2 (en) * | 2006-03-31 | 2010-11-02 | Lifescan, Inc. | Diabetes management methods and systems |
| US7620438B2 (en) | 2006-03-31 | 2009-11-17 | Abbott Diabetes Care Inc. | Method and system for powering an electronic device |
| US8226891B2 (en) | 2006-03-31 | 2012-07-24 | Abbott Diabetes Care Inc. | Analyte monitoring devices and methods therefor |
| US7920907B2 (en) | 2006-06-07 | 2011-04-05 | Abbott Diabetes Care Inc. | Analyte monitoring system and method |
| US8932216B2 (en) * | 2006-08-07 | 2015-01-13 | Abbott Diabetes Care Inc. | Method and system for providing data management in integrated analyte monitoring and infusion system |
| US8579853B2 (en) | 2006-10-31 | 2013-11-12 | Abbott Diabetes Care Inc. | Infusion devices and methods |
| US8930203B2 (en) | 2007-02-18 | 2015-01-06 | Abbott Diabetes Care Inc. | Multi-function analyte test device and methods therefor |
| US8732188B2 (en) | 2007-02-18 | 2014-05-20 | Abbott Diabetes Care Inc. | Method and system for providing contextual based medication dosage determination |
| US8123686B2 (en) | 2007-03-01 | 2012-02-28 | Abbott Diabetes Care Inc. | Method and apparatus for providing rolling data in communication systems |
| JP5429586B2 (en) * | 2007-03-30 | 2014-02-26 | 株式会社タニタ | Blood glucose state estimation method and apparatus |
| US7928850B2 (en) | 2007-05-08 | 2011-04-19 | Abbott Diabetes Care Inc. | Analyte monitoring system and methods |
| US8461985B2 (en) | 2007-05-08 | 2013-06-11 | Abbott Diabetes Care Inc. | Analyte monitoring system and methods |
| US8456301B2 (en) | 2007-05-08 | 2013-06-04 | Abbott Diabetes Care Inc. | Analyte monitoring system and methods |
| US8665091B2 (en) | 2007-05-08 | 2014-03-04 | Abbott Diabetes Care Inc. | Method and device for determining elapsed sensor life |
| US7998069B2 (en) * | 2007-09-11 | 2011-08-16 | Roche Diagnostics Operations, Inc. | Mask algorithms for health management systems |
| USD612279S1 (en) | 2008-01-18 | 2010-03-23 | Lifescan Scotland Limited | User interface in an analyte meter |
| USD611853S1 (en) | 2008-03-21 | 2010-03-16 | Lifescan Scotland Limited | Analyte test meter |
| USD615431S1 (en) | 2008-03-21 | 2010-05-11 | Lifescan Scotland Limited | Analyte test meter |
| IL197532A0 (en) * | 2008-03-21 | 2009-12-24 | Lifescan Scotland Ltd | Analyte testing method and system |
| USD612275S1 (en) | 2008-03-21 | 2010-03-23 | Lifescan Scotland, Ltd. | Analyte test meter |
| USD611151S1 (en) | 2008-06-10 | 2010-03-02 | Lifescan Scotland, Ltd. | Test meter |
| US8175812B2 (en) | 2008-06-25 | 2012-05-08 | Roche Diagnostics Operations, Inc. | Method, system, and computer program product for calculating daily weighted averages of glucose measurements (or derived quantities) with time-based weights |
| US20100000862A1 (en) * | 2008-07-07 | 2010-01-07 | Agamatrix, Inc. | Integrated Blood Glucose Measurement Device |
| USD611489S1 (en) | 2008-07-25 | 2010-03-09 | Lifescan, Inc. | User interface display for a glucose meter |
| CA2675227C (en) | 2008-08-15 | 2017-09-05 | Lifescan Scotland Limited | Analyte testing method and system |
| US7959598B2 (en) | 2008-08-20 | 2011-06-14 | Asante Solutions, Inc. | Infusion pump systems and methods |
| USD611372S1 (en) | 2008-09-19 | 2010-03-09 | Lifescan Scotland Limited | Analyte test meter |
| EP2333527A4 (en) | 2008-09-29 | 2012-03-14 | Terumo Corp | Blood sugar information processor, blood sugar information processing method, and blood sugar information processing program |
| US9330237B2 (en) * | 2008-12-24 | 2016-05-03 | Medtronic Minimed, Inc. | Pattern recognition and filtering in a therapy management system |
| US20100160740A1 (en) * | 2008-12-24 | 2010-06-24 | Gary Cohen | Use of Patterns in a Therapy Management System |
| US8103456B2 (en) | 2009-01-29 | 2012-01-24 | Abbott Diabetes Care Inc. | Method and device for early signal attenuation detection using blood glucose measurements |
| US8560082B2 (en) | 2009-01-30 | 2013-10-15 | Abbott Diabetes Care Inc. | Computerized determination of insulin pump therapy parameters using real time and retrospective data processing |
| US20100249965A1 (en) * | 2009-03-31 | 2010-09-30 | Agamatrix, Inc. | Integrated Blood Glucose Measurement Device |
| WO2010129375A1 (en) | 2009-04-28 | 2010-11-11 | Abbott Diabetes Care Inc. | Closed loop blood glucose control algorithm analysis |
| WO2010127050A1 (en) | 2009-04-28 | 2010-11-04 | Abbott Diabetes Care Inc. | Error detection in critical repeating data in a wireless sensor system |
| US20100299075A1 (en) * | 2009-05-19 | 2010-11-25 | Bayer Healthcare Llc | Systems and methods for calculating an average analyte concentration value |
| US8460196B2 (en) * | 2009-05-29 | 2013-06-11 | Atlantis Limited Partnership | Method and apparatus for monitoring brain activity |
| US9184490B2 (en) | 2009-05-29 | 2015-11-10 | Abbott Diabetes Care Inc. | Medical device antenna systems having external antenna configurations |
| EP3973855A1 (en) | 2009-06-30 | 2022-03-30 | Lifescan, Inc. | Analyte testing methods and device for calculating basal insulin therapy |
| BRPI1015133A2 (en) * | 2009-06-30 | 2016-04-19 | Lifescan Scotland Ltd | diabetes management systems and methods |
| US20100332445A1 (en) * | 2009-06-30 | 2010-12-30 | Lifescan, Inc. | Analyte testing method and system |
| EP4276652A3 (en) | 2009-07-23 | 2024-01-31 | Abbott Diabetes Care, Inc. | Real time management of data relating to physiological control of glucose levels |
| WO2011026147A1 (en) | 2009-08-31 | 2011-03-03 | Abbott Diabetes Care Inc. | Analyte signal processing device and methods |
| EP2473099A4 (en) | 2009-08-31 | 2015-01-14 | Abbott Diabetes Care Inc | Analyte monitoring system and methods for managing power and noise |
| US9320461B2 (en) | 2009-09-29 | 2016-04-26 | Abbott Diabetes Care Inc. | Method and apparatus for providing notification function in analyte monitoring systems |
| CA3077994C (en) | 2009-09-29 | 2022-06-21 | Lifescan Scotland Limited | Analyte testing method and device for diabetes management |
| CA2779479C (en) | 2009-11-04 | 2020-03-31 | Hygieia Inc. | Apparatus and methods for taking blood glucose measurements and recommending insulin doses |
| US9949672B2 (en) | 2009-12-17 | 2018-04-24 | Ascensia Diabetes Care Holdings Ag | Apparatus, systems and methods for determining and displaying pre-event and post-event analyte concentration levels |
| CN102770868B (en) * | 2010-02-25 | 2017-02-22 | 生命扫描苏格兰有限公司 | Analyte testing method and system with high and low blood glucose trends notification |
| US8515775B2 (en) * | 2010-10-15 | 2013-08-20 | Roche Diagnostics Operations, Inc. | Handheld diabetes management device for obtaining three day blood glucose profile |
| US10136845B2 (en) | 2011-02-28 | 2018-11-27 | Abbott Diabetes Care Inc. | Devices, systems, and methods associated with analyte monitoring devices and devices incorporating the same |
| AU2012335830B2 (en) | 2011-11-07 | 2017-05-04 | Abbott Diabetes Care Inc. | Analyte monitoring device and methods |
| RU2014142689A (en) * | 2012-03-23 | 2016-05-20 | Цилаг Гмбх Интернэшнл | MESSAGES WITH POSITIVE ATTACHMENT FOR USERS BASED ON ANALYSIS OF PREVIOUS PHYSIOLOGICAL MEASUREMENTS |
| US9968306B2 (en) | 2012-09-17 | 2018-05-15 | Abbott Diabetes Care Inc. | Methods and apparatuses for providing adverse condition notification with enhanced wireless communication range in analyte monitoring systems |
| US9833191B2 (en) | 2012-11-07 | 2017-12-05 | Bigfoot Biomedical, Inc. | Computer-based diabetes management |
| US9561324B2 (en) | 2013-07-19 | 2017-02-07 | Bigfoot Biomedical, Inc. | Infusion pump system and method |
| EP2851823A1 (en) * | 2013-09-20 | 2015-03-25 | Sanofi-Aventis Deutschland GmbH | Data management unit for supporting health control |
| EP2851822A1 (en) | 2013-09-20 | 2015-03-25 | Sanofi-Aventis Deutschland GmbH | Data management unit and method operating same |
| EP2851821A1 (en) | 2013-09-20 | 2015-03-25 | Sanofi-Aventis Deutschland GmbH | Medical device and method operating same |
| US10569015B2 (en) | 2013-12-02 | 2020-02-25 | Bigfoot Biomedical, Inc. | Infusion pump system and method |
| WO2015191459A1 (en) | 2014-06-10 | 2015-12-17 | Bigfoot Biomedical, Inc. | Insulin delivery systems and methods |
| US11081226B2 (en) | 2014-10-27 | 2021-08-03 | Aseko, Inc. | Method and controller for administering recommended insulin dosages to a patient |
| JP6989262B2 (en) * | 2014-10-27 | 2022-01-05 | アセコー インコーポレイテッド | Subcutaneous outpatient management |
| US9878097B2 (en) | 2015-04-29 | 2018-01-30 | Bigfoot Biomedical, Inc. | Operating an infusion pump system |
| US10987468B2 (en) | 2016-01-05 | 2021-04-27 | Bigfoot Biomedical, Inc. | Operating multi-modal medicine delivery systems |
| US10449294B1 (en) | 2016-01-05 | 2019-10-22 | Bigfoot Biomedical, Inc. | Operating an infusion pump system |
| US10438507B2 (en) * | 2016-04-15 | 2019-10-08 | Under Armour, Inc. | Health tracking system including subjective nutrition perception tool |
| US10426896B2 (en) | 2016-09-27 | 2019-10-01 | Bigfoot Biomedical, Inc. | Medicine injection and disease management systems, devices, and methods |
| CA3037432A1 (en) | 2016-12-12 | 2018-06-21 | Bigfoot Biomedical, Inc. | Alarms and alerts for medication delivery devices and related systems and methods |
| USD836769S1 (en) | 2016-12-12 | 2018-12-25 | Bigfoot Biomedical, Inc. | Insulin delivery controller |
| US11468042B2 (en) | 2016-12-13 | 2022-10-11 | Sanofi | Data management unit for supporting health control |
| JP7196077B2 (en) | 2016-12-23 | 2022-12-26 | サノフィ-アベンティス・ドイチュラント・ゲゼルシャフト・ミット・ベシュレンクテル・ハフツング | Data management unit to support health management |
| CN110235205A (en) | 2016-12-23 | 2019-09-13 | 赛诺菲-安万特德国有限公司 | Data Management Unit for supporting health to control |
| JP7146764B2 (en) | 2016-12-23 | 2022-10-04 | サノフィ-アベンティス・ドイチュラント・ゲゼルシャフト・ミット・ベシュレンクテル・ハフツング | Data management unit to support health management |
| TWD186862S (en) * | 2017-04-05 | 2017-11-21 | 華廣生技股份有限公司 | Portion of analyte measurement apparatus |
| ES2903174T3 (en) | 2017-05-05 | 2022-03-31 | Lilly Co Eli | Physiological glucose closed loop monitoring |
| USD839294S1 (en) | 2017-06-16 | 2019-01-29 | Bigfoot Biomedical, Inc. | Display screen with graphical user interface for closed-loop medication delivery |
| US11389088B2 (en) | 2017-07-13 | 2022-07-19 | Bigfoot Biomedical, Inc. | Multi-scale display of blood glucose information |
| US11083852B2 (en) | 2017-12-12 | 2021-08-10 | Bigfoot Biomedical, Inc. | Insulin injection assistance systems, methods, and devices |
| US11197964B2 (en) | 2017-12-12 | 2021-12-14 | Bigfoot Biomedical, Inc. | Pen cap for medication injection pen having temperature sensor |
| US11464459B2 (en) * | 2017-12-12 | 2022-10-11 | Bigfoot Biomedical, Inc. | User interface for diabetes management systems including flash glucose monitor |
| WO2019118532A1 (en) | 2017-12-12 | 2019-06-20 | Bigfoot Biomedical, Inc. | Medicine injection and disease management systems, devices, and methods |
| US11077243B2 (en) | 2017-12-12 | 2021-08-03 | Bigfoot Biomedical, Inc. | Devices, systems, and methods for estimating active medication from injections |
| US11116899B2 (en) | 2017-12-12 | 2021-09-14 | Bigfoot Biomedical, Inc. | User interface for diabetes management systems and devices |
| US10987464B2 (en) | 2017-12-12 | 2021-04-27 | Bigfoot Biomedical, Inc. | Pen cap for insulin injection pens and associated methods and systems |
| CN111542884B (en) | 2017-12-21 | 2024-03-15 | 益首药物治疗股份公司 | Closed loop control of physiological glucose |
Family Cites Families (37)
| Publication number | Priority date | Publication date | Assignee | Title |
|---|---|---|---|---|
| US4475158A (en) * | 1982-03-15 | 1984-10-02 | University Of Florida | Microprocessor based instrument for detecting shift in basal body temperature in women |
| US4838275A (en) * | 1985-11-29 | 1989-06-13 | Lee Arnold St J | Home medical surveillance system |
| US4731726A (en) * | 1986-05-19 | 1988-03-15 | Healthware Corporation | Patient-operated glucose monitor and diabetes management system |
| US4995402A (en) * | 1988-10-12 | 1991-02-26 | Thorne, Smith, Astill Technologies, Inc. | Medical droplet whole blood and like monitoring |
| US5251126A (en) * | 1990-10-29 | 1993-10-05 | Miles Inc. | Diabetes data analysis and interpretation method |
| FR2691249A1 (en) | 1992-05-12 | 1993-11-19 | Bayer Diagnostics | A method of monitoring a physical quantity, a system suitable for carrying out this method, and compact housing forming part of this system. |
| US20010011224A1 (en) * | 1995-06-07 | 2001-08-02 | Stephen James Brown | Modular microprocessor-based health monitoring system |
| US5307263A (en) * | 1992-11-17 | 1994-04-26 | Raya Systems, Inc. | Modular microprocessor-based health monitoring system |
| US5956501A (en) * | 1997-01-10 | 1999-09-21 | Health Hero Network, Inc. | Disease simulation system and method |
| US5899855A (en) * | 1992-11-17 | 1999-05-04 | Health Hero Network, Inc. | Modular microprocessor-based health monitoring system |
| EP0631137B1 (en) * | 1993-06-25 | 2002-03-20 | Edward W. Stark | Glucose related measurement method and apparatus |
| US5410474A (en) * | 1993-07-27 | 1995-04-25 | Miles Inc. | Buttonless memory system for an electronic measurement device |
| US5536249A (en) * | 1994-03-09 | 1996-07-16 | Visionary Medical Products, Inc. | Pen-type injector with a microprocessor and blood characteristic monitor |
| US5889855A (en) * | 1995-06-06 | 1999-03-30 | Davis; Andrew Boyd | Telephone line access box enclosure |
| US5665215A (en) * | 1995-09-25 | 1997-09-09 | Bayer Corporation | Method and apparatus for making predetermined events with a biosensor |
| US6113537A (en) * | 1996-04-19 | 2000-09-05 | Castano; Jaime A. | Optical method and device for determining blood glucose levels |
| US5772599A (en) * | 1996-05-09 | 1998-06-30 | Albert Einstein Healthcare Network | Apparatus and method for monitoring a system |
| US6071251A (en) * | 1996-12-06 | 2000-06-06 | Abbott Laboratories | Method and apparatus for obtaining blood for diagnostic tests |
| JP3394262B2 (en) * | 1997-02-06 | 2003-04-07 | セラセンス、インク. | Small volume in vitro analyte sensor |
| US6579690B1 (en) * | 1997-12-05 | 2003-06-17 | Therasense, Inc. | Blood analyte monitoring through subcutaneous measurement |
| US6024699A (en) * | 1998-03-13 | 2000-02-15 | Healthware Corporation | Systems, methods and computer program products for monitoring, diagnosing and treating medical conditions of remotely located patients |
| DE19814219A1 (en) * | 1998-03-31 | 1999-10-07 | Roche Diagnostics Gmbh | Insulin medication control procedures |
| US6368272B1 (en) * | 1998-04-10 | 2002-04-09 | Proactive Metabolics Company | Equipment and method for contemporaneous decision supporting metabolic control |
| US6354996B1 (en) * | 1998-04-15 | 2002-03-12 | Braun Gmbh | Body composition analyzer with trend display |
| US6558320B1 (en) * | 2000-01-20 | 2003-05-06 | Medtronic Minimed, Inc. | Handheld personal data assistant (PDA) with a medical device and method of using the same |
| JP2000060803A (en) * | 1998-08-21 | 2000-02-29 | Terumo Corp | Blood sugar level information processing system |
| JP2000074914A (en) * | 1998-09-03 | 2000-03-14 | Casio Comput Co Ltd | Sugar concentration measuring apparatus |
| JP3753869B2 (en) * | 1998-09-03 | 2006-03-08 | セコム株式会社 | Biological information management device |
| US6424847B1 (en) * | 1999-02-25 | 2002-07-23 | Medtronic Minimed, Inc. | Glucose monitor calibration methods |
| US6277071B1 (en) | 1999-06-25 | 2001-08-21 | Delphi Health Systems, Inc. | Chronic disease monitor |
| JP2001245900A (en) * | 2000-03-02 | 2001-09-11 | Arkray Inc | Graph, its indication method and apparatus for its indication |
| US6604050B2 (en) * | 2000-06-16 | 2003-08-05 | Bayer Corporation | System, method and biosensor apparatus for data communications with a personal data assistant |
| US6589229B1 (en) * | 2000-07-31 | 2003-07-08 | Becton, Dickinson And Company | Wearable, self-contained drug infusion device |
| US7022072B2 (en) * | 2001-12-27 | 2006-04-04 | Medtronic Minimed, Inc. | System for monitoring physiological characteristics |
| US20030216628A1 (en) * | 2002-01-28 | 2003-11-20 | Bortz Jonathan David | Methods and systems for assessing glycemic control using predetermined pattern label analysis of blood glucose readings |
| GB2389419B (en) | 2002-06-05 | 2006-02-22 | Diabetes Diagnostics Inc | Analyte testing device |
| CA2466772C (en) * | 2002-09-11 | 2012-08-28 | Becton, Dickinson And Company | Apparatus and method for monitoring blood glucose levels including convenient display of blood glucose value average and constituent values |
-
2003
- 2003-09-10 CA CA2466772A patent/CA2466772C/en not_active Expired - Lifetime
- 2003-09-10 AU AU2003268538A patent/AU2003268538A1/en not_active Abandoned
- 2003-09-10 JP JP2004536144A patent/JP4594731B2/en not_active Expired - Lifetime
- 2003-09-10 ES ES03749508T patent/ES2384558T3/en not_active Expired - Lifetime
- 2003-09-10 US US10/658,209 patent/US7570980B2/en active Active
- 2003-09-10 AT AT03749508T patent/ATE550723T1/en active
- 2003-09-10 EP EP03749508A patent/EP1536729B1/en not_active Expired - Lifetime
- 2003-09-10 WO PCT/US2003/028075 patent/WO2004023972A2/en active Application Filing
-
2009
- 2009-06-03 US US12/457,185 patent/US9192338B2/en active Active
-
2015
- 2015-11-18 US US14/944,786 patent/US9386955B2/en not_active Expired - Lifetime
-
2016
- 2016-05-09 US US15/149,942 patent/US9629588B2/en not_active Expired - Lifetime
Also Published As
| Publication number | Publication date |
|---|---|
| WO2004023972A3 (en) | 2004-06-03 |
| CA2466772A1 (en) | 2004-03-25 |
| US7570980B2 (en) | 2009-08-04 |
| JP2005537889A (en) | 2005-12-15 |
| US20160249865A1 (en) | 2016-09-01 |
| US9629588B2 (en) | 2017-04-25 |
| US20040059201A1 (en) | 2004-03-25 |
| WO2004023972A2 (en) | 2004-03-25 |
| ES2384558T3 (en) | 2012-07-06 |
| US20160066865A1 (en) | 2016-03-10 |
| EP1536729A2 (en) | 2005-06-08 |
| US20090240129A1 (en) | 2009-09-24 |
| EP1536729A4 (en) | 2009-03-18 |
| AU2003268538A1 (en) | 2004-04-30 |
| US9192338B2 (en) | 2015-11-24 |
| ATE550723T1 (en) | 2012-04-15 |
| US9386955B2 (en) | 2016-07-12 |
| AU2003268538A8 (en) | 2004-04-30 |
| JP4594731B2 (en) | 2010-12-08 |
| CA2466772C (en) | 2012-08-28 |
Similar Documents
| Publication | Publication Date | Title |
|---|---|---|
| EP1536729B1 (en) | Monitoring blood glucose including convenient display of measurement values and averages | |
| US11532392B2 (en) | Meter having post-meal test-time alarm | |
| US10019554B2 (en) | Glycemic risk determination based on variability of glucose | |
| CN100354871C (en) | Analystic material inspectnig apparatus | |
| JP5528701B2 (en) | Instrument with multi-level user interface | |
| US10383580B2 (en) | Analysis of glucose median, variability, and hypoglycemia risk for therapy guidance | |
| KR101722417B1 (en) | Analyte testing method and system with high and low blood glucose trends notification | |
| EP2006786B1 (en) | Method and glucose monitoring system for monitoring individual metabolic response and for generating nutritional feedback | |
| US7976467B2 (en) | Method of inputting data into analyte testing device | |
| CN103025242B (en) | Guarantee about average before the meal with the mthods, systems and devices of the statistical power of GLPP difference Message Transmission | |
| CN104470430A (en) | Method and system to indicate hyperglycemia or hypoglycemia for people with diabetes | |
| CN101785701B (en) | The device of information processing, method, equipment and reagent carrier | |
| US20130085682A1 (en) | Memory card usage with blood glucose devices |
Legal Events
| Date | Code | Title | Description |
|---|---|---|---|
| PUAI | Public reference made under article 153(3) epc to a published international application that has entered the european phase |
Free format text: ORIGINAL CODE: 0009012 |
|
| 17P | Request for examination filed |
Effective date: 20041209 |
|
| AK | Designated contracting states |
Kind code of ref document: A2 Designated state(s): AT BE BG CH CY CZ DE DK EE ES FI FR GB GR HU IE IT LI LU MC NL PT RO SE SI SK TR |
|
| AX | Request for extension of the european patent |
Extension state: AL LT LV MK |
|
| DAX | Request for extension of the european patent (deleted) | ||
| A4 | Supplementary search report drawn up and despatched |
Effective date: 20090216 |
|
| RIC1 | Information provided on ipc code assigned before grant |
Ipc: A61B 5/00 20060101AFI20041214BHEP Ipc: G06F 19/00 20060101ALI20090210BHEP Ipc: A61B 5/05 20060101ALI20090210BHEP |
|
| 17Q | First examination report despatched |
Effective date: 20090610 |
|
| RTI1 | Title (correction) |
Free format text: MONITORING BLOOD GLUCOSE INCLUDING CONVENIENT DISPLAY OF MEASUREMENT VALUES AND AVERAGES |
|
| REG | Reference to a national code |
Ref country code: DE Ref legal event code: R079 Ref document number: 60340347 Country of ref document: DE Free format text: PREVIOUS MAIN CLASS: A61B0005000000 Ipc: G06F0019000000 |
|
| GRAP | Despatch of communication of intention to grant a patent |
Free format text: ORIGINAL CODE: EPIDOSNIGR1 |
|
| RIC1 | Information provided on ipc code assigned before grant |
Ipc: A61B 5/145 20060101ALI20110824BHEP Ipc: G06F 19/00 20110101AFI20110824BHEP |
|
| GRAS | Grant fee paid |
Free format text: ORIGINAL CODE: EPIDOSNIGR3 |
|
| GRAA | (expected) grant |
Free format text: ORIGINAL CODE: 0009210 |
|
| AK | Designated contracting states |
Kind code of ref document: B1 Designated state(s): AT BE BG CH CY CZ DE DK EE ES FI FR GB GR HU IE IT LI LU MC NL PT RO SE SI SK TR |
|
| REG | Reference to a national code |
Ref country code: GB Ref legal event code: FG4D |
|
| REG | Reference to a national code |
Ref country code: CH Ref legal event code: EP |
|
| REG | Reference to a national code |
Ref country code: IE Ref legal event code: FG4D |
|
| REG | Reference to a national code |
Ref country code: AT Ref legal event code: REF Ref document number: 550723 Country of ref document: AT Kind code of ref document: T Effective date: 20120415 |
|
| REG | Reference to a national code |
Ref country code: DE Ref legal event code: R096 Ref document number: 60340347 Country of ref document: DE Effective date: 20120516 |
|
| REG | Reference to a national code |
Ref country code: ES Ref legal event code: FG2A Ref document number: 2384558 Country of ref document: ES Kind code of ref document: T3 Effective date: 20120706 |
|
| REG | Reference to a national code |
Ref country code: NL Ref legal event code: VDEP Effective date: 20120321 |
|
| PG25 | Lapsed in a contracting state [announced via postgrant information from national office to epo] |
Ref country code: FI Free format text: LAPSE BECAUSE OF FAILURE TO SUBMIT A TRANSLATION OF THE DESCRIPTION OR TO PAY THE FEE WITHIN THE PRESCRIBED TIME-LIMIT Effective date: 20120321 Ref country code: GR Free format text: LAPSE BECAUSE OF FAILURE TO SUBMIT A TRANSLATION OF THE DESCRIPTION OR TO PAY THE FEE WITHIN THE PRESCRIBED TIME-LIMIT Effective date: 20120622 |
|
| REG | Reference to a national code |
Ref country code: AT Ref legal event code: MK05 Ref document number: 550723 Country of ref document: AT Kind code of ref document: T Effective date: 20120321 |
|
| PG25 | Lapsed in a contracting state [announced via postgrant information from national office to epo] |
Ref country code: CY Free format text: LAPSE BECAUSE OF FAILURE TO SUBMIT A TRANSLATION OF THE DESCRIPTION OR TO PAY THE FEE WITHIN THE PRESCRIBED TIME-LIMIT Effective date: 20120321 |
|
| PG25 | Lapsed in a contracting state [announced via postgrant information from national office to epo] |
Ref country code: SI Free format text: LAPSE BECAUSE OF FAILURE TO SUBMIT A TRANSLATION OF THE DESCRIPTION OR TO PAY THE FEE WITHIN THE PRESCRIBED TIME-LIMIT Effective date: 20120321 Ref country code: CZ Free format text: LAPSE BECAUSE OF FAILURE TO SUBMIT A TRANSLATION OF THE DESCRIPTION OR TO PAY THE FEE WITHIN THE PRESCRIBED TIME-LIMIT Effective date: 20120321 Ref country code: BE Free format text: LAPSE BECAUSE OF FAILURE TO SUBMIT A TRANSLATION OF THE DESCRIPTION OR TO PAY THE FEE WITHIN THE PRESCRIBED TIME-LIMIT Effective date: 20120321 Ref country code: EE Free format text: LAPSE BECAUSE OF FAILURE TO SUBMIT A TRANSLATION OF THE DESCRIPTION OR TO PAY THE FEE WITHIN THE PRESCRIBED TIME-LIMIT Effective date: 20120321 Ref country code: SE Free format text: LAPSE BECAUSE OF FAILURE TO SUBMIT A TRANSLATION OF THE DESCRIPTION OR TO PAY THE FEE WITHIN THE PRESCRIBED TIME-LIMIT Effective date: 20120321 Ref country code: RO Free format text: LAPSE BECAUSE OF FAILURE TO SUBMIT A TRANSLATION OF THE DESCRIPTION OR TO PAY THE FEE WITHIN THE PRESCRIBED TIME-LIMIT Effective date: 20120321 |
|
| PG25 | Lapsed in a contracting state [announced via postgrant information from national office to epo] |
Ref country code: PT Free format text: LAPSE BECAUSE OF FAILURE TO SUBMIT A TRANSLATION OF THE DESCRIPTION OR TO PAY THE FEE WITHIN THE PRESCRIBED TIME-LIMIT Effective date: 20120723 Ref country code: SK Free format text: LAPSE BECAUSE OF FAILURE TO SUBMIT A TRANSLATION OF THE DESCRIPTION OR TO PAY THE FEE WITHIN THE PRESCRIBED TIME-LIMIT Effective date: 20120321 |
|
| PLBI | Opposition filed |
Free format text: ORIGINAL CODE: 0009260 |
|
| PLAX | Notice of opposition and request to file observation + time limit sent |
Free format text: ORIGINAL CODE: EPIDOSNOBS2 |
|
| 26 | Opposition filed |
Opponent name: SANOFI-AVENTIS DEUTSCHLAND GMBH Effective date: 20121221 |
|
| PG25 | Lapsed in a contracting state [announced via postgrant information from national office to epo] |
Ref country code: NL Free format text: LAPSE BECAUSE OF FAILURE TO SUBMIT A TRANSLATION OF THE DESCRIPTION OR TO PAY THE FEE WITHIN THE PRESCRIBED TIME-LIMIT Effective date: 20120321 Ref country code: AT Free format text: LAPSE BECAUSE OF FAILURE TO SUBMIT A TRANSLATION OF THE DESCRIPTION OR TO PAY THE FEE WITHIN THE PRESCRIBED TIME-LIMIT Effective date: 20120321 Ref country code: DK Free format text: LAPSE BECAUSE OF FAILURE TO SUBMIT A TRANSLATION OF THE DESCRIPTION OR TO PAY THE FEE WITHIN THE PRESCRIBED TIME-LIMIT Effective date: 20120321 |
|
| REG | Reference to a national code |
Ref country code: DE Ref legal event code: R026 Ref document number: 60340347 Country of ref document: DE Effective date: 20121221 |
|
| PG25 | Lapsed in a contracting state [announced via postgrant information from national office to epo] |
Ref country code: MC Free format text: LAPSE BECAUSE OF NON-PAYMENT OF DUE FEES Effective date: 20120930 |
|
| REG | Reference to a national code |
Ref country code: CH Ref legal event code: PL |
|
| PLBB | Reply of patent proprietor to notice(s) of opposition received |
Free format text: ORIGINAL CODE: EPIDOSNOBS3 |
|
| REG | Reference to a national code |
Ref country code: IE Ref legal event code: MM4A |
|
| PG25 | Lapsed in a contracting state [announced via postgrant information from national office to epo] |
Ref country code: LI Free format text: LAPSE BECAUSE OF NON-PAYMENT OF DUE FEES Effective date: 20120930 Ref country code: CH Free format text: LAPSE BECAUSE OF NON-PAYMENT OF DUE FEES Effective date: 20120930 Ref country code: BG Free format text: LAPSE BECAUSE OF FAILURE TO SUBMIT A TRANSLATION OF THE DESCRIPTION OR TO PAY THE FEE WITHIN THE PRESCRIBED TIME-LIMIT Effective date: 20120621 Ref country code: IE Free format text: LAPSE BECAUSE OF NON-PAYMENT OF DUE FEES Effective date: 20120910 |
|
| PG25 | Lapsed in a contracting state [announced via postgrant information from national office to epo] |
Ref country code: TR Free format text: LAPSE BECAUSE OF FAILURE TO SUBMIT A TRANSLATION OF THE DESCRIPTION OR TO PAY THE FEE WITHIN THE PRESCRIBED TIME-LIMIT Effective date: 20120321 |
|
| PG25 | Lapsed in a contracting state [announced via postgrant information from national office to epo] |
Ref country code: LU Free format text: LAPSE BECAUSE OF NON-PAYMENT OF DUE FEES Effective date: 20120910 |
|
| PG25 | Lapsed in a contracting state [announced via postgrant information from national office to epo] |
Ref country code: HU Free format text: LAPSE BECAUSE OF FAILURE TO SUBMIT A TRANSLATION OF THE DESCRIPTION OR TO PAY THE FEE WITHIN THE PRESCRIBED TIME-LIMIT Effective date: 20030910 |
|
| REG | Reference to a national code |
Ref country code: DE Ref legal event code: R100 Ref document number: 60340347 Country of ref document: DE |
|
| PLCK | Communication despatched that opposition was rejected |
Free format text: ORIGINAL CODE: EPIDOSNREJ1 |
|
| PLBN | Opposition rejected |
Free format text: ORIGINAL CODE: 0009273 |
|
| STAA | Information on the status of an ep patent application or granted ep patent |
Free format text: STATUS: OPPOSITION REJECTED |
|
| 27O | Opposition rejected |
Effective date: 20150129 |
|
| REG | Reference to a national code |
Ref country code: FR Ref legal event code: PLFP Year of fee payment: 14 |
|
| REG | Reference to a national code |
Ref country code: FR Ref legal event code: PLFP Year of fee payment: 15 |
|
| REG | Reference to a national code |
Ref country code: FR Ref legal event code: PLFP Year of fee payment: 16 |
|
| REG | Reference to a national code |
Ref country code: DE Ref legal event code: R079 Ref document number: 60340347 Country of ref document: DE Free format text: PREVIOUS MAIN CLASS: G06F0019000000 Ipc: G16Z0099000000 |
|
| PGFP | Annual fee paid to national office [announced via postgrant information from national office to epo] |
Ref country code: IT Payment date: 20221122 Year of fee payment: 20 Ref country code: GB Payment date: 20221024 Year of fee payment: 20 Ref country code: FR Payment date: 20221109 Year of fee payment: 20 Ref country code: ES Payment date: 20221115 Year of fee payment: 20 Ref country code: DE Payment date: 20221006 Year of fee payment: 20 |
|
| REG | Reference to a national code |
Ref country code: DE Ref legal event code: R071 Ref document number: 60340347 Country of ref document: DE |
|
| REG | Reference to a national code |
Ref country code: ES Ref legal event code: FD2A Effective date: 20230927 |
|
| REG | Reference to a national code |
Ref country code: GB Ref legal event code: PE20 Expiry date: 20230909 |
|
| PG25 | Lapsed in a contracting state [announced via postgrant information from national office to epo] |
Ref country code: GB Free format text: LAPSE BECAUSE OF EXPIRATION OF PROTECTION Effective date: 20230909 Ref country code: ES Free format text: LAPSE BECAUSE OF EXPIRATION OF PROTECTION Effective date: 20230911 |